 Nadia Pinardi1*
 Johan Stander2
 David M. Legler3
 Kevin O'Brien4,5
 Tim Boyer6,7
 Tom Cuff8
 Pierre Bahurel9
 Mathieu Belbeoch10
 Sergey Belov11
 Shelby Brunner3
 Eugene Burger4,5
 Thierry Carval12
 Denis Chang-Seng13
 Etienne Charpentier14S. Ciliberti15
 Giovanni Coppini15
 Albert Fischer13
 Eric Freeman7,16
 Champika Gallage14
 Hernan Garcia6,7
 Lydia Gates17Zhiqiang Gong18
 Juliet Hermes19
 Emma Heslop13Sarah Grimes14
 Katherine Hill14
 Kevin Horsburgh20
 Athanasia Iona21
 Sebastien Mancini22Neal Moodie23
 Mathieu Ouellet24
 Peter Pissierssens13
 Paul Poli25
 Roger Proctor22
 Neville Smith26Charles Sun6,7
 Val Swail27
 Jonathan Turton28
 Yue Xinyang29
- 1Department of Physics and Astronomy, University of Bologna, Bologna, Italy
- 2South African Weather Service, Pretoria, South Africa
- 3NOAA Climate Program Office, Silver Spring, MD, United States
- 4NOAA, Pacific Marine Environmental Laboratory, Seattle, WA, United States
- 5Joint Institute for the Study of the Atmosphere and Ocean, University of Washington, Seattle, WA, United States
- 6NOAA, National Centers for Environmental Information, Silver Spring, MD, United States
- 7NOAA, National Centers for Environmental Information, Asheville, NC, United States
- 8National Weather Service Organization, Silver Spring, MD, United States
- 9Mercator Ocean, Toulouse, France
- 10JCOMMOPS (WMO/IOC-UNESCO), Brest, France
- 11All Russian Research Institute of Hydrometeorological Information World Data Center, Obninsk, Russia
- 12IFREMER, Brest, France
- 13IOC of UNESCO, Paris, France
- 14WMO, Geneva, Switzerland
- 15CMCC Foundation, Lecce, Italy
- 16Riverside Technology, inc., Fort Collins, CO, United States
- 17Deutscher Wetterdienst, Offenbach, Germany
- 18China Meteorological Administration, Climate Division, Forecasting and Network Department, Beijing, China
- 19South African Environmental Observation Network, Cape Town, South Africa
- 20National Oceanography Center, Liverpool, United Kingdom
- 21Hellenic Center for Marine Research, Athens, Greece
- 22Australian Ocean Data Network, Integrated Marine Observing System, Hobart, TAS, Australia
- 23Bureau of Meteorology, Melbourne, VIC, Australia
- 24Fisheries and Oceans Canada, Ottawa, ON, Canada
- 25Center de Météorologie Marine, Météo-France, Brest, France
- 26GODAE Ocean Services, Canterbury, NSW, Australia
- 27Climate Research Division, Environment and Climate Change Canada, Toronto, ON, Canada
- 28UK Met Office, Exeter, United Kingdom
- 29State Oceanic Administration, National Marine Data and Information Service, Tianjin, China
The WMO-IOC Joint Technical Commission for Oceanography and Marine Meteorology (JCOMM) has devised a coordination mechanism for the fit-for-purpose delivery of an end-to-end system, from ocean observations to met-ocean operational services. This paper offers a complete overview of the activities carried out by JCOMM and the status of the achievements up to 2018. The JCOMM stakeholders consist of the research and operational institutions of WMO members and the IOC member states, which mandated JCOMM to devise an international strategy to move toward the achievement of the United Nations Sustainable Development Goals. The three areas of activity are the Observation Program Area (OPA), the Data Management Program Area (DMPA) and the Services and Forecasting Services Program Area (SFSPA), and several expert teams have been established to contribute to the international coordination efforts. OPA is organized into observing networks connected by different observing technologies, DMPA organizes the overall near-real time and delayed mode data assembly, and the delivery methodology and architecture, and the SFSPA coordinates the met-ocean services resulting from the observations and data management. Future developments should enhance coordination in these three program areas by considering the inclusion of new and emergent observing technologies, the interoperability of met-ocean data assembly centers and the establishment of efficient research to operations protocols, in addition to better fit-for-purpose customized services in both the public and private sectors.
Introduction
The World Meteorological Organization (WMO) and the Intergovernmental Oceanographic Commission of UNESCO (IOC) started the WMO-IOC Joint Technical Commission for Oceanography and Marine Meteorology (JCOMM) in 1999. JCOMM was mandated to enhance coordination between the meteorological and oceanographic communities to support the delivery of ocean forecasts and services, and the efficient design of global climate research programs, such as the Tropical Ocean Global Atmosphere (TOGA) program (McPhaden et al., 2010) and the Global Ocean Observing System (GOOS) (IOC Assembly Resolution XXVI-8, 2011; Task Team for the Integrated Framework for Sustained Ocean Observing, 2012).
The ocean economy is predicted to double by 2030 in terms of value-added products and employment (OECD, 2016) and population expansion and urbanization in coastal regions will increase people's vulnerability to climate change (McGranahan et al., 2007). To address this, JCOMM devised a coordination system that will help to standardize access to met-ocean data and services for the National Meteorological and Hydrological Services (NMHS) and for national oceanographic infrastructures. The system consists of the IOC International Oceanographic Data and Information Exchange (IODE), National Oceanographic Data Centers (NODCs) and the operational ocean forecasting services. JCOMM works at the interface between the WMO members, IOC member states and the research community (Figure 1), coordinating standardized research and operation transition, as required by environmental data services (Serafin et al., 2002; National Research Council, 2003; Shao et al., 2016). WMO members and IOC member states set the requirements of JCOMM activities, and the international community implements the solutions. JCOMM also facilitates the provision of observations to support other WMO and IOC applications, such as numerical weather prediction, climate monitoring, and other ocean services not solely governed via JCOMM.
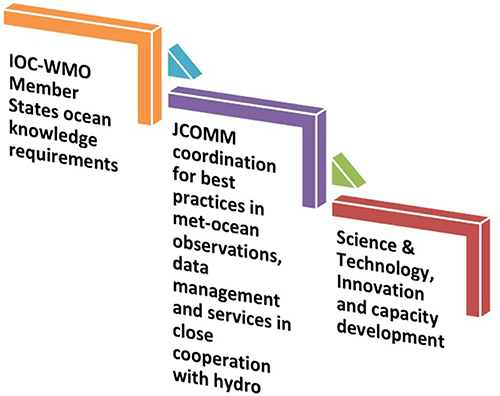
Figure 1. The JCOMM interfaces with two basic sets of stakeholders: first the WMO members and IOC member states, including their national technical institutions, and second the international research community.
In Internet terms, an end-to-end system is a network designed to connect nodes with maximum efficiency and quality. The application of such a principle to users and producers of meteorological and oceanographic information is a complex value chain structure, which is shown in Figure 2. JCOMM considers all the building blocks of the value-added chain, from the collection and distribution of observations in near-real time and delayed mode, the production of generic data products by modeling and data assembly centers, to the further customization of such products so they can be utilized by the final end-users to provide societal benefit. It should be noted that the value-adding chain shown in Figure 2 is not totally governed by JCOMM. The non-ocean and climate related components are governed by other international coordination entities that JCOMM must interface with.
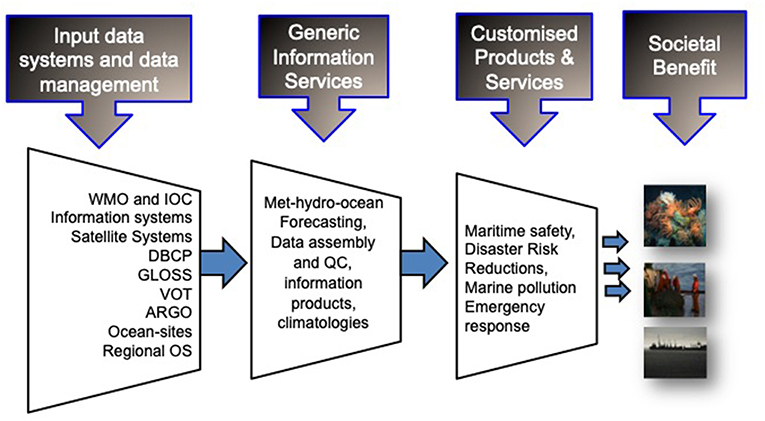
Figure 2. The met-ocean end-to-end system at multiple time and space scales and for multiple users.
The marine meteorology and ocean services generated by the meteorological and oceanographic (operational) centers and by research institutions provide information for a large number of users including governments, emergency responders, industry, navies and the public. JCOMM supports the National Meteorological and Hydrological Services (NHMS), the National Oceanographic Data Centers (NODC) and operational oceanographic services and strives to reach the UN's sustainable development goals (SDGs, Kates et al., 2005). The JCOMM beneficiaries are a complex network of research institutions, meteorological and oceanographic centers, navies, and industry that need international standards for exchanging observations and producing forecasts, to meet the challenges of climate change, coastal resilience, safe maritime transport and a productive and healthy ocean.
In this study we first provide an overview of the approach taken by the JCOMM in its coordination efforts (section The JCOMM Approach). We then examine the four pillars of JCOMM activities: the standardized collection of ocean observations (section Operational Observing Networks and Systems), the networking of data management and data assembly centers (section Data Management Systems, From Near-Real Time to Delayed Mode), the ocean services (section From Monitoring to Services) and capacity building (section Capacity Development). A discussion and conclusions are provided in sections Discussion and Future Foci.
The JCOMM Approach
In most nations of the world, NMHS, NODCs and oceanographic institutions are responsible for the delivery of meteorological and ocean marine products and services. They must consider the whole data information chain, from observations, to data assembly and predictions, to customized products for specific users (Figure 2). This delivery is the aim of the JCOMM international coordination activity, and to achieve it with the maximum interoperability, standardization, and sustainability.
The approach followed by JCOMM in building the international coordination for the met-ocean end-to-end system is summarized in Figure 3. The four building blocks are:
(1) The Member States met-ocean research and operational infrastructure, which is the basis of the WMO and IOC coordination responsibilities;
(2) The delivery of met-ocean products and services related to the WMO and IOC strategic goals, which require standardization and the transition from research to operations;
(3) Stakeholder and end-user assessments organized by JCOMM along with specific user consultation activities to evaluate the fitness for purpose of the service delivery;
(4) The scientific assessment of the status of the networks, which in principle should establish the fitness for use of the observations in the data product and service delivery, thus prompting new research and innovation activities to fill the gaps.
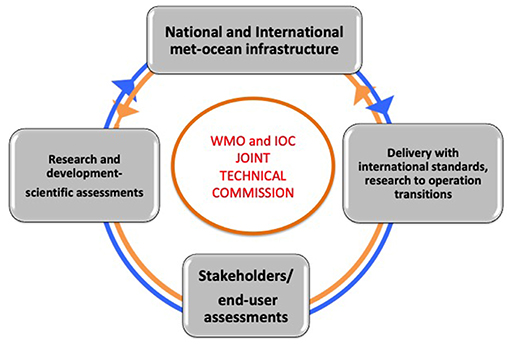
Figure 3. The JCOMM approach. One loop starts from the existing national and international met-ocean infrastructure, then JCOMM coordinates the delivery of products with international standards and the research to operation transitions, helps international end-user assessment and feeds into new research and development activities, which then feeds back into the permanent national infrastructure. The opposite loop starts with JCOMM coordinating the research and development activities out of the national infrastructure needs, activates the large international end-user assessment, and helps to produce best practices and standards for product development that again support the national met-ocean infrastructures.
Since its inception 20 years ago, JCOMM has developed a coordinating structure for the delivery of met-ocean products and services. Over the past 5 years a scientific and stakeholder assessment of the existing coordinating structure has been conducted and will continue in the future.
To achieve its goals, JCOMM has been organized into four focal activity areas of technical expertise, as described in the next section.
The JCOMM Activity Areas
In JCOMM, the end-to-end system (Figure 2) is sub-divided into three program areas and a cross-cutting activity, as shown in Figure 4. These are:
(1) The Observations Program Area (OPA), in which the Observations Coordination Group (OCG) is charged with reviewing, advising on, and coordinating the effective operation of the ocean and marine observing systems and related activities. This group also has the mandate to assess new and emerging technologies and enable their transition into operational networks.
(2) The Data Management Program Area (DMPA), in which the Data Management Coordination Group (DMCG) has the primary objective of reviewing, implementing and maintaining a fully integrated end-to-end data management system across the entire marine meteorology and oceanographic community. Recent work in this area includes metadata management and the implementation of the Marine Climate Data System (MCDS), which can be considered an interface between the WMO Information System (WIS, http://www.wmo.int/pages/prog/www/WIS/) and the future IOC Ocean Data and Information System (ODIS, https://www.iode.org/odis).
(3) The Services and Forecasting System Program Area (SFSPA), in which the Services Coordination Group (SCG) has the mandate to overview and coordinate state-of-the-art globally distributed and inter-connected marine services, including sea ice and emergency responses, natural- and human-induced coastal hazards, and maritime safety.
(4) The cross-cutting area consists of two activities: Capacity Development (CD), whereby JCOMM has progressively implemented a training framework that considers the complete marine weather and oceanographic end-to-end system; and Satellite requirement activities, which focus on setting the requirements of WMO and IOC for the timely collection of remotely sensed met-ocean environmental data.
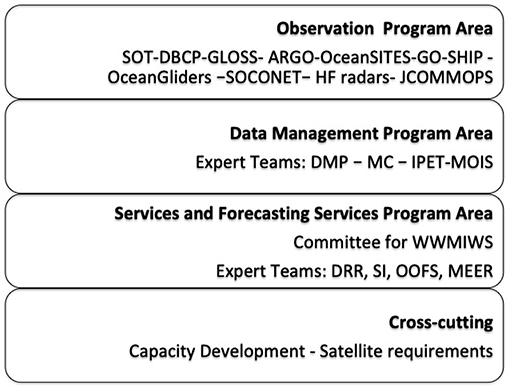
Figure 4. The four JCOMM activity areas. SOT, Ship of Opportunity Team; GO-SHIP, Global Ocean Ship-based Hydrographic Investigations Program; OceanSITES; DBCP, Data Buoy Cooperation Panel; GLOSS, Global Sea Level Observing System; SOCONET, Surface Ocean CO2 Observing Network; Argo, Profiling floats; DMP, Data Management Practices; MC, Marine Climate; IPET-MOIS, Inter Program Expert Team-Meteorology and Oceanography Information System; WWMIWS, Worldwide Met-Ocean Information and Warning Service; DRR, Disaster Risk Reduction; SI, Sea Ice; OOFS, Operational Ocean Forecasting System; MEER, Marine Environmental Emergencies Response.
JCOMM activities have recently been evaluated, and selected conclusions are outlined in the next subsection.
User-Based Surveys
In April-May 2016 the IOC organized the first stakeholder survey on JCOMM performance. The survey was sent to the NMHS, NODCs and oceanographic institutions listed in the IOC and WMO JCOMM contacts and 90 responses were returned. The survey addressed the following areas: experience/familiarity with JCOMM (five major objectives/activities); impact/influence of JCOMM on Met-Ocean Institutions; importance/priority of JCOMM activities; management/coordination and capacity building of JCOMM; benefits of JCOMM; needs and new activities/approaches of JCOMM.
The results showed that 85% of respondents were involved in JCOMM activities for at least the past 5 years, but 40% were not aware of the breadth of topics in the program and the range of objectives. JCOMM was perceived to have a positive impact on NHMS and Oceanographic Institution activities by 35% of respondents. Almost half of the answers confirmed that JCOMM was effective in coordinating the development of an integrated met-ocean system. However, the scores were low in terms of the training offered JCOMM for sharing met-ocean products and services, and it was suggested that JCOMM's role in the global development of tools/training for the local use of met-ocean products and services should be enhanced.
Recommended developments in JCOMM activities included the need for effective stakeholder consultation and less top-down governance, with enhanced inclusive and broader participation by countries and organizations. It was recommended that it should continue with its current activities, while improving its communication strategy and developing new partnerships with the private sector, and other programs.
The second survey was carried out by WMO to assess the perceptions of mariners on whether the Maritime Safety Information (MSI) services provided in the Global Maritime Distress and Safety (GMDSS) network met the user requirements. Overall, the survey demonstrated the importance of delivering wind, wave, sea ice, and visibility information to ships, but it also highlighted inadequate packaging of information, gaps in areas covered by observations, and the need for more wave information, such as swell, in addition to significant wave height and direction.
The outcomes of these initial surveys indicated that JCOMM was recognized as useful by the WMO and IOC stakeholders, but that much more work was needed to further raise awareness and update existing products and services.
Working Practices
The primary governance structure of JCOMM is the management committee (MAN), which makes the strategic decisions regarding the programs and expert teams, evaluates the progress of the activities, and interacts with external groups. The JCOMM MAN consists of the two co-presidents, the IOC and WMO secretariats, the coordinators of the activity areas, and representatives from IODE, GOOS, and the GOOS Regional Alliances. External experts are invited as required, depending on the topic under discussion.
The expert teams (Figure 4) are the technical implementing bodies of the JCOMM strategy, and they can also directly feed back to the JCOMM management on problems and developments. This pyramidal structure, and thus the absence of a common “project-oriented” implementation strategy, was identified as a weakness of the system. In addition, the technical nature of the groups at all levels, from the JCOMM MAN to the expert teams, added to the complexity of making priorities and strategies for these joint activities, beyond their first decades. As discussed in the conclusions, a new structure is now envisaged for the future of JCOMM.
A more detailed analysis of the strengths and weaknesses of the JCOMM effort in general is presented in the discussion section, after we describe the work of the three program areas.
Operational Observing Networks and Systems
Observations Program Area
The JCOMM Observations Program Area (OPA) is appointed with reviewing and coordinating the effective operation of ocean and marine observing systems and related activities. Its focus is on developing synergies across the in situ observing networks, leading to a sustained global ocean observing system that meets research requirements and those of weather, ocean, and climate services, and maximizes opportunities for engaging with new technology and observing networks as they mature.
The Observations Coordination Group (OCG) leads the OPA. It is comprised of representatives of the major global networks involved in observational oceanography and marine meteorology. The OPA has defined the following attributes of a JCOMM ocean observing network, which are consistent with the Framework for Ocean Observing (Task Team for the Integrated Framework for Sustained Ocean Observing, 2012):
• Global in scale: Broader than regional, and if feasible, the intention to be global.
• Sustained observation: Sustained over multiple years, beyond the time-span of single research or experimental projects, by undertaking routine, systematic and essential observations.
• Community of practice: Has an identified community governance structure that provides a means of developing a multi-year strategy, implementation plans and targets, and standards and best practices.
• Delivers data that are free, open, and available in a timely manner: Has a defined data management infrastructure that delivers interoperable and inter-comparable data in real-time and/or with minimal delay after becoming available, through an internationally recognized data center/s and/or standard services, including the WMO Global Telecommunications System (GTS, real-time data), the MCDS (delayed-mode data) and web based services (real-time and delayed-mode data), and operates with a view of encompassing findable, accessible, interoperable and reusable (FAIR) principles (Wilkinson et al., 2016), with at least a minimum (as defined by JCOMMOPS) level of metadata.
• Observes one or more essential ocean variables or essential climate variables: Contributes to meeting requirements through observing one or more of the Global Ocean Observing System (GOOS) Essential Ocean Variables (EOVs) or Global Climate Observing System (GCOS) Essential Climate Variables (ECVs).
• Maintains network mission and targets: A role in the GOOS is defined and progress toward targets can be tracked and progress assessed.
• Develops, updates and follows standards and best practices: To ensure consistent delivery of observational data and encompassing measurement technique, deployment and sampling, reference materials and standards, calibration and validation, data retrieval and formatting, primary quality control and secondary quality control, as appropriate. Ideally these are documented, consistent with other OPA networks, and their use is encouraged.
The OCG works with the following global networks that have met these attributes (Figure 4): ship-based observations (managed by the Ship Observations Team-SOT), moored and drifting buoy observations (managed by the Data Buoy Cooperation Panel-DBCP), tide gauge observations (the Global Sea Level Observing System-GLOSS), Argo float observations (managed by the Argo Steering Team-Argo) and ocean reference stations (OceanSITES). Additional “emerging” networks are developing these attributes and are actively engaging in OPA activities and meetings: OceanGliders, HF Radar, SOCONET (Surface Ocean CO2 Observing Network), and Animal Marine Monitoring.
The OCG ensures all coordinated networks deliver data of known quality through appropriate data systems. Stakeholders include the research community, a range of weather, ocean, and marine service providers (many of whom are represented in JCOMM's parent organizations, the WMO and the IOC), and others who rely on ocean information.
Ocean Observing System Requirements
To communicate and advocate for the development of the ocean observing system, requirements are developed through a number of forums to ensure that the full range of stakeholders and implementers of ocean observations are engaged.
The JCOMM OPA works primarily with the GCOS-GOOS-WCRP Ocean Observation Physics and Climate panel (OOPC) on setting the requirements for observations for climate applications. The OPA does not itself set requirements but contributes toward a requirement-setting iterative process, which considers the costs and feasibility of observations vs. their value or impact. To enable the consistent communication of requirements for observations, Essential Ocean Variable (EOV) specification sheets have been developed by the GOOS panels (OOPC, Biogeochemistry, and Biology and Ecosystem) to specify the requirements for the observation of a variable, its applications, the processes/phenomena that need to be captured, and how the observations of variables come together to meet these requirements. This was initiated by the OOPC for climate and operational services requirements and will enable the eventual evaluation of the observing system by each variable.
The OPA also engages with the WMO Rolling Review of Requirements (RRR) process, which compiles the requirements for the various WMO application areas by variable in terms of five criteria: horizontal resolution, vertical resolution, observing cycle, timeliness, and uncertainty. The WMO Observing Systems Capabilities Analysis and Review tool (OSCAR/Requirements) provides a record of observational user requirements formulated by WMO and various co-sponsored programs, such as GCOS, GOOS, and WCRP. The requirements are regularly reviewed by groups of experts nominated by these programs, although a systematic approach is still lacking.
Coordination, Development, and Integration of Observing Systems
The OPA assesses ocean observing enterprises and approaches and engages emerging and transitional observational networks that meet the aforementioned attributes of a JCOMM network as they mature and become ready for sustained operations. Developing guidance and monitoring the transitions of such capabilities into the sustained observing system will also become an important set of processes and products. The OPA also supports assessments/studies that consider the mix of platforms/technologies to best meet JCOMM requirements (e.g., SOCONET, Sabine et al., 2010). Changes in sensors and platforms, improved satellite capabilities and coverage, and shifts in the use of platforms (particularly from research ships, due to the high cost with respect to autonomous vehicles) are evolving due to technological advances and economies. This will require the OPA to coordinate strategic changes to the observing systems and manage transitions over time.
The OPA will also work to address new frontiers (e.g., Arctic, the deep ocean) that are presently poorly observed and bring about system improvements through regionally focused observing pilots (e.g., TPOS-2020; Cravatte et al., 2016). The OPA will also work with other JCOMM program areas to address the increased demand for information products and new services, such as for climate trends (Figure 5). It will work with service providers to encourage observing/service pilot activities to address ongoing and new needs.
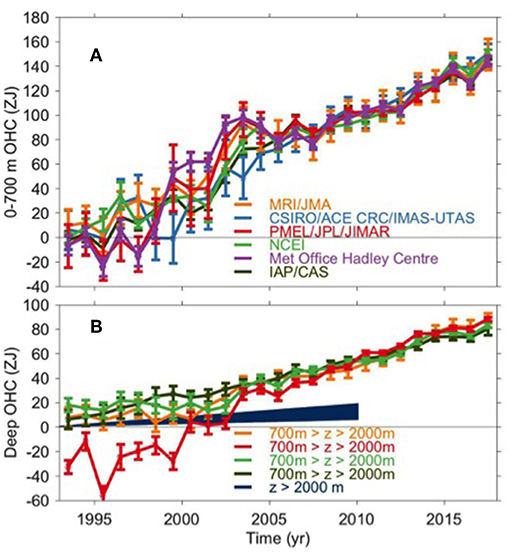
Figure 5. (A) Annual average global integrals of in situ estimates of upper (0–700 m) Ocean Heat Content Anomaly (OHCA) (ZJ; 1 ZJ = 1,021 J) for 1993–2017 with standard errors of the mean from six different analyses. See Johnson et al. (2014) for details on uncertainties, methods, and datasets. For comparison, all estimates have been individually offset (vertically on the plot), first to their individual 2005–17 means (the best sampled time period), and then to their collective 1993 mean. (B) Annual average global integrals of in situ estimates of intermediate (700–2,000 m) OHCA for 1993–2017 with standard errors of the mean, and a long-term trend with one standard error uncertainty shown from 1992 to 2010 for deep and abyssal (z > 2,000 m) OHCA following Purkey and Johnson (2010) but updated using all repeat hydrographic section data available from https://cchdo.ucsd.edu/ as of Jan 2018 (Johnson, 2018).
Observing System Reporting, Metrics, and JCOMMOPS
The OPA is working with OOPC, GOOS, and the JCOMM networks to develop network specification sheets to document the role of components of the observing system, highlight interdependencies, missions, and to set targets for implementation. JCOMM networks are developing Key Performance Indicators (KPIs), in line with their mission targets to more easily track progress, such as identifying challenges/risks and reporting the state of the global ocean observing system to a broader set of stakeholders. System metrics beyond KPIs have demonstrated value in managing the observing system (e.g., coordinating deployment opportunities, identifying geographical observing gaps, and data flow). Additional metrics, to be aligned for future use by stakeholders (e.g., researchers, forecasters, and others), are also under consideration and development.
The JCOMM in situ Observations Program Support Center (JCOMMOPS—www.jcommops.org) was established in 2001 and it provides a focal point of technical coordination across the ocean observing networks, encourages timely reporting and the conveyance of data and metadata, and develops appropriate tools for monitoring the status and reporting of the observing system. JCOMMOPS functions are critical for the integrative development, operations, tracking, and monitoring of the global system.
In the recent years, JCOMMOPS has developed a new generation of Information System with an integrated metadata management and web applications. It has developed KPI to track network status and anticipated gaps. It gained enhanced responsibilities with JCOMM fifth session (e.g., allocation of unique identifiers for all met ocean platforms, production of WIGOS compliant metadata through WMO). In 2018 JCOMMOPS was reviewed through an independent team to identify strengths and challenges of the structure, and prepare its future through the development of a strategy plan.
A major JCOMMOPS deliverable, the JCOMM Ocean Observing System Report Card, takes full advantage of the development of new metrics. The first issue, distributed in 2017, was to inform major stakeholders and sponsors about the observing system. The 2018 version included more information on the status and projections of satellite systems, and an initial assessment of the health of the in situ observing networks. Future versions will provide an annual snapshot of system health, highlight developments and areas of concern, and could be expanded to include reports on regional networks and pilot projects (Figure 6).
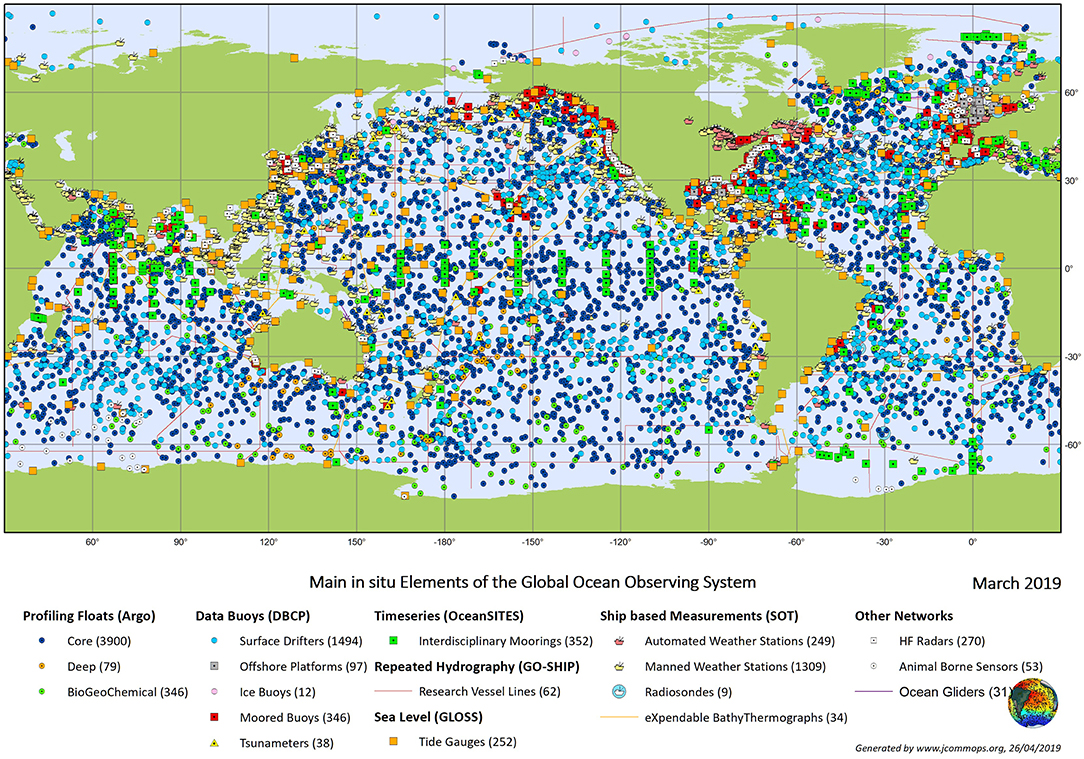
Figure 6. Locations of JCOMM global ocean observing system platforms from the https://www.jcommops.org, where all the symbols are explained.
Observing System Standards and Best Practices
Ocean Observation best practices are procedures and/or processes that have been shown by experience to produce reliable, efficient, accurate, and replicable results, and that are established or proposed as a reference technique or process suitable for widespread adoption. The OPA goal is to provide a standards and best practices framework to ensure the standardization of data collection protocols and the traceability of ocean data, so that the quality of the observing systems and resulting data are maintained at the highest possible levels.
Many JCOMM platforms are based on community practices, and have evolved to develop best practices. Although they may be widely accepted, they have not all undergone a documented review process. Data collection activities are often oriented around a range of instruments, hence measurements of the same variable are often made from different instruments with varying characteristics. Those, such as climatologists who use this data for products that involve all measurements find that many different programs must be consulted. One focus of the OPA Standards and Best Practices is to work toward consistency across the best practices around EOVs.
The OPA vision and strategy for observing system standards and best practices includes the following goals and activities:
• Identify, coordinate, and promote the development and use of standards and best practices across all areas of ocean observing and marine meteorological platforms of JCOMM, and all partner networks and activities;
• Develop a strategy to update these important resources;
• Create a publication or endorsement method through WMO regulatory and guidance materials (such as manuals and guides of GOS, CIMO, and WIGOS), IOC guides, and/or JCOMM technical reports, and peer-reviewed journal publications to communicate those best practices not currently disseminated;
• Support the development of best practices for new observing technologies, drawing from experienced networks;
• Make recommendations to JCOMM OPA for future actions to address these needs; and
• Work toward consistency across best practices for EOVs.
The OPA standards and best practices vision is already being addressed, with two initial foci: (1) a JCOMM network focus; and (2) the integration of JCOMM standards and best practices within a larger set of systems (e.g., IODE Ocean Best Practices, Pearlman et al., 2019) and improved organization of, and access to, this information (Hermes et al., 2018).
Near-Real Time Ocean Data Acquisition and Distribution
Importance of Real-Time Observations
Much of the ocean information collected as part of the ocean observing system has a very high value in near real-time. These data, and their near real-time dissemination, are critical for ocean and weather prediction, disaster response and climate monitoring, detection, and mitigation, i.e., for the end-to-end met-ocean system. In resource-limited environments, such as ocean research, it is essential to continually evaluate and implement workflows, which improve the efficiency and effectiveness of overall investments. One way to increase the impact of observations is to ensure that when possible, data have been at least minimally quality controlled and also are distributed in a timely fashion as possible.
Unfortunately, for many years ocean and marine meteorological data has faced barriers to near-real time distribution beyond the WMO system. The GTS (http://www.wmo.int/pages/prog/www/TEM/GTS/index_en.html) has been the distribution mechanism of choice for global time-critical weather information, which also allows for near real-time distribution. WMO (2017c) defines the GTS as: “The coordinated global system of telecommunication facilities and arrangements for the rapid collection, exchange and distribution of observations and processed information within the framework of the World Weather Watch.” The GTS has been an effective method of distributing both land-based and marine weather observations to all NMHS. However, the research community has faced difficulties in trying to mirror the weather world by utilizing the GTS for real-time data distribution. Limited connectivity to GTS endpoints, the use of standard WMO data formats (such as the Binary Uniform Form (BUFR) for the representation of meteorological data), and research-project technical maturity levels have limited the amount of global ocean data that is available in near-real time. Furthermore, for many years it has not been in the culture of research to make oceanographic data widely available in near real-time. Networks, such as Argo and drifting and moored buoys under DBCP have overcome this barrier because they incorporate real-time data transmission systems in their observing platforms. However, there remains a wealth of ocean data that is not being distributed in real-time, as only a small number of national met services have established links with their national oceanographic institutes to facilitate the delivery of their data to the GTS. For example, there are many tide gauges that are not reporting their data to the GTS.
In an attempt to bridge this gap, the JCOMM OCG undertook a pilot project designed to make it easier for research institutions to distribute and access data using the GTS. The ocean data community has begun to embrace widely used standards and conventions, such as the climate and forecast (CF) metadata conventions (http://cfconventions.org/), NetCDF binary file format (https://www.unidata.ucar.edu/software/netcdf/), and distributed data service protocols, such as the Data Access Protocol (DAP) (https://cdn.earthdata.nasa.gov/conduit/upload/512/ESE-RFC-004v1.1.pdf). By leveraging these services and conventions, it should be possible to create a simplified workflow that would provide data producers with an easier path for distributing their data to the real-time community.
The pilot project, aptly named “Open Access to GTS” (Figure 7), identified and utilized a dozen platforms whose data would not otherwise have been placed onto the GTS. These included well-known platforms, such as ocean moorings and sailing vessels, and new platforms, such as Saildrone (https://www.saildrone.com/). In all cases we were able to leverage a simple workflow incorporating the widely used science data formats of ASCII and NetCDF, and the ERDDAP data platform (Simons, 2017). The use of ERDDAP allowed a National Data center in the US, the National Data Buoy Center (NDBC), to harvest the data collected from the various platforms. Once harvested through machine-to-machine services, the data was encoded by NDBC into BUFR, using the appropriate template, and distributed globally via the GTS. Among the many benefits of this workflow was the important advantage that the scientists and data providers were not required to understand the BUFR format, and only needed to make their data available through the ERDDAP distributed data service.
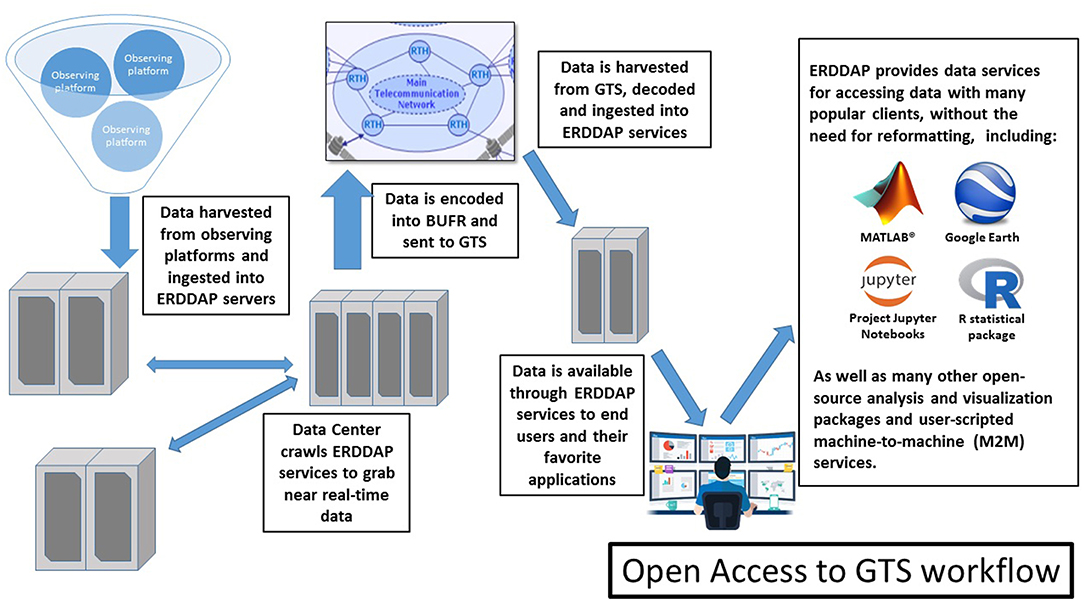
Figure 7. The Open Access to GTS workflow developed for the JCOMM OCG Pilot Project. Symbols are defined in the Table of acronyms.
By leveraging such modern data services and conventions, it was also possible to provide access to this data beyond the distribution arc of the GTS. Although data submission to the GTS by the wider oceanographic community is strictly regulated, accessing GTS data for them is challenging. In the JCOMM OCG pilot the same data platform, ERDDAP, was used to provide access to the wider observations that are distributed on the GTS. This allows any user, regardless of their technical background, to access near-real time data from any of the 4,000+ platforms currently reporting in the global oceans. This data is available for all without the burden of decoding BUFR, and users are able to use the data through any software client they are familiar with. There is no need to download, reformat, or chase down BUFR code tables. In addition, as the data is available through ERDDAP web services, it is much easier for traditional data systems to retrieve the data and ingest it into their products.
As the GTS distribution mechanism was established to support operational forecasting there are of course strict guidelines regarding what can be sent via the GTS and how. Although the JCOMM OCG pilot project was a demonstrable success, it is imperative to define a strategy for the wider implementation of this project. The JCOMM OCG has undertaken the task of developing an Open Access GTS strategy to ensure issues, such as data duplication and the national sensitivity of data are addressed. However, reducing the burden of requirements for GTS data distribution can clearly be accomplished using current technology and standards to provide an easier path for near real-time data distribution. The challenge is not a technical one but cultural, which must be addressed in the future to improve data availability.
This need to embrace modern data formats and distributed services is also reflected in the evolution of the WIS, as it develops to meet the current and future demands of data interoperability.
Evolution of the WMO Information System
As noted above, the WMO GTS has been successful in meeting its primary objective of the cost-effective dissemination of meteorological information in near-real time (https://wiswiki.wmo.int/tiki-index.php?page=ManualGTS). As the GTS was conceived, developed and implemented in a period where teletype communication was the norm some of the protocols, standards, and capabilities of the system evolved to meet the needs of the modern era. However, the full advantages of modern IT technologies have not always been allowed for in this evolution. While the GTS is well-managed, reliable and effective, it is also limited in capability and complexity and has restricted access.
To address the shortcomings of the GTS and to expand the data services offered by the WMO, the WIS offers three services areas (http://www.wmo.int/pages/prog/www/WIS/overview.html):
1. A routine collection and dissemination service for time-critical and operation-critical data and products.
2. A data discovery, access, and retrieval service.
3. A timely delivery service for data and products.
While the first service area will incorporate the GTS, the third expands the GTS offering through the utilization of public networks, such as the Internet. It is this service area that has the potential to provide greater access to WMO data services.
The WIS does present a unique opportunity to increase the dissemination of marine observations and modeling data toward operational forecast use. The key to meeting this goal is to ensure the certification of oceanographic data centers as data providers to the WIS. The WIS should also adapt data transmission message standards to accommodate new platforms used in the oceanographic community.
The WIS has the potential to provide greater access to near real-time data without the procedural overhead now imposed by the GTS. The second service area listed above should address this need, and the WIS and its task teams must ensure the provision of adequate mechanisms for accessing these modern data services. The development of WIS 2.0 (the upgrade of WIS by 2030) will contribute to new and modern data access and dissemination services beyond GTS using cloud technologies.
Improved Workflows for End-to-End Systems
The early steps of a workflow (telecommunication, quality assurance, and communication) are usually the responsibility of the owner of the platform/instrument. JCOMM and other relevant bodies and initiatives, such as the OBP project, strive to standardize these steps and to facilitate efficient pathways from instrument/platform to databases. The workflow for ocean data is at its most intense during this period: many applications are run in real-time and demand rapid processing steps from the point of measurement to the point of use (assimilation, analysis, and monitoring).
The workflow must accommodate high-volume data streams, but often with repeated and similar characteristics (e.g., satellites), and at relatively low volume with more individual characteristics (e.g., surface data buoys). The users require a workflow that is efficient and timely, irrespective of the source, and standardized for ease of use.
Multiple concurrent usage, often in high-impact systems (e.g., weather prediction, safety, risk management, hazards), means the data value is at its peak. In contrast, the arrival of some data is delayed and is only used off-line, while yet other data may be subject to constraints (e.g., proprietary use) and may never move beyond a single user into the general data system. This is wasteful and inefficient.
The workflow for ocean data is open-ended. Reprocessing for reanalysis is now commonplace, to take advantage of knowledge that was not available in real-time, and/or to exploit improved techniques. Such reprocessing may occur multiple times. The added value of reprocessing can be compromised if the associated data processes do not provide clear details about how the data were re-processed, or how it is improved (or different) from earlier versions, and if they are not accompanied by adequate metadata/information to allow users to distinguish between differing versions.
A data system that contains different levels of data, from engineering units through to quality-controlled observations, presents significant challenges both to the workflow and to users: which is best for their application? How easy is it to decide and access the data? Does the user need to consider different formats and standards? The architecture of the system, its workflow, and its efficiency are all important factors.
Complexity does impact efficiency and, perhaps just as importantly, uptake on the provider side and utility on the user side. In reality there are multiple manifestations of such workflows, all aimed at similar outcomes but with slightly different assumptions and implementations, and often with different spatial-temporal windows and variables. As with ocean and climate models, such diversity can be a good thing, but it also comes with risks in terms of the efficiency and integrity of the database as a whole.
In summary, the explosion in observing technology over the last decade has exposed weaknesses in current global data management practices. The ever-increasing number of sensors and the volume of data they are producing demonstrates a need for improved data acquisition and distribution systems to meet the current and future needs of users, which equally applies to near-real time, delayed mode, and reprocessed data. However, technological advances and the embracing of standards and conventions by science communities provide opportunities to successfully meet these challenges.
Data Management Systems, From Near-Real Time to Delayed Mode
The Met-Ocean Data Management System
The JCOMM data management system is jointly organized by IOC's IODE (International Oceanographic Data and Information Exchange) program and the JCOMM Data Management Coordination Group (DMCG), and the existing marine meteorology data management programs in WMO are considered. The DMCG's mission is to maintain a data management plan that identifies, assesses, and specifies priorities of activities relevant to both near-real time and delayed mode marine meteorological and oceanographic data management. Expert teams and pilot projects review, assess, and coordinate appropriate new approaches, standards and best practices, methods, and tools.
Since 1961, IODE has coordinated a network of national oceanographic data centers (NODCs), and since 2013 associated data units (ADUs) and global data assembly centers (GDACs). These centers form the structural elements of IODE and JCOMM for data management, which provide access and stewardship for the national resources of oceanographic data. This requires the gathering, quality control, processing, summarizing, dissemination, exchange, and preservation of data generated by national and international agencies. National institutions (such as navies, universities, fishery agencies, government research bodies, and industry) and programs and projects collect oceanographic data. This wealth of data can be complementary to that collected and archived by the coordinated global and regional programs of JCOMM OPA described in the previous section. NODCs and ADUs often manage more data types than those of interest to JCOMM.
IODE structural elements are organized into networks and projects (ODIN) at regional and thematic levels. Examples of such network and projects are the pan-European Infrastructure for Ocean and Marine Data Management (SeaDataNet, https://www.seadatanet.org/), the Ocean Data and Information Network for Africa (ODIN-Africa, http://www.odinafrica.org/), and the IODE Ocean Data Portal (ODP, http://www.oceandataportal.org/), which provide access to more than 100 IODE data centers worldwide.
Recently the IOC decided to undertake the development of its Ocean Data and Information System (ODIS), which will initially offer an inventory of existing online data and information sources (ODISCat: http://catalogue.odis.org). The system will considerably increase the discoverability of data and information, but more importantly, also of products and services, particularly those relevant to SDGs. The structural IODE units make available physical, chemical, and biological (including biogeographic) data and information that are the basis of at least SDG goals 13 and 14: NODCs are traditionally archiving facilities for climate trend assessment from in situ observations and ADU/GDACs collect and make available biogeochemical data that are fundamental to the sustainable use of marine resources. ODIS will make all these data assembling facilities more visible and discoverable.
Another very important action that is being promoted by IODE, GOOS, and JCOMM data management is the Ocean Best Practices System (OBP, http://www.oceanbestpractices.org) that aims to provide the ocean research, observing, and application communities with a mechanism to discover, review, agree upon, adopt, and support the widest possible dissemination of ocean best practices (see the paper by Pearlman et al., 2019, this issue). This is the most important activity for the JCOMM end-to-end system, because the capacity development of data access and dissemination for IOC member states and WMO members will be based on it.
While the real time data flow has been described in section Near-Real Time Ocean Data Acquisition and Distribution, here we describe the delayed mode data flow developed by JCOMM, so-called Marine Climate Data System. Both data flows, the near real time and the MCDS, are essential in the structure of ODIS. Near real time data should be converted into high quality climate data sets by enhanced quality control and they should contribute to the IODE structural elements as well as the MCDS. Furthermore, the near-real time data management system, as described in section Near-Real Time Ocean Data Acquisition and Distribution, should be the main link between DMPA and OPA network activities.
The Marine Climate Data System
Purpose and Structure of MCDS
Delayed mode and quality-controlled ocean data are the cornerstone of earth climate monitoring, as they are the basis for the estimation of deep ocean trends. The air-sea and ice-sea-atmosphere interface is a critical subcomponent of the earth's climate and it requires the assembly of observations at the marine surface that are collected by very different sensors. The MCDS has been developed to produce highly quality controlled marine meteorological and oceanographic data sets that can fulfill the IOC and WMO requirements for climate long-term series observations.
The purpose of the Marine Climate Data System (MCDS, http://www.iode.org/mcds) is essentially to enable the provision, on a free and unrestricted basis, of consistent, coherent, discoverable, and documented marine meteorological and oceanographic climate data sets of known quality to address the needs of WMO and IOC applications. Such applications include long-term climate monitoring (Global Climate Observing System—GCOS; https://public.wmo.int/en/programmes/global-climate-observing-system), seasonal to inter-annual climate forecasts, and climate services. A critical function of the MCDS is to compile added-value and variable-based products, including essential ocean variables (EOVs; Task Team for the Integrated Framework for Sustained Ocean Observing, 2012) and relevant essential climate variables (ECVs; Bojinski et al., 2014). Other functions include the provision of added value bias-corrected data-sets.
This system is expected to improve the timescales for met-ocean climate data availability and facilitate the exchange of historical met-ocean climate data sets between countries, thereby increasing the amount of ocean observations eventually made available to the relevant end user applications. Furthermore, integrated data and metadata will be available that contains comprehensive dataset information, such as historic details on current and past data codes and formats.
The MCDS data flow is based on a three-tier structure (Figure 8) of Data Acquisition Centers (DAC), Global Data Assembly Centers (GDAC) and Centers for Marine-Meteorological and Oceanographic Climate data (CMOC) that standardize data flows from operators to end users. The general structure coordinates data flow through different levels of the MCDS providing a traceable and robust flow of data of known quality:
• DAC is the basic level of the MCDS and receives data directly from the measurement source, applies basic quality/duplicate checks, and forwards the data to an associated GDAC. The definition of this type of center encompasses several of the IODE structural elements, including the NODC and ADU;
• GDACs combine the streams of associated DACs to produce a global aggregation for a specific observation system, apply further quality/duplicate checks, and provide the data to an associated CMOC;
• CMOCs collect data from GDACs, aggregate all the relevant data types for a specific set of environmental variables, and produce integrated datasets and products for end users.
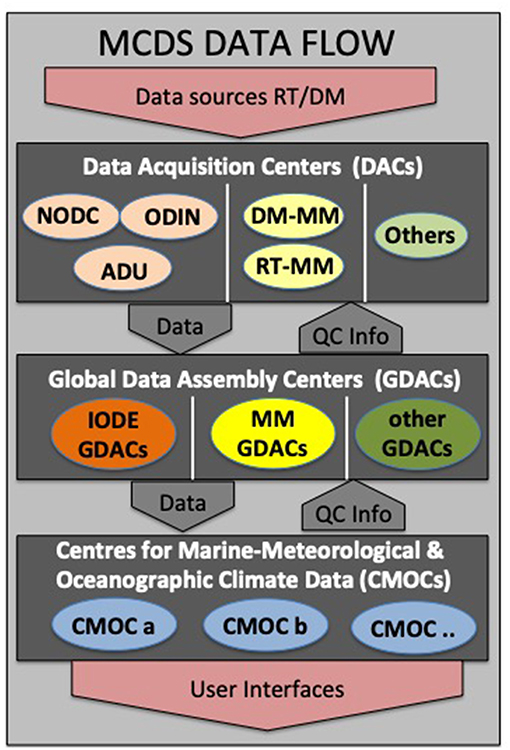
Figure 8. Data flow through the Marine Climate Data System (from WMO, 2017b). RT is real-time data; DM is delayed-mode data; MM is Marine Meteorology. The DAC type of center, defined by the WMO Marine Meteorology community encompasses several of the IODE structural elements, such as the NODC and ADU.
Each center in the MCDS data flow is responsible for the completeness and consistency of the data they acquire and to provide it to other centers within the MCDS or to end users. This provides an efficient mechanism for routinely collecting, processing, and delivering high quality data with known quality control procedures and documented processing details of ocean data to various users. The terms of reference for the MCDS Centers is provided in the Manual WMO (2017a) and the Guide WMO (2017b) on Marine Meteorological Services. The harmonization of standards and nomenclature between MCDS and IODE structural elements has not yet been fully achieved, and is the goal for future collaborative work between IOC and WMO. Furthermore, the integration of the IODE networks in MCDS is still to be clarified.
Present Status of the MCDS
The aim of the MCDS is to implement the described structure for about ten ocean data areas and respective CMOCs. The two areas of surface drifters and ocean profile data are in the process of being implemented. A third, surface and marine meteorology data, is planned and will be built on existing legacy structures.
CMOC-China (http://www.cmoc-china.cn), operated by the National Marine Data and Information Service (NMDIS), was the first CMOC to be provisionally accepted into the MCDS in 2012, and then formally in 2015. While CMOC-China has wide-ranging activities, its contribution to the MCDS will focus on surface velocity products, essentially based on integrating data and metadata from Lagrangian drifters and constructing relevant data products. While the drifting buoy GDACs (see below) communicate well amongst themselves, coherent and well planned tools for disseminating and utilizing the surface velocity data will be of benefit, which will enhance the utility of the data for climate and environmental studies using the buoy trajectory information, and recorded environmental variables. CMOC China will also be involved in other activities, such as ocean observing platform metadata integration, and data rescue focusing on the Asia Pacific region.
Two GDACs for drifting buoys have been established, led by “Fisheries and Oceans Canada” and Coriolis (a French organization including Météo-France and Ifremer). Both GDACs also perform the function of DACs. The main data source consists of data circulated on the Global Telecommunication System (GTS) of WMO. Both GDACs routinely compare GTS bulletin headings and the data volume received and are able to make data available to requesters (Canada: through an offline form request system, France: through the Copernicus Marine Environment Monitoring Service). A public FTP server distributing data and metadata using one NetCDF file per buoy is under construction.
The World Ocean Database (WOD; https://www.nodc.noaa.gov/OC5/WOD/pr_wod.html, Boyer et al., 2013, also available through http://wod.iode.org) was endorsed as a CMOC for ocean profile data in 2017. The WOD is a database operated from the U.S. National Centers for Environmental Information (NCEI) and is also a project of the IOC International Oceanographic Data and Information Exchange (IODE). The WOD aggregates historic and recent subsurface ocean profile EOVs. The WOD role as CMOC is to provide all available ocean profile data in a uniform way to the public through both machine-to-machine discovery and individual discovery and download. As a CMOC, the WOD can flexibly prepare metadata and discovery options, which feed into the WIS and ODIS systems for dissemination with other types of ocean and marine meteorological data.
Several ocean profile GDACs will in the future provide the infrastructure for collecting the most up-to-date and highest quality and resolution ocean profile data, integrate the near real-time data streams with historical (delayed-mode) data, and deliver the integrated data sets to relevant CMOCs for further products developments. Near real-time ocean profile data are those made available within 48 h, often at less than full resolution and without full quality control/calibration. Delayed-mode data are those made available after 48 h, and often much after, usually with full quality control and calibration. Another key role for the ocean profile GDACs is to coordinate activities among all participating relevant DACs, to standardize quality control procedures (IOC, 1993). Ocean profile GDACs include, but are not limited to, Argo (http://www.argo.ucsd.edu/Argo_Project_Office.html; Jayne et al., 2017), CLIVAR and Carbon Hydrographic Data Office (CCHDO; https://cchdo.ucsd.edu/), and the Global Temperature and Salinity Profile Program (GTSPP; https://www.nodc.noaa.gov/GTSPP/) for ocean temperature and salinity profiles.
Building the MCDS
The governance for defining the designation procedure, function, and evaluation process for MCDS centers (i.e., DACs, GDACs, and CMOCs) is recommended by JCOMM and adopted by both the WMO and IOC governing bodies. The host of a candidate MCDS center is required to produce a statement of compliance with requirements and commitments, and to list and demonstrate the capabilities of the proposed center, state the scope of the data and/or products managed, and formally commit to hosting the center in line with its specific terms of reference. A committee comprised of at least three members then evaluates the statement of compliance and a unanimous decision is required for approval.
The detailed designation and evaluation process for the DACs and GDACs is provided in WMO (2017a), while WMO (2017b) provides this for the CMOCs.
Based on its terms of reference, and particularly the standards and procedures regarding the overall collection, management, exchanging, and archiving of high-quality marine meteorological and oceanographic data, information and products, JCOMM in collaboration with the IODE will further monitor the implementation status of MCDS through evaluating the efficiency of the network, including the operation of DACs, GDACs, and CMOCs. The CMOCs must provide the high level functions of the MCDS and make products available to end users, so it is essential that the flow of marine meteorological and other appropriate oceanographic data is ensured through the diversity of data sources, whether real-time or delayed mode, to the CMOCs. This data flow is ensured through oversight and regulation with the MCDS, provided by JCOMM and IODE. In addition, JCOMM will work to establish new centers to cover a wider spectrum of oceanographic and marine meteorological observing platform types. Currently, the JCOMM Expert Team on Marine Climatology (ETMC) and the JCOMM-IODE Expert Team on Data Management Practices (ETDMP) is responsible for the oversight, regulation, and additions to the MCDS. Active coordination between these teams and between the teams and the elements of the MCDS is essential for the maintenance and growth of the MCDS. More accessible documentation and outreach from the expert teams will also encourage the awareness of and participation in the MCDS.
One of the initial goals of the MCDS was to modernize and expand the existing Marine Climatological Summaries Scheme (MCSS) established in 1964 by WMO. Marine climatology then only consisted of data collected by the Ship Observation Team, which includes the traditional Voluntary Observing Ships (VOS) and Ships Of Opportunity Program (SOOP). The initial system was built around several VOS DACs responsible for collecting VOS data in delayed mode from recruited vessels, and for forwarding those data to two GDACs that applied minimum quality control standards and conducted duplicate removal. The GDACs apply additional reformatting where needed, along with additional metadata. The two VOS GDACs operate in parallel and provide mirroring services to avoid loss due to technological failures. The critical updates of the MCSS to the MCDS maintain data flow through the system and insert the global functionality of the CMOC. Currently there is no CMOC that can function as a repository for the VOS data, but the International Comprehensive Ocean-Atmosphere Data Set (ICOADS) is considering fulfilling a CMOC role and will collect the VOS data from the VOS GDACs together with other marine meteorological data sources.
From Monitoring to Services
The JCOMM value adding chain (Figure 2) requires international coordination for operational weather and oceanographic forecasting and the development of targeted applications, notably for maritime transport and fisheries, and for the coastal communities.
Improvements in numerical weather prediction through better data assimilation, improved algorithms, and increased spatial resolution, have been facilitated by advancements in supercomputing techniques and capacity (Bauer et al., 2015). Operational oceanographic services have also been developed, such as the Copernicus Marine Environment Monitoring Service (CMEMS) (Le Traon et al., 2019, this issue), producing high-resolution, short-term, and accurate forecasts of up to 10 days for global and regional wave and currents, temperature, sea level, and salinity, together with long term reconstructions of the ocean state over several decades. The broader operational use of ensembles and the transition to fully combined ocean, air, and cryosphere models will further improve numerical weather and ocean guidance. Hydrological forecasting is lagging behind, but this is soon to be addressed by new activities at WMO and IOC. As we develop and operationalize a total earth systems prediction capability in the coming decade we will bridge the gap between atmosphere and ocean weather and climate predictions, enabling us to predict across weather, sub-seasonal, seasonal, annual, and decadal time scales. To achieve these goals, JCOMM has collaborated with research networks, such as the Global Ocean Data Assimilation Experiment (GODAE, https://www.godae-oceanview.org/science/ocean-forecasting-systems/) and the WMO Global Data-Processing and Forecasting System (GDPFS, http://www.wmo.int/pages/prog/www/DPS/gdps.html).
To harmonize and strengthen the global network of weather and operational oceanographic services support for the maritime and coastal environments in terms of coastal populations and fisheries, the JCOMM Services and Forecasting Systems Program Area (hereafter referred to as JCOMM Services) provides standards and protocols to national authorities regarding the delivery of marine weather and ocean services, which protect lives and property at sea and in the sensitive coastal environment. While JCOMM services support a wide range of met-ocean activities, the primary focus is on promoting safe shipping, reducing the risk from disasters along the coasts, responding to marine emergencies, and providing the international coordination necessary for these services to be successful.
The Maritime Safety Services
Although the investments made in observations and forecasts described above have substantially improved predictability, ships still transit into hazardous conditions. Incidents of ships encountering extreme weather at sea in recent years highlight the challenges of exchanging information among ships, national marine forecasting centers, and commercial weather providers, which have adverse effects on the decision-making of mariners. The situation is further exacerbated by a maritime weather infrastructure that remains heavily reliant on decades-old technology for dissemination, such as radiofax, text, and brief voice broadcasts.
To ensure forecasts and hazardous weather warnings are provided to ships at sea, JCOMM has established a Worldwide Met-Ocean Information and Warning Service (WWMIWS) Committee. Aligned with the International Hydrographic Organization (IHO) Worldwide Navigation Warning Service (WWNWS) Sub-Committee, WWMIWS ensures that standards and procedures are developed for the preparation and issuance of marine weather support that are compatible with systems that disseminate navigation warnings to ships, and that these protocols are equitably implemented around the world. The basis for these services dates back to the initial international Convention on the Safety of Life at Sea (SOLAS), held in 1914 following the sinking of the RMS Titanic in 1912 by an iceberg in the waters of the North Atlantic Ocean. Subsequently adopted as the UN Convention on the SOLAS, the convention has been revised four times, most recently in 1974, with the International Maritime Organization (IMO) responsible for regulating under the technical guidance of the WMO, through JCOMM, and IHO.
IMO manages this maritime safety information through the Global Maritime Distress and Safety System (GMDSS). As shown in Figure 9, the world's oceans are divided into 21 zones called METAREAs. JCOMM WWMIWS guides the provision of services through METAREA coordinators, who are responsible for monitoring and reviewing the provision of meteorological maritime safety information within the GMDSS and also for other vessels not covered by the SOLAS Convention.
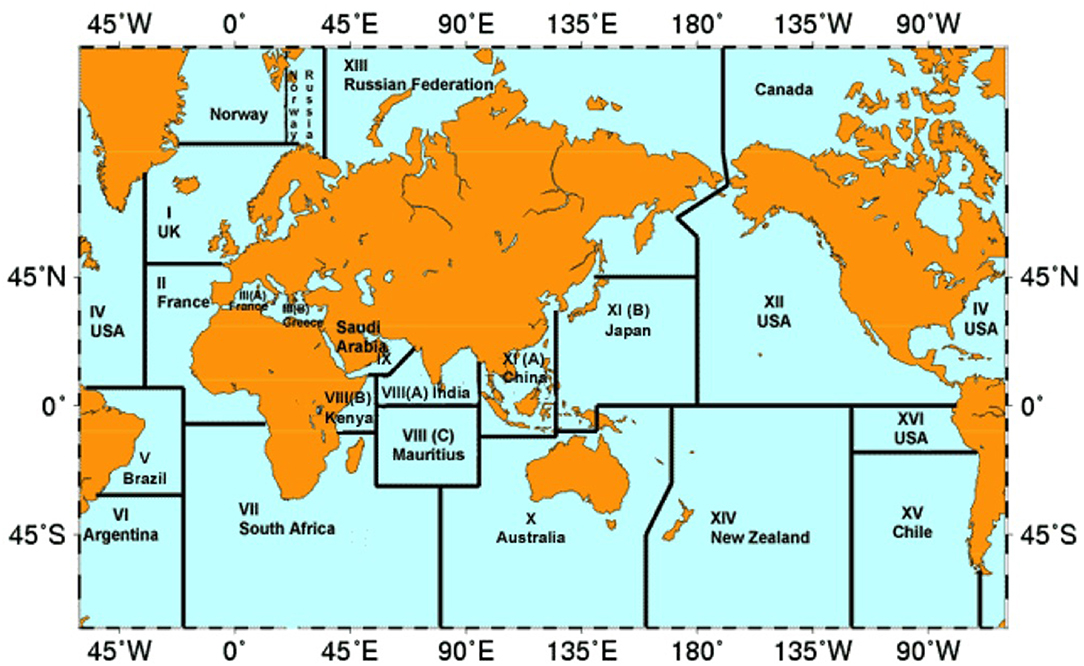
Figure 9. The 21 WMO METAREAs, established for the provision of marine products and services on the high seas, http://weather.gmdss.org/metareas.html.
Sea ice is particularly dangerous to vessels. To address this specific navigational hazard, JCOMM's Expert Team on Sea Ice (ETSI) coordinates with and advises coastal states on products and services required by user communities in sea ice areas, to support navigation, coastal and offshore activities, and monitoring of the sea ice cover for both the northern and southern hemispheres. Such services are becoming more relevant as the polar seas warm and become less ice-bound during the summer months, resulting in an increase in shipping and other maritime activities in these regions. Recognizing this, the IMO adopted the International Code for Ships Operating in Polar Waters, and the “Polar Code” (MEPC, 2015) entered into force in 2017. ETSI will have the important role of providing guidance for national ice services to ensure the sea ice information they provide meets Polar Code requirements.
The Disaster Risk Reduction Services
Inundation in the coastal zone resulting from tsunamis, storm surge, increased river flow, and other weather-related causes kills thousands annually and hundreds of thousands more are displaced from their homes and communities. Although regional warning systems are increasingly available, these phenomena continue to wreak havoc due to the lack of preparedness and effective mitigation strategies. This led to the inclusion of a specific target in the Sendai Framework to “substantially increase the availability of and access to multi-hazard early warning systems and disaster risk information and assessments to people by 2030.”
Innovative solutions are required to minimize the impacts of these events, and since 2009 WMO and JCOMM have partnered to develop tools that can be used to improve prediction and lessen the effects of these disasters. The Coastal Inundation Forecasting Demonstration Project (CIFDP) is a cooperative effort by the WMO's Commission for Hydrology and JCOMM to pilot an initial capability in Bangladesh, Fiji, the island of Hispaniola encompassing both the Dominican Republic and Haiti, and Indonesia, with a focus on the development and implementation of multi-hazard early warning systems leading to long-term disaster risk reduction services in these coastal states (Swail et al., 2010). The project integrated observations of sea level, ocean waves, and meteorological variables including wind, pressure, and rainfall with hydrological information, such as river level and flow. This observational information was combined with the forecast modeling techniques used for waves, storm surge, tide, sea surface height anomaly and river flooding by organizations, such as the WMO's Regional Specialized Meteorological Center (RSMC) for Tropical Cyclones in Miami, USA, and the RSMC Tokyo's Typhoon Centre, along with national meteorological agencies where available, such as in Indonesia.
Based on the technical description of CIFDP, as given in Figure 10, the national forecast agencies can provide essential guidance on potential inundation hazards to national disaster management agencies according to their established protocols. The outcomes of these demonstration projects are being evaluated to help create an optimal path for the full operational implementation of a program to extend these multi-hazard forecast systems to other nations that are subject to disasters resulting from coastal inundation events.
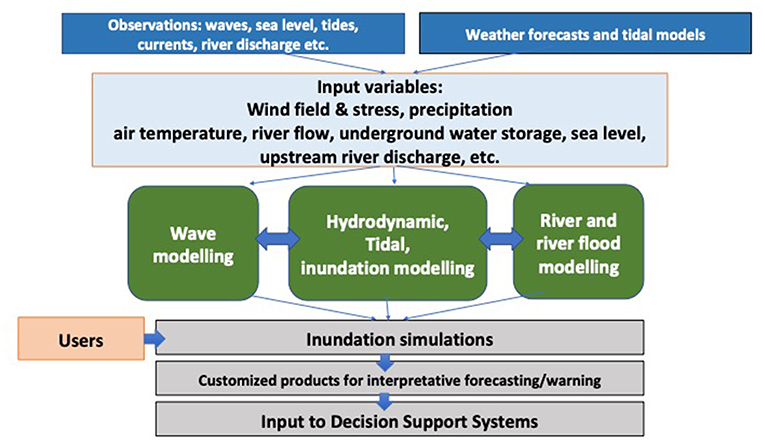
Figure 10. Conceptual diagram of Coastal Inundation Forecasting Demonstration Project (CIFDP) forecast system.
To help provide coastal states with the technical expertise and tools needed to mitigate the impacts of these deadly coastal weather events, JCOMM Services established an Expert Team on Disaster Risk Reduction (ETDRR) in 2017. This ETDRR will be comprised of experts from both developed and developing coastal states, and is aimed at improving the links between observations and emergency management officials in states vulnerable to such disasters. In addition, to actively supporting the CIFDP, the expert team will help promote and develop regional coastal hazard warning solutions for all vulnerable nations, including capacity building activities. ETDRR will also promote trans-disciplinary connections between scientists, engineers, planners, and policy makers, to deliver the tools needed for effective coastal resilience.
Marine Environmental Emergency Services
Operational services that deliver marine pollution forecasts and hazard/risk mapping for marine environmental emergencies and disaster risk reduction will be co-ordinated. The initial framework involved the setting up of a network of response centers within the 21 WMO metareas (Figure 9) within the GMDSS, and is called the Marine Pollution Emergency Response Support System (MPERSS). This NMHS network liaises with oceanographic centers to provide environmental emergencies response information. These centers should provide basic meteorological and oceanographic forecasts and advection-diffusion and transformation models capable of simulating and forecasting the movement and weathering of pollutants at the sea surface. The MPERSS system is being revised by the Expert Team on Marine Environmental Emergencies Response (ETMEER), which will facilitate the implementation and operation of GDPFS specialized centers for marine emergency management, and establish and maintain standards for information products, thus supporting members and member states in their responses to marine environmental emergencies.
This global system must liaise with the International Convention for the Prevention of Pollution from Ships (MARPOL), which is the main international convention addressing the prevention of pollution of the marine environment by ships from operational or accidental causes. It should also connect with regional conventions that develop contingency plans for marine pollution emergencies in the Mediterranean (REMPEC), the Baltic (HELCOM), and the North Sea (OSPAR). The International Maritime Organization (IMO) and International Atomic Energy Agency (IAEA) are already involved in JCOMM activities and provide guidance for ship pollution and radioactive accidents.
The complexity of such a network cannot be underestimated. Environmental emergencies range from radioactive material discharges, such as the Chernobyl nuclear power plant accident in 1986 (Margvelashvili et al., 1997; Staneva et al., 1999; Evangeliou et al., 2016), the Fukushima Daiichi nuclear power plant accident in 2011 (Dietze and Kriest, 2012; Estournel et al., 2012; Miyazawa et al., 2012; Tsumune et al., 2012; Draxler et al., 2015; Periáñez et al., 2015), and the ruthenium-106 release in 2017 (IRSN, 2017), to oil spills from operational release and/or ship or platform accidents (Price et al., 2003; Abascal et al., 2010; Olita et al., 2012; Fernandes et al., 2016; Liubartseva et al., 2016a; Sepp-Neves et al., 2016; Zodiatis et al., 2018), accidents related to objects/debris/people drift (Kawamura et al., 2014; Jansen et al., 2016; Trinanes et al., 2016; Maximenko et al., 2018), other hazardous and noxious substances (Neuparth et al., 2011; Legrand et al., 2016), harmful algal blooms (He et al., 2008; Li et al., 2009; Glibert et al., 2010; Hense, 2010; McGillicuddy, 2010; Anderson et al., 2012), and plastic pollution (Maximenko et al., 2012; Mansui et al., 2015; Van Sebille et al., 2015; Liubartseva et al., 2016b, 2018; Fossi et al., 2017; Politikos et al., 2017; Zambianchi et al., 2017). All of these accidents/events require specific information and competency, particularly if a global support system for mitigation and response has to be organized. Nothing is yet available for underwater pollution sources and hazard/risk mapping information, although severe accidents can result from underwater explosions and so risk/hazard mapping is extremely important for the few 10 min after the accident, to understand the potential environmental conditions that can affect pollutant dispersion.
Ocean Forecasting From the Global to the Regional Scales
Over the past 20 years oceanographic operational services have emerged and developed (Pinardi et al., 2017), and together with the sea state provide 10 days forecasts of the deep ocean state and long-term reanalyses. Ocean forecasting has been developed (Pinardi and Woods, 2002; Chassignet and Verron, 2006) under the scientific coordination and guidance of the Global Data Assimilation Experiment (Bell et al., 2009; Dombrowsky et al., 2009), which has now evolved into GODAE OceanPredict. This promotes the development and improvement of operational ocean analysis and forecasting systems worldwide and involves 15 different ocean forecasting systems from various countries and institutions. The most important aspects of this work relate to scientific advances in ocean modeling and data assimilation. The particular challenges for the future will be in terms of high-resolution physical modeling, downscaling, biogeochemical and ecosystem modeling, ocean/wave/atmosphere coupling, data assimilation and coupled data assimilation, error estimates, long-term reanalyses, and the use of new observations.
In 2012 JCOMM established an expert team to monitor and maintain an overview of the worldwide Operational Ocean Forecasting Systems portfolio, including ocean physics and marine biogeochemistry, and to promote the adoption of international standards for ocean forecasting activities. Users of this new ocean forecasting are those within the socio-economic sectors of maritime transport and safety, coastal and marine environment management and protection, marine resources and weather, and climate and seasonal forecasting. Tonani et al. (2015) offers an exhaustive overview of the global and regional operational forecasting systems across the world.
To achieve forecast accuracy, ocean operational systems must from the outset consider mesoscale resolution, from global to regional scales. For coastal forecasting, higher-resolution models are nested into global forecasts both as limited area models and as stand-alone systems that are initialized only once. Coastal models and forecasting introduce new challenges. The issue of big data management, in terms of the exchange of large amounts of data for initial and lateral boundary condition updates, a high-resolution bathymetry-topography mapping to allow for coastal inundation, and the data assimilation of local observations into the nested models (De Mey et al., 2017). These problems will be partially tackled by JCOMM coordination to establish best practices in the NMHS and responsible oceanographic institutions, but they will remain a research, development, and innovation challenge.
Capacity Development
JCOMM Capacity Development (CD) activities are carried out in each program area (Figure 2) using the existing IOC Capacity Development and WMO Education and Training structures, to leverage the CD expertise and experience in both organizations (i.e., WMO Global Campus and Regional Training Centres (RTC), the IOC-IODE Ocean Teacher Global Academy (OTGA) and its OTGA Regional Training Centres, IOC/WESTPAC Regional Training and Research Centres, etc.). JCOMM CD activities are also undertaken on the basis of the Partnership for New GEOSS Applications (PANGEA—https://www.jcomm.info/pangea-concept) using voluntary contributions from WMO members and IOC Member States. In the following we provide an overview of the main principles for CD activities in IOC and WMO.
The IOC Capacity Development Strategy (2015) Mission Statement states that “The IOC will undertake relevant actions to assist Member States with developing and sustaining the necessary capacity to undertake activities necessary to achieve the IOC vision at the national level as well as at the international cooperation level.” It further suggests that the IOC Criteria and Guidelines on the Transfer of Marine Technology should be taken into account along with IOC's custodianship role for SDG 14 (ICSU, 2017), particularly under targets 14.3 and 14.a. The first target, 14.3, is related to the minimization of ocean acidification including ocean scientific cooperation and the second, 14.a, is concerned with the increase of scientific knowledge and the development of research capacities in order to improve ocean health.
Thus, member states have recognized the need to address the ocean scientific knowledge gaps in national infrastructures, NODCs, and operational ocean forecasting centers. In this context, IOC governing bodies have endorsed the proposal for an International (UN) Decade of Ocean Science for Sustainable Development to be established for the period 2021–2030, which will significantly contribute to CD across the end-to-end met-ocean system. From 2015 to 2021, the IOC CD strategy proposes a framework of outputs and activities, which are summarized in Table 1A.
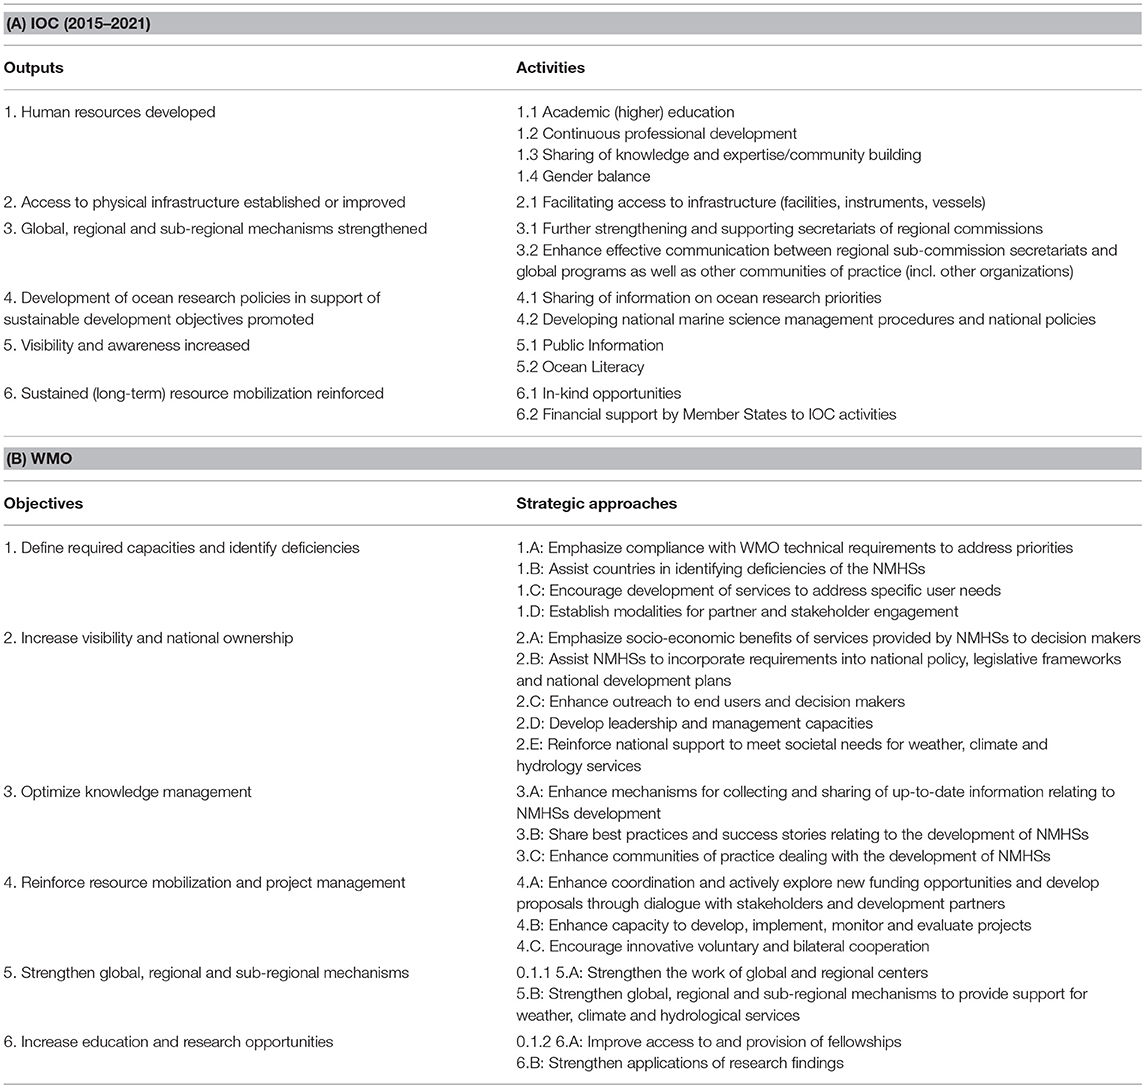
Table 1. (A) IOC CD Strategy; (B) WMO CD Strategy.
The WMO CD mission is to foster stronger NMHS that can meet the need for further information on weather, climate, and water, for the safety and well-being of people throughout the world. CD should be conducted, particularly for developing countries, the least developed countries (LDCs), and small island development states (SIDSs), through advocacy, education and training, outreach, partnerships and resource mobilization, demonstration and pilot projects, service delivery, and research. The WMO Capacity Development Strategy identifies six strategic objectives and corresponding Strategic Approaches, which are summarized in Table 1B (https://www.wmo.int/pages/prog/dra/documents/WMO_Capacity_Development_Strategy.doc).
The IOC and WMO CD strategies have several similar outputs and/or objectives, including increased education, research, human resources, visibility, awareness, strengthening of global, regional and sub-regional mechanisms, and sustained resource mobilization for CD. Their differences are that the IOC CD strategy includes increased access to physical oceanographic infrastructures while the WMO CD strategy begins by explicitly defining the required capacities and deficiencies, emphasizing ownership and optimizing knowledge management.
Discussion
Over the past 20 years JCOMM has worked to ensure coordination in the delivery of an integrated, global meteorological and ocean monitoring and forecasting system, for the benefit of WMO members and IOC member states. This coordination has been fruitful, and the efficient use of available resources has led to advancements in the overall management capacity of this complex system, from observations to generic services and customized products.
The demand for improved integration, coordination, and standards across global ocean observing and forecasting systems is increasing. The effective monitoring of the earth's climate requires a system that is continuously updated by new technologies, well-coordinated within the research community, and fully near-real time and operational. The four JCOMM activity areas only partially meet the expectations resulting from these new challenges. The JCOMM MAN has carried out a Strength and Weaknesses, Opportunities and Threats (SWOT) analysis (Table 2) to attempt to devise a better fit-for-purpose collaboration between IOC and WMO, in view of the changes that will involve JCOMM in 2020.
Table 2. SWOT analysis for the Joint activities between WMO and IOC.
In general, the weaknesses outlined in Table 2 are due to the technical nature of the three program areas, which have not included any periodic review of stakeholder needs. A bottom-up approach has been taken in the program area activities, which has been adequate over their 20 years joint activity development period, but they now must be revisited.
In particular, there is a weakness in the connections between the observational program area and the ocean infrastructure of IODE and MCDS. Many real-time OPA networks have defined both their real-time and delayed mode data management strategies separately from the IODE structural elements described in section Data Management Systems, From Near-Real Time to Delayed Mode. Furthermore, there has been little cross-fertilization between the IODE system and the MCDS itself. The technical institutions represented by the WMO members and the IOC members states require international best practices across communities, so they can take advantage of past experiences in building a fit-for-purpose met-ocean data exchange system. JCOMM DMPA began to define a strategy for the met-ocean archiving system but failed because information about the working practices of IODE networks was not fully considered.
In an attempt to bridge the gap, IODE is developing an ODIS system that will initially be in the form of a “Catalogue of Sources” (http://catalogue.odis.org), aimed at being an online searchable catalogue of existing ocean-related web-based data and information sources/systems of as well as products and services. It will also provide information on products and visualize the landscape (entities and their connections) of ocean data and information sources. This may lead to a design for combining real-time and delayed mode data flows and the ongoing storage of the data. However, this process is far from being accomplished and will require future activities to focus on the strategic objectives. The future ODIS will be an e-environment in which users can discover data, information, and associated products or services provided by member states, projects, and other partners associated with IOC and WMO. The system will aim to align itself with accepted community data management principles, such as the FAIR principles (Wilkinson et al., 2016) and, where appropriate, interoperate with existing data exchange solutions. ODIS will also allow additional metrics to be defined that record the data flow and if the data are securely archived within the IODE network and links with the satellite data centers.
To achieve this objective, JCOMM began defining standards for networking between IODE, OPA networks, and WIS (https://www.jcomm.info/index.php?option=com_oe&task=viewDocumentRecord&docID=20327). The Inter-Program Expert Team on Integrated Marine Meteorological and Oceanographic Services (IPET-MOIS) will continue this work (Figure 11). This group will define a formal procedure to interconnect all the relevant WIS to the IODE centers and eventually ODIS, using best practices with standards-based data and metadata exchange. With real-time data as its initial focus, IPET-MOIS will identify marine observing assets that have real-time value and facilitate the inclusion of these data on the GTS and WIS.
Figure 11. The high level structure of the ODIS components next to the WIS (http://www.wmo.int/pages/prog/www/WIS/). Symbols are defined in the Table of acronyms. The JCOMM IPET-MOIS team will facilitate the data interchange between existing oceanographic institutions part of ODIS and the WIS.
Another major weakness of the system is the lack of strong links between the three pillars of the met-ocean value chain (Figure 2). Neither the OPA networks nor the IODE/MCDS infrastructure get requirements from the forecasting and/or downstream services. As outlined in the user survey, it is clear that maritime safety services do not as yet benefit from the existing new observation data streams and the advanced met-ocean forecasts.
The activities carried out by JCOMM have begun to create strong and important links between the meteorological and the oceanographic communities, but the level of connections required surpasses the governance put together by JCOMM.
Future Foci
The areas identified as weaknesses and opportunities in Table 2 are considered the starting points for the focus of the new Joint IOC and WMO collaborative activities, which will begin in 2020.
The WMO reform advice was to abolish JCOMM and establish a new joint collaborative board between WMO and IOC that will take on all the activities of the present JCOMM but within a new governance structure and with new working practices.
The new Joint Collaborative Board should develop and provide strategic advice, directly derived from the overall strategic plans of IOC and WMO, to achieve joint objectives with the mandate to propose decisions directly to IOC and WMO governing bodies.
It will also provide a forum for WMO and IOC bodies and external partners, to negotiate and fast-track projects and joint work plans, which include objectives that cut across meteorology and oceanography and WMO and IOC regional structures to enhance implementation and capacity development, and the value chain connecting observations, data management, forecasting systems, services, and research.
In this future structure, the expert teams will become involved in active IOC programs, such as GOOS, IODE, the IOC Tsunami Program, and the new two restructured commissions of the WMO (to be approved in June 2019). One of the major tasks of the new Joint Board will be to ensure the sustainability of the JCOMMOPS service, its connections with the IODE centers, and the full development of a fit-for-purpose data management system for the global met-ocean data and information system. The following goals form the backbone of the JCOMMOPS roadmap over the next 5–10 years:
(i) Reach its metadata “gold” standard for all networks itemized in its initial Terms of Reference (Argo, OceanSITES, DBCP, SOT, GO-SHIP, GLOSS) and develop standard metadata services.
(ii) Expand its support and monitoring capacity; to new OCG networks (such as OceanGliders) and develop a regional pilot on e.g., Mediterranean Sea.
(iii) Enabling a responsive and truly global monitoring system. Over the long term, JCOMMOPS could expand its monitoring capacity to most of GOOS/WIGOS regions, and give visibility and monitoring capability to a cluster of coastal observing systems, with the cooperation of national focal points.
The Joint Collaborative Board will oversee the work of the expert teams from an overall strategic point of view, and will organize the necessary exchanges with other programs, including GODAE OceanPredict, WCRP, GeoBluePlanet, etc. IMO and IHO should be invited to engage in the Joint Board, and particularly in the activities of maritime safety and bathymetric mapping, with an eye to the synergistic opportunities.
A major focus of the new Joint Board will be to organize projects that will advance the sharing of data and training on met-ocean products and information, including the new ocean forecasts, analyses and reanalyses, and the early warning systems, navigation safety services, and emergency response decision support systems.
In conclusion, we should again consider the success of the first 20 years of collaborative work between the IOC of UNESCO and WMO. Those in the fields of oceanography and meteorology have, at various levels and at the country level in particular, started to develop common plans and share expertise. These common activities are essential to gain knowledge and develop applications to fulfill the sustainable development goals.
Author Contributions
NP suggested the contents of the paper and wrote the abstract, the whole introduction, part of section From Monitoring to Services, Capacity Development, and Discussion. DL together with JT, JH, EH, SB, and others wrote the section Operational Observing Networks and Systems. KO'B wrote the section on real time data flow and TB the Marine Climate Data System with the help of PP. All the remaining authors corrected the different drafts.
Conflict of Interest Statement
The authors declare that the research was conducted in the absence of any commercial or financial relationships that could be construed as a potential conflict of interest.
Acknowledgments
Several projects and national Institutions supported the authors of this paper. NP has received funding from the European Union's Horizon 2020 research and innovation program under grant agreement No. 633211 (AtlantOS). DL and SB acknowledge support from NOAA (FundRef 100007298). KO'B was partially funded by the Joint Institute for the Study of the Atmosphere and Ocean (JISAO) under NOAA Cooperative Agreement NA15OAR4320063, Contribution No. 2018-0176.
References
Abascal, A., Castanedo, S., Medina, R., and Liste, M. (2010). Analysis of the reliability of a statistical oil spill response model. Mar. Pollut. Bull. 60, 425–442. doi: 10.1016/j.marpolbul.2010.07.008
Anderson, D. M., Cembella, A. D., and Hallegraeff, G. M. (2012). Progress in understanding harmful algal blooms: paradigm shifts and new technologies for research, monitoring, and management. Annu. Rev. Mar. Sci. 4, 143–176. doi: 10.1146/annurev-marine-120308-081121
Bauer, P., Thorpe, A., and Gilbert, B. (2015). The quiet revolution of numerical weather prediction. Nature 525, 47–55. doi: 10.1038/nature14956
Bell, M. J., Lefèbvre, M., Le Traon, P.-Y., Smith, N., and Wilmer-Becker, K. (2009). GODAE: the global ocean data assimilation experiment. Oceanography 22, 14–21. doi: 10.5670/oceanog.2009.62
Bojinski, S., Verstraete, M., Peterson, T. C., Richter, C., Simmons, A., and Zemp, M. (2014). The concept of essential climate variables in support of climate research, applications, and policy. Bull. Amer. Meteor. Soc. 95, 1431–1443. doi: 10.1175/BAMS-D-13-00047.1
Boyer, T. P., Antonov, J. I., Baranova, O. K., Coleman, C., Garcia, H. E., Grodsky, A., et al. (2013). World Ocean Database 2013, NOAA Atlas NESDIS, 72. Silver Spring, MD: NOAA Printing Office. Available online at: http://hdl.handle.net/11329/357
Chassignet, E. P., and Verron, J. (2006). Ocean Weather Forecasting. An Integrated View of Oceanography. Dordrecht: Springer. doi: 10.1007/1-4020-4028-8
Cravatte, S., Kessler, W. S., Smith, N., and Wijffels, S. E. (2016). First Report of TPOS 2020. GOOS-215, 200 pp. Available online at: http://tpos2020.org/first-report/
De Mey, P., Stanev, E., and Kourafalou, V. (2017). Science in support of coastal ocean forecasting—part 1. Ocean Dyn. 67:665. doi: 10.1007/s10236-017-1048-1
Dietze, H., and Kriest, I. (2012). 137Cs off Fukushima Dai-ichi, Japan–model based estimates of dilution and fate. Ocean Sci. 8, 319–332. doi: 10.5194/os-8-319-2012
Dombrowsky, E., Bertino, L., Brassington, G. B., Chassignet, E. P., Davidson, F., Hurlburt, H. E., et al. (2009). GODAE systems in operation. Oceanography 22, 80–95. doi: 10.5670/oceanog.2009.68
Draxler, R., Arnold, D., Masamichi, C., Galmarini, S., Hort, M., Jones, A., et al. (2015). World Meteorological Organization's model simulations of the radionuclide dispersion and deposition from the Fukushima Daiichi nuclear power plant accident. J. Environ. Radioact. 139, 172–184. doi: 10.1016/j.jenvrad.2013.09.014
Estournel, C., Bosc, E., Bocquet, M., Ulses, C., Marsaleix, P., Winiarek, V., et al. (2012). Assessment of the amount of cesium-137 released into the Pacific Ocean after the Fukushima accident and analysis of its dispersion in Japanese coastal waters. J. Geophys. Res. 117:C11014. doi: 10.1029/2012JC007933
Evangeliou, N., Hamburger, T., Talerko, N., Zibtsev, S., Bondar, Y., Stohl, A., et al. (2016). Reconstructing the Chernobyl Nuclear Power Plant (CNPP) accident 30 years after. A unique database of air concentration and deposition measurements over Europe. Environ. Pollut. 216, 408–418. doi: 10.1016/j.envpol.2016.05.030
Fernandes, R., Braunschweig, F., Lourenço, F., and Neves, R. (2016). Combining operational models and data into a dynamic vessel risk assessment tool for coastal regions. Ocean Sci. 12, 285–317. doi: 10.5194/os-12-285-2016
Fossi, M. C., Romeo, T., Baini, M., Panti, C., Marsili, L., Campan, T., et al. (2017). Plastic debris occurrence, convergence areas and fin whales feeding ground in the Mediterranean marine protected area Pelagos Sanctuary: a modeling approach. Front. Mar. Sci. 4:167. doi: 10.3389/fmars.2017.00167
Glibert, P. M., Allen, J. I., Bouwman, A. F., Brown, C. W., Flynn, K. J., Lewitus, A. J., et al. (2010). Modeling of HABs and eutrophication: status, advances, challenges. J. Mar. Syst. 83, 262–275. doi: 10.1016/j.jmarsys.2010.05.004
He, R., McGillicuddy, D. J., Keafer, B. A., and Anderson, D. M. (2008). Historic 2005 toxic bloom of Alexandrium fundyense in the western Gulf of Maine: 2. Coupled biophysical numerical modeling. J. Geophys. Res. Oceans 113:C07040. doi: 10.1029/2007JC004602
Hense, I. (2010). Approaches to model the life cycle of harmful algae. J. Mar. Syst. 83, 108–114. doi: 10.1016/j.jmarsys.2010.02.014
Hermes, J., Pearlman, J., and Buttigieg, P. L. (2018). What's the best way to responsibly collect ocean data? Eos 99. doi: 10.1029/2018EO096533
ICSU (2017). A Guide to SDG Interactions: From Science to Implementation. Paris: International Council for Science.
IOC (1993). Manual of Quality Control Procedures for Validation of Oceanographic Data. Paris: UNESCO, 436pp. Intergovernmental Oceanographic Commission Manuals and Guides, 26. Available online at: http://hdl.handle.net/11329/167
IOC Assembly Resolution XXVI-8 (2011). Strengthening and Streamlining GOOS, IOC-XXVI/3. Available online at: ioc-unesco.org/ioc-26.
IRSN (2017). Detection of Ruthenium 106 in France and in Europe. Results of IRSN's Investigations. L'Institut de Radioprotection et de Sûreté Nucléaire. Available online at: https://www.irsn.fr/EN/newsroom/News/Documents/IRSN_Information-Report_Ruthenium-106-in-europe_20171109.pdf
Jansen, E., Coppini, G., and Pinardi, N. (2016). Drift simulation of MH370 debris using superensemble techniques. Nat. Hazards Earth Syst. Sci. 16, 1623–1628. doi: 10.5194/nhess-16-1623-2016
Jayne, S. R., Roemmich, D., Zilberman, N., Riser, S. C., Johnson, K. S., Johnson, G. C., et al. (2017). The argo program present and future. Oceanography 30, 18–28. doi: 10.5670/oceanog.2017.213
Johnson, G.C., Layman, J. M., Willis, J., Boyer, T., Antonov, J., Good, S. A., et al. (2014). Ocean heat content [in “State of the Climate in 2013”]. Bull. Am. Meteorol. Soc. 95, S54–S57. doi: 10.1175/2014BAMSStateoftheClimate.1
Johnson, G. C. (2018). Global oceans [in “State of the Climate in 2017”]. Bull. Am. Meteorol. Soc. 99, S143–S173. doi: 10.1175/2018BAMSStateoftheClimate.1
Kates, W. R., Parris, T. M., and Leiserowitz, A. A. (2005). What is sustainable development? Goals, indicators, values, and practice. Environ. Sci. Policy Sustain. Dev. 47, 8–21. doi: 10.1080/00139157.2005.10524444
Kawamura, H., Kobayashi, T., Nishikawa, S., Ishikawa, Y., Usui, N., Kamachi, M., et al. (2014). Drift simulation of tsunami debris in the North Pacific. Glob. Environ. Res. 18, 81–96. Available online at: http://www.airies.or.jp/journal_18-2eng.html
Le Traon, P. Y., Reppucci, A., Fanjul, E. A., Aouf, L., Behrens, A., Belmonte, M., et al. (2019). From observation to information and users: the Copernicus Marine Service perspective. Front. Mar. Sci. 6:234. doi: 10.3389/fmars.2019.00234
Legrand, S., Le Floch, S., Aprin, L., Parthenay, V., Donnay, E., Parmentier, K., et al. (2016). “Improving member states preparedness to face an HNS pollution of the marine system,” in EGU General Assembly 2016, EGU2016, 17622. Available online at: https://meetingorganizer.copernicus.org/EGU2016/EGU2016-17622.pdf
Li, Y., He, R., McGillicuddy, D.J., Anderson, D.M., and Keafer, B.A. (2009). Investigation of the 2006 Alexandrium fundyense bloom in the Gulf of Maine: in situ observations and numerical modeling. Cont. Shelf Res. 29, 2069–2082. doi: 10.1016/j.csr.2009.07.012
Liubartseva, S., Coppini, G., Lecci, R., and Clementi, E. (2018). Tracking plastics in the Mediterranean: 2D Lagrangian model. Mar. Pollut. Bull. 129, 151–162. doi: 10.1016/j.marpolbul.2018.02.019
Liubartseva, S., Coppini, G., Lecci, R., and Creti, S. (2016b). Regional approach to modeling the transport of floating plastic debris in the Adriatic Sea. Mar. Pollut. Bull. 103, 115–127. doi: 10.1016/j.marpolbul.2015.12.031
Liubartseva, S., De Dominicis, M., Oddo, P., Coppini, G., Pinardi, N., and Greggio, N. (2016a). Oil spill hazard from dispersal of oil along shipping lanes in the Southern Adriatic and Northern Ionian Seas. Mar. Pollut. Bull. 90, 259–272. doi: 10.1016/j.marpolbul.2014.10.039
Mansui, J., Molcard, A., and Ourmieres, Y. (2015). Modelling the transport and accumulation of floating marine debris in the Mediterranean basin. Mar. Pollut. Bull. 91, 249–257. doi: 10.1016/j.marpolbul.2014.11.037
Margvelashvili, N., Maderich, V., and Zheleznyak, M. (1997). THREE-TOX-computer code to simulate three-dimensional dispersion of radionuclides in stratified water bodies. Radiat. Protect. Dosimetry 73, 177–180. doi: 10.1093/oxfordjournals.rpd.a032128
Maximenko, N., Hafner, J., Kamachi, M., and MacFadyen, A. (2018). Numerical simulations of debris drift from the Great Japan Tsunami of 2011 and their verification with observational reports. Mar. Pollut. Bull. 132, 5–25. doi: 10.1016/j.marpolbul.2018.03.056
Maximenko, N., Hafner, N., and Niiler, J. (2012). Pathways of marine debris derived from trajectories of Lagrangian drifters. Mar. Pollut. Bull. 65, 151–162. doi: 10.1016/j.marpolbul.2011.04.016
McGillicuddy, D. J. (2010). Models of harmful algal blooms: conceptual, empirical, and numerical approaches. J. Mar. Syst. 83, 105–107. doi: 10.1016/j.jmarsys.2010.06.008
McGranahan, G., Balk, D., and Anderson, B. (2007). The rising tide: assessing the risks of climate change and human settlements in low elevation coastal zones. Environ. Urban. 19, 17–37. doi: 10.1177/0956247807076960
McPhaden, M.J., Busalacchi, A. J., and Anderson, D. L. T. (2010). A TOGA retrospective. Oceanography 23, 86–103. doi: 10.5670/oceanog.2010.26
MEPC (2015). Annex 10: International Code for Ships Operating in Polar Waters (Polar Code), MPEC 68/21. Marine Environment Protection Committee of International Maritime Organization.
Miyazawa, Y., Masumoto, Y., Varlamov, S. M., and Miyama, T. (2012). Transport simulation of the radionuclide from the shelf to open ocean around Fukushima. Cont. Shelf Res. 50–51, 16–29. doi: 10.1016/j.csr.2012.09.002
National Research Council (2003). Satellite Observations of the Earth's Environment: Accelerating the Transition of Research to Operations. Washington, DC: The National Academies Press.
Neuparth, T., Moreira, S., Santos, M. M., and Reis-Henriques, M. A. (2011). Hazardous and noxious substances (HNS) in the marine environment: prioritizing HNS that pose major risk in a european context. Mar. Pollut. Bull. 62, 21–28. doi: 10.1016/j.marpolbul.2010.09.016
Olita, A., Cucco, A., Simeone, S., Ribotti, A., Fazioli, L., Sorgente, B., et al. (2012). Oil spill hazard and risk assessment for the shorelines of a Mediterranean coastal archipelago. Ocean Coast. Manage. 57, 44–52. doi: 10.1016/j.ocecoaman.2011.11.006
Pearlman, J., Bushnell, M., Coppola, L., Karstensen, J., Buttigieg, L., Pearlman, F., et al. (2019). Evolving and sustaining ocean best practices and standards for the next decade. Front. Mar. Sci. 6:277. doi: 10.3389/fmars.2019.00277
Periáñez, R., Brovchenko, I., Duffa, C., Jung, K. T., Kobayashi, T., Lamego, F., et al. (2015). A new comparison of marine dispersion model performances for Fukushima Dai-ichi releases in the frame of IAEA MODARIA program. J. Environ. Radioact. 150, 247–269. doi: 10.1016/j.jenvrad.2015.09.003
Pinardi, N., Cavaleri, L., Coppini, G., De Mey, P., Fratianni, C., Huthnance, J., et al. (2017). From weather to ocean predictions: an historical viewpoint. J. Mar. Res. 75, 103–159. doi: 10.1357/002224017821836789
Pinardi, N., and Woods, J. (2002). Ocean Forecasting. Conceptual Basis and Applications. Berlin; Heidelberg: Springer-Verlag. doi: 10.1007/978-3-662-22648-3
Politikos, D. V., Ioakeimidis, C., Papatheodorou, G., and Tsiaras, K. (2017). Modeling the fate and distribution of floating litter particles in the Aegean Sea (E. Mediterranean). Front. Mar. Sci. 4:191. doi: 10.3389/fmars.2017.00191
Price, J., Jonson, W., Marshall, C., Ji, Z., and Rainey, G. (2003). Overview of the oil spill risk analysis (OSRA) model for environmental impact assessment. Spill Sci. Technol. Bull. 8, 529–533. doi: 10.1016/S1353-2561(03)00003-3
Purkey, S. G., and Johnson, G. C. (2010). Warming of global abyssal and deep Southern Ocean waters between the 1990s and 2000s: contributions to global heat and sea level rise budgets. Clim. J. 23, 6336–6351. doi: 10.1175/2010JCLI3682.1
Sabine, C.L., Ducklow, H., and Hood, M. (2010). International carbon coordination: Roger Revelle's legacy in the Intergovernmental Oceanographic Commission. Oceanography 23, 48–61. doi: 10.5670/oceanog.2010.23
Sepp-Neves, A. A., Pinardi, N., and Martins, F. (2016). IT-OSRA: applying ensemble simulations to estimate the oil spill risk associated to operational and accidental oil spills. Clim. Dyn. 66, 939–954. doi: 10.1007/s10236-016-0960-0
Serafin, R. J., MacDonald, A. E., and Gall, R. L. (2002). Transition of weather research to operations. Bull. Am. Meteorol. Soc. 83, 377–392. doi: 10.1175/1520-0477(2002)083<0377:TOWRTO>2.3.CO;2
Shao, H., Derber, J., Huang, X., Hu, M., Newman, K., Stark, D., et al. (2016). Bridging research to operations transitions: status and plans of community GSI. Bull. Am. Meteorol. Soc. 97, 1427–1440. doi: 10.1175/BAMS-D-13-00245.1
Simons, R. A. (2017). ERDDAP. Monterey, CA: NOAA/NMFS/SWFSC/ERD. Available online at: https://coastwatch.pfeg.noaa.gov/erddap
Staneva, J. V., Buesseler, K. O., Stanev, E. V., and Livingston, H. D. (1999). The application of radiotracers to a study of Black Sea circulation: validation of numerical simulations against observed weapons testing and chernobyl 137Cs data. J. Geophys. Res. 104, 11099–11114. doi: 10.1029/1998JC900121
Swail, V., Lee, B., Soares, A., Resio, D., Horsburgh, K., Murty, T., et al. (2010). “Storm surge,” in Proceedings of OceanObs'09: Sustained Ocean Observations and Information for Society, Vol. 2, eds J. Hall, D. E. Harrison, and D. Stammer (Venice: ESA Publication WPP-306, 21–25 September 2009.
Task Team for the Integrated Framework for Sustained Ocean Observing (2012). A Framework for Ocean Observing (Revised in 2017). Paris: UNESCO, IOC/INF-1284 rev.2.
Tonani, M., Balmaseda, M., Bertino, L., Blockley, E., Brassington, G., Davidson, F., et al. (2015). Status and future of global and regional ocean prediction systems. J. Oper. Oceanogr. 8, 201–220. doi: 10.1080/1755876X.2015.1049892
Trinanes, J. A., Olascoaga, M. J., Goni, G. J., Maximenko, N. A., Griffin, D. A., and Hafner, J. (2016). Analysis of potential MH370 debris trajectories using ocean observations and numerical model results. J. Oper. Oceanogr. 9, 126–138. doi: 10.1080/1755876X.2016.1248149
Tsumune, D., Tsubono, T., Aoyama, M., and Hirose, K. (2012). Distribution of oceanic 137Cs from the Fukushima Dai-ichi nuclear power plant simulated numerically by a regional ocean model. J. Environ. Radioact. 111, 100–108. doi: 10.1016/j.jenvrad.2011.10.007
Van Sebille, E., Wilcox, C., Lebreton, L., Maximenko, N. A., Hardesty, B. D., van Franeker, J. A., et al. (2015). A global inventory of small floating plastic debris. Environ. Res. Lett. 10:124006. doi: 10.1088/1748-9326/10/12/124006
Wilkinson, M. D., Dumontier, M., Aalbersberg, I. J., Appleton, G., Axton, M., Baak, A., et al. (2016). The FAIR Guiding Principles for scientific data management and stewardship. Sci. Data 3:160018. doi: 10.1038/sdata.2016.18
WMO (2017a). Guide to Marine Meteorological Services. WMO-471. 73 pp. Available online at: https://www.jcomm.info/index.php?option=com_oe&task=viewDocumentRecord&docID=19901
WMO (2017b). Manual on Marine Services. WMO-558. 62 pp. Available online at: https://www.jcomm.info/index.php?option=com_oe&task=viewDocumentRecord&docID=19900
WMO (2017c). Technical Regulations, Volume I: General Meteorological Standards and Recommended Practices. WMO-49. Available online at: https://library.wmo.int/index.php?lvl=notice_display&id=14073
Zambianchi, E., Trani, M., and Falco, P. (2017). Lagrangian transport of marine litter in the Mediterranean Sea. Front. Mar. Sci. 5:5. doi: 10.3389/fenvs.2017.00005
Zodiatis, G., Liubartseva, S., Alves, T. M., Lardner, R., Kampanis, N., Spanoudaki, K., et al. (2018). “Monitoring and forecasting oil platforms leakages in the Mediterranean and Black Sea,” in EGU General Assembly 2018, EGU2018, 550-1. Available online at: https://meetingorganizer.copernicus.org/EGU2018/EGU2018-2550-1.pdf
Table of Acronyms
Keywords: marine meteorology and oceanography, global ocean observing networks, data management, ocean services, capacity development
Citation: Pinardi N, Stander J, Legler DM, O'Brien K, Boyer T, Cuff T, Bahurel P, Belbeoch M, Belov S, Brunner S, Burger E, Carval T, Chang-Seng D, Charpentier E, Ciliberti S, Coppini G, Fischer A, Freeman E, Gallage C, Garcia H, Gates L, Gong Z, Hermes J, Heslop E, Grimes S, Hill K, Horsburgh K, Iona A, Mancini S, Moodie N, Ouellet M, Pissierssens P, Poli P, Proctor R, Smith N, Sun C, Swail V, Turton J and Xinyang Y (2019) The Joint IOC (of UNESCO) and WMO Collaborative Effort for Met-Ocean Services. Front. Mar. Sci. 6:410. doi: 10.3389/fmars.2019.00410
Received: 29 October 2018; Accepted: 03 July 2019;
Published: 02 August 2019.
Edited by:
Sanae Chiba, Japan Agency for Marine-Earth Science and Technology, JapanReviewed by:
Alessandra Giorgetti, Istituto Nazionale di Oceanografia e di Geofisica Sperimentale (OGS), ItalyHiroaki Saito, The University of Tokyo, Japan
At least a portion of this work is authored by David Legler, Kevin O'Brien, Tim Boyer, Tom Cuff, Eugene Burger, Shelby Brunner, Hernan Garcia, and Eric Freeman on behalf of the U.S. Government and, as regards Dr. Legler, Dr. O'Brien, Dr. Boyer, Dr. Cuff, Dr. Burger, Dr. Brunner, Dr. Garcia, Dr. Freeman, and the U.S. Government, is not subject to copyright protection in the United States. Foreign and other copyrights may apply. This is an open-access article distributed under the terms of the Creative Commons Attribution License (CC BY). The use, distribution or reproduction in other forums is permitted, provided the original author(s) and the copyright owner(s) are credited and that the original publication in this journal is cited, in accordance with accepted academic practice. No use, distribution or reproduction is permitted which does not comply with these terms.
*Correspondence: Nadia Pinardi, bmFkaWEucGluYXJkaUB1bmliby5pdA==