 Fraser Davidson1*
 Aida Alvera-Azcárate2
 Alexander Barth3
 Gary B. Brassington4
 Eric P. Chassignet5
 Emanuela Clementi6
 Pierre De Mey-Frémaux7Prasanth Divakaran4Christopher Harris8
 Fabrice Hernandez9Patrick Hogan10Lars R. Hole11Jason Holt12
 Guimei Liu13
 Youyu Lu14Pablo Lorente15Jan Maksymczuk8
 Matthew Martin8Avichal Mehra16Arne Melsom17Huier Mo13Andrew Moore18Paolo Oddo19Ananda Pascual20Anne-Christine Pequignet8Villy Kourafalou21Andrew Ryan8
 John Siddorn8
 Gregory Smith22Deanna Spindler16Todd Spindler16Emil V. Stanev23Joanna Staneva23Andrea Storto19Clemente Tanajura24
 P. N. Vinayachandran25Liying Wan13
 Hui Wang13Yu Zhang13
 Xueming Zhu13Ziqing Zu13
- 1Oceanography Department, Fisheries and Oceans Canada, North Atlantic Fisheries Center, St. John’s, NL, Canada
- 2GeoHydrodynamics and Environent Research (GHER), Department of Astrophysics, Geophysics, and Oceanography (AGO), Interfacultary Center for Marine Research (MARE), University of Liège, Liège, Belgium
- 3GeoHydrodynamics and Environment Research Group, University of Liège, Liège, Belgium
- 4Science to Services, Bureau of Meteorology, Melbourne, VIC, Australia
- 5Center for Ocean-Atmospheric Prediction Studies, Florida State University, Tallahassee, FL, United States
- 6Fondazione Centro Euro-Mediterraneo sui Cambiamenti Climatici (CMCC), Bologna, Italy
- 7Laboratoire d’Etudes en Géophysique et Océanographie Spatiales (LEGOS), Toulouse, France
- 8Ocean Forecasting Research and Development, Met Office, Exeter, United Kingdom
- 9Institut de Recherche pour le Développement (IRD), Laboratoire d’Etudes en Géophysique et Océanographie Spatiales (LEGOS), Toulouse, France
- 10Naval Research Laboratory, Stennis Space Center, Bay St. Louis, MS, United States
- 11Department of Oceanography and Marine Meteorology, Norwegian Meteorological Institute, Bergen, Norway
- 12National Oceanography Centre, Liverpool, United Kingdom
- 13Key Laboratory of Research on Marine Hazards Forecasting, National Marine Environmental Forecasting Center, Ministry of Natural Resources, Beijing, China
- 14Bedford Institute of Oceanography, Fisheries and Oceans Canada, Dartmouth, NS, Canada
- 15Puertos del Estado, Madrid, Spain
- 16National Oceanographic and Atmospheric Adminstration (NOAA)/National Weather Service (NWS)/National Centers for Environmental Prediction (NCEP), Environmental Modeling Center, College Park, MD, United States
- 17Division for Ocean and Ice, Norwegian Meteorological Institute, Oslo, Norway
- 18Ocean Sciences Department, University of California, Santa Cruz, Santa Cruz, CA, United States
- 19North Atlantic Treaty Organisation (NATO) Science and Technology Organization, Centre for Maritime Research and Experimentation, La Spezia, Italy
- 20Mediterranean Institute for Advanced Studies (IMEDEA), Spanish National Research Council (CSIC), University of Balearic Islands (UIB), Esporles, Spain
- 21Rosenstiel School of Marine and Atmospheric Sciences (RSMAS), University of Miami, Miami, FL, United States
- 22Meteorological Research Division, Environment and Climate Change Canada, Dorval, QC, Canada
- 23Helmholtz-Zentrum Geesthacht, Institute of Coastal Research, Geesthacht, Germany
- 24Department of Earth and Environmental Sciences, Institute of Physics, Federal University of Bahia, Salvador, Brazil
- 25Center for Atmospheric and Ocean Sciences, Indian Institute of Science, Bengaluru, India
Operational oceanography can be described as the provision of routine oceanographic information needed for decision-making purposes. It is dependent upon sustained research and development through the end-to-end framework of an operational service, from observation collection to delivery mechanisms. The core components of operational oceanographic systems are a multi-platform observation network, a data management system, a data assimilative prediction system, and a dissemination/accessibility system. These are interdependent, necessitating communication and exchange between them, and together provide the mechanism through which a clear picture of ocean conditions, in the past, present, and future, can be seen. Ocean observations play a critical role in all aspects of operational oceanography, not only for assimilation but as part of the research cycle, and for verification and validation of products. Data assimilative prediction systems are advancing at a fast pace, in tandem with improved science and the growth in computing power. To make best use of the system capability these advances would be matched by equivalent advances in operational observation coverage. This synergy between the prediction and observation systems underpins the quality of products available to stakeholders, and justifies the need for sustained ocean observations. In this white paper, the components of an operational oceanographic system are described, highlighting the critical role of ocean observations, and how the operational systems will evolve over the next decade to improve the characterization of ocean conditions, including at finer spatial and temporal scales.
Introduction
Oceanographers have long sought to understand, describe, and share their knowledge of the ocean with mariners and other operators in the ocean environment. Mathieu de Maury was one of the first to publish a book on ocean circulation for mariners entitled “The Physical Geography of the Sea and its Meteorology” (Maury, 1864). His work and that of other influential oceanographers in the century that followed provided valuable insight into the attributes and phenomena of the sea and led to significant decreases in transit time across the world’s oceans, resulting in a variety of economic, efficiency, and safety benefits.
With the advent of computers and other technological advances, the capacity to provide useful information about the oceans has expanded significantly. Notable observation capacities that have contributed to this advancement include satellite altimeter in the late 1980s, the coordination of high-resolution satellite-based sea surface temperature (SST) data-sets by the Group for High Resolution SST in the late 90s (GHRSST; Donlon et al., 2007), and the start of the Argo Profiling Program in 2000 (Freeland et al., 2010). Furthermore, since 1991, the Global Ocean Observing System (GOOS)1 has coordinated efforts to generate impactful datasets.
In this paper, we use the term operational oceanography to mean the activity of systematic and long-term routine measurements of the seas and oceans and atmosphere, and their rapid interpretation and dissemination (European Global Ocean Observing system EuroGOOS)2. Operational oceanography systems are comprised of several major components: (1) observations, (2) data management, (3) ocean prediction systems (numerical models and data assimilation), and (4) a dissemination system to stakeholders (see Figure 1 adapted from Schiller et al., 2018). Operational oceanographic systems are information enhancing systems for ocean observations or, more simply, a value chain for ocean observations to meet societal needs (Robinson and Lermusiaux, 2001). High quality observations are therefore a requirement for the systems to be useful.
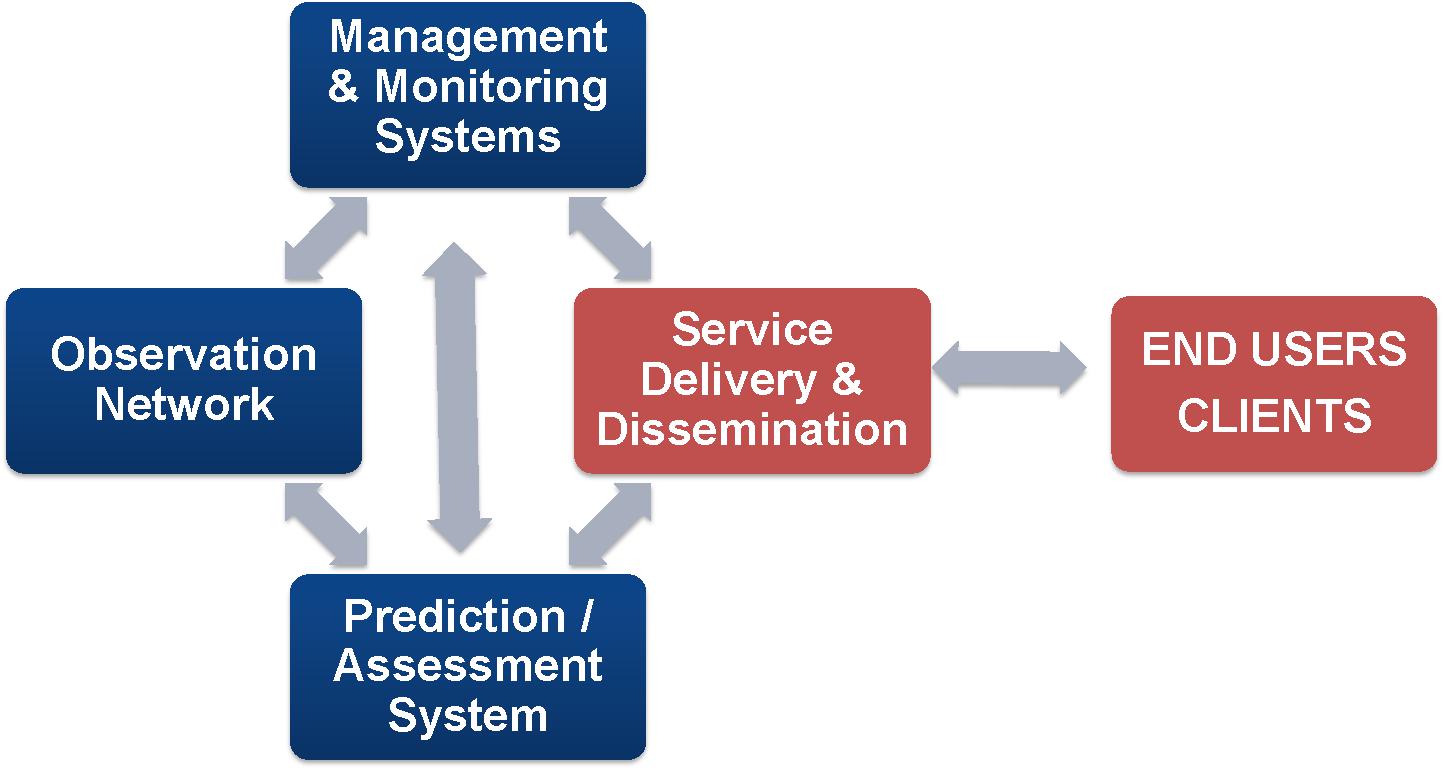
Figure 1. A partition of components of operational oceanography. This figure is slightly modified from Schiller et al. (2018) to better represent the connectivity to Ocean Observations of all components and the flow of information to the end user. Orange boxes are the components related to end use of Ocean Observations and Predictions.
In the late 1990s, the international Global Ocean Data Assimilation Experiment (GODAE) was launched to: (i) demonstrate the feasibility and utility of ocean monitoring and forecasting on the daily-to-weekly timescale and (ii) contribute to building a global operational oceanography infrastructure (Smith and Lefebvre, 1997; Schiller et al., 2018). Building on GODAE, GODAE OceanView was established in 2009 (Bell et al., 2009) to define, monitor and promote actions aimed at coordinating and integrating research associated with multi-scale and multi-disciplinary ocean analysis and forecasting systems.
In 2019, GODAE OceanView will become OceanPredict to continue expanding the activities of GODAE and GODAE OceanView, but with an added emphasis on ocean prediction as part of the broader network of international operational oceanography initiatives. To achieve this goal, OceanPredict will develop close partnerships with entities such as the World Meteorological Organization (WMO), the United Nation’s Intergovernmental Oceanographic Commission (IOC), and GOOS, as well as with organizations that focus on end user needs (e.g., GEO Blue Planet).
Operational oceanography begins with data from a variety of observational platforms that each provide a unique measure of ocean conditions. These include in situ measurements (e.g., moorings, profiling floats, drifters, Conductivity-Temperature-Depth (CTD), tide gauges, etc.) and remotely sensed observations (e.g., satellites and high frequency radars). Ocean prediction systems combine the available curated observations with numerical models through data assimilation methods to estimate the state of the ocean. The ocean models can then be initialized from the analyzed ocean state and run forward in time to forecast ocean conditions hours, days, and even months (when coupled to an atmospheric model) into the future. By evaluating forecast and analysis system outputs against gridded (Guinehut et al., 2012) and un-gridded observations, their accuracy and reliability can be estimated for specific user needs. Results can then be disseminated as data and visual products and made accessible to end users via the web.
The data assimilation techniques used in prediction systems provide valuable information; they can be used to quantify the forecast error as well assess the ability of specific observations to impact the analysis and forecast quality. This is valuable because it can highlight the importance of a particular observing system for a specific application. The operational oceanographic system itself can add value to observational data; outputs from prediction systems are gridded time-varying information that extends the utility of ocean observations far beyond the observation itself, enabling understanding of physical processes, even where no in situ observations have yet been made. This means that ocean prediction systems can provide oceanographic context to localized measurements (e.g., a single mooring or ship transect), which under-sample an oceanic phenomenon (e.g., an oceanic eddy).
This paper is organized as follows. In section Ocean Observations and Data Management, we describe major observation systems, their value to ocean prediction, and data management. In section Ocean Models, the numerical models used in the ocean prediction system are introduced and in section Ocean Data Assimilation, a brief overview of the data assimilation is described. Forecast verification is described in section Ocean Prediction Verification. Section Operational Oceanography Services and Stakeholders covers services and stakeholders and finally, in section Outlook and Recommendations, we provide a vision for improving operational oceanography by strengthening information exchange between observation and prediction groups.
Ocean Observations and Data Management
GOOS, created in 1991 by the IOC to coordinate global in situ observations, established a list of essential ocean variables (EOVs) that were necessary to meet the needs of the user community (e.g., climate researchers, operational services, and ocean health applications). EOVs were determined through criterion of relevance, feasibility, and cost effectiveness. They are categorized by state of readiness, i.e., concept, pilot, or mature. The readiness is evaluated through three elements: (1) requirement processes, (2) coordination of observation elements and data management, and (3) information products (for details)3. The GOOS tracks system performance through:
1. Implementation metrics, such as frequency of observations, number of instruments deployed, age of instruments.
2. Performance metrics in terms of how well phenomena of interest are observed (e.g., percentage of expected coverage and number of measured variables).
3. Data delivery metrics that help quantify how efficiently and adequately the data and information are transferred to users (e.g., transmission delays, adequacy of metadata, satisfaction of data format requirements).
4. Impact metrics that help quantify the usage of the data, information, and products for societal benefit (e.g., number of peer-reviewed publications, number of research projects).
A snapshot of the GOOS major programs and the variables measured is shown in Table 1, adapted from Sloyan et al. (2018). The six main GOOS programs are Argo, the Data Buoy Cooperation Group (DBCP), OceanSITES, the Global Ocean Ship-based Hydrographic Investigation Program (GO-SHIP), the Global Sea Level Observing System (GLOSS), and the Ship Observation Team (SOT), which is comprised of the Volunteer Observing Ship (VOS) and Ship of Opportunity Program (SOOP). Additionally, there is international coordination of two new programs for ocean gliders and tagged animals.
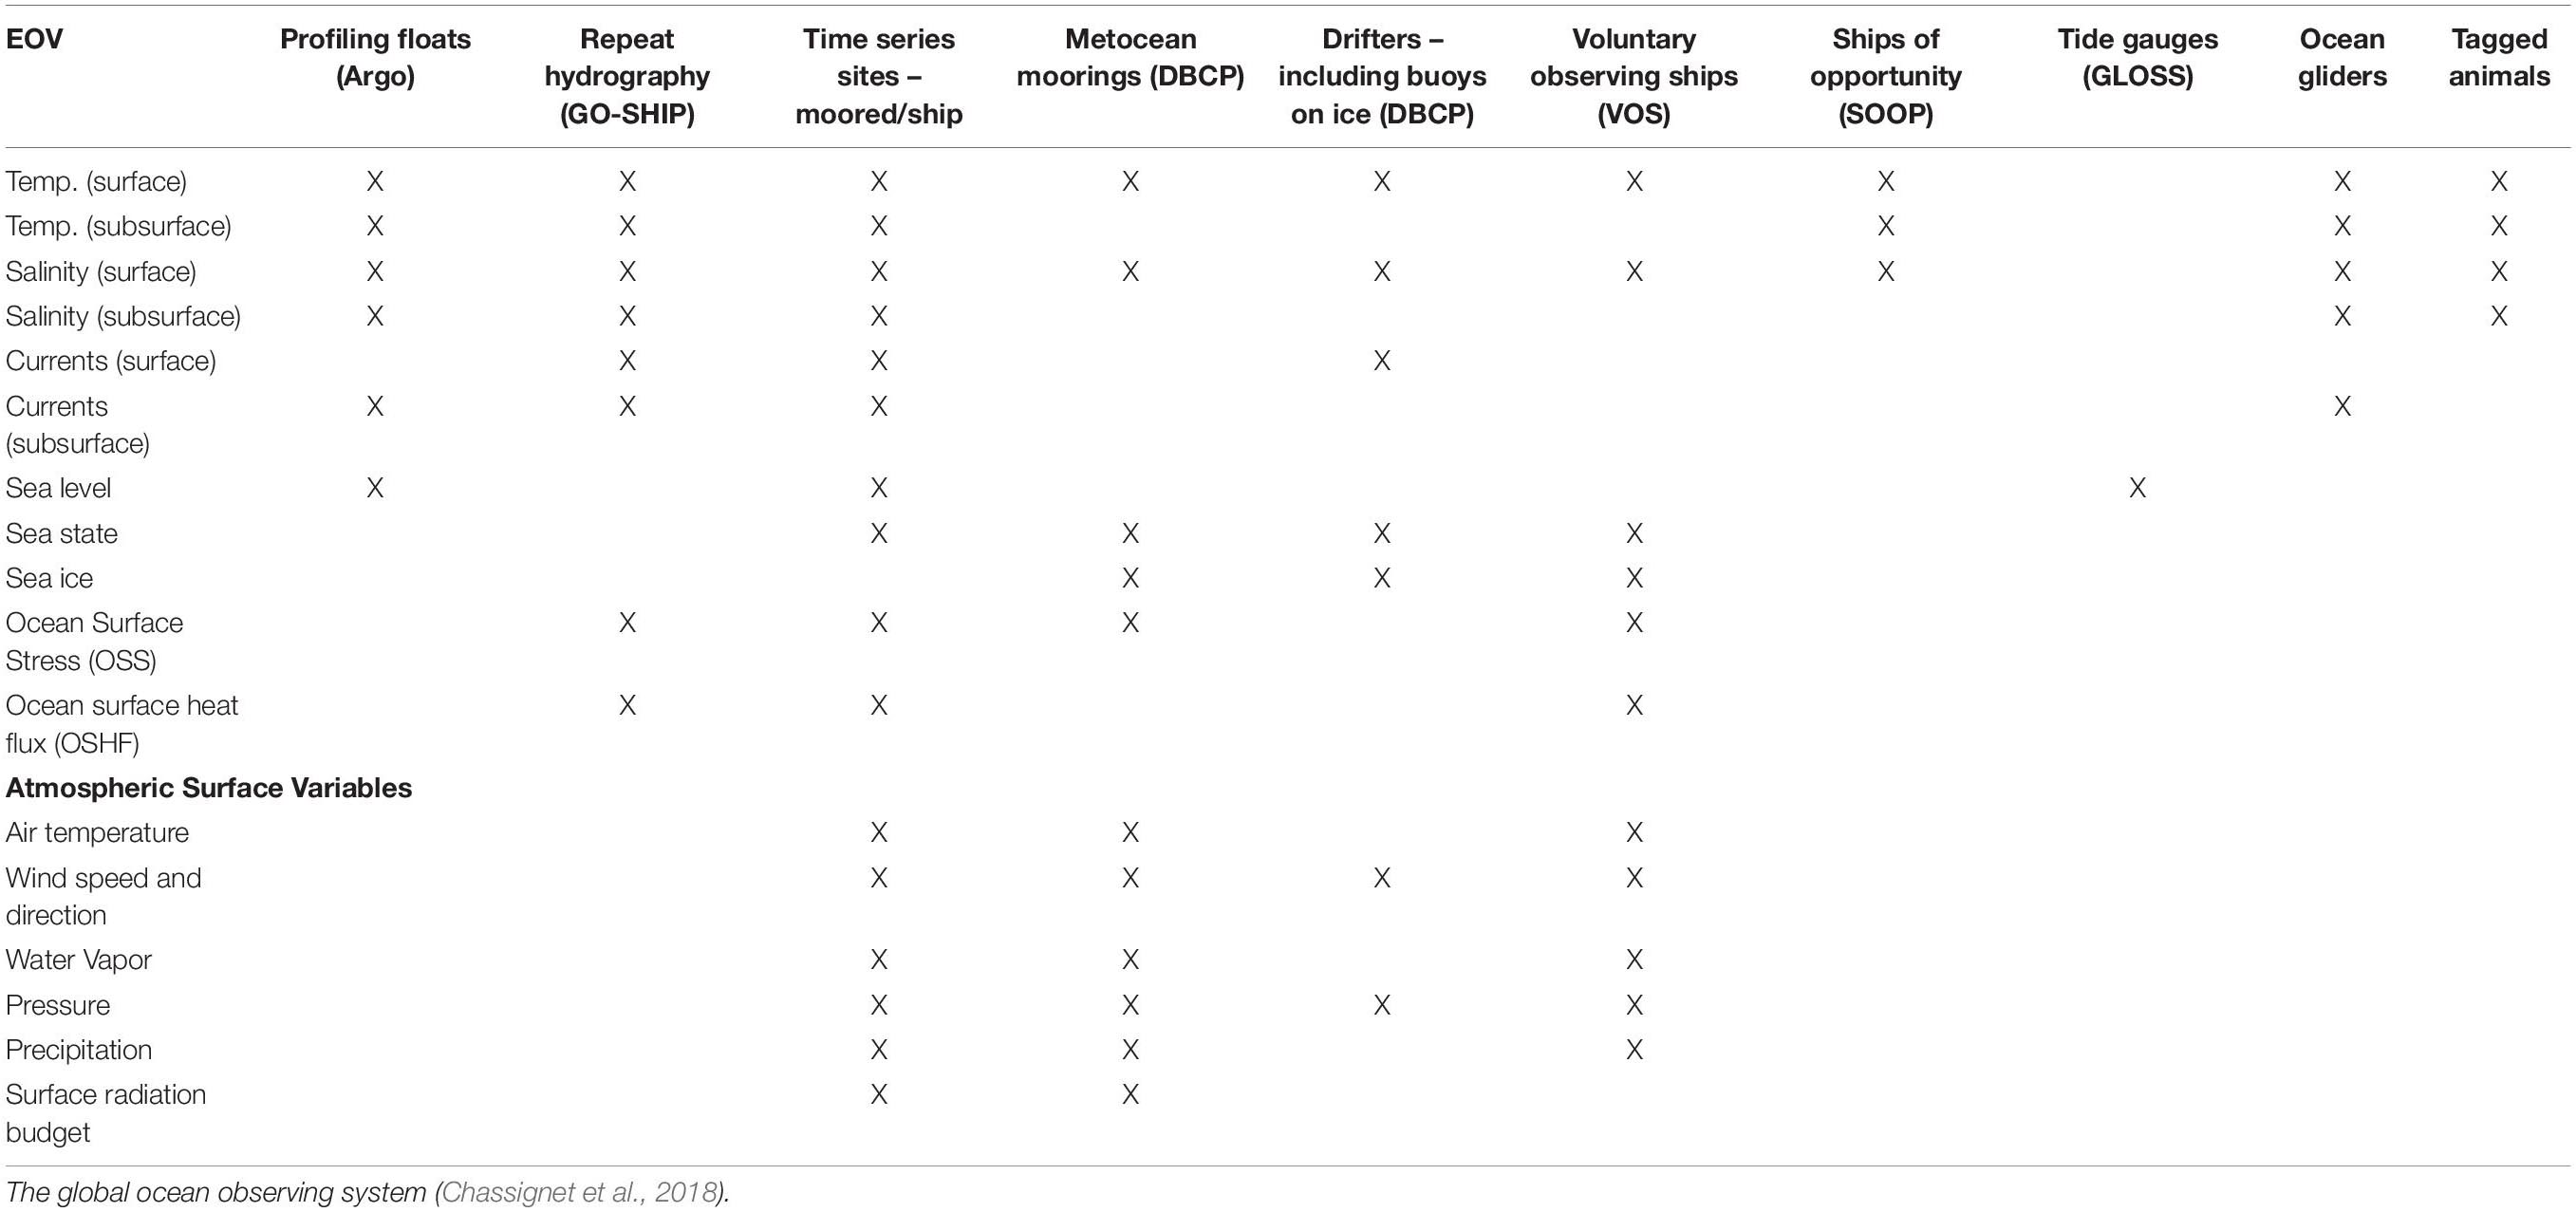
Table 1. List of GOOS programs and variables they collect for ocean and atmosphere (from Sloyan et al., 2018).
The ocean prediction community can deliver more feedback to the ocean observing community, in part, through additional GOOS impact metrics. Specifically, through GODAE OceanView (soon to be OceanPredict), national prediction centers provide annual reports on the capabilities of their prediction systems including which observations they assimilate. If the prediction systems were to also report annually on how each GOOS EOV is used by the various prediction systems, additional metrics for evaluating and tracking the evolution of ocean observing system impact could be made available. In addition, the ocean prediction community would then be able to provide impact statements on the various observation systems and how they influence the assessment and predictions as described in Fujii et al. (2019, this issue). Measurement strategies for new remote and/or in situ ocean sensors can be refined using Observing System Simulation Experiments (OSSEs) and Observing System Experiments (OSEs) conducted with ocean modeling and data assimilation to evaluate and enhance the impact of these observations.
At present, most ocean prediction systems within GODAE OceanView assimilate satellite sea level anomalies (SLA) and SST (Donlon et al., 2012), as well as in situ temperature and salinity profiles. A key observing system for in situ profiles is the Argo array – a global array of free-drifting profiling floats (∼4000) that provides ∼14,000 profiles per year of temperature and salinity in the upper 2000 m of the ocean. This array is complemented by various surface drifting buoys, moored buoys, ship-based observations like CTDs and XBTs, gliders, wave gliders, and animal-deployed sensors. Most of the EOVs observed (see Table 1) in situ are used in ocean prediction systems for assimilation and validation.
Surface drifter assimilation can have a major impact on improving drift prediction from ocean forecast systems (Jacobs et al., 2018). Drifters can be equipped with temperature, salinity, and barometer sensors, and provide an efficient method for monitoring mesoscale features, which they can track for weeks. This is in contrast to classic satellite altimetry, which passes over an area of the ocean every week or more. A current challenge in ocean prediction is improving forecasts of mesoscale features, as these features can have a strong influence on water properties. To benefit from improved data assimilation techniques and computing power, higher density observations are needed that properly measure mesoscale features. Globally, one will have to rely on new satellite missions with increased coverage. Regionally, the in situ observations density can be increased through the use of drifters, which also permit the evaluation of drift projection for various applications, including oil spill response and search and rescue (Davidson et al., 2009).
In the last decade, autonomous vessels have begun to provide significant contributions to real-time in situ observations (Hole et al., 2016) and they are a useful tool for validation of remote sensing observations. One characteristic of ocean gliders and surface wave gliders is their ability to measure fronts and be tasked with a sampling strategy. Field experiments for ocean observations need to acquire useful data for model and remote sensing calibration as well as data assimilation. Due to the intrinsic limits of in situ ocean observing systems (e.g., endurance, the speed of autonomous surface vehicles and autonomous underwater vehicles), effective resource allocation for adaptive sampling would optimize monitoring of oceanic features and phenomena of interest.
Moorings are some of the oldest ocean instrumentation methods, first “modern” tide gauges have provided more than a century of sea surface height estimates (e.g., Church and White, 2011). They are classified as “time series” by the GOOS (Table 1), and they provide at fixed locations and depths repeated measurements of sea surface height, temperature, salinity, currents, nutrients, carbon, or oxygen content. Some may be equipped with cameras and imagers and are networked for real time dissemination of the measurements. Those having a surface structure can also provide atmospheric measurements. Coastal moorings are distributed almost along all continents, are usually maintained by national entities that also performs data quality control, and many of them contribute to the GOOS and their measurements are accessible following international standards. For the open ocean, the OceanSite program and the tropical mooring arrays: TAO/TRITON (McPhaden et al., 2010), PIRATA (Bourlès et al., 2008), RAMA (McPhaden et al., 2009) are the reference data used by operational oceanography. These programs offer high quality data because moorings are replaced regularly, and instruments are calibrated, which implies a strong commitment by the community. Service cruises offer unique opportunities for additional multidisciplinary sampling of the ocean, repeated legs, launch of autonomous instruments, and testing of new sensors by qualified teams [for a complementary discussion, see Foltz et al. (2019, this issue), focusing on the tropical Atlantic Observing System]. The main drawback of moored time series is their poor spatial sampling. Measurements may represent very localized and short scale dynamics, in particular near the coast. However, they may offer very accurate and high frequency sampling of a given phenomenon over very long time, so, in this sense, they complement the permanent evolving spatial distribution of less accurate autonomous sensors like Argo profilers and drifters. Moorings are key for model calibration and for forecast verification, and also for remote sensing instruments calibration and accuracy monitoring.
High frequency radar is a land-based remote sensing instrument that offers unique insight into coastal ocean variability by providing reliable directional wave information and surface current vector gridded maps in near real time for a variety of temporal scales and at high spatial resolutions. The high frequency radar network has grown worldwide rapidly in the past decade and is becoming an essential component of coastal ocean observation systems (Rubio et al., 2017). Accurate high frequency radar estimations can be used as benchmark for the rigorous skill assessment of operational wave and circulation models in key coastal areas (Lorente et al., 2016) or can be optimally combined with ocean circulation models via data assimilation to enhance the model predictive skills.
With regards to satellite remote sensing of the ocean, three new satellite observation systems have the potential to enhance the view of the ocean from space and provide new observations for ocean prediction improvement. The first, the Surface Waves Investigation and Monitoring (SWIM) instrument (Hauser et al., 2017), was deployed in 2018 as part of the China-France Oceanography SATellite (CFOSAT) mission. The SWIM system uses a rotating radar beam and measures surface winds and waves, which will help achieve better calculations of surface fluxes at the air sea interface and provide more accurate wind and wave forcing. The second will be the wide-swath Surface Water and Ocean Technology (SWOT) altimeter scheduled to launch in 2021, which will provide two-dimensional observations of sea surface topography at kilometer resolution over a 120 km swath. This will be equivalent to having multiple Nadir altimetry satellites and provide much more detailed observations of sea surface height than are currently available. Wide-swath altimetry has the potential to provide a step change in ocean forecast performance through: (i) high spatial coverage with instantaneous two-dimensional snapshots of surface gradients leading to more dynamically balanced initial conditions for forecasts; (ii) high data coverage leading to a reduction in observation latency and thereby permitting higher forecast skill during the forecast period; and (iii) estimates of river discharge from major rivers leading to major improvements for ungauged rivers and estimates for international rivers. These improvements will be useful for coastal and shelf areas as well as in deeper water for tracking mesoscale features and better resolving front areas. The third satellite is the Sea Surface KInematics Multiscale (SKIM) monitoring mission proposed by Ardhuin et al. (2018). If approved, the SKIM proposal is expected to deliver estimates of ocean surface currents and surface waves. In addition to constraining the surface current, it will complement altimetry and Argo observations. Altimetry only measures the geostrophic component of surface current, whereas SKIM would provide the total current including the Ekman component. The addition of wave observations will allow better representation of wave current interaction, air-sea fluxes, as well as track ocean convergence zone for marine plastic debris. The three new satellite systems combined with evolving in situ data programs will enable ocean prediction systems to better reproduce mesoscale features in the ocean and increase forecast accuracy.
Finally, it is important to mention that satellite measurements of sea surface salinity (SSS) are becoming more reliable and that current missions are able to provide synoptic measurements of SSS over the global ocean with spatial scales that are much finer that those provided by the Argo array. Planned enhancements are to increase the spatial resolution to better resolve mesoscale features and to improve the accuracy of the satellite SSS observations, especially at high latitude (see Lee and Gentemann, 2018, for a review).
Ocean data management is essential for the proper distribution of data to the operational systems. This is addressed by several other papers in this issue (e.g., Pearlman et al., 2019; Tanhua et al., 2019), so it will not be addressed in detail here. Observations networks that follow the FAIR (findable, accessible, interoperable, and reusable) data management principles are an asset for operational oceanography but not necessarily sufficient, as will be discussed below. Observations are used in operational oceanography for validation, verification, real-time assimilation, and reanalysis assimilation. For validation (defined as assessing the quality of a system) and assimilation into reanalysis systems, there is the need for a standard set of quality-controlled observations, ideally perhaps with temporal consistency to ensure no aliasing from the observing network. In cases such as these, the FAIR principles are critical. For verification (defined as monitoring the quality of products in operations) and assimilation in real-time there is the additional requirement for timeliness and robustness of observation availability. Real-time prediction systems normally operate on daily or more frequent cycles, ingesting observations from the near past. A data management system capable of delivering observations with associated information about the quality of the observation on a timescale suitable for real-time systems is also much needed. Timeliness is likely to become increasingly stringent as operational oceanography and operational meteorology come together in coupled ocean-atmosphere prediction systems. The rapidly evolving nature of the atmosphere and the need for rapid updates of information for users of these coupled systems will increasingly drive the timescale requirements and observations available within 3–6 h will become increasingly valuable.
The real-time and delayed mode observations needed for operational oceanography means that there must be two versions of each observation; one with automated, robust quality control that is available for use in real-time, and the other one with the best available quality control, often including manual intervention, but available with a longer delay and expected to offer improved accuracy level. To ensure traceability, a data management system capable of managing both options is required. Data providers are often unwilling to release observations until they are in the best form possible. However, from an operational oceanography perspective it is critical to have metadata that clearly flag what quality control has been undertaken and the error characteristics of each observation. That way, useful information can still be extracted, even when the observation is not as well quality controlled as the observation owners would like. As operational oceanography expands from the traditional surface waves and hydrography into chemistry and biogeochemistry where quality control is often less-easily automated and less observations are available in real-time, this will increasingly be an issue. Extending data management protocols similar to those used for drifting buoys and traditional Argo observations of profile temperature and salinity to other observation types is key to adding value to these observations from operational ocean systems. Additionally as indicated by Smith et al. (2019), all the above mentioned observation systems are needed to provide coverage in Arctic waters, for the prediction systems, as these are areas that are quickly evolving under global warming.
Ocean Models
Ocean numerical models are one of the essential building blocks of global and regional operational oceanography systems. A comprehensive operational system includes models that solve governing equations for ocean currents, sea levels, temperature, salinity, sea-ice, surface waves, and concentrations of tracers relevant to environmental or biogeochemical processes.
Over the past decade, ocean circulation models have evolved through improved understanding, numerics, spatial discretization, grid configurations, parameterizations, data assimilation, environmental monitoring, and process-level observations and modeling (see companion paper by Fox-Kemper et al., 2019, for a review). Increases in computing power and the improved physical consistency of their numerical formulation (Griffies et al., 2000) have allowed current state-of-the-art ocean circulation models to routinely resolve oceanic flows down to mesoscales globally, sub-mesoscale regionally, and detailed structure in the coastal ocean down to harbors (e.g., Álvarez-Fanjul et al., 2018; Le Sommer et al., 2018; De Mey-Frémaux et al., 2019, this issue). Ocean models that do not include observational data assimilation are mostly used to scientifically explore underlying ocean mechanisms via idealized or realistic configurations. In conjunction with data assimilation, they are used to extrapolate in space and in time the available discrete oceanic observations to build a physically consistent estimate of the ocean state and its evolution. This, in turn allows for the creation of reanalysis products that can describe past evolution (Ferry et al., 2012; Carton et al., 2018; Wunsch, 2018), or initial state to perform forecasts (Chassignet and Verron, 2006; Dombrowsky et al., 2009; Schiller and Brassington, 2011; Bell et al., 2015; Chassignet et al., 2018). Observational data via data assimilation sets the stage for model state estimates and forecasts (Chassignet et al., 2009), with the quality of the estimates and the forecast being strongly dependent upon the ability of an ocean numerical model to faithfully represent the resolved dynamics of the ocean and the parameterized subgrid scale physics.
Besides capturing large-scale ocean features, there is a strong need for the ability to predict the variety of spatial and temporal scales near the coastlines where a large part of the world’s population lives. This poses both an observational as well as a modeling challenge and necessitates the development of suitable coastal ocean forecasting systems, capable of providing the backbone for societal and management needs (Kourafalou et al., 2015a, b). Models have to be able to resolve interactions between nearshore, estuarine, and shelf processes (10–100 m resolution is needed to resolve these processes), as well as open ocean processes, which are reasonably represented with a resolution of one to several km. One solution to this problem is multiple-level nesting used in many applications as one-way nesting; thus, the upscaling is neglected (see, for example, Shan et al., 2011; Schulz-Stellenfleth and Stanev, 2016; Urrego-Blanco et al., 2016; Stanev et al., 2017). A lot of progress has been made recently in the development of unstructured grid models (see Fox-Kemper et al., 2019, for a discussion) because they enable full interaction between different scales, but unstructured grid models have not yet reached the level of maturity required for them to become fully operational on a global scale. The benefits of regional modeling over the driving global models are generally assumed, and a growing number of studies are investigating the added value of such an approach (Katavouta and Thompson, 2016; Holt et al., 2017; De Mey-Frémaux et al., 2019, this issue).
Ensemble forecasts allow for the incorporation of the uncertainties in forecasts, coming from uncertainties in the forecasting system including those from atmospheric forcing fields, observations, initial conditions, and model parameters. They provide an ensemble of likely model results and an ensemble forecast effectively includes also the uncertainty due to the inherent chaotic nature of the ocean (Büchmann and Söderkvist, 2016). This approach can be extended to use models of different types (Taylor and Brassington, 2017) to have a better representation of the uncertainty in order to include (at least partially) the effect of systematic errors (Golbeck et al., 2015). From such ensembles, one can then derive the uncertainty of the model forecast expressed often as the ensemble standard deviation. Alternatively, it is also possible to compute the probability of some events (e.g., ocean currents) exceeding a given threshold or the probability of finding a drifter within a given search area. In order to provide a suitable ensemble forecast, it is also necessary to validate the reliability of the probabilistic forecast (Candille et al., 2007; Yan et al., 2017). One of the main applications of ensemble forecast is to optimally reduce the model uncertainty using observations with e.g., data assimilation (section Ocean Data Assimilation) or other approaches like Bayesian Model Averaging (e.g., Salighehdar et al., 2017).
Dynamically, variations of ocean circulation are coupled with that of sea-ice, waves and atmospheric physics. Coupled systems are needed for improved representation of physical processes across oceanic boundaries, which are important not only for seasonal to climate timescales, but also for short-range forecasts (Brassington et al., 2015). A high-resolution coupled wave, circulation, and atmospheric system that accounts for the non-linear feedback between the upper ocean and the atmosphere through wave interface, reduces prediction errors in the coastal ocean, especially under severe extreme conditions (Staneva et al., 2017; De Mey-Frémaux et al., 2019, this issue). While deterministic modeling systems can provide good accuracy at short-term weather time scales, longer subseasonal-to-seasonal scales need ensemble-based modeling systems to capture the uncertainty and predictability (or lack thereof). As such modeling systems evolve, there are significant choices to be made regarding the competing needs for refined resolution to enhance the fidelity of resolved flow features; increased component complexity/capability to allow for the representation of otherwise missing processes and feedbacks; and increased numbers of ensemble members required to extract a signal from the noise (Hewitt et al., 2017). Finally, additional work is needed to include biogeochemical models in the forecasting systems. Also, in anticipation of high-resolution altimetry from SWOT in 2021, an increase in the global models’ horizontal resolution would be timely (Lellouche et al., 2018).
Ocean Data Assimilation
Incorporating observations into a prediction system via data assimilation is crucial for operational forecasting and reanalysis systems to obtain accurate estimates of the ocean state. Numerous data assimilation algorithms have been developed and applied in operational ocean forecasting systems. Most global operational global ocean forecasting systems apply three-dimensional methods such as 3DVar or Ensemble Optimal Interpolation (and its variants) (Martin et al., 2015), while regional and shelf-seas systems use a wide variety of methods including more advanced methods such as the Ensemble Kalman Filter (e.g., Sakov and Sandery, 2015) and 4DVar (e.g., Edwards et al., 2015). As the available computational resources increase, many of the global ocean forecasting centers are developing implementations of these more advanced methods (Nerger and Hiller, 2013), as well as hybrid ensemble/variational methods. An example of EnKF applied to a global ocean model is shown in Figure 2. This represents the ensemble standard deviation for temperature at a model depth of 65 m from a 96-member EnKF applied to a global ocean model (Oke et al., 2013). The EnKF system is based on that described in Sakov and Sandery (2015) and is configured in a 3 days cycle, using localization of 150 km for SLA and SST and 450 km for T and S profiles; and uses a 3% capped inflation and simple random perturbation to the atmospheric forcing. The gain in performance of approximately 7, 15, 15, and 29% for SST, SLA, T, and S respectively over an operational system based on EnOI is shown in Table 2. In addition to performance gains this system provides a 96-member ensemble that can be exploited for probabilistic forecasting. For a brief overview of data assimilation and its application in operational ocean forecasting and reanalysis systems, see Moore et al. (2019) in this issue.
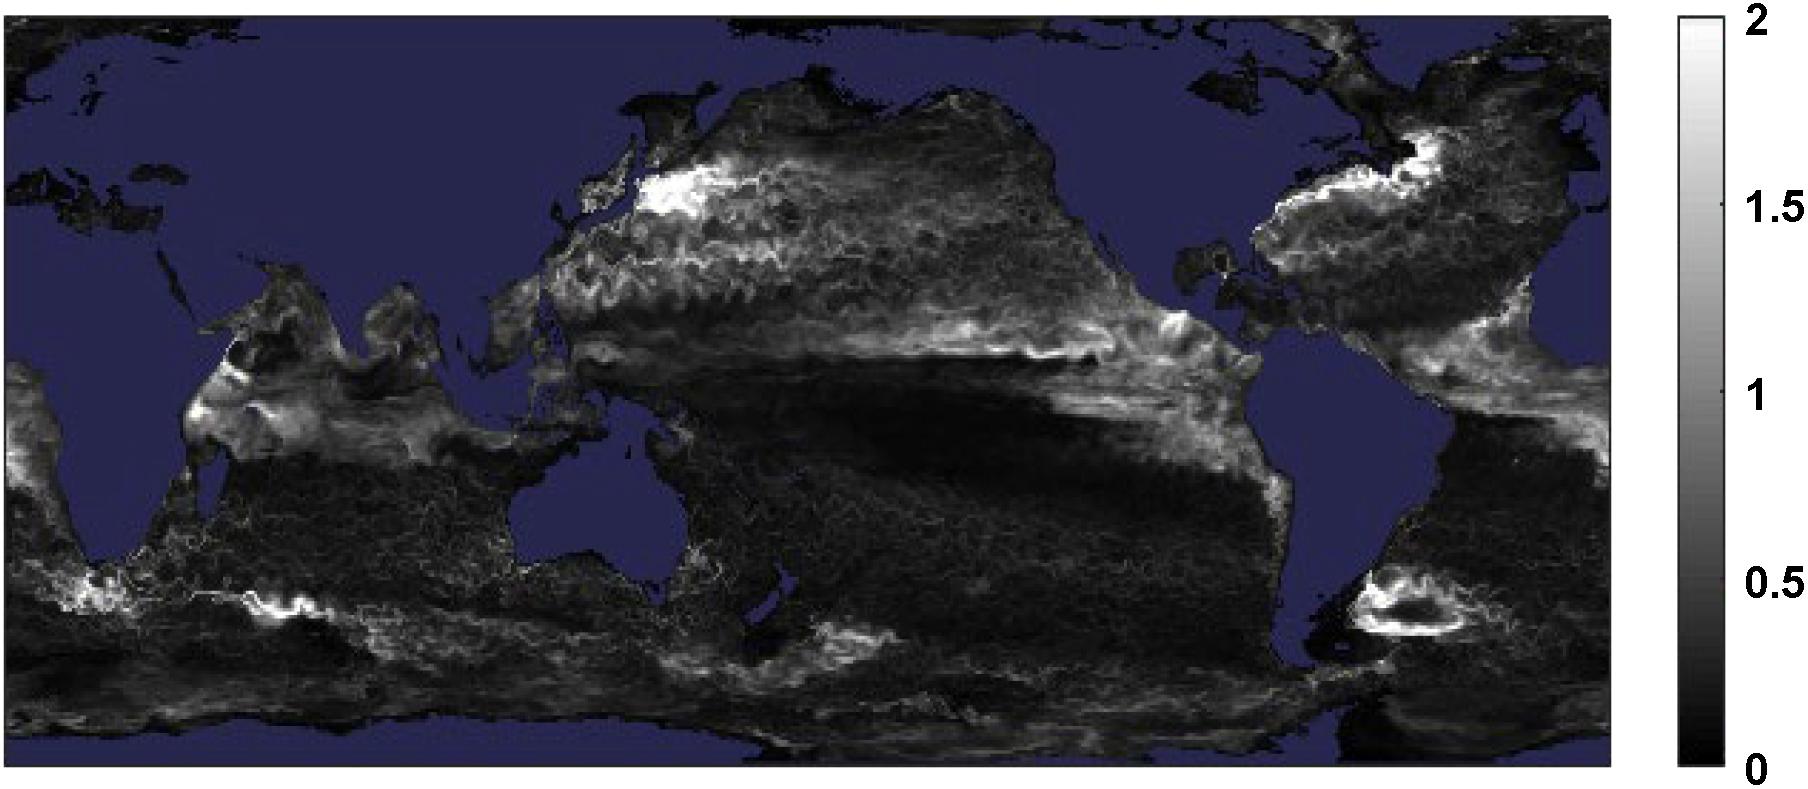
Figure 2. Ensemble standard deviation of temperature (°C) at the model depth of 65 m. A daily snapshot from a 2 year hindcast using a 1/10 degree, 51 vertical level implementation of MOM4p1 and a 96-member ensemble Kalman Filter data assimilation of satellite altimetry, satellite SST and in situ profiles. The colorbar is in degrees C.
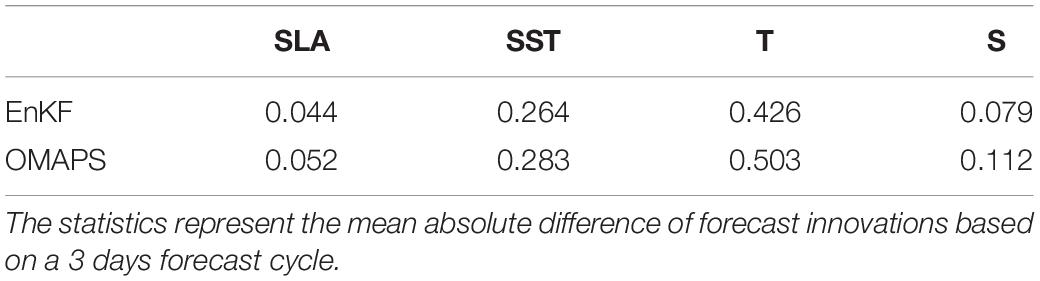
Table 2. Performance summary table of a BlueLink ensemble Kalman filter hindcast compared with the current OceanMAPS system using ensemble optimal interpolation.
The accuracy of the analysis and subsequent forecasts produced by data assimilation is dependent on the accuracy and coverage of the input observations, the fidelity of the numerical model, and the quality of the data assimilation scheme itself. The extensive and routine use of many different observing platforms in operational forecasting and reanalysis systems requires significant interaction between the assimilation and observing communities. In some areas these links are well established, but in others there could be considerable benefit to both communities by strengthening the links. Below we describe some examples of where feedback from the assimilation to observing communities, and vice versa, should be improved.
Assimilation systems require information about uncertainties in the observations and the model forecast. The observation errors are usually considered as two components: the measurement error, and the representation error (which accounts for the fact that the models do not represent all the physical processes and scales that a particular observation measures; Janjić et al., 2018). For some observation types there is considerable information available to the assimilation systems about the measurement errors; for instance, satellite SST datasets available through GHRSST provide per-observation uncertainty estimates. In other observing systems, and particularly for new satellite observations, there is a need to ensure that measurement uncertainty estimates are available to assimilation systems. The representation errors estimated by the forecasting community for assimilation systems with different spatial and temporal characteristics could allow the observation community to better characterize the information content of the observations, although representation errors also depend on the specificity of the individual prediction systems (e.g., in terms of spatial resolution and resolved processes).
Quality control is carried out by many of the data assembly centers which provide observations to assimilation systems, both in real time and delayed mode. Real time assimilation systems also carry out an automatic quality control step using various information including short-range model forecasts (e.g., Storto, 2016). This is a critical component of operational ocean forecasting systems since the assimilation of erroneous observations can severely degrade forecast quality. The information about which observations have been removed from the operational assimilation systems could be very valuable for the data assembly centers to assess and improve their own quality control methods, and to provide input to the delayed-mode quality control process. This would be particularly valuable if information from multiple forecasts systems were combined, as was tested by Wedd et al. (2015). Methods such as Observing System Experiments (OSEs) and Observing System Simulation Experiments (OSSEs) are often used to provide information about observation impacts on data assimilation systems (Fujii et al., 2019). While there have been examples of the use of OSEs to provide information about observation impacts in real time (Lea et al., 2014), they are expensive and this approach has not been widely adopted. There are various other methods for providing observation impact information including Forecast Sensitivity to Observations (FSO; Cardinali, 2009) and Degrees of Freedom for Signal (DFS; Cardinali et al., 2004), along with applications of adjoint-based sensitivity metrics to regional ocean dynamics (Moore et al., 2017). Such information is then disseminated regularly as part of the prediction systems. It is recommended that efficient methods to assess impact of observations in operational ocean forecast systems be implemented in real time. The resulting information should be combined from multiple centers and made available to the observing community.
It would be possible to go further than this and use diagnostics from assimilation systems to target observations. For instance, forecast uncertainty estimates from assimilation systems (based on either variational methods or ensemble spread) could be used to determine the regions where new observations would have the most impact. Some studies have been carried out to assess its feasibility in the ocean (e.g., L’Hévéder et al., 2013), but more work is needed, taking account of the large number of studies carried out in the atmospheric context (Majumdar, 2016).
Data assimilation systems estimate gridded fields of corrections (called analysis increments) that bring the model close to the observations, accounting for their respective errors. The time average of these increments provide information about systematic errors, either in the model or in the input observations. While it can be difficult to disentangle the effect of systematic errors in the model and observations, this information can be valuable for understanding the biases in the system. Comparison of average analysis increments across multiple assimilation systems that use different models could allow observation biases to be uncovered and help improve the models (as illustrated by Martin et al., 2015). Some data assimilation systems also directly estimate the biases in satellite observations, and this information should be shared with data providers to improve understanding of the data.
Ocean Prediction Verification
Verification of ocean predictions has gradually evolved using metrics (Crosnier et al., 2006), defined as sets of diagnostics that compute scalar measures from ocean forecasting systems outcomes, providing not only objective quality indicators that can be quantitatively compared but also uncertainty estimates and error levels (Hernandez et al., 2015). These metrics allow for evaluation of the accuracy of ocean estimates, the forecast skill, and the reliability for use in services (Hernandez et al., 2009, 2018). The metrics also establish if and how a new change in the model, data assimilation scheme or system setup has contributed to a better result and allow an ongoing monitoring of the quality of forecasts. Evaluations can be conducted in a number of ways including looking at conservation of certain quantities in the model, ensuring appropriate energy spectrum distribution, inter comparison with reference models, or comparing prediction output to observations. There are a variety of challenges in developing an ocean model verification method that includes remote and in situ data. In particular, a characterization of the observations is required to understand and quantify the information content (scales, observed part of the spectrum) and any random and systematic measurement errors (e.g., spatial representation and temporal sampling. Verification is ideally made using independent observations that are not assimilated into the model itself. The GODAE community adopted the four-types metrics approach (Hernandez et al., 2015), including gridded model output (Class-1), time-series at specified locations and sections (Class-2), transports through sections and other integrated quantities (Class-3), and metrics of forecast skill (Class-4).
Class-1 metrics provide a general overview of ocean and sea-ice dynamics from the different systems using diagnostic two-dimensional fields, such as sea surface height, wind stress, solar and net heat fluxes, total freshwater fluxes, and mixed-layer depth or three-dimensional fields such as temperature, salinity, and currents. Class-1 metrics are defined as analysis of fields on pre-defined grids. Implicitly, grid characteristics define the spatial scales at which ocean forecast and gridded observations can be compared for a given phenomenon. For example, at NWS/NCEP, three products were selected, a SSALTO/DUACS multi-mission altimeter product produced and distributed through the Copernicus Marine and Environment Monitoring Service (CMEMS; Pujol et al., 2016), the NCEP/EMC real-time, global SST analysis (Gemmill et al., 2006), and an NCEP/EMC ice concentration analysis (Grumbine, 1997). These products are then routinely compared against real-time model derived analysis fields for monitoring and verification (Carrieres et al., 2017). Visualizations of the difference fields for sea surface height and SST and sea ice concentration are created (Goessling et al., 2016) along with descriptive statistics (root-mean-square error, bias, correlation coefficients, and scatter indexes). Figure 3 shows an example of Class-1 verification of Arctic sea ice concentrations comparing the global NCEP RTOFS model outputs and NCEP sea ice analyses.
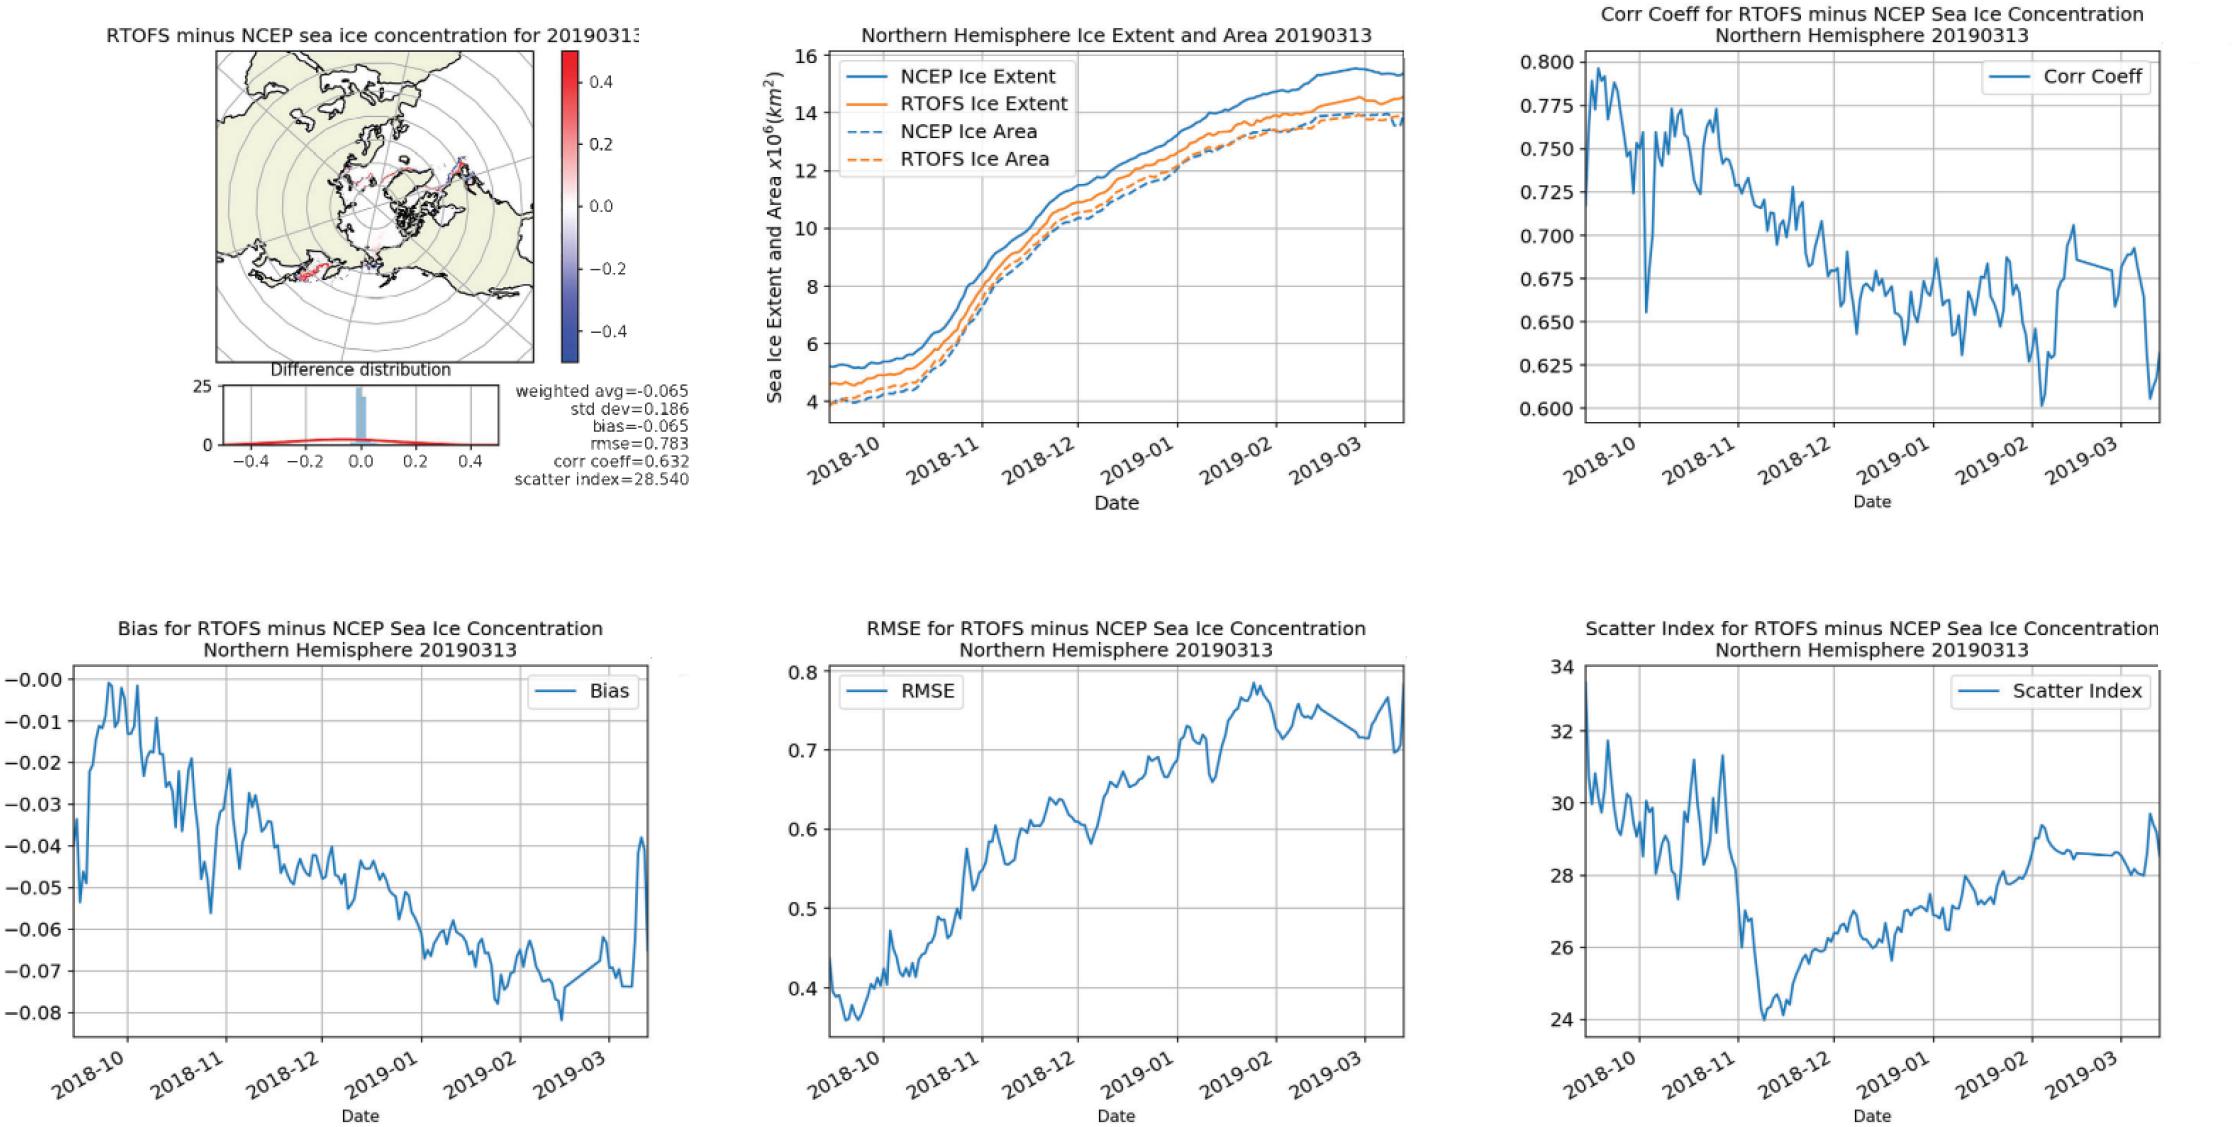
Figure 3. Class-1 metrics of Arctic ice concentrations comparing Global RTOFS model results and NCEP Ice Analysis. Difference field of sea ice concentrations for a single day and time series of descriptive statistics collected for the previous 180 days.
Class-2 verification for global systems includes vertical sections extracted from the model along 47 defined World Ocean Circulation Experiment (WOCE) sections, with visualizations using contour intervals corresponding to similar WOCE graphic images (Schlitzer, 2000). It can capture, at a specific location for part of or the entire water column, the time series of observed phenomena and assess how operational systems provide the same vertical EOV distribution for the same frequency. Mooring and repeat sections are considered here. Typically, Class-2 moorings are computed in delayed mode: real-time transmission of mooring data (OceanSite, PIRATA, RAMA, TAO-TRITON…), or VOS and research vessel data is not always possible, although new technologies, like T-Flex tropical moorings and Iridium satellite transmission allow expanded and real time data transmission.
Class-3 verification uses derived products instead of directly observable quantities. For instance, the ongoing NOAA program that measures the total volume transport of the Florida Current across an unused telephone cable laid between West Palm Beach, Florida, and Eight Mile Rock in the Bahamas (Baringer and Larsen, 2001) is used by NCEP for verification. Another Class-3 data set is an approximately biweekly set of ocean frontal positions supplied by the US Naval Oceanographic Office (NAVO) and the US Naval East Ocean Center (NAVEASTOCEANCEN) (Mesick et al., 1998). In this data set, three fronts are analyzed – the North Wall of the Gulf Stream, the Loop Current in the Gulf of Mexico, and the Kuroshio Current. The frontal positions of both the Navy analyses and the Global RTOFS data are mapped, and a metric is used to compute the geometric distance between the two fronts (Dubuisson and Jain, 1994). Such observational programs require significant resources, manpower, and expertise.
Class-4 metrics aim to measure the performance of a forecasting system, its capability to describe the ocean (in hindcast mode), as well as its forecasting skill (analysis and forecast mode). Class-4 metrics are model and observation products defined in the observational space, i.e., the operational system is evaluated where observations are gathered. Class-4 metrics can be applied in delayed mode or in real time, knowing that in real time, less observations are available. Near real-time monitoring of ocean performance through Class-4 metrics has been one of the more successful outcomes from GODAE OceanView, and it is the backbone of the CMEMS product quality evaluation. Since 2013, the GODAE Ocean View Intercomparison and Validation Task team have been comparing analyses and 7 days forecasts for several global operational systems (Figure 4) (Hernandez et al., 2015; Ryan et al., 2015). Regional operational systems are now also involved, and this framework is expected to be endorsed and adopted by the Joint Technical Commission for Oceanography and Marine Meteorology (JCOMM). At present, comparisons are based on altimetry (sea surface height), Argo (temperature/salinity vertical profiles), and drifting buoys (SST). Buoy trajectories will soon be used to assess surface velocities.
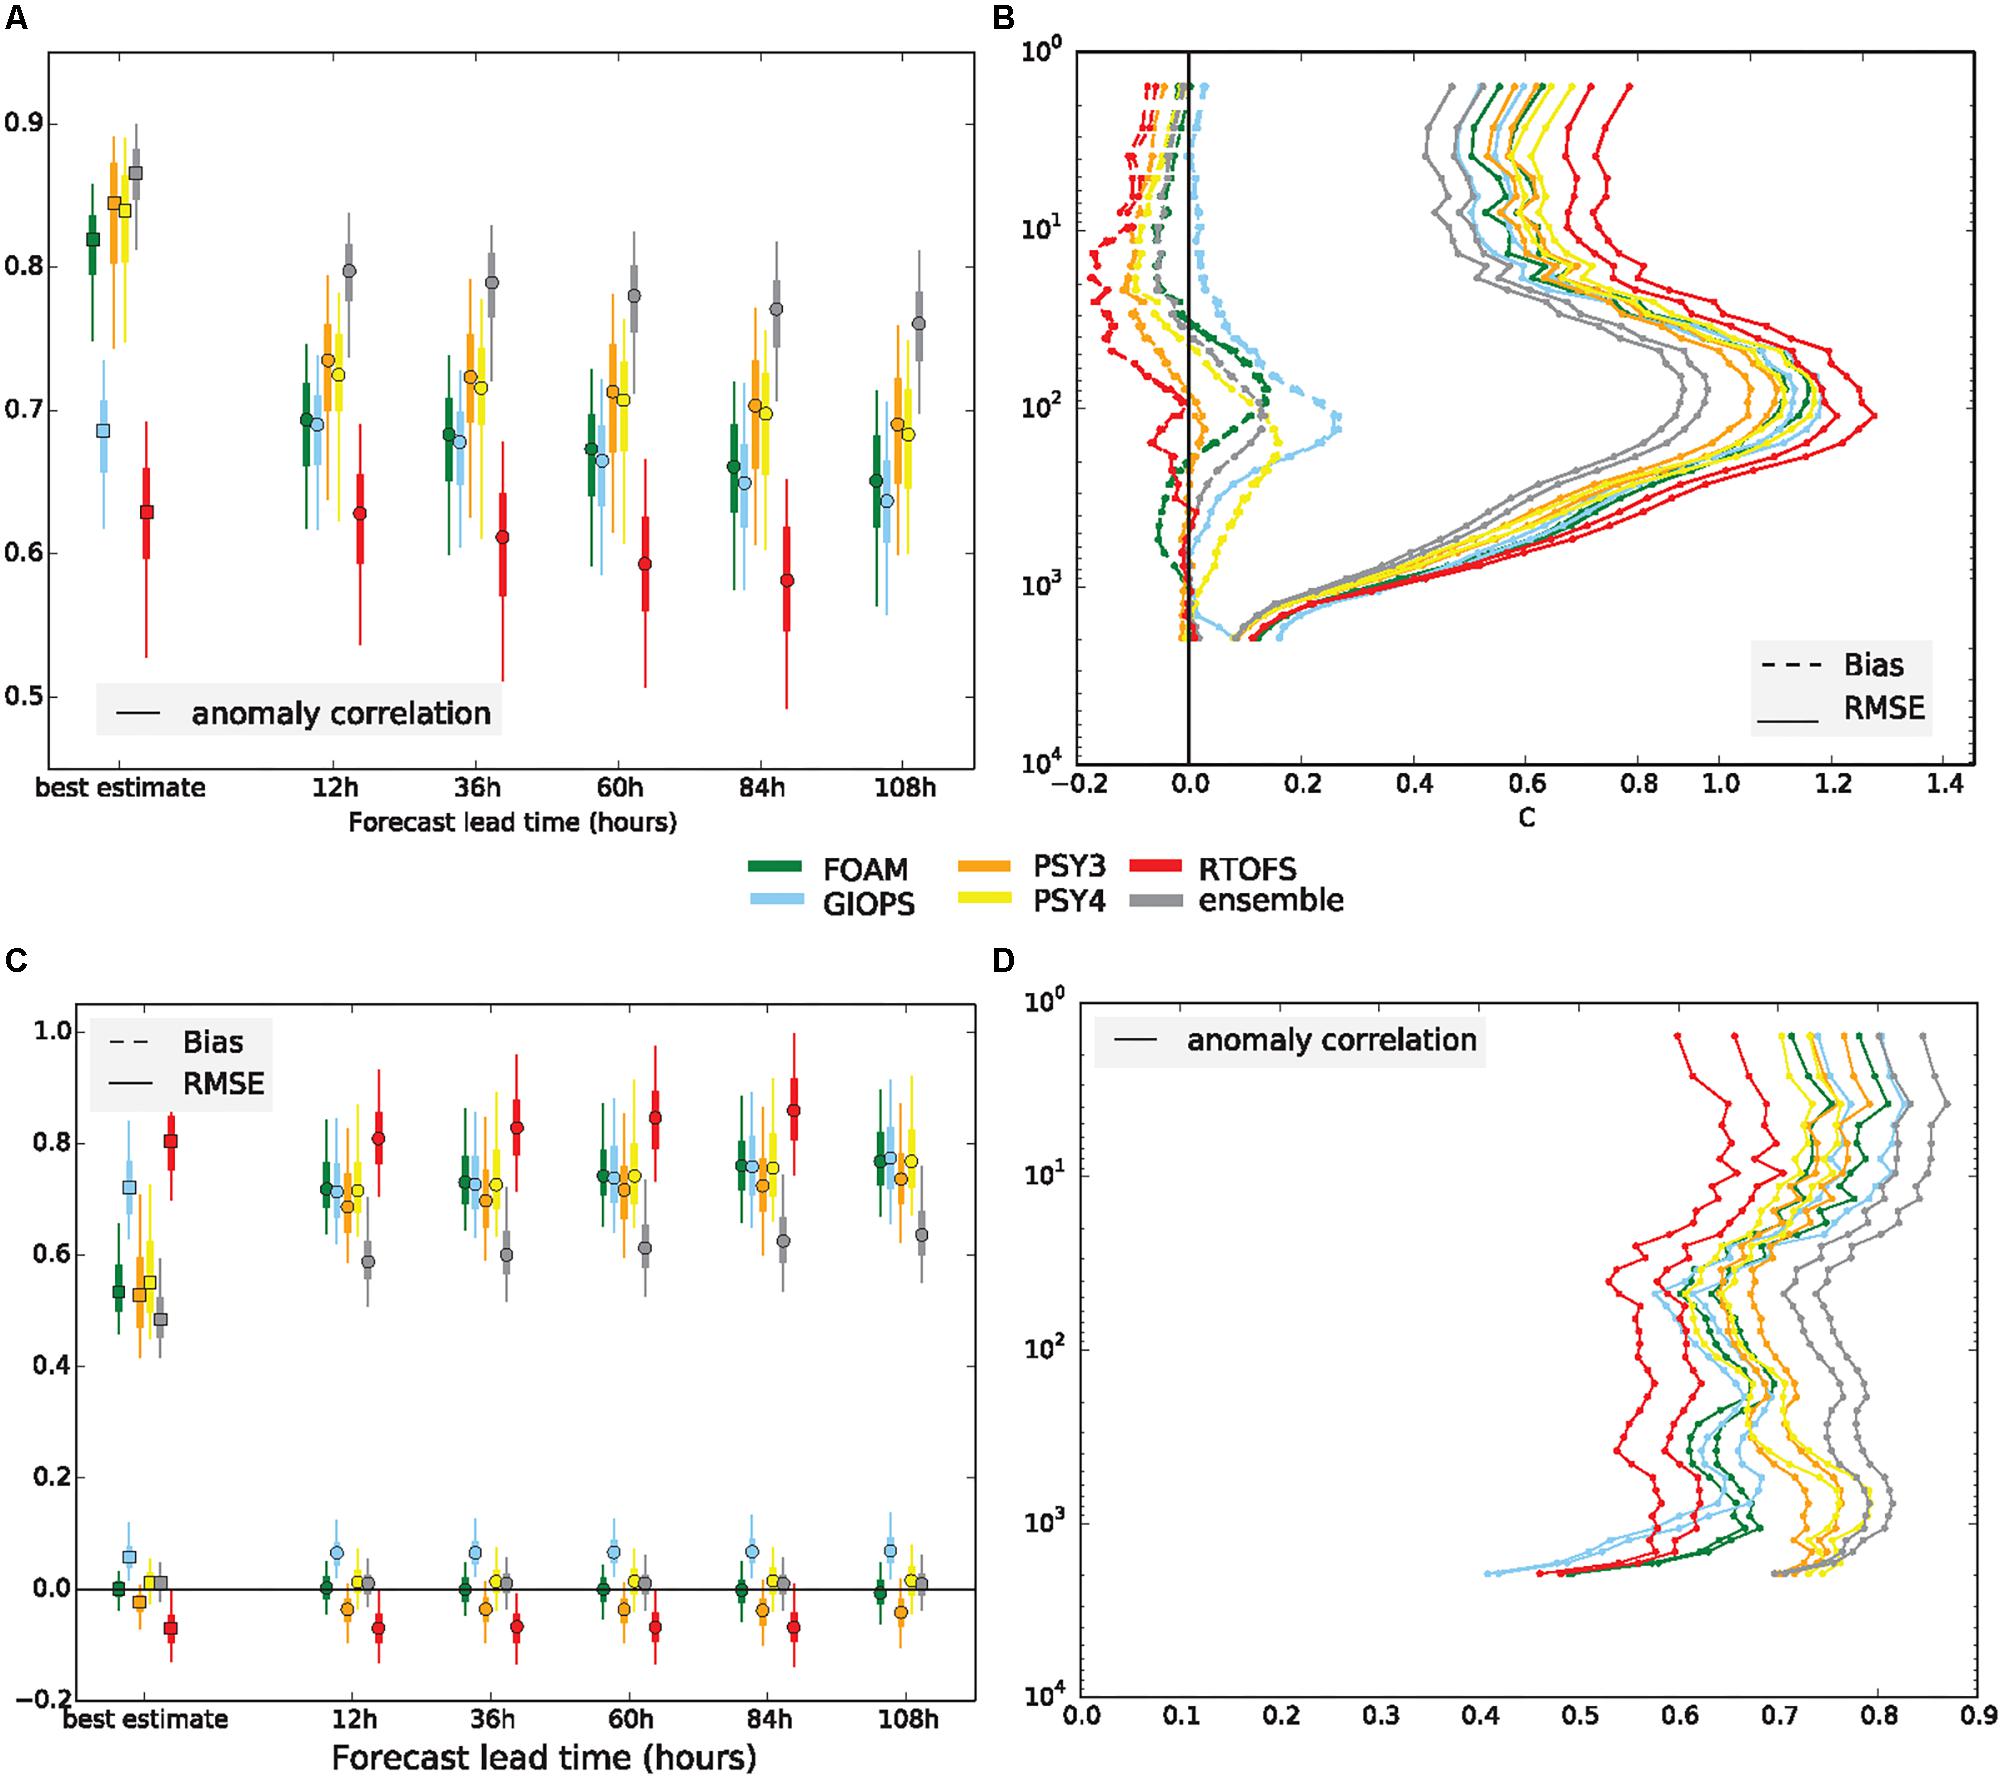
Figure 4. Example of class 4 metrics from Ryan et al. (2015). Forecast accuracy against temperature measurements taken by Argo. (A) RMSE/bias as a function of forecast lead time. The boxes are the interquartile range and the 95th percentile. (B) RMSE/bias of 12 and 84 h forecasts as a function of depth, the vertical axis is logarithmic. (C) Similar to (A) with anomaly correlation as the metric. (D) Similar to (B) but with anomaly correlation as the metric.
Most of these metrics have traditionally used bias, root-mean-square errors, and anomaly correlation between observed and model values over basin scale, in other words, characterizing large-scale discrepancies. With the drive toward much higher horizontal resolution in the predictions systems, these traditional metrics may be unable to demonstrate the improvement in forecast skill (as described for numerical weather prediction by Mass et al., 2002). While higher-resolution models (subjectively) generate more realistic fields (Garcia Sotillo et al., 2015), it is often the case that statistics based on direct point match-up between interpolated model and observations do not improve (Brassington, 2017) due to the existence of so-called “double-penalty” effects occurring when using point-to-point comparisons with features present in the model but misplaced with respect to the observations. There is therefore a need to develop more sophisticated neighborhood methods and ad hoc metrics to deliver more accurate assessments of forecast skill at the local level. This has been a very active field of research in the atmospheric verification community, especially for precipitation forecasts, with many new spatial methods developed (Gilleland et al., 2009). Operational oceanography with external metrics tends to focus more on specific phenomena potentially over all oceans (e.g., focusing on mixed layer assessment; Boettger et al., 2018), but emphasis can also be on the forecast capability of an early warning system, such as river flooding (Taylor et al., 2011), or it can be dedicated to a specific region with the use of spatial-and object-based methods applied to high-resolution ocean forecasts verification to make the most of both sparse in situ ocean observations and remotely sensed observations (such as high frequency radar, satellite sensors). As model resolution increases, verification methods must therefore diversify, with a need for observations of synoptic mesoscale to submesoscale ocean features.
There is also an obvious interest in platform dedicated assessment (e.g., comparing model and observation values for a given drifter, for a given thermo-salinograph). The benefits are twofold: (1) identifying possible biases or trends along time for a given platform through comparison against several model values; and (2) assessment of the model through a Lagrangian perspective or in specific ship routes of interest. This could also be done for vessels of opportunity such as CTDs and ADCP observations along a seismic survey track (Figure 5; Zedel et al., 2018), which is similar to GODAE Class 2 metrics.
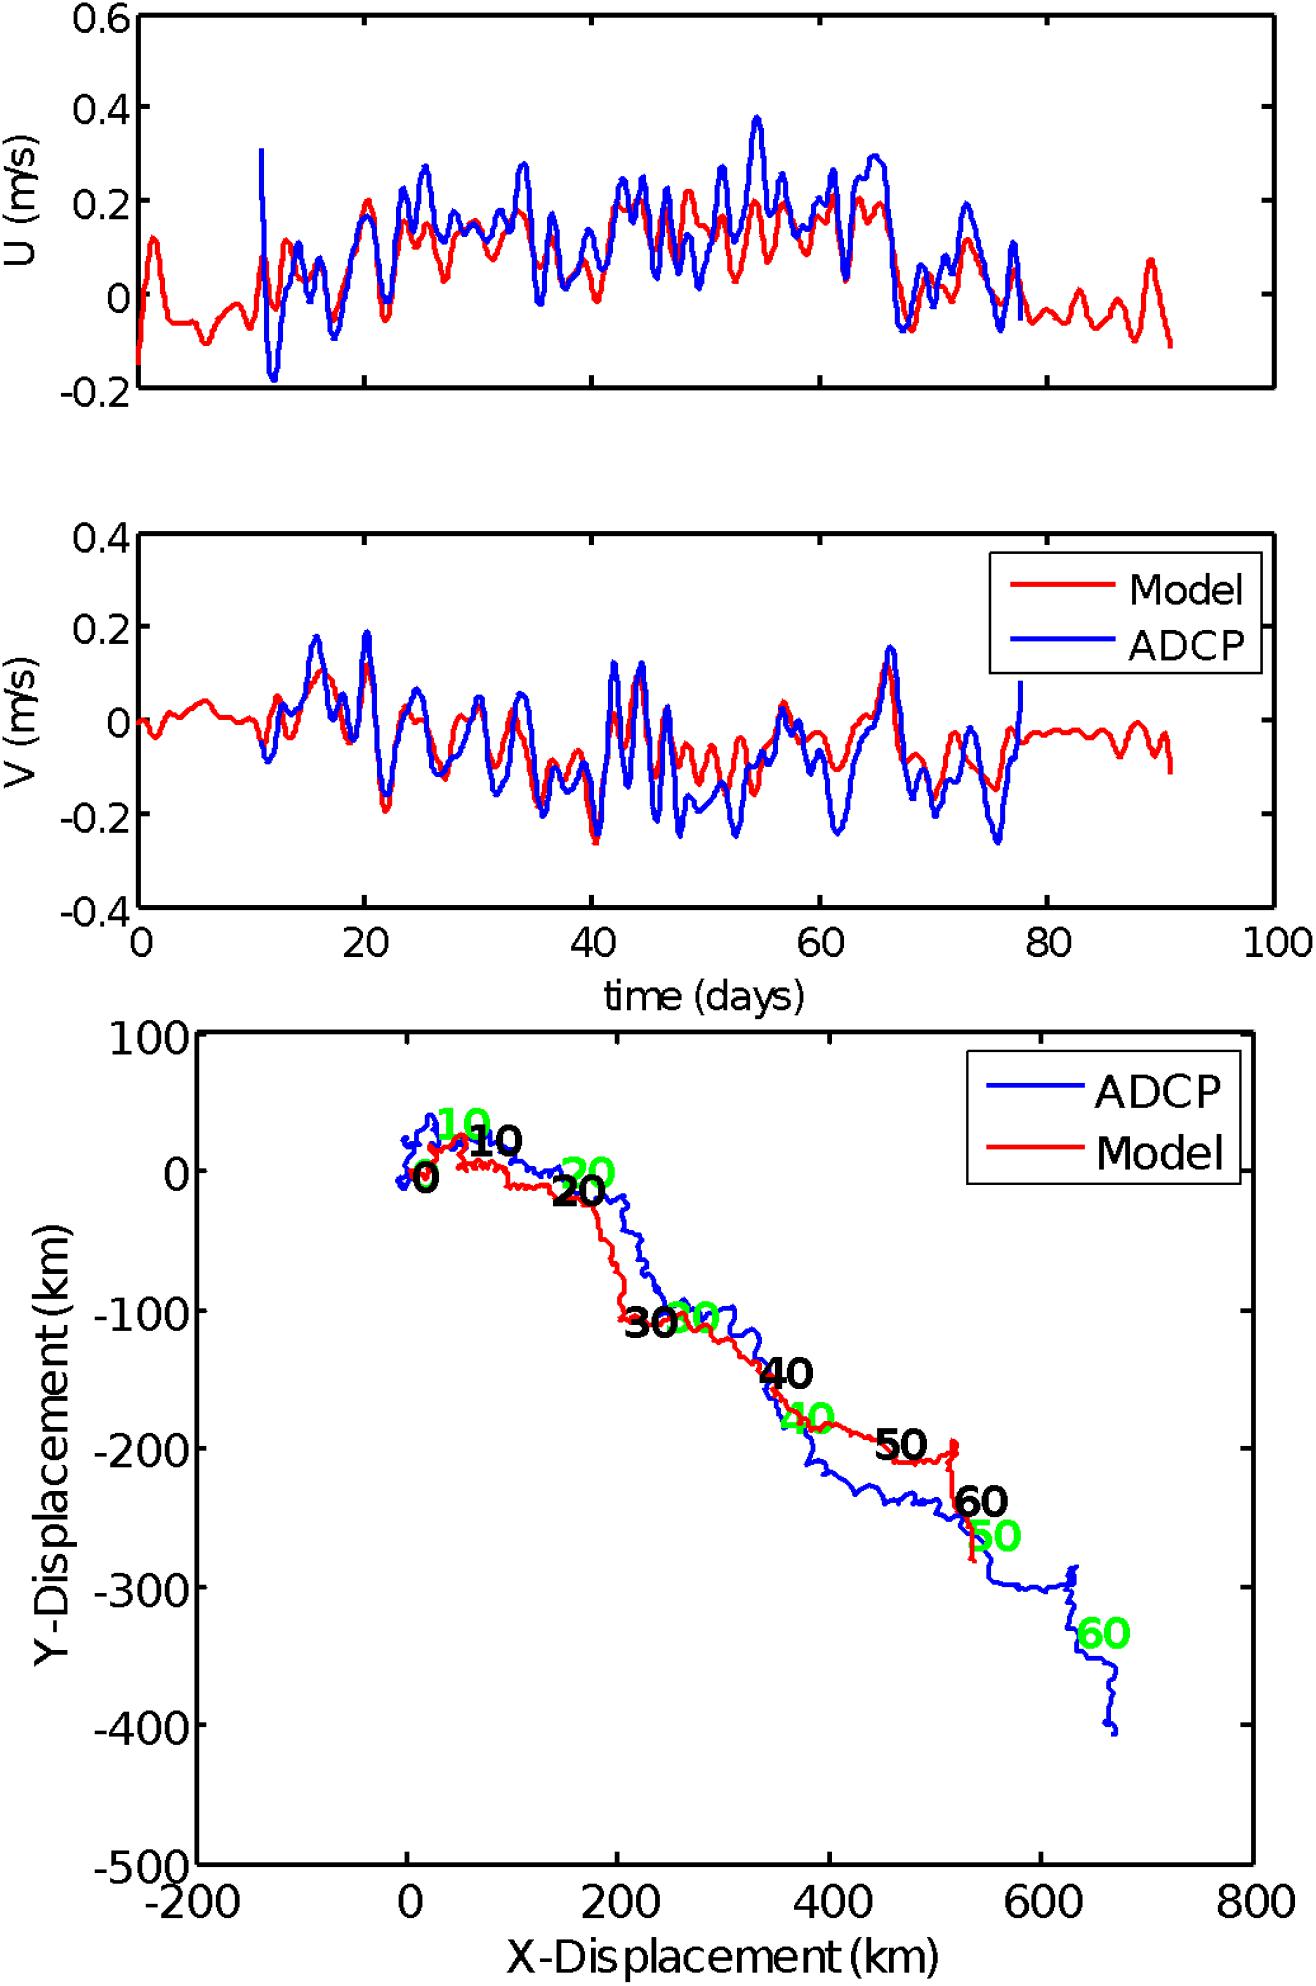
Figure 5. Top panel: Comparison between U and V observed using ship-based ADCP (blue) and predicted using the GIOPS prediction system (red) Both data sets were filtered to remove high frequency in this plot. Bottom panel: Progressive vector plot of displacements for ADCP (blue with green labels), and model (red with black labels) over the 60 days of the data set. Number labels indicate the number of days of drift.
Operational oceanography centers, following climate and seasonal forecast approaches, are also designing ensemble frameworks to better quantify forecast skill. There are notable efforts to define meaningful skill metrics (e.g., contingency tables, skill scores, ensemble predictions) in order to quantitatively assess the quality and consistency of ocean products and to synthesize different aspects of system performance together (e.g., Taylor and target diagrams, cost functions). Such metrics still rely on observations that can provide ocean truth, and they are required on both scientific and policy-making fronts. Since a portion of the target audience encompasses management agencies and neophyte end users without a mathematical background (for example, those in the fishing community or recreational boat pilots), the implementation of simple user-based metrics that are easy to interpret remains a priority (Zhang et al., 2010).
In summary, the ocean is under-sampled and only occasionally observed at fine scales. However, for verification purposes, operational oceanography needs continuity of observing programs and enhancement toward higher frequency sampling, higher resolution (such as high Freqency Radar Figure 6), and more measurement of additional quantities (biogeochemistry, ecosystems monitoring). This cannot be achieved solely by new satellite missions, such as SWOT for sea level, SKIM for surface currents, and SWIM for surface waves/wind. It will require an organized effort and evaluation of in situ programs.
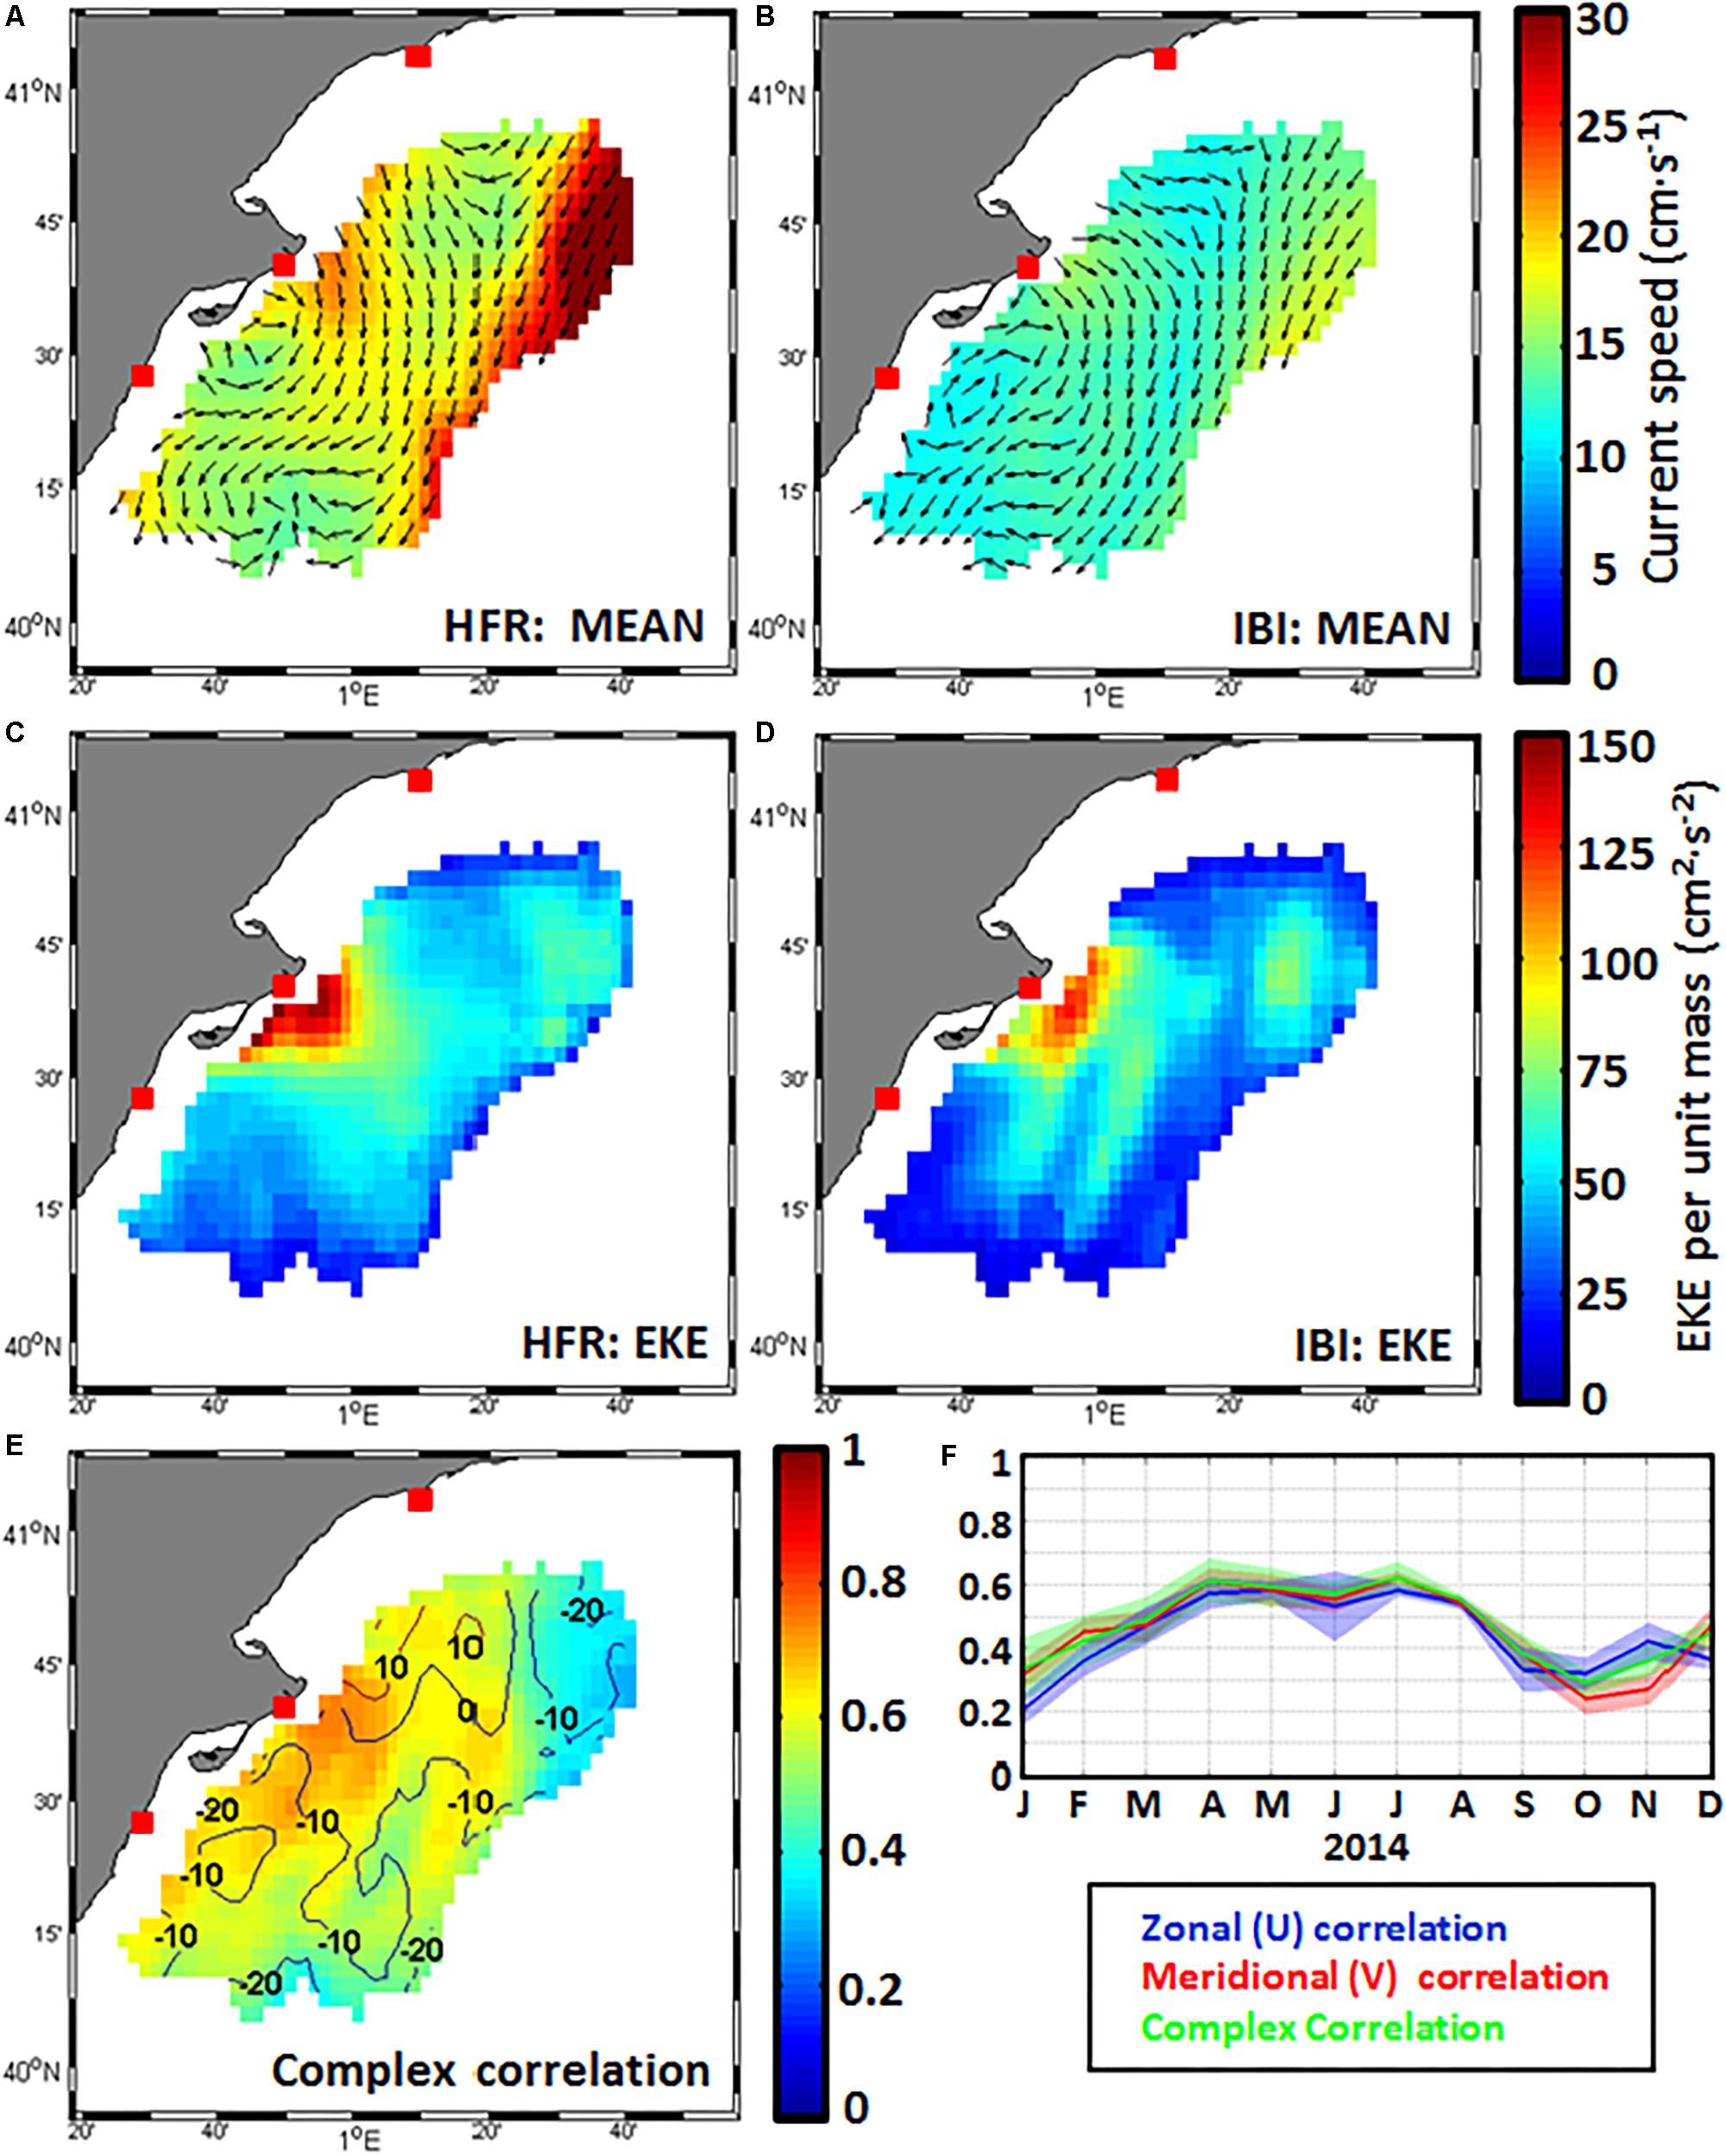
Figure 6. Surface velocity fields (A,B) and maps of eddy kinetic energy EKE (C,D) derived from hourly HFR (left) and CMEMS IBI model (right) estimations for Spring (MAM) 2014. (E) Map of complex correlation between HFR and IBI. Isolines represent the phase (in degrees): positive (negative) values denote counter-clockwise (clockwise) rotation of IBI vector respect HFR vectors. (F) Monthly evolution of spatially averaged class-1 metrics. Shaded values reveal the standard deviation associated with each metric.
Operational Oceanography Services and Stakeholders
A full description of the full range of operational oceanography services, of the information delivery mechanisms, and of how the stakeholders use these services is beyond the scope of this paper. This section, however, describes some examples of how the field is evolving, and the primary elements that are important for operational oceanography. We cannot anticipate all of the future uses that will be made of ocean forecasts systems, but it likely that these end uses will evolve together with the evolution (increased skill at longer lead times and a wider range of simulated parameters) of the prediction systems themselves, as well as with better accessibility tools and application program interfaces (APIs). The development of APIs will allow third parties to provide value-added services to various end user communities. This is one of the aims of the Copernicus Data and Information Access Service (DIAS4) initiative, where five cloud-based services are setting up accessible operational ocean data and prediction output repositories including processing tools. In regional systems of the GOOS services, such as Web Map Service (WMS), Web Feature Service (WFS), or Web Coverage Service (WCS), are available to view the regional ocean observing system output. Systems such as SECOORA, MONGOOS, NERACOOS have methods to explore numerical model and observation output. One interesting example is the PacIOOS voyager tool5, which is based on Google Earth and provides access to various observations and models. These viewing and analysis services for the various ocean observing systems must continue to grow and improve.
There is inherent end user trust in in situ observations versus model predictions and satellite observations. This is a particularly prevalent issue with regard to using model products for marine environmental policy, e.g., the marine strategy framework directive in the European context (Hyder et al., 2015). Thus, all ocean prediction product delivery systems must include (where feasible) continuous availability of ongoing comparisons of predictions and satellite observations with in situ observations. Many applications for operational oceanography exist in regional waters near the coast, where most of the activity and interest lies due to ports, fishing activity, recreational activity, as well as protection of sensitive habitats (De Mey-Frémaux et al., 2019, this issue). Coastal infrastructure requires storm forecasts to better manage risk. Maritime industries require forecasts of currents and ice for many of their operational decisions/activities, including towing out of heavy production platforms, evacuation of offshore facilities, as well as routine maintenance operations. Longer-term forecasts are needed for strategic decisions, and short-term high-resolution forecasts are used for underway tactical decisions by large industry vessels. Reanalysis or historical data are needed for design criteria for offshore structures.
In the shipping industry, navigation6 is “the harmonized collection, integration, exchange, presentation and analysis of marine information on board and ashore by electronic means to enhance berth to berth navigation and related services for safety and security at sea and protection of the marine environment.” The IHO S100 Standards7, currently under development, will allow time variant fields to be displayed on ship. For example, S-104 will provide tidal information standards for surface navigation, S-111 will provide standards for surface current specification, and S-112 will provide standards for dynamic water level data specification. The e-Navigation development via vessel automatic identification system monitoring will provide a mechanism for delivering ocean and ice prediction (as well as meteorological) output electronically to the ship bridge navigation systems.
Coast Guard search and rescue requires good knowledge of currents and surface temperature to estimate search locations of survivors, as well as to guide search decisions on survivability related to ambient water temperature. Navies require ocean predictions at their fingertips. They need the ability to compare ocean condition predictions against their own observations and apply that information to acoustic calculations on the fly. They have an inherent need for best available ocean circulation descriptions, with a particular need for reliable water column stratification for sound speed calculation.
The academic sector is also an important end user and developer of operational modeling systems. Managing operational configurations to deliver robust quality-controlled forecast products using a modeling platform that is being continually evolved by the research community requires a careful dialogue between the competing interests of operational data providers and the academic research community. Research integration must be achieved by building synergies between academic institutions, management agencies and state government offices for a coordinated creation of tailored products to meet the needs of applied end-user communities. For example, in the United Kingdom, development of the Met Office operational oceanography systems are coordinated with the research endeavors at United Kingdom higher education institutions under a Joint Marine Modeling Programme (JMMP), which manages the forecast system development cycle whilst providing important linkages that facilitate the delivery of high impact discovery science. Similar efforts are underway in the US.
With increased focus on the impact of plastics in the ocean and their prolific oceanic accumulation, determining where plastic enters the ocean, is transported and aggregated (van Sebille et al., 2012) is critical. While there is an obvious need to modify activities that contribute to plastics in the ocean, one can envision that ocean prediction system outputs combined with recent advances in backtracking algorithms (Dagestad et al., 2018) will allow us to trace observed plastic aggregation areas back to their place of origin.
Outlook and Recommendations
Sustained ocean prediction systems positively impact a broad range of ocean applications as well as governmental and economic activities (Davidson et al., 2009; Bell et al., 2013; Álvarez-Fanjul et al., 2018; Schiller et al., 2018; Reglero et al., 2019). Prediction system reliability is intrinsically linked to the sustained ocean observing systems that feed it. These observing systems – from coastal to global, from in situ to satellite-based – provide the ability to assess ocean conditions and create reliable forecasts. This is accomplished through assimilation of observations into models in order to provide numerical assessments from which model-based forecasts can be run. The observations are then used in data assimilation, for verification of the numerical assessment and forecast output as well as part of the prediction and observational output from operational oceanographic systems that permit downstream value-added products and end use. The linkage between prediction and observing systems is mutually beneficial. Operational prediction provides oceanographic context to the observations themselves by generating a three-dimensional time varying pictures of circulation around the observation. Additionally, operational oceanography can identify observing system gaps and provide guidance on the optimal observing network (Oke and Sakov, 2012; Fujii et al., 2019).
Large international organization activities related to oceanography will have a strong influence on operational oceanography. The UN proclaimed “Decade of Ocean Science for Sustainable Development” (2021–2030) will help propel the science behind ocean forecasting forward, as will a push from the evolution of the WMO to move from weather prediction to seamless environmental prediction (World Meteorological Organization [WMO], 2018). Moving forward, operational oceanography systems will be seamlessly coupled to the other environmental prediction components of atmosphere, waves, hydrology and ice. Following the suggestion by Bell et al. (2013) for the United Kingdom, there is a need for an international forum covering end-to-end operational oceanography to ensure the whole community is informed of developments and to initiate needed partnerships that will better exploit advances made by the various components in operational oceanography for societal and economic benefit.
Operational oceanography enhances information value of all real-time and delayed mode contributing observations and this will improve over time as each component is improved: the observation system, the data management system, the prediction system, the dissemination system, and stakeholder use. Anticipated improvements for operational oceanography components that will impact the next decade include:
Observations: The deep water Argo system will probe the ocean depths to 6000 m, depths poorly sampled in the past. This will provide added value for altimetry assimilation, as well as better constraining the deeper ocean simulations. The Argo floats will provide observations of biochemical variables, which will complement satellite ocean color and further propel prediction capabilities for biogeochemistry variables. The anticipated launch of the SWOT altimeter in 2021 will provide two-dimensional measurements of sea surface height with resolution suitable for resolving circulation on continental shelves. Additionally, the CFOSAT satellite (Hauser et al., 2016) launched October 28, 2018, will provide collocated surface wave and wind measurements. If approved, the SKIM satellite (Ardhuin et al., 2018) will further improve representation of air sea fluxes, surface currents, the atmospheric boundary layer and upper ocean turbulence. Autonomous observing platforms such as gliders open up the possibility for developing a shelf seas analog to the Argo open ocean profiling system. This will require technology improvements to reduce both material cost and human oversight of these planforms (e.g., artificial intelligence based piloting systems).
Data management: Data management structures are expected to evolve, with observations becoming more accessible via discovery services as well as stored on purpose-built computing infrastructure for fast access, retrieval, and visualization via a variety of interfaces. Most regional ocean observing systems have either one or several systems, such as THREDDS, ERRDAP, LAS, and GEOSERVER, set up for data retrieval along with GIS or Google Maps type viewers. The data feed for prediction systems will need to be designed to best suit the aspects of the data assimilation system (i.e., appropriate thinning and quality control). Data management should also include within their design, the collocation of prediction output and observation data. This will permit interface tools to allow end users to explore and evaluate prediction output and observations together.
Prediction Systems: It is anticipated that research advances in ocean prediction systems (data assimilation, models, computational power, verification methods) working in tandem with the evolution and advances of the observing system will accelerate both basic and applied oceanographic research. This will include:
1. Optimizing observing system design using data assimilation tools.
2. Adaptive/event based observing.
3. Four-dimensional variational or hybrid data assimilation – optimal use of available observations.
4. Model resolution (horizontal and vertical) – full tidal/mesoscale resolving and partial submesoscale/internal tide resolving ensemble forecasting.
Products and Delivery: Further integration is needed to support seamless interfaces to data servers such as THREDDS and ERDDAP. These servers will need to allow visual exploration as well as analysis of both observations and model output that is intuitive and seamless from an end user perspective. The interfaces should also permit easy comparison between different prediction system outputs and provide a smooth interface experience for the end user without exposing the user to the complexity of the data architecture and on-the-fly calculations to meet end user defined plots or analysis. Also, fully integrated software interfaces with fast dedicated data access will improve user experience and discoverability. Having data access tools that are both useful to specialists and non-specialists enables greater scientific communication and understanding the potential of ocean observing and prediction systems to provide comprehensive views of ocean conditions.
To maximize societal benefit, collaboration and information exchange between all contributing components of operational oceanography are critical. With the advent of new technologies (altimetry missions, gliders, biological Argo, etc.), a synergistic use of multi-platform, multi-scale observing systems encompassing both in situ (buoys, tide gauges, etc.) and remote (HFR, satellite, etc.) sensors will provide further insight into the comprehensive characterization of a highly dynamic ocean circulation and the related complex interactions. Equally, it will also contribute positively to a more exhaustive model accuracy assessment with subsequent societal benefits. It is therefore important to increase accessibility and understanding of the ocean data assimilation process as well as of forecast outputs. It is recommended for operational and delayed-time ocean prediction systems to store and disseminate not only the usual ocean model outputs, but also the analysis increments and the observation feedback files (i.e., innovation and quality control flags), to strengthen the link between the ocean forecast and the observation communities and benefit from each other’s results. This applies to accessibility and understanding of performance of prediction systems against observations (validation metrics), as well as multi-model inter-comparisons between diverse prediction systems in overlapping regions, from global to coastal scales, in order to evaluate the ability of nested coastal models to outperform larger scale parent systems and quantify the added value of downscaling approaches. Finally, improvements in flexible discovery and accessibility tools and application interface services will allow end users to develop new areas of application and utility of ocean observing and predictions systems.
The ever-changing field of software engineering strongly impacts operational oceanography products and outcomes. Significant advances in high-performance computational resources (e.g., multicore processor-based cluster architectures, massive storage capabilities, optimized parallelization, and efficient scalability strategies) have boosted the seamless evolution of ocean modeling techniques and numerical efficiency, giving rise to an inventory of operational ocean forecasting systems with ever-increasing complexity. Furthermore, improved data interfaces, discovery, analysis and visualization tools that are interoperable and useable by scientists and non-scientists will enhance communication, productivity, and collaboration.
Another recent development very likely to impact operational oceanography centers is the increased use of cloud services (AWS, Azure etc.) for data management, prediction and product delivery for environmental data clients. As referred to in section Operational Oceanography Services and Stakeholders above, Copernicus DIAS has already established use of cloud for data repositories and post-processing utilities. A “cloud-forward” strategy is actively under consideration at a number of operational meteorological and oceanography centers for use of cloud (or virtual machine) computational resources and data-hosting in conjunction with traditional HPC for enhanced capacity. Cloud services will be actively used in the context of future ocean observation systems as well. For example, the recent US Department of Defense DARPA (Defense Advanced Research Projects Agency) Ocean of Things initiative (Li et al., 2019) seeks to enable persistent maritime situational awareness over large ocean areas by deploying thousands of small, low-cost floats that could form a distributed sensor network. The data will be stored on the AWS GovCloud (Amazon) and managed by US Navy.
While the scope for operational oceanography is broad and covers a large number of groups, there is no global international network, consortium, or organization for coordinating end-to-end operational oceanography – from ocean observations to prediction to client delivery. However, within Europe, the Copernicus Marine Environment Monitoring Service (CMEMS) is a prime example of an international consortium that coordinates, develops, and operates end-to-end operational oceanographic systems. There is a need to collectively determine how to federate global coordination of operational oceanography. Platforms for these discussions include meetings of the IOC, the WMO, as well as more specific groups such as GODAE OceanView (soon to be OceanPredict), GOOS and its regional components, and GEO Blue Planet. Additionally, special events such as OceanObs’19 and Ocean Predict’19 will provide excellent venues for collectively advancing toward a sustained mechanism for international coordination of operational oceanography. Similar to Bell et al.’s (2013) suggestion for a national United Kingdom operational oceanography forum, an international forum for coordination and information exchange for operational oceanography is needed to further advance the ocean observing value chain.
Author Contributions
All authors reviewed the document. Specific contributions are as follows: FD, EC, PV, GB, CT, PDM-F, JS, and FH: section “Introduction.” LH, PL, PV, EC, AP, FD, FH, JoaS, FD, PV, EC, and FH: section “Ocean Observations and Data Management.” EC, ArM, TS, DS, YL, LH, JH GL, PO, ACP, AS, FH, PDM-F, and VK: section “Ocean Models.” GC, AB, AvM, EC, MM, LW, HW, YZ, XZ, ZZ, AS, ES, JoaS, AS, PDM-F, VK, and AB: section “Ocean Data Assimilation.” GS, AnM, AR, TS, DS, ACP, JM, CP, HM, GS, PL, GB, GD, AA-A, AS, LW, HW, YZ, XZ, PH, ZZ, LH, PD, FH, PDM-F, AA-A, VK, and AB: section “Ocean Prediction Verification.” JP, GS, FH, PDM-F, VK, and FH: section “Operational Oceanography Services and Stakeholders.” FD, EC, PV, GB, CT, PDM-F, JS, YL, and VK: section “Outlook and Recommendations.”
Funding
LW was funded by Task 9 of the project “Development of a Global High-resolution Marine Dynamic Environmental Forecasting System” (Grant Number: 2016YFC1401409) from “The Program on Marine Environmental Safety Guarantee” of “The National Key Research and Development Program of China.” HW was funded by the National Key Research and Development Program of China with the grant number 2016YFC1402700.
Conflict of Interest Statement
The authors declare that the research was conducted in the absence of any commercial or financial relationships that could be construed as a potential conflict of interest.
Footnotes
- ^ http://www.goosocean.org
- ^ http://eurogoos.eu
- ^ http://www.goosocean.org
- ^ https://www.copernicus.eu/en/access-data/dias
- ^ http://www.pacioos.hawaii.edu/data/voyager/
- ^ http://www.imo.org/en/OurWork/safety/navigation/pages/enavigation.aspx
- ^ https://www.iho.int/iho_pubs/standard/S-100_Index.htm
References
Álvarez-Fanjul, E., García Sotillo, M., Pérez Gómez, B., García Valdecasas, J. M., Pérez Rubio, S., Lorente, P., et al. (2018). “Operational oceanograhy at the service of the ports,” in New Frontiers in Operational Oceanography, eds E. Chassignet, A. Pascual, J. Tintoré, and J. Verron (France: GODAE OceanView), 729–736. doi: 10.17125/gov2018.ch27
Ardhuin, F., Aksenov, Y., Benetazzo, A., Bertino, L., Brandt, P., Caubet, E., et al. (2018). Measuring currents, ice drift, and waves from space: the sea surface kinematics multiscale monitoring concept. Ocean Sci. 14, 337–354. doi: 10.5194/os-14-337-2018
Bell, M. J., Lefebvre, M., Le Traon, P.-Y., Smith, N., and Wilmer-Becker, K. (2009). GODAE the global ocean data assimilation experiment. Oceanography 22, 14–21.
Bell, M. J., Guymer, T. H., Turton, J. D., MacKenzie, B. A., Rogers, R., and Hall, S. P. (2013). Setting the course for UK operational oceanography. J. Operat. Oceanogr. 6, 1–15. doi: 10.1080/1755876X.2013.11020146
Baringer, M. O., and Larsen, J. C. (2001). Sixteen years of florida current transport at 27N. Geophys. Res. Lett. 28, 3179–3182. doi: 10.1029/2001gl013246
Bell, M. J., Schiller, A., Le Traon, P.-Y., Smith, N. R., Dombrowsky, E., and Wilmer-Becker, K. (2015). An introduction to GODAE oceanview. J. Operat. Oceanogr. 8, S2–S11. doi: 10.1080/1755876X.2015.1022041
Bourlès, B., Lumpkin, R., McPhaden, M. J., Hernandez, F., Nobre, P., Campos, E., et al. (2008). The PIRATA program: history, accomplishments and future directions. Bull. Amer. Meteor. Soc. 89, 1111–1126. doi: 10.1175/2008BAMS2462.1
Boettger, D., Robertson, R., and Brassington, G. B. (2018). Verification of the mixed layer depth in the OceanMAPS operational forecast model for Austral autumn, Geosci. Model Dev. 11, 3795–3805. doi: 10.5194/gmd-11-3795-2018
Brassington, G. B., Martin, M., Tolman, H. L., Akella, S., Balmeseda, M., Chambers, C., et al. (2015). Progress and challenges in short- to medium-range coupled prediction. J. Operat. Oceanogr. 8, s239–s258. doi: 10.1080/1755876x.2015.1049875
Brassington, G. B. (2017). Forecast errors, goodness and verification in ocean forecasting. J. Mar. Rese. 75, 403–433. doi: 10.1357/002224017821836851
Büchmann, B., and Söderkvist, J. (2016). Internal variability of a 3-D ocean model. Tellus A Dyn. Meteorol. Oceanogr. 68:30417, doi: 10.3402/tellusa.v68.30417
Candille, G., Côté, C., Houtekamer, P. L., and Pellerin, G. (2007). Verification of an ensemble prediction system against observations. Mon. Weather Rev. 135, 2688–2699. doi: 10.1175/MWR3414.1
Cardinali, C., Pezzulli, S., and Andersson, E. (2004). Influence-matrix diagnostic of a data assimilation system. Q. J. R. Meteorol. Soc. 130, 2767–2786. doi: 10.1256/qj.03.205
Cardinali, C. (2009). Monitoring the observation impact on the short-range forecast. Q. J. R. Meteorol. Soc. 135, 239–250. doi: 10.1002/qj.366
Carrieres, T., Casati, B., Caya, A., Posey, P., Metzger, E. J., Melsom, A., et al. (2017). in System evaluation in sea ice analysis and forecasting, eds T. Carrieres, M. Buehner, J. F. Lemieux, and L. T. Pedersen (Cambridge: Cambridge University Press). doi: 10.1002/qj.366
Carton, J. A., Chepurin, G. A., and Chen, L. (2018). SODA3: a new ocean climate reanalysis. J. Climate. 31, 6967–6983. doi: 10.1175/JCLI-D-18-0149.1
Chassignet, E. P., and Verron, J. (eds) (2006). Ocean(Weather)Forecasting: An Integrated View of Oceanography. Berlin: Springer.
Chassignet, E. P., Hurlburt, H. E., Metzger, E. J., Smedstad, O. M., Cummings, J., Halliwell, G. R., et al. (2009). U.S. GODAE: global ocean prediction with the HYbrid coordinate ocean model (HYCOM). Oceanography 22, 64–75. doi: 10.5670/oceanog.2009.39
Chassignet, E. P., Pascual, A., Tintoré, J., and Verron, J. (eds) (2018). New Frontiers in Operational Oceanography. Scotts Valley: CreateSpace Independent Publishing Platform, 811.
Church, J. A., and White, N. J. (2011). Sea-level rise from the late 19th to the early 21st century. Surv. Geophys. 32, 585–602. doi: 10.1007/s10712-011-9119-1
Crosnier, L., Le Provost, C. and Mersea Strand1 team. (2006). “Internal metrics definition for operational forecast systems inter-comparison: examples in the North Atlantic and Mediterranean Sea,” in Ocean Weather Forecasting, eds E. P. Chassignet and J. Verron (Dordrecht: Springer), 455–465. doi: 10.1007/1-4020-4028-8_20
Dagestad, K. F., Röhrs, J., Breivik, Ø., and Ådlandsvik, B. (2018). OpenDrift v1.0: a generic framework for trajectory modelling, Geosci. Model Dev. 11, 1405–1420. doi: 10.5194/gmd-11-1405-2018
Davidson, F. J., Allen, A., Brassington, G. B., Breivik, O., Daniel, P., Kamachi, M., et al. (2009). Applications of GODAE ocean current forecasts to search and rescue and ship routing. Oceanography 22, 176–181. doi: 10.5670/oceanog.2009.76
De Mey-Frémaux, P., Ayoub, N., Barth, A., Brewin, R., Charria, G., Campuzano, F., et al. (2019). Model-observations synergy in the coastal ocean. Front. Mar. Sci. 6:436. doi: 10.5670/oceanog.2009.76
Dombrowsky, E., Bertino, L., Brassington, G. B., Chassignet, E. P., Davidson, F., Hurlburt, H. E., et al. (2009). GODAE systems in operation. Oceanography 22, 80–95. doi: 10.5670/oceanog.2009.68
Donlon, C. J., Martin, M., Stark, J., Roberts-Jones, J., Fiedler, E., and Wimmer, W. (2012). The operational sea surface temperature and sea ice analysis (OSTIA) system. Remote Sens. Environ. 116, 140–158. doi: 10.1007/s13143-018-0050-y
Donlon, C., Robinson, I., Casey, K. S., Vazquez-Cuervo, J., Armstrong, E., Arino, O., et al. (2007). The global ocean data assimilation experiment high-resolution sea surface temperature pilot project. Bull. Amer. Meteor. Soc 88, 1197–1214. doi: 10.1175/BAMS-88-8-1197
Dubuisson, M. P., and Jain, A. K. (1994). “A modified hausdorff distance for object matching,” in Proceedings of 12th International Conference on Pattern Recognition, (Jerusalem: IEEE), 566–568.
Edwards, C. A., Moore, A. M., Hoteit, I., and Cornuelle, B. D. (2015). Regional ocean data assimilation. 305. Annu. Rev. Mar. Sci. 7, 6.1–6.22.
Ferry, B. N., Parent, L., Garric, G., Bricaud, C., Testut, C. E., Galloudec, O. L., et al. (2012). GLORYS2V1 global ocean reanalysis of the altimetric era (1992–2009) at meso scale. Mercator Q. Newsletter 44, 29–39. doi: 10.1016/j.ocemod.2018.07.009
Foltz, G. R., Brandt, P., Richter, I., Rodriguez-fonseca, B., Hernandez, F., Dengler, M., et al. (2019). The tropical atlantic observing system. Front. Mar. Sci. 6:206
Fox-Kemper, B., Adcroft, A., Böning, C. W., Chassignet, E. P., Curchitser, E., Danabasoglu, G., et al. (2019). Challenges and prospects in ocean circulation models. Front. Mar. Sci. 6:65. doi: 10.3389/fmars.2019.00065
Freeland, H., Roemmich, D., Garzoli, S. L., LeTraon, P. Y., Ravichandran, M., Riser, S., et al. (2010). “Argo - a decade of progress”, in Proceedings of OceanObs’09: Sustained Ocean Observations and Information for Society, Vol. 2, eds J. Hall, D. E. Harrison, and D. Stammer (Venice, Italy: ESA Publication), doi: 10.5270/OceanObs09.cwp.32
Fujii, Y., Remy, E., Zuo, H., Oke, P. R., Halliwell, G. R., Gasparin, F., et al. (2019). Observing system evaluation based on ocean data assimilation and prediction systems: on-going challenges and future vision for designing/supporting ocean observational networks. Front. Mar. Sci. 6:417. doi: 10.3389/fmars.2019.00417
Garcia Sotillo, M., Cailleau, S., Lorente, P., Levier, B., Aznar, R., Reffray, G., et al. (2015). The MyOcean ibi ocean forecast and reanalysis systems: operational products and roadmap to the future copernicus service. J. Operat. Oceanogr. 8, 63–79. doi: 10.1080/1755876X.2015.1014663
Gemmill, W., Katz, W. B., Li, X., and Burroughs, L. D. (2006). The Daily Real-Time Global Sea Surface Temperature — High Resolution Analysis: RTG_SST_HR. Silver Spring: National Weather Service.
Grumbine, R. W. (1997). Automated Ice Concentration Analysis. Technical Procedures Bulletin. Silver Spring: National Weather Service.
Gilleland, E., Ahijevych, D., Brown, B. G., Casati, B., and Ebert, E. E. (2009). Intercomparison of spatial forecast verification methods. Wea. Forecasting 24, 1416–1430. doi: 10.1175/2009waf2222269.1
Goessling, H. F., Tietsche, S., Day, J. J., Hawkins, E., and Jung, T. (2016). Predictability of the arctic sea ice edge, geophys. Res. Lett. 43, 1642–1650. doi: 10.1002/2015GL067232
Golbeck, I., Li, X., Janssen, F., Brüning, T., Nielsen, J. W., Huess, V., et al. (2015). Uncertainty estimation for operational ocean forecast products—a multi-model ensemble for the north sea and the baltic sea ocean dynamics. 65, 1603–1631. doi: 10.1007/s10236-015-0897-8
Griffies, S. M., Boening, C., Bryan, F. O., Chassignet, E. P., Gerdes, R., Hasumi, H., et al. (2000). Developments in ocean climate models. Ocean Model. 2, 123–192.
Guinehut, S., Dhomps, A. L., Larnicol, G., and Le Traon, P. Y. (2012). High resolution 3-D temperature and salinity fields derived from in situ and satellite observations. Ocean Sci. 8, 845–857. doi: 10.5194/os-8-845-2012
Hauser, D., Tison, C., Amiot, T., Delaye, L., Mouche, A., Guitton, G., et al. (2016). CFOSAT: a new Chinese-French satellite for joint observations of ocean wind vector and directional spectra of ocean waves”.
Hauser, D., Tison, C., Amiot, T., Delaye, L., Corcoral, N., and Castillan, P. (2017). SWIM: the First spaceborn wave scatterometer. IEEE Trans. Geosci. Remote Sensing 55, 3000–3014. doi: 10.1109/tgrs.2017.2658672
Hernandez, F., Bertino, L., Brassington, G., Chassignet, E., Cummings, J., Davidson, F., et al. (2009). Validation and intercomparison studies within GODAE. Oceanography 22, 128–143. doi: 10.5670/oceanog.2009.71
Hernandez, F., Blockley, E., Brassington, G. B., Davidson, F., Divakaran, P., Drévillon, M., et al. (2015). Recent progress in performance evaluations and near real-time assessment of operational ocean products. J. Operat. Oceanogr. 8, 221–238.
Hernandez, F., Smith, G., Baetens, K., Cossarini, G., Garcia-Hermosa, I., Drevillon, M., et al. (2018). “Measuring performances, skill and accuracy in operational oceanography: new challenges and approaches. GODAE oceanview international school,” in New Frontiers in Operational Oceanography, eds E. P. Chassignet, A. Pascual, J. Tintoré, and J. Verron (France: GODAE OceanView), 759–796. doi: 10.17125/gov2018.ch29
Hewitt, H. T., Bell, M. J., Chassignet, E. P., Czaja, A., Ferreira, D., Griffies, S. M., et al. (2017). Will high-resolution global ocean models benefit coupled predictions on short-range to climate timescales? Ocean Model. 120, 120–136. doi: 10.1016/j.ocemod.2017.11.002
Hole, L. R., Fer, I., and Peddie, D. (2016). Directional wave measurements using an autonomous vessel. Ocean Dyn. 66, 1087–1098. doi: 10.1007/s10236-016-0969-4
Holt, J., Hyder, P., Ashworth, M., Harle, J., Hewitt, H. T., Liu, H., et al. (2017). Prospects for improving the representation of coastal and shelf seas in global ocean models, geosci. Model. Dev. 10, 499–523. doi: 10.5194/gmd-10-499-2017
Hyder, K., Rossberg, A. G., Allen, J. I., Austen, M. C., Barciela, R. M., Bannister, H. J., et al. (2015). Making modeling count - increasing the contribution of shelf-seas community and ecosystem models to policy development and management. Mar. Policy 62, 291–302. doi: 10.1016/j.marpol.2015.07.015
Jacobs, G. A., Barron, C. N., Blain, C. A., Carrier, M. J., D’Addezio, J. M., Helber, R. W., et al. (2018). “Operational ocean data assimilation,” in New Frontiers in Operational Oceanography, eds E. Chassignet, A. Pascual, J. Tintoré, and J. Verron (France: GODAE OceanView). doi: 10.17125/gov2018.ch18
Janjić, T., Bormann, N., Bocquet, M., Carton, J. A., Cohn, S. E., Dance, S. L., et al. (2018). On the representation error in data assimilation. Q. J. R. Meteorol. Soc. 144, 1257–1278. doi: 10.1002/qj.3130
Katavouta, A., and Thompson, K. R. (2016). Downscaling ocean conditions with application to the gulf of maine, scotian shelf and adjacent deep ocean. Ocean Model. 104, 54–72. doi: 10.1016/j.ocemod.2016.05.007
Kourafalou, V. H., De Mey, P., Le Hénaff, M., Charria, G., Edwards, C. A., He, R., et al. (2015a). Coastal ocean forecasting: system integration and validation. J. Operat. Oceanogr. 8, S127–S147. doi: 10.1080/1755876X.2015.1022336
Kourafalou, V. H., De Mey, P., Staneva, J., Ayoub, N., Barth, A., Chao, Y., et al. (2015b). Coastal Ocean forecasting: science foundation and user benefits. J. Operat. Oceanogr. 8, S127–S147. doi: 10.1080/1755876X.2015.1022348
Lea, D. J., Martin, M. J., and Oke, P. R. (2014). Demonstrating the complementarity of observations in an operational ocean forecasting system. Q. J. R. Meteorol. Soc. 140, doi: 10.1002/qj.2281,
Lee, T., and Gentemann, C. (2018). “: Satellite SST and SSS observations and their roles to constrain ocean models,” in New Frontiers in Operational Oceanography, eds E. Chassignet, A. Pascual, J. Tintoré, and J. Verron (France: GODAE OceanView), 271–288. doi: 10.17125/gov2018.ch11
Lellouche, J.-M., Eric, G., Olivier, L. G., Charly, R., Mounir, B., and Charles-Emmanuel, T. (2018). “The Mercator Ocean global high-resolution monitoring and forecasting system,” in New Frontiers in Operational Oceanography, eds E. Chassignet, A. Pascual, J. Tintoré, and J. Verron (France: GODAE OceanView), 563–592. doi: 10.17125/gov2018.ch20
Le Sommer, J., Chassignet, E. P., and Wallcraft, A. J. (2018). “Ocean circulation modeling for operational oceanography: Current status and future challenges,” in New Frontiers in Operational Oceanography, eds E. Chassignet, A. Pascual, J. Tintoré, and J. Verron (France: GODAE OceanView), 289–306. doi: 10.17125/gov2018.ch12
L’Hévéder, B., Mortier, L., Testor, P., and Lekien, F. (2013). A glider network design study for a synoptic view of the oceanic mesoscale variability. Oceanic Technol. 30, 1472–1493. doi: 10.1175/JTECH-D-12-00053.1
Li, Z., Wang, N., Li, Y., Sun, X., Huo, M., and Zhang, H. (2019). Collective Efficacy of Support Vector Regression With Smoothness Priority in Marine Sensor Data Prediction. Piscataway: IEEE, doi: 10.1109/ACCESS.2018.2890422
Lorente, P., Piedracoba, S., Sotillo, M. G., Luque Aznar, R., Amo-Baladrón, A., and Pascual, A. P. L. (2016). Ocean model skill assessment in the NW mediterranean using multi-sensor data. J. Operat. Oceanogr. 9, 75–92. doi: 10.1080/1755876X.2016.1215224
Majumdar, S. J. (2016). A Review of targeted observations. Bull. Amer. Meteor. Soc. 97, ,2287–2303. doi: 10.1175/BAMS-D-14-00259.1
Mass, C. F., Ovens, D., Westrick, K., and Colle, B. A. (2002). Does increasing horizontal resolution produce more skilful forecasts? Bull. Amer. Meteorol. Soc. 83, 407–430. doi: 10.1175/1520-0477(2002)083<0407:dihrpm>2.3.co;2
Maury, M. F. (1864). The Physical Geography of the Sea and its Meteorology. Mineola, NY: Courier Corporation.
Martin, M. J., Balmaseda, M., Bertino, L., Brasseur, P., Brassington, G., Cummings, J., et al. (2015). Status and future of data assimilation in operational oceanography. J. Operat. Oceanogr. 8, (Suppl. 1), s28–s48. doi: 10.1080/1755876X.2015.1022055
McPhaden, M. J., Ando, K., Bourlès, B., Freitag, H. P., Lumpkin, R., and Masumoto, Y. (2010). “The global tropical moored buoy array,” in Proceedings of the “OceanObs’09: Sustained Ocean Observations and Information for Society” Conference, Vol. 2, eds J. Hall, D. E. Harrison, and D. Stammer (Venice, Italy: ESA Publication), 21–25.
McPhaden, M. J., Meyers, G., Ando, K., Masamoto, Y., Murty, V. S. N., Ravichandran, M., et al. (2009). RAMA the rearch moored array for african –asian—australian monsoon analysis and prediction. Bull. Am. Meteorol. Soc. 90, doi: 10.1175/2008BAMS2608.1
Mesick, S. M., Booda, M. H., and Gibson, B. (1998). “Automated detection of oceanic fronts and eddies from remotely sensed satellite data using arcinfo. ARC/INFO,” in Proceedings of the Eighteenth Annual ESRI User Conference, (Redlands, CA: ESRI Press).
Moore, A. M., Martin, M. J., Akella, S., Arango, H. G., Balmaseda, M., Bertino, L., et al. (2019). Synthesis of ocean observations using data assimilation for operational, real-time and reanalysis systems: a more complete picture of the state of the ocean. Front. Mar. Sci. 6:90. doi: 10.3389/fmars.2019.00090
Moore, A. M., Jacox, M. G., Crawford, W. J., Laughlin, B., Edwards, C. A., and Fiechter, J. (2017). The impact of the ocean observing system on estimates of the california current circulation spanning three decades. Prog. Oceanogr. 156, 41–60. doi: 10.1016/j.pocean.2017.05.009
Nerger, L., and Hiller, W. (2013). Software for ensemble-based data assimilation systems—Implementation strategies and scalability. Comput. Geosci. 55, 110–118. doi: 10.1016/j.cageo.2012.03.026
Oke, P. R., Griffin, D. A., Schiller, A., Matear, R. J., Fiedler, R., Mansbridge, J., et al. (2013). Evaluation of a near-global eddy-resolving ocean model. Geosci. Model Dev. 6, 591–615. doi: 10.5194/gmd-6-591-2013
Oke, P. R., and Sakov, P. (2012). Assessing the footprint of a regional ocean observing system. J. Mar. Syst. 105, 30–51. doi: 10.1016/j.jmarsys.2012.05.009
Pearlman, J., Bushnell, M., Coppola, L., Karstensen, J., Buttigieg, P. L., Pearlman, F., et al. (2019). Evolving and sustaining ocean best practices and standards for the next decade. Front. Mar. Sci. 6:277. doi: 10.3389/fmars.2019.00277
Pujol, M.-I., Faugère, Y., Taburet, G., Dupuy, S., Pelloquin, C., Ablain, M., et al. (2016). DUACS DT2014: the new multi-mission altimeter data set reprocessed over 20 years. Ocean Sci. 12, 1067–1090. doi: 10.5194/os-12-1067-2016
Reglero, P., Balbín, R., Abascal, F. J., Medina, A., Alvarez-Berastegui, D., Rasmuson, L., et al. (2019). Pelagic habitat and offspring survival in the eastern stock of Atlantic bluefin tuna. ICES J. Mar. Sci. 76:2. doi: 10.1093/icesjms/fsy135
Robinson, A. R., and Lermusiaux, P. F. J. (2001). Data Assimilation in Models Encyclopedia of Ocean Sciences. London: Academic press Ltd, 623–634. doi: 10.1006/rwos.2001.0404
Rubio, A. J., Mader, L., Corgnati, C., Mantovani, A., Griffa, A., Novellino, C., et al. (2017). “HF radar activity in european coastal seas: next steps towards a pan-european hf radar network“. Front. Mar. Sci. 4:8. doi: 10.3389/fmars.2017.00008
Ryan, A. G., Regnier, C., Divakaran, P., Spindler, T., Mehra, A., Smith, G. C., et al. (2015). GODAE OceanView Class 4 forecast verification framework: global ocean inter-comparison. J. Operat. Oceanogr. 8, S112–S126.
Sakov, P., and Sandery, P. A. (2015). Comparison of EnOI and EnKF regional ocean reanalysis systems. Ocean Model. 89, 45–60. doi: 10.1016/j.ocemod.2015.02.003
Salighehdar, A., Ye, Z., Liu, M., Florescu, I., and Blumberg, A. F. (2017). Ensemble-based storm surge forecasting models. Wea. Forecasting 32, 1921–1936. doi: 10.1175/WAF-D-17-0017.1
Schiller, A., and Brassington, G. B. (eds) (2011). Operational Oceanography in the 21st Century. Berlin,: Springer.
Schiller, A., Baptiste, M., Yann, D., and Gary, B. (2018). “An overview of operational oceanography,” in New Frontiers in Operational Oceanography, eds E. Chassignet, A. Pascual, J. Tintoré, and J. Verron (France: GODAE OceanView), 1–26. doi: 10.17125/gov2018.ch01
Schlitzer, R. (2000). Electronic atlas of WOCE hydrographic and tracer data now available. Eos Trans 81:45. doi: 10.1029/00eo00028
Schulz-Stellenfleth, J., and Stanev, E. V. (2016). Analysis of the upscaling problem – A case study for the barotropic dynamics in the North Sea and the German Bight. Ocean Model. 100, 109–124. doi: 10.1016/j.ocemod.2016.02.002
Shan, S., Sheng, J., Thompson, K. R., and Greenberg, D. A. (2011). Simulating the three-dimensional circulation and hydrography of Halifax Harbour using a multi-nested coastal ocean circulation model. Ocean Dyn. 61, 951–976. doi: 10.1007/s10236-011-0398-3
Sloyan, B. M., Roughan, M., and Hill, K. (2018). “The global ocean observing system,” in New Frontiers in Operational Oceanography, eds E. Chassignet, A. Pascual, J. Tintoré, and J. Verron (France: GODAE OceanView), 75–90. doi: 10.17125/gov2018.ch03
Smith, G. C., Allard, R., Babin, M., Bertino, L., Chevallier, M., Corlett, G., et al. (2019). Polar ocean observations: a critical gap in the observing system and its effect on environmental prediction from hours to a season. Front. Mar. Sci. 6:429. doi: 10.3389/fmars.2019.00429
Smith, N., and Lefebvre, M. (1997). “The global ocean data assimilation experiment (GODAE),” in Paper presented at Monitoring the Oceans in the 2000s, Vol. 1, (France), 1997. doi: 10.1016/j.marpolbul.2011.06.026
Stanev, E. V., Grashorn, S., and Zhang, Y. J. (2017). Cascading ocean basins: numerical simulations of the circulation and interbasin exchange in the azov-black-marmara-mediterranean seas system. Ocean Dyn. 67, 1003–1025. doi: 10.1007/s10236-017-1071-2
Staneva, J., Alari, V., Breivik, Ø., Bidlot, J. R., and Mogensen, K. (2017). Effects of wave-induced forcing on a circulation model of the north sea. Ocean Dyn. 67, 81–101. doi: 10.1007/s10236-016-1009-1000
Storto, A. (2016). Variational quality control of hydrographic profile data with non-Gaussian errors for global ocean variational data assimilation systems. Ocean Model. 104, 226–241. doi: 10.1016/j.ocemod.2016.06.011
Tanhua, T., Pouliquen, S., Hausman, J., O’Brien, K., Bricher, P., de Bruin, T.,, et al. (2019). Ocean fair data services. Front. Mar. Sci. (in press). doi: 10.3389/fmars.2019.00440
Taylor, A., and Brassington, G. B. (2017). Sea level forecasts aggregated from established operational systems. J. Mar. Sci. Eng. 5, 33. doi: 10.3390/jmse5030033
Taylor, A., Smith, A., Wang, W., Robinson, J., and Brassington, G. (2011). “Ocean meets river: connecting Bureau of Meteorology ocean forecasts and river height predictions for improved flood warnings,” in MODSIM2011, 19th International Congress on Modelling and Simulation, eds F. Chan, D. Marinova, and R. S. Anderssen (Zealand).
Urrego-Blanco, J., Sheng, J., and Dupont, F. (2016). Performance of one-way and two-way nesting techniques using the shelf circulation modelling system for the eastern canadian shelf. Atmosphere-Ocean 54, 75–92. doi: 10.1080/07055900.2015.1130122
van Sebille, E., England, M. H., and Froyland, G. (2012). Origin, dynamics and evolution of ocean garbage patches from observed surface drifters. Environ. Res. Lett. 7, 1026–1034. doi: 10.1088/1748-9326/7/4/044040
Wedd, R., Stringer, M., and Haines, K. (2015). Argo real-time quality control intercomparison. J. Operat. Oceanogr. 8, 108–122. doi: 10.1080/1755876X.2015.1087186
World Meteorological Organization [WMO] (2018). Executive Council, Seventieth Session Geneva. Available at: http://meetings.wmo.int/EC-70/English/3.%20SESSION%20ARCHIVE/EC-70-d08(2)-SEAMLESS-GDPFS-IMPLEMENTATION-PLAN-draft1_en.docx (accessed August 29, 2018).
Wunsch, C. (2018). Towards determining uncertainties in global oceanic mean values of heat, salt, and surface elevation. Tellus A Dyn. Meteorol. Oceanogr. 70, 1–14. doi: 10.1080/16000870.2018.1471911
Yan, H., Moradkhani, H., and Zarekarizi, M. (2017). A probabilistic drought forecasting framework: a combined dynamical and statistical approach. J. Hydrol. 538, 291–304. doi: 10.1016/j.jhydrol.2017.03.004
Zhang, A., Hess, K. W., and Aikman, F. (2010). User-based skill assessment techniques for operationahydrodynamic forecast systems. J. operat. oceanogr. 3, 11–24. doi: 10.1080/1755876x.2010.11020114
Keywords: ocean prediction, data assimilation, verification, dissemination, observations, model intercomparisons, model skill assessment
Citation: Davidson F, Alvera-Azcárate A, Barth A, Brassington GB, Chassignet EP, Clementi E, De Mey-Frémaux P, Divakaran P, Harris C, Hernandez F, Hogan P, Hole LR, Holt J, Liu G, Lu Y, Lorente P, Maksymczuk J, Martin M, Mehra A, Melsom A, Mo H, Moore A, Oddo P, Pascual A, Pequignet A-C , Kourafalou V, Ryan A, Siddorn J, Smith G, Spindler D, Spindler T, Stanev EV, Staneva J, Storto A, Tanajura C, Vinayachandran PN, Wan L, Wang H, Zhang Y, Zhu X and Zu Z (2019) Synergies in Operational Oceanography: The Intrinsic Need for Sustained Ocean Observations. Front. Mar. Sci. 6:450. doi: 10.3389/fmars.2019.00450
Received: 20 December 2018; Accepted: 05 July 2019;
Published: 03 September 2019.
Edited by:
Hans Burchard, Leibniz Institute for Baltic Sea Research (LG), GermanyReviewed by:
Bjarne Büchmann, Joint GeoMETOC Support Center (FCOO), Ballerup, DenmarkJacopo Chiggiato, Italian National Research Council (CNR), Italy
Copyright © 2019 Davidson, Alvera-Azcárate, Barth, Brassington, Chassignet, Clementi, De Mey-Frémaux, Divakaran, Harris, Hernandez, Hogan, Hole, Holt, Liu, Lu, Lorente, Maksymczuk, Martin, Mehra, Melsom, Mo, Moore, Oddo, Pascual, Pequignet, Kourafalou, Ryan, Siddorn, Smith, Spindler, Spindler, Stanev, Staneva, Storto, Tanajura, Vinayachandran, Wan, Wang, Zhang, Zhu and Zu. This is an open-access article distributed under the terms of the Creative Commons Attribution License (CC BY). The use, distribution or reproduction in other forums is permitted, provided the original author(s) and the copyright owner(s) are credited and that the original publication in this journal is cited, in accordance with accepted academic practice. No use, distribution or reproduction is permitted which does not comply with these terms.
*Correspondence: Fraser Davidson, RnJhc2VyLkRhdmlkc29uQGRmby1tcG8uZ2MuY2E=