 Eric M. Keen
 Kylie L. Scales
 Brenda K. Rone1
 Elliott L. Hazen
 Gregory S. Schorr
- 1Foundation for Marine Ecology and Telemetry Research, Seabeck, WA, United States
- 2Global Change Ecology Research Group, University of the Sunshine Coast, Maroochydore, QLD, Australia
- 3Environmental Research Division, NOAA Southwest Fisheries Science Center, San Diego, CA, United States
Collisions with ships (ship strikes) are a pressing conservation concern for fin whales (Balaenoptera physalus) along western North America. Fin whales exhibit strong diel patterns in dive behavior, remaining near the surface for most of the night, but how this behavior affects ship-strike risk is unknown. We combined diel patterns of surface use, habitat suitability predictions, and ship traffic data to evaluate spatial and temporal trends in ship-strike risk to fin whales of the California Current System (CCS). We tested a range of surface-use scenarios and found that both increased use of the upper water column and increased ship traffic contribute to elevated ship-strike risk at night. Lengthening nights elevate risk during winter throughout the CCS, though the Southern California Bight experienced consistently high risk both day and night year-round. Within designated shipping lanes, total annual nighttime strike risk was twice daytime risk. Avoidance probability models based on ship speed were used to compare the potential efficacy of speed restrictions at various scales. Speed reductions within lanes may be an efficient remediation, but they would address only a small fraction (13%) of overall ship-strike risk. Additional speed restrictions in the approaches to lanes would more effectively reduce overall risk.
Introduction
Of the great whales, fin whales (Balaenoptera physalus) were hunted in the highest numbers (Aguilar, 2009) and today they are among the most often struck by ships (Laist et al., 2001). Collision with ships (ship strike) is currently considered the most pressing conservation issue for fin whales in the eastern North Pacific (National Marine Fisheries Service [NMFS], 2010; Carretta et al., 2018), where productive coastal ecosystems overlap with busy shipping areas. While the connectivity and structure of fin whale subpopulations in this ocean basin remain poorly understood (Carretta et al., 2018), fin whales in the California–Oregon–Washington stock are listed as Endangered under the Endangered Species Act (Carretta et al., 2018), and those in the adjacent Pacific Canada population are listed as Threatened under Canada’s Species At Risk Act (Committee on the Status of Endangered Wildlife in Canada [COSEWIC], 2019).
The fin whale accounts for a high proportion of documented ship-strike mortalities in U.S. waters (Jensen and Silber, 2003; Douglas et al., 2008; Neilson et al., 2012; Carretta et al., 2018) and elsewhere (Panigada et al., 2006). From 2009 to 2015, there were 10 documented fin whale mortalities attributed to ship strike along the coast of California, eight of which occurred in the Southern California Bight (NOAA, unpublished data). Ship-whale encounter models for the U.S. west coast Exclusive Economic Zone indicated that the ship-strike mortality rate for fin whales is twice that of blue whales (Balaenoptera musculus) and 2.4× that of humpback whales (Megaptera novaeangliae), and is estimated to be 2.7× above the Potential Biological Removal limit for non-natural mortality currently set by the National Marine Fisheries Service (Rockwood et al., 2017).
Off the west coast of Vancouver Island, Canada, fin whale ship-strike mortality rates are estimated to be nearly equal to those of the far more abundant humpback whale due to their specific distributions in relation to the busy shipping area of Juan de Fuca Strait (Nichol et al., 2017). In the waters between Vancouver Island and continental North America, an area where sighting rates of fin whales are low, 12 fin whales have been found dead with evidence of ship strike since 1986, though the causes of these mortalities are unconfirmed (Towers et al., 2018).
A necessary first step in mitigating this problem is identifying the areas where the risk of ship strike is greatest. To do this, spatially explicit risk models are typically developed based on the co-occurrence of ships and whales (e.g., Fonnesbeck et al., 2008; Williams and O’Hara, 2010; Redfern et al., 2013; Nichol et al., 2017; Rockwood et al., 2017). In these models, ship traffic distributions are derived from publicly available or previously published data archives, and whale distributions are inferred from field surveys or habitat models that include field data, either surveys (e.g., Nichol et al., 2017; Rockwood et al., 2017) or tag deployments (e.g., Scales et al., 2017). A common result of this approach is that strike risk is effectively defined as the spatially explicit feasibility of an interaction between a whale and a ship. If an interaction occurs, it may or may not involve detection (by the whale and/or the ship’s crew), attempted avoidance (also by the whale and/or the ship), or collision (lethal or non-lethal).
Some studies have incorporated further complexity into these basic risk assessments by considering factors such as likelihood of whale avoidance (e.g., Kite-Powell et al., 2007; McKenna et al., 2015), expected rates of collision (e.g., van der Hoop et al., 2012; Nichol et al., 2017; Rockwood et al., 2017), and the lethality of collision (e.g., Vanderlaan and Taggart, 2007; Wiley et al., 2011; Conn and Silber, 2013; Nichol et al., 2017). These factors often include details about ships, such as type, size class, noise characteristics, such as source levels and frequency bands, and hull draft, as well as the behavioral response of whales such as the ability to detect and successfully avoid ships. The speed of oncoming traffic is often found to be a primary determinant of both the probability of a collision and its lethality, such that mortality increases significantly at higher speeds (Kite-Powell et al., 2007; Wiley et al., 2011; McKenna et al., 2012, 2015; Nichol et al., 2017; Rockwood et al., 2017). All of these factors must be considered in order to accurately estimate whale mortalities based upon models of ship-strike risk, as well as to weigh mitigation options within ship Traffic Separation Schemes (TSS, hereafter referred to as shipping lanes), such as speed reductions, lane shifts, and designated “Areas to Be Avoided” (Rockwood et al., 2017).
Whale behaviors have been incorporated into ship-strike studies in terms of detection and avoidance (e.g., Kite-Powell et al., 2007; McKenna et al., 2015; Rockwood et al., 2017), but rarely in terms that precede interaction with a ship. The mortality model in Rockwood et al. (2017) was the first to incorporate one such a priori behavior, i.e., the time whales spend at various depths, which was modeled from whale-borne time-depth recording tags. This is a critical parameter, since putative strike risk is only real when whales are within near-surface waters in which collision is feasible. In principle, patterns in a species’ vertical habitat use can be an important factor in ship-strike risk, but this remains to be studied for fin whales.
An emerging understanding is that some baleen whales exhibit strong diel patterns in their use of vertical habitat (Panigada et al., 1999; Panigada et al., 2003; Calambokidis et al., 2007; Friedlaender et al., 2009, 2013, 2015, 2016; Burrows et al., 2016; Tyson et al., 2016; Keen et al., 2019). In the case of fin whales of the California Current System (CCS), these patterns include increased use of near-surface waters (within 20 m) at night (Keen et al., 2019). This diel vertical shift in habitat use would logically result in greater spatial overlap between fin whales and transiting ships at night, when the abilities of whale and ship to detect and avoid one another based on visual cues are likely impaired. Other factors, such as the alertness and responsiveness of whales to ships, may shift along with this increased surface use at night and affect the balance of strike risk factors (e.g., for other baleen whale species: Nowacek et al., 2004; Kite-Powell et al., 2007; McKenna et al., 2015). Such diel modes of habitat use, and their associated behavioral contexts, could affect strike risk in predictable ways, but these interactions have not yet been explored.
Our primary objective in the present study, therefore, was to incorporate diel patterns of fin whale habitat use and ship traffic into spatially explicit models of ship-strike risk within the CCS at various spatial and temporal scales, with particular focus on the most heavily trafficked areas in and near shipping lanes. We then used these models to evaluate the potential efficacy of several ship speed reduction strategies to mitigate ship-strike risk.
Materials and Methods
General Study Approach
Our approach had two main stages. First, we used ship positional data from Automatic Identification System (AIS), fin whale diel ratios of surface use, and habitat suitability models to assess monthly and diel patterns of strike risk across distinct regions in our study, as well as in and around shipping lanes. We calculated this strike risk as the product of ship traffic volume and the proportion of time fin whales spend in the upper 20 m of the water column, scaled by habitat suitability. Second, we used avoidance probabilities as permuted functions of vessel speed to explore ship-strike expectations under various speed reduction scenarios in and around shipping lanes and at various times. We calculated strike expectations as the product of ship-strike risk and the probability of a ship and whale failing to avoid each other.
Table 1 details the conceptual framework we used to invoke these factors. We carried out our study at the same spatial resolution (0.05 × 0.05° grid; 27,360 grid cells) used in habitat suitability models from Scales et al. (2017). We did so for years 2009, 2011, and 2013, which correspond to the same period of whale tag data collection as Scales et al. (2017). Due to gaps in 2009 shipping data (the section “Ship Traffic”), we focus most results upon 2011 and 2013 (the sections “General Findings” and “Strike Expectation and Speed Reductions”). Speed reduction analyses were carried out using 2013 as a case study since it was the most recent year of data we analyzed.
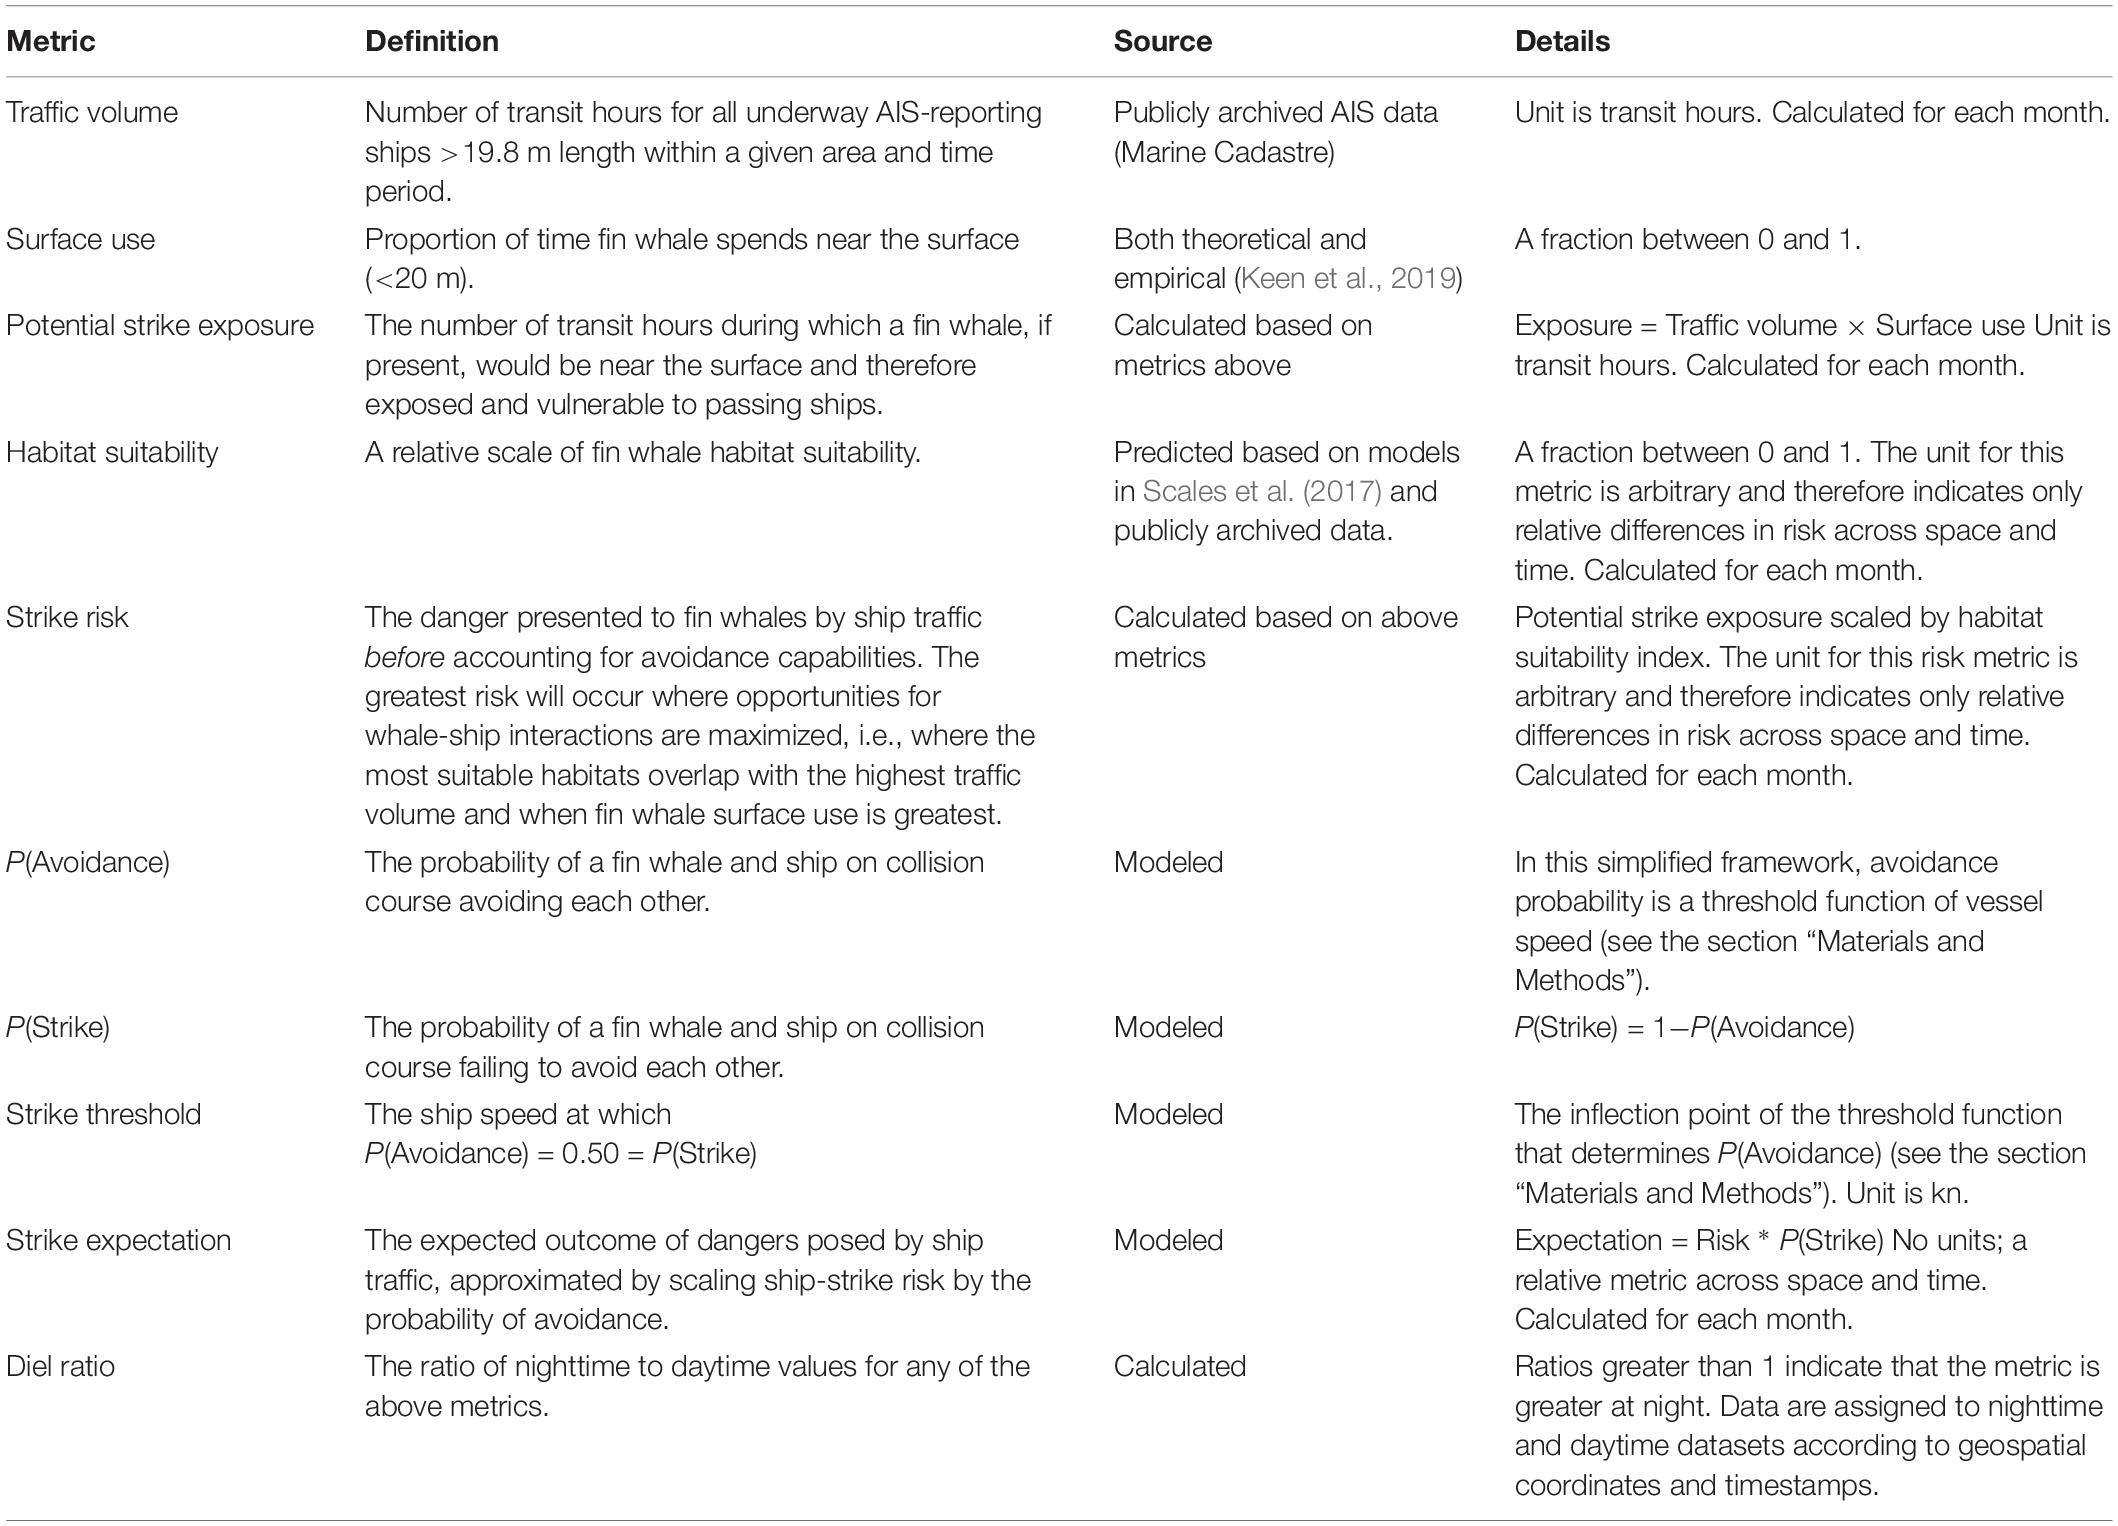
Table 1. Metrics and concepts used in this study.
Study Area
We defined our study area as the portions of the west coast of North America used in Scales et al. (2017) for which ship traffic data were also available (Figure 1). Ship-strike risk factors were examined on three nested scales: (i) the entire study area (126–116°W, 30–50°N); (ii) three subregions known to have relatively high levels of ship traffic and to contain a shipping lane, which we will refer to as the Southern California Bight (121–116.5°W, 31.5–34.5°N), the San Francisco Bay Area (125–121.75°W, 36.5–39°N), and the Pacific Northwest (126–122°W, 46–49.75°N), which included southwest Vancouver Island, Juan de Fuca Strait, Strait of Georgia, Salish Sea, Puget Sound, and the coastal waters of Washington, and Oregon; and (iii) the three shipping lanes within those regions, referred to here as the Los Angeles, San Francisco, and Juan de Fuca lanes. Note that the Pacific Northwest subregion included both U.S. and Canadian waters, and the Juan de Fuca lane straddles the international border. Shipping lanes were delineated using polygons retrieved from data.gov1. For each grid cell in the study area, the hours of darkness and daylight in each month of the study were determined based on its centroid’s coordinates using the package “oce 1.0-1” in R 3.5.1 (R Core Team, 2016).
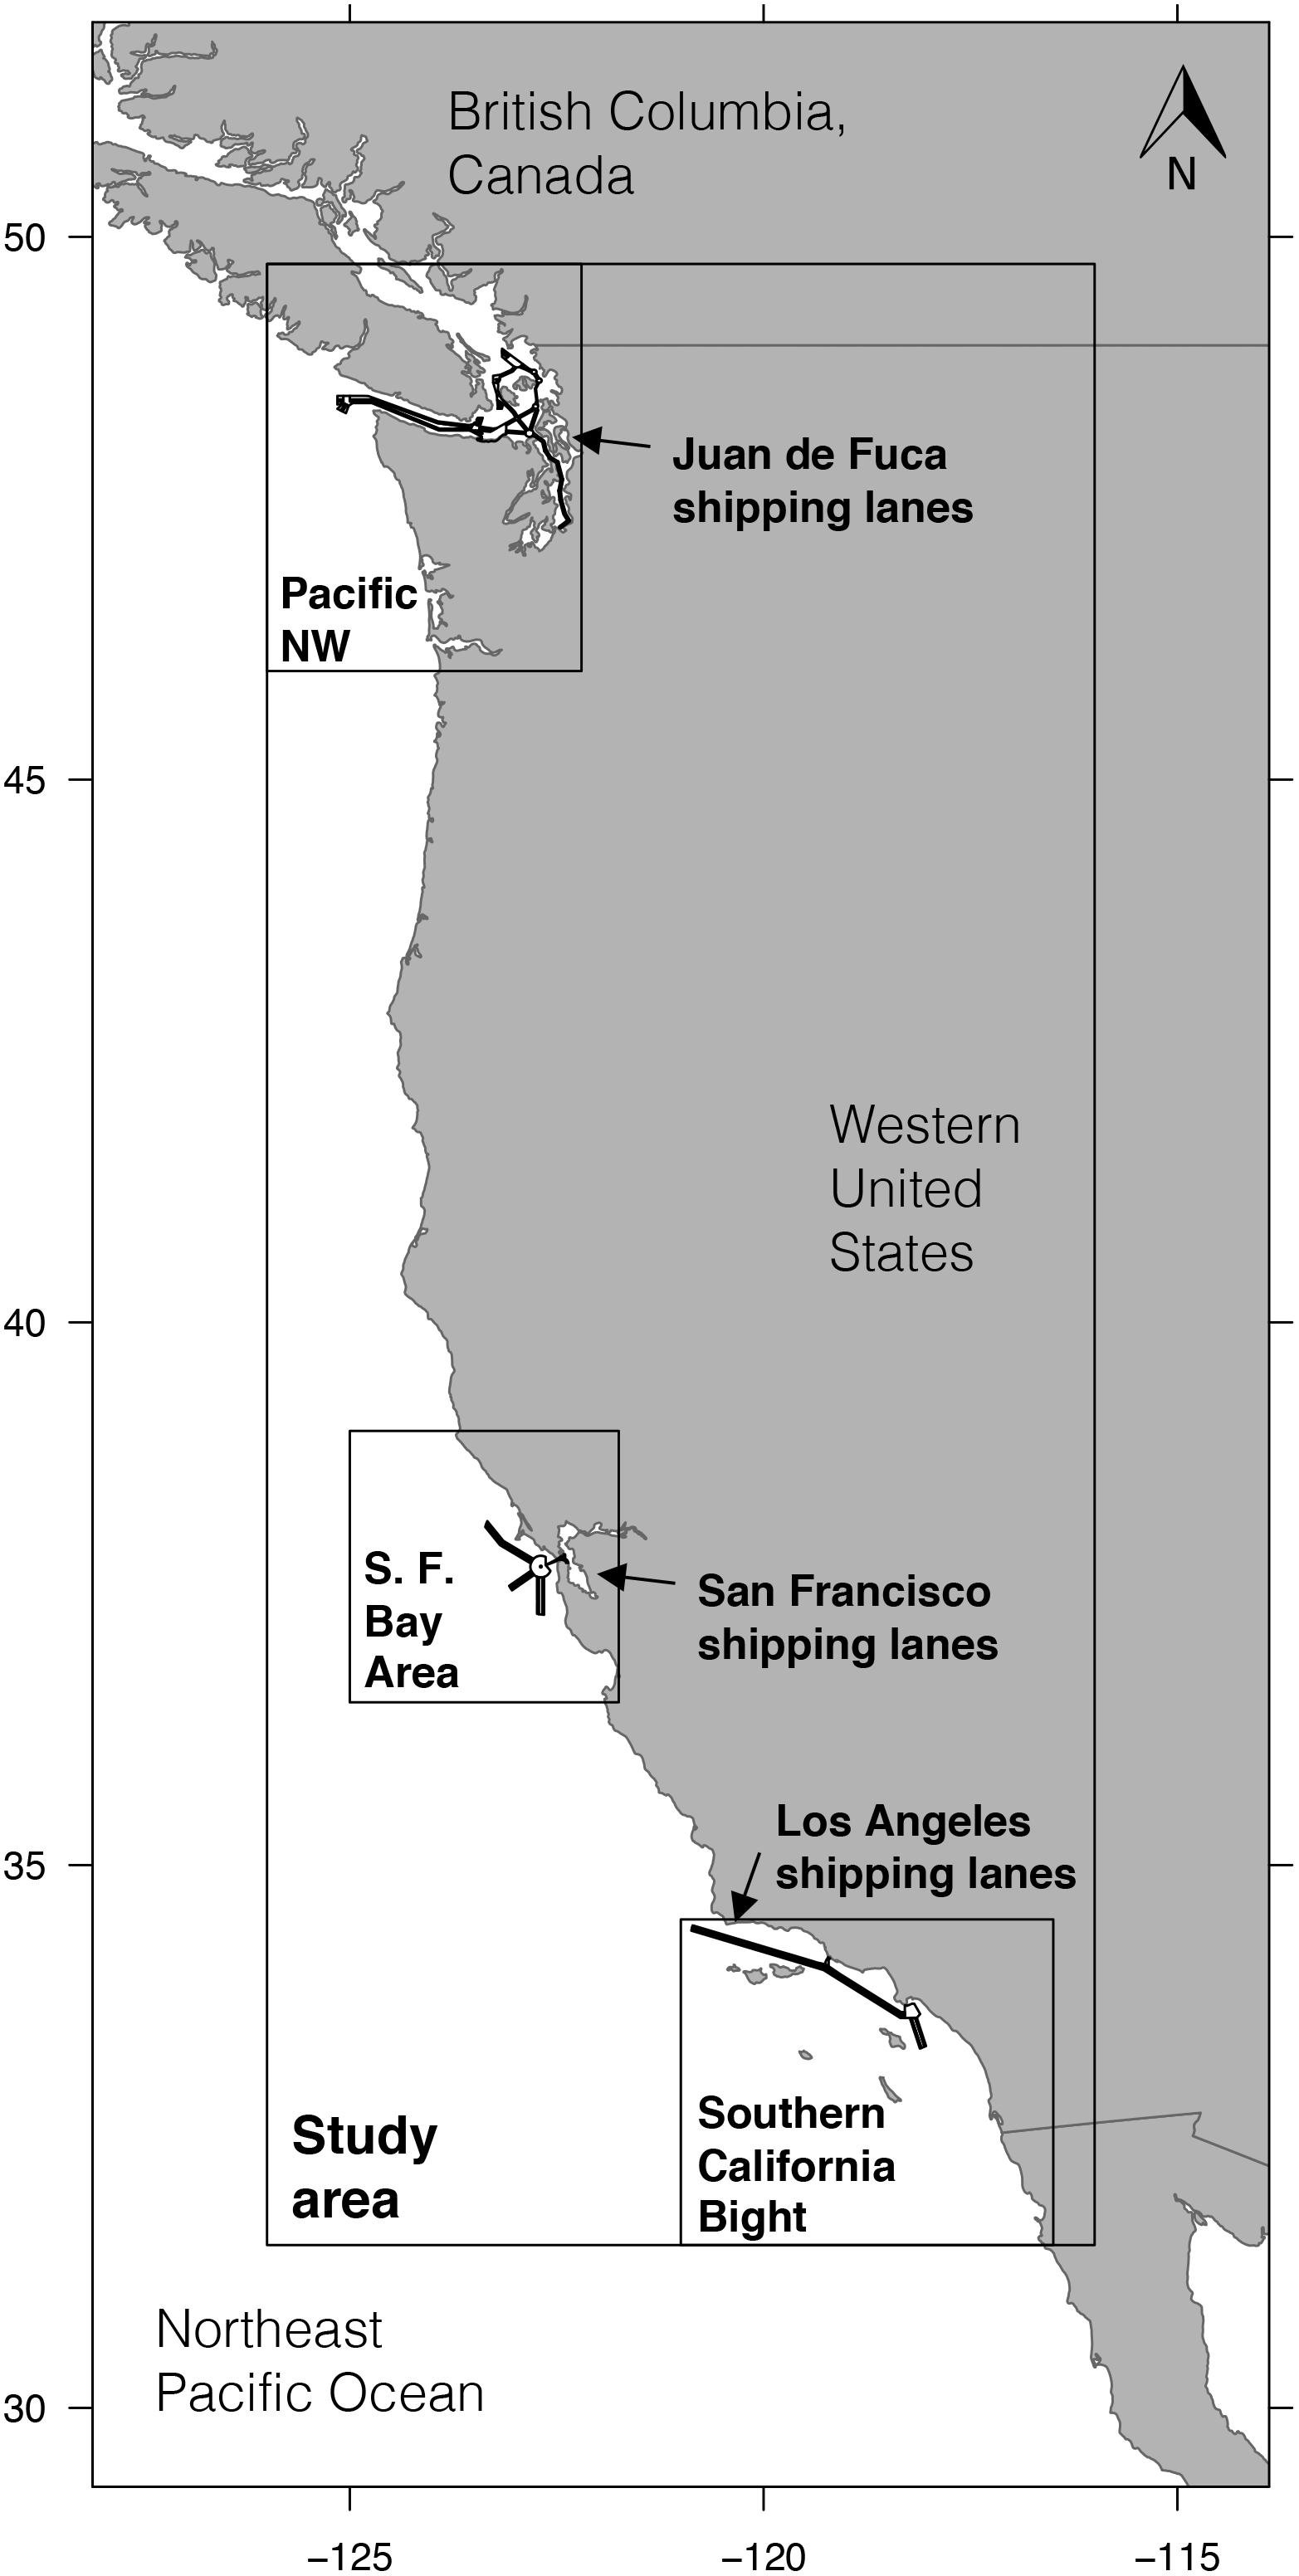
Figure 1. Map of the North American west coast indicating study area, subregions (Southern California Bight, San Francisco Bay Area, and Pacific Northwest), and their shipping lanes (Los Angeles, San Francisco, and Juan De Fuca, respectively).
Note that we included the Pacific Northwest in our study area despite relatively few sightings in this region, particularly from the interior waters of Juan de Fuca Strait, the Strait of Georgia, the Salish Sea, and Puget Sound (Ford, 2014; Towers et al., 2018), and despite the fact that habitat suitability models for this region were based on a limited number of tag deployments off the Washington coast (Scales et al., 2017) and thus may be less accurate than models from areas with more tag data. We included the Pacific Northwest for the following reasons: First, this is a heavily trafficked marine area used by fin whales and other large cetaceans, and is therefore of general interest (Nichol et al., 2017; Towers et al., 2018). Second, waters off southwestern Vancouver Island, including the approaches and western portion of the Juan de Fuca shipping lane, have recently been identified as a region of high ship-strike risk for fin whales (Nichol et al., 2017). Third, encounters with both live fin whales and dead fin whales with evidence of ship strike have occurred within the interior waters between Vancouver Island and the mainland throughout the last 20 years (Towers et al., 2018, and references therein). Fourth, the region represents potential habitat into which the recovering fin whale populations might expand. Finally, its high-latitude waters demonstrate the potential effects of seasonal changes in daytime length on patterns of ship-strike risk.
Ship Traffic
Automatic Information System (AIS) data were downloaded from Marine Cadastre2 (Bureau of Ocean Energy Management and National Oceanic and Atmospheric Administration, 2016). AIS transmissions collected by coastal stations and satellites include the position and characteristics for all ships greater than 300 gross tons as required by the International Maritime Organization, for most ships in U.S. waters greater than 19.8 m (65 ft) as required by the U.S. Coast Guard, and for voluntary use by smaller vessels. The decimated AIS data provided as ArcGIS geodatabases by Marine Cadastre included a position update roughly every minute for all AIS-transmitting vessels and had been processed by the Coast Guard for quality control. Each update included a unique ship identifier (MMSI), voyage identifier, vessel dimensions including hull draft (decimeters), timestamp, latitude, longitude, speed over ground (SOG; kn), and course over ground. Geodatabases were provided for each year-month within each Universal Transverse Mercator (UTM) zone. The U.S. west coast and southernmost waters of British Columbia, Canada, falls within UTM zones 10 (Pacific Northwest and north-central California) and 11 (Southern California Bight region). Shipping data were processed at 0.05° resolution to characterize traffic during day and night. AIS data were analyzed in R after data conversion to ASCII format in ArcGIS v10.5. Within each year-month of each UTM zone, the following procedure was carried out for every unique vessel.
(1) AIS data were filtered to include only ships underway (>1 kn) and with a reported length of at least 19.8 m and hull draft of >0 m (to remove faulty data; following Rockwood et al., 2017). Smaller vessels, which certainly pose a strike risk to fin whales, are excluded here due to two factors; (i) small vessels are not required to have AIS, so there is no way to fully explore strike risk, and (ii) collisions with smaller vessels are less likely to lead to mortality (Laist et al., 2001).
(2) Solar elevation was calculated for every AIS transmission according to its timestamp, latitude, and longitude (using R package “oce”). Data with negative solar elevations (i.e., sun below the horizon) were classified as nighttime; those with positive solar elevations were classified as daytime).
(3) Data were then converted into spatial lines and grouped into daytime and nighttime datasets. Care was taken to ensure that breaks in AIS updates did not contribute to track distances. That is, track distances are based only on the data that are available for underway ships with functioning AIS receivers, and are therefore a conservative estimate of actual ship activity.
(4) Daytime and nighttime grids of the study area (0.05 × 0.05°) were populated with a suite of metrics: distance (km) covered in transit, number of transits, mean SOG (kn), and hours in transit, which was calculated by dividing distance by mean SOG. These metrics were calculated by clipping track lines to each grid cell and calculating line length (km) using functions in R packages “rgeos” and “raster.” If a valid SOG is not reported during a ship’s transit of a grid cell, the mean underway SOG reported for all of its entries in the UTM zone was used to approximate transit time within the cell.
Previous ship-strike risk studies of fin whales have parsed AIS data by ship type, size class, and/or speed class under the logical assumption that these distinctions are important factors in the avoidance and lethality of strikes (e.g., Nichol et al., 2017; Rockwood et al., 2017). We did not parse AIS data this way under the assumption that any interaction with an underway ship longer than 19.8 m (as well as smaller vessels) poses serious risks to a whale, and because it remains unknown how avoidance probabilities differ by ship type or size. Further, monthly and geographic variation in ship traffic composition likely impacts the nature of avoidance and lethality, but in ways and to extremes that are currently unknown. Incorporating such factors into our strike risk framework would require another series of theoretical models. Finally, our goals of (i) analyzing diel patterns in strike risk at large scales in space and time, then (ii) exploring how those broad patterns influence potential mitigation measures required us to remove complexity wherever possible in order to reduce the computational load.
For each month, traffic was characterized by “volume” (combined hours underway from all reporting ships throughout a given area of the study grid) and “rate” during day and night (volume per duration of the diel period; Table 1). “Overall” activity was calculated by adding daytime and nighttime metrics together. Differences in nighttime and daytime activities were quantified using a “diel ratio” (night/day, Table 1), such that relatively high nighttime activity is indicated by a ratio greater than 1.0. Similar metrics were computed for the following other factors in our strike risk analysis (the sections “Potential Strike Exposure,” “Habitat Suitability,” Ship-Strike Risk,” “Shipping Lanes,” and “Strike Expectation and Speed Reductions”).
We examined the effects of ship speed on an annual timescale by calculating mean transit speed in each grid cell, defined as the total kilometers traveled by all ships divided by the total transit time for all ships. Maps were generated to examine geographic patterns in the means and diel ratios of ship speed.
The AIS data available on MarineCadastre.gov were incomplete for UTM zone 10 (Pacific Northwest and north-central California) in June and July 2009, leading us to focus on 2011 and 2013 for most of our results.
Potential Strike Exposure
Diel modes of surface use were incorporated into our risk analysis using the concept of potential strike exposure (hereafter, exposure) defined as the number of transit hours during which a fin whale, if present, would be near the surface and therefore exposed and vulnerable to passing ships (Table 1). Exposure analyses were conducted by scaling traffic volume by the proportion of time fin whales spent at the surface. For all months in 2011 and 2013, this was done using empirical surface use data (i.e., the proportion of time spent above 20 m) of 0.57 at night and 0.42 during the day (diel ratio = 1.36:1), which were the median values derived by Keen et al. (2019) from 12 tag deployments on fin whales in southern California (8,753 sets of dives + post-dive surface time over 264.3 days; mean deployment duration of 22.1 days). Their study found some evidence of geographic and seasonal variation in diel surface use. However, given the complexity of our analysis, we used a diel ratio of surface use based on the published values, then augmented this empirical diel ratio with alternative surface use scenarios, using 2013 as a case study. In generating these alternatives, we simplified matters by permuting nighttime surface use while holding daytime surface use at 0.4, and assuming that nighttime use would always be greater than daytime use based on previously published observations. Therefore, in addition to the empirical ratio of 1.36:1 (0.57:0.42), the following five diel ratios of surface use were also investigated: 1:1 (0.4:0.4), 1.25:1 (0.5:0.4), 1.5:1 (0.6:0.4), 1.75:1 (0.7:0.4), and 2:1 (0.8:0.4).
Habitat Suitability
Monthly fin whale habitat suitability in each grid cell, scored from 0 to 1, was calculated using the prediction model presented in Scales et al. (2017), which is a high-resolution, multi-parameter Generalized Additive Mixed Model based on tracks of 67 tagged fin whales between 2008 and 2015 (n = 58 in Southern California, n = 9 off Washington State) and publicly available datasets of physiographic and dynamic environmental variables (Table 1). This model used the same grid cell resolution and study area as the present study (0.05 × 0.05° grid; 27,360 grid cells). Physiographic variables included seafloor depth and bathymetric rugosity. Dynamic oceanographic variables included seasonal thermal front frequency and monthly composites of sea surface temperature and chlorophyll-a. These predictors were included in the model on the basis of AIC corrected for small sample size. In this model, fin whale habitat use was established using filtered tag data weighted according to tag duration, to reduce bias associated with the location of deployment and uneven tracking durations, and low weights were applied to the first 10 days of tracking. The data sources, diagnostics, results, and discussion of this model are detailed in Scales et al. (2017).
Ship-Strike Risk
Strike risk was calculated as the product of habitat suitability and potential strike exposure, which itself is a product of ship traffic volume and fin whale surface use (Table 1). Because habitat suitability is a relative index without absolute units, ship-strike risk is also a relative measure without units. For each month of each year, this calculation was carried out within every grid cell for its location-specific periods of day and night.
Shipping Lanes
To understand the relative contribution of ship traffic within heavily trafficked shipping lanes to overall CCS ship-strike risk, we compared strike risk factors (i.e., ship traffic, habitat suitability, potential strike exposure, ship speed) within lanes to their overall values for the entire study area on monthly and annual time scales. The approaches to shipping lanes, in which port-bound traffic is funneled into an incoming lane and outbound traffic disperses, also present areas of concentrated strike risk. To understand the diel patterns in ship traffic and strike risk within these approaches with better resolution, we analyzed grid cells as a function of their great-circle distance to the nearest edge of lane polygons.
Strike Expectation and Speed Reductions
We have defined strike risk as the inherent danger of collision posed to fin whales before their interaction with a nearby ship (Table 1). To evaluate the expectation of strike based on this risk, we must incorporate the probability of a fin whale and/or ship successfully avoiding collision, which is generally treated as a partial function of ship speed (Laist et al., 2001; Vanderlaan and Taggart, 2007; Conn and Silber, 2013). We examined the effects of ship speed on an annual timescale by calculating mean transit speed in each grid cell, defined as the total kilometers traveled by all ships divided by the total transit time for all ships. Individual ship speeds varied about this annual mean. While speed and many other variables would determine the exact avoidance probability of a specific whale–ship interaction, our purpose here is to assess the relative change in expected strike rate thanks to various reductions in the mean transit speed within a given area.
Fin whales have been observed responding to the presence of smaller vessels (Jahoda et al., 2003), but no further data exists on fin whale avoidance capability. To explore ship-strike expectation and the potential effects of speed reductions within our study area, we explored fin whale avoidance using a theoretical threshold probability function (Figure 2A), to mirror what was found in North Atlantic right whales in Kite-Powell et al. (2007) and used in Gende et al. (2011) and Rockwood et al. (2017) for fin whales:
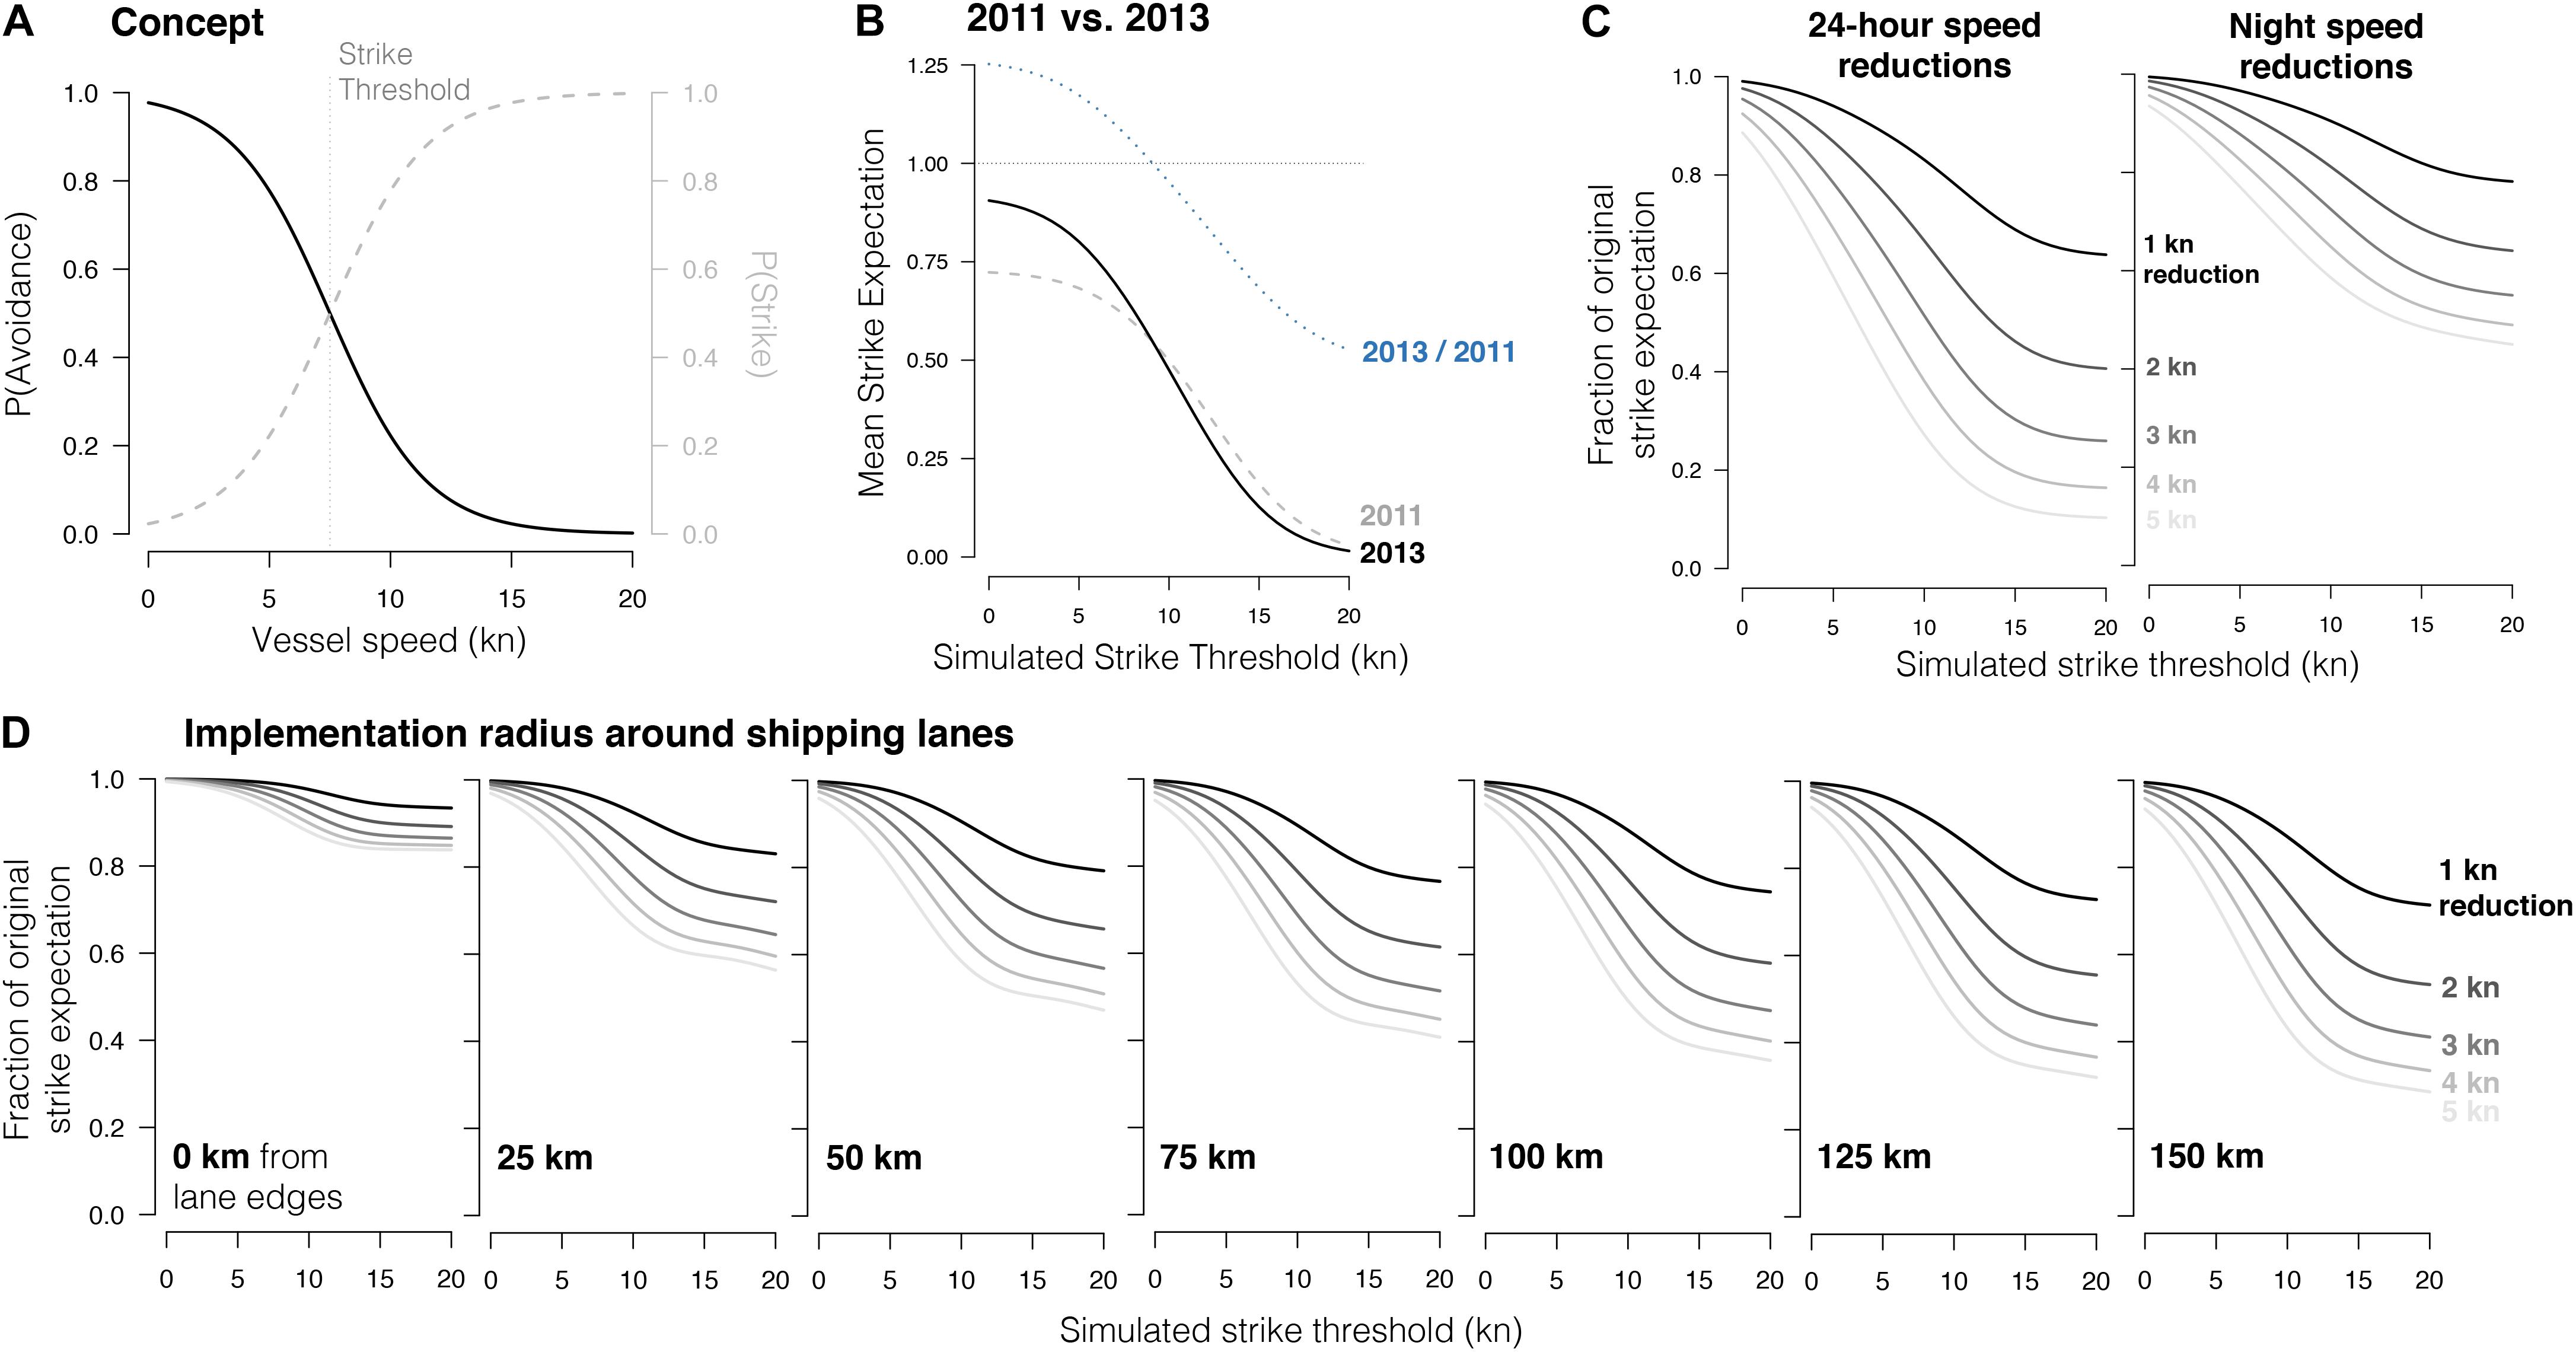
Figure 2. Conceptual framework (A) and model results (B–D) of ship-strike avoidance probability as a threshold function of ship speed. (A) Concept demonstrated in which the strike threshold, i.e., the speed at which a fin whale has a 50% chance of either avoiding a ship [P(Avoidance), black line] or being struck [P(Strike), dashed line], is 7.5 kn. (B) Impact of strike threshold on mean strike expectation in 2011 (gray, dashed) and 2013 (black, solid). The ratio of those two curves (2013/2011) is provided in dashed blue. (C) Comparison of the effects of speed reductions when applied to all hours (left) vs. nighttime hours only (right). The effect of the speed reduction (y-axis) is a function of the fin whale strike threshold (x-axis) and the mean reduction in ship speed (lines). The reduction effect is measured as the fraction of the original strike expectation presented by the new strike expectation after the reduction has been applied. (D) Expected reduction in strikes with the implementation of ship speed reductions within various buffers about shipping lanes, from 0 (far left, i.e., speed reductions are implemented within lanes only) to 150 km from the edges of lanes (far right). For all models shown here, potential strike exposure and risk were calculated using a 1.36:1 ratio of night:day use of the upper 20 m.
In this framework the upper asymptote, which describes the maximum probability of avoidance, regardless of ship speed, is set to 1.0, and the maximum slope of the threshold response is set to −0.5 (the negative indicates the probability of avoidance declines with increasing ship speed). V is the ship speed, and T is the inflection point of the function, which we will refer to as the strike threshold: the ship speed at which a whale and a ship on collision course have a 50% chance of avoiding each other [i.e., T is where P(Avoidance) = P(Strike) = 0.50]. A lower strike threshold means that fin whales are less responsive to an oncoming ship; even if the ship is traveling slowly, it is still likely to strike the whale. In this framework, the probability of ship strike, P(Strike), is 1−P(Avoidance). Because no data exists regarding fin whale strike thresholds, we incorporated avoidance probabilities into strike expectation analyses using a set of avoidance models with various permutations of the strike threshold, ranging from 0 to 20 kn at intervals of 0.5 kn.
Annual Changes in Strike Expectation
We applied this set of theoretical avoidance models to compare mean strike expectation in 2011 and 2013. For each avoidance model, we calculated P(Avoidance) for each grid cell according to its annual mean ship speed. To do so, we calculated a set of P(Avoidance) for all avoidance models given the mean ship speed of each grid cell in the study area. We then used the P(Avoidance) in each cell to scale its mean strike risk, which for this exercise was calculated using the empirical surface use diel ratio of 1.36:1. The result for each year was a mean strike expectation for all grid cells for each avoidance model.
Nighttime Speed Reductions
A similar routine was implemented to assess the efficacy of speed reductions applied throughout the study area on a 24-h basis versus during nighttime hours only. In this model, we calculated the strike expectations across strike thresholds using the 24-h and nighttime means of ship speed, respectively, using 2013 as a case study since it is the most recent year of data we analyzed. We then reduced each cell’s mean speed by 1 kn and re-calculated the overall strike expectation for the study area. We measured the efficacy of the speed reduction as the fraction of the original strike expectation represented by the new prediction. We repeated this for speed reductions of 2, 3, 4, and 5 kn.
Speed Reduction Buffers Around Shipping Lanes
We next used theoretical strike thresholds to estimate the effect of speed reductions within increasing radii from the edges of shipping lanes, again using 2013 as a case study year. To do so, we calculated the study area-wide strike expectation across strike thresholds. We then isolated the grid cells within various radii from the edges of the three lanes. We tested radii ranging from 0 km from lane edges to 150 km at intervals of 25 km. We applied speed reductions (1–5 kn) within those cells and re-calculated the area-wide strike expectation. We measured the efficacy of the speed reduction similar to above, as the fraction of the original strike expectation represented by the new prediction.
Results
General Findings
We found that ship-strike risk is mediated by several factors, including the seasonal oscillation in nighttime duration, the relatively stable spatial distribution of ship traffic volume, higher rates of ship traffic at night (Figure 3), seasonal dynamics in fin whale habitat suitability, and diel patterns in fin whale surface use. The majority of strike risk occurs at night, even in summer when nights are short (Figure 4). This pattern is most pronounced in high-latitude winter when nights are longest, despite relatively low wintertime volumes of ship traffic. Periods of maximum strike risk varied seasonally across subregions (Figure 5). In shipping lanes, strike risk doubled at night and was highest in the winter. However, lanes comprised only 0.87% of the study area and 13% of total ship-strike risk (Figure 6).
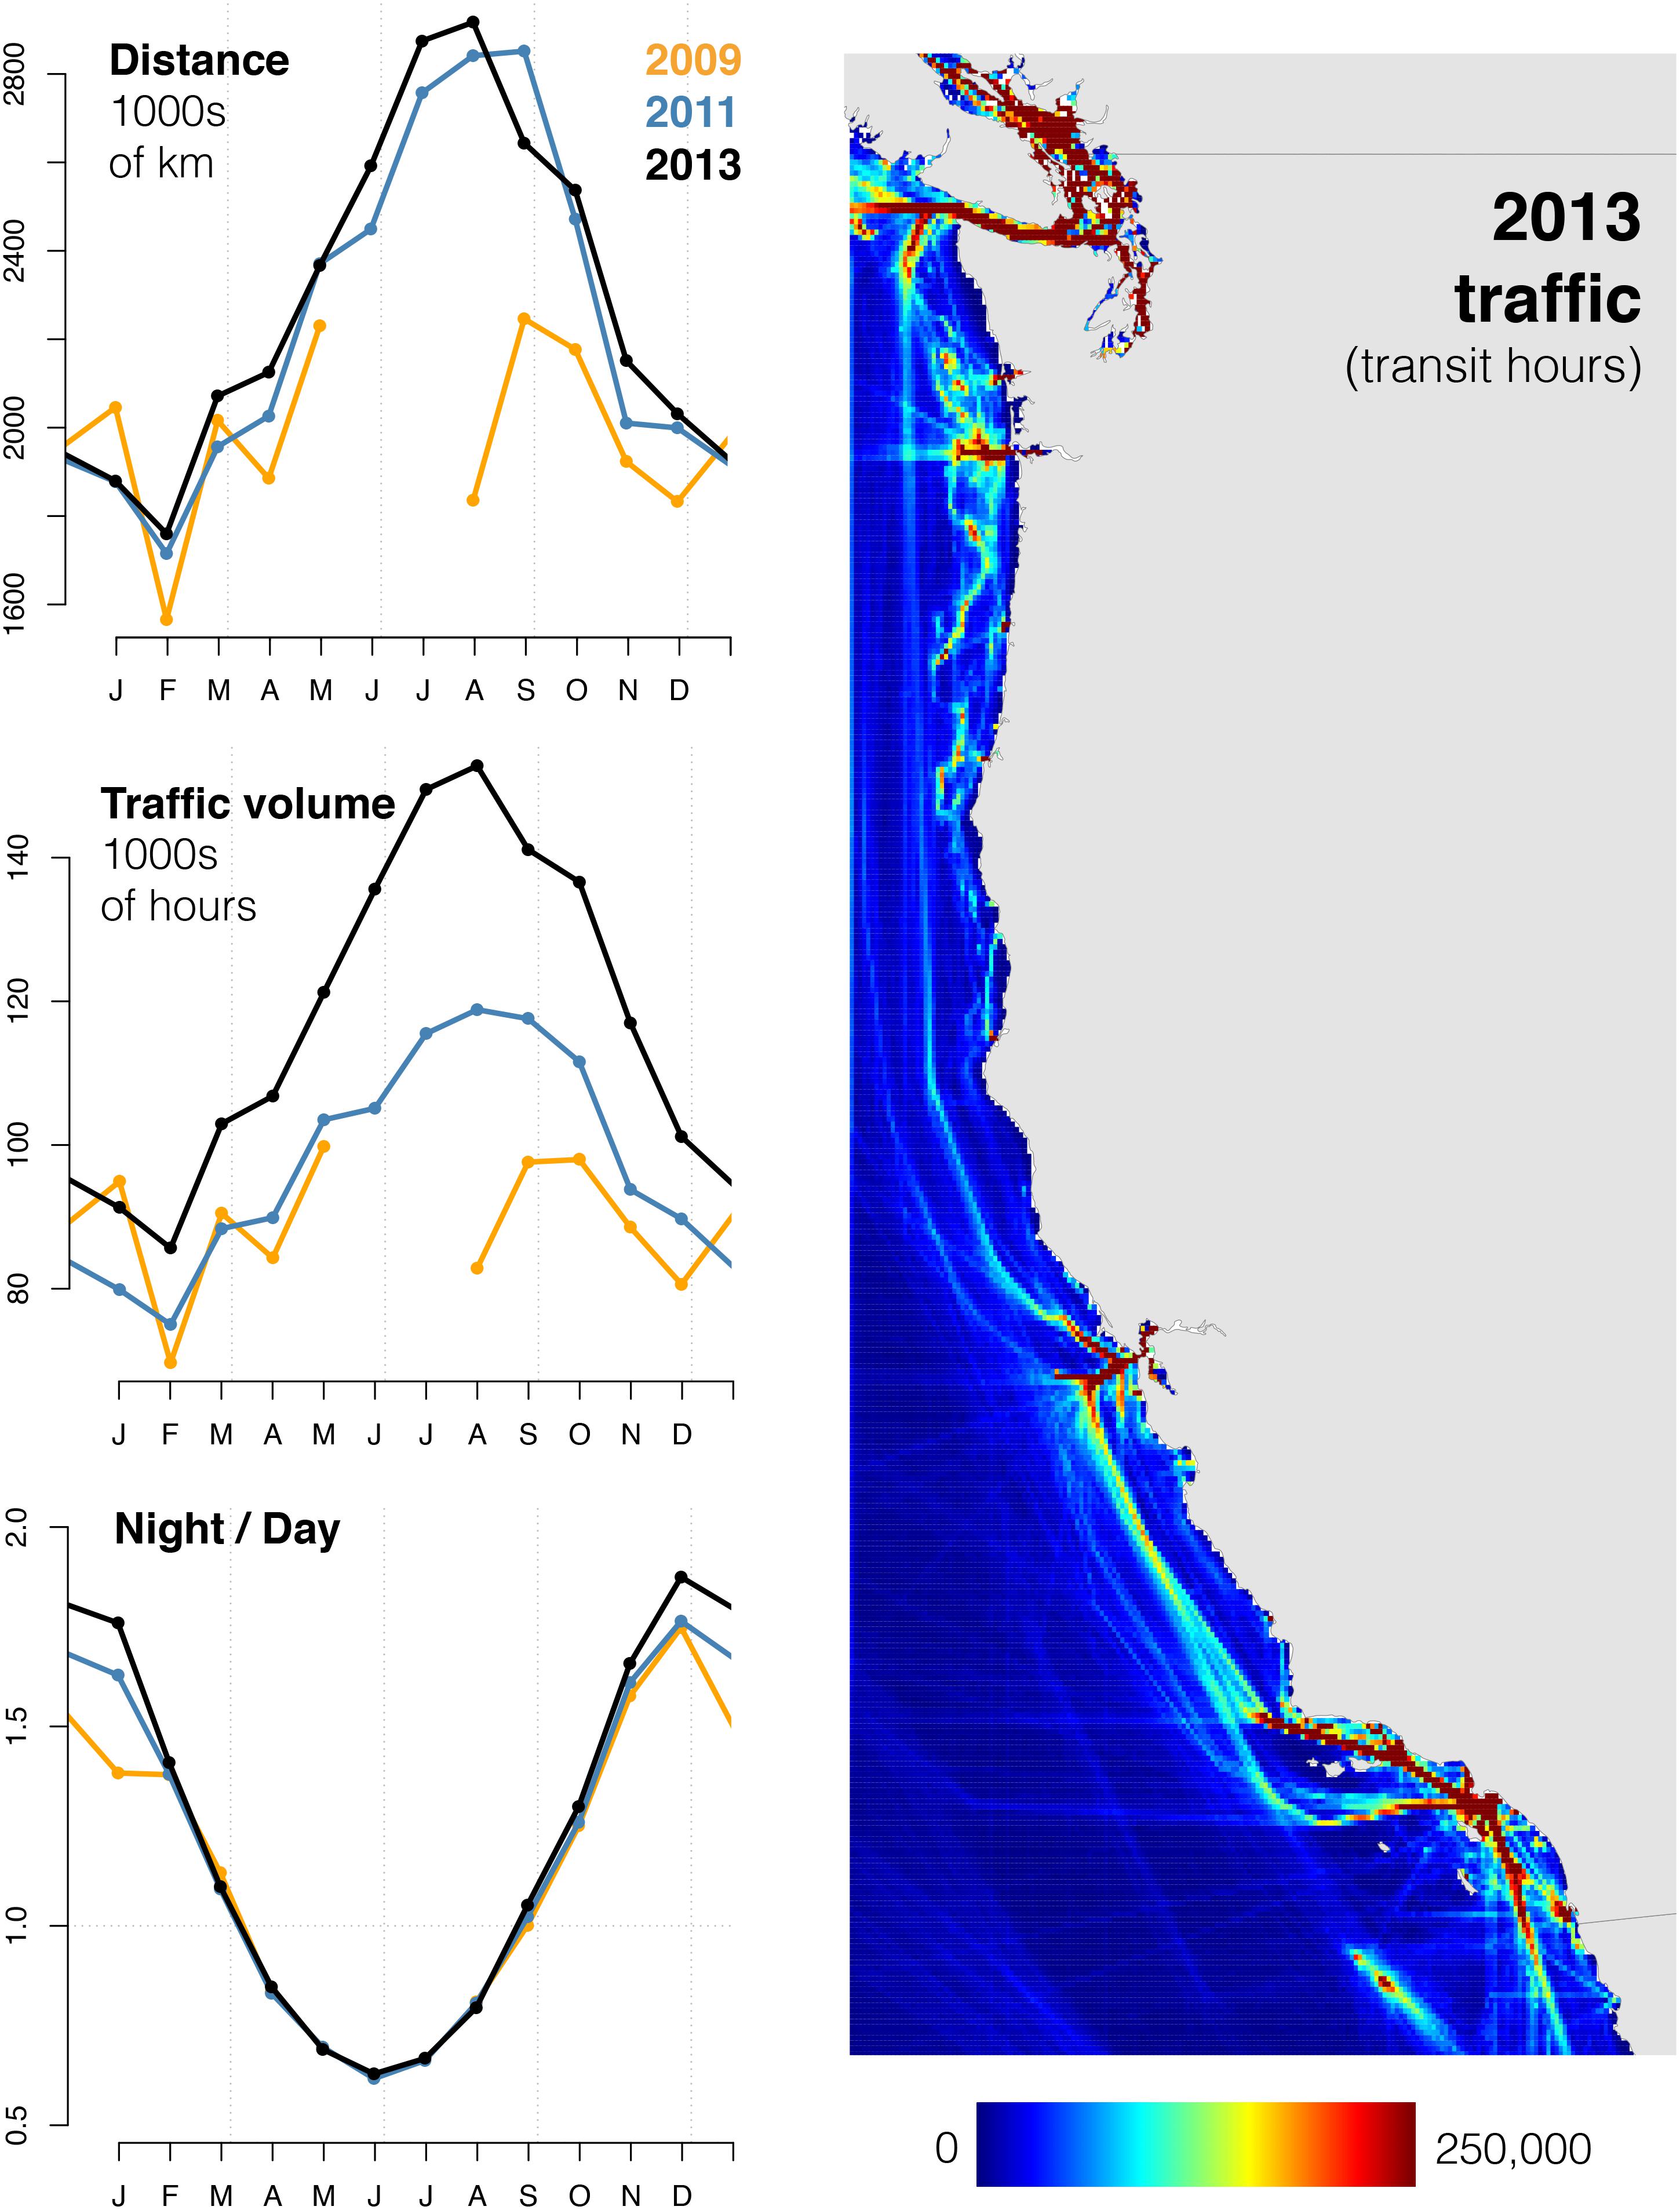
Figure 3. Overall traffic volume across months in 2009 (orange), 2011 (blue), and 2013 (black), using three different metrics: distance traveled by all transmitting ships (top left), traffic volume, i.e., transit hours logged by all transmitting ships (center left), and the ratio of nighttime and daytime transit hours (right). Map (right) displays total traffic volume for 2013.
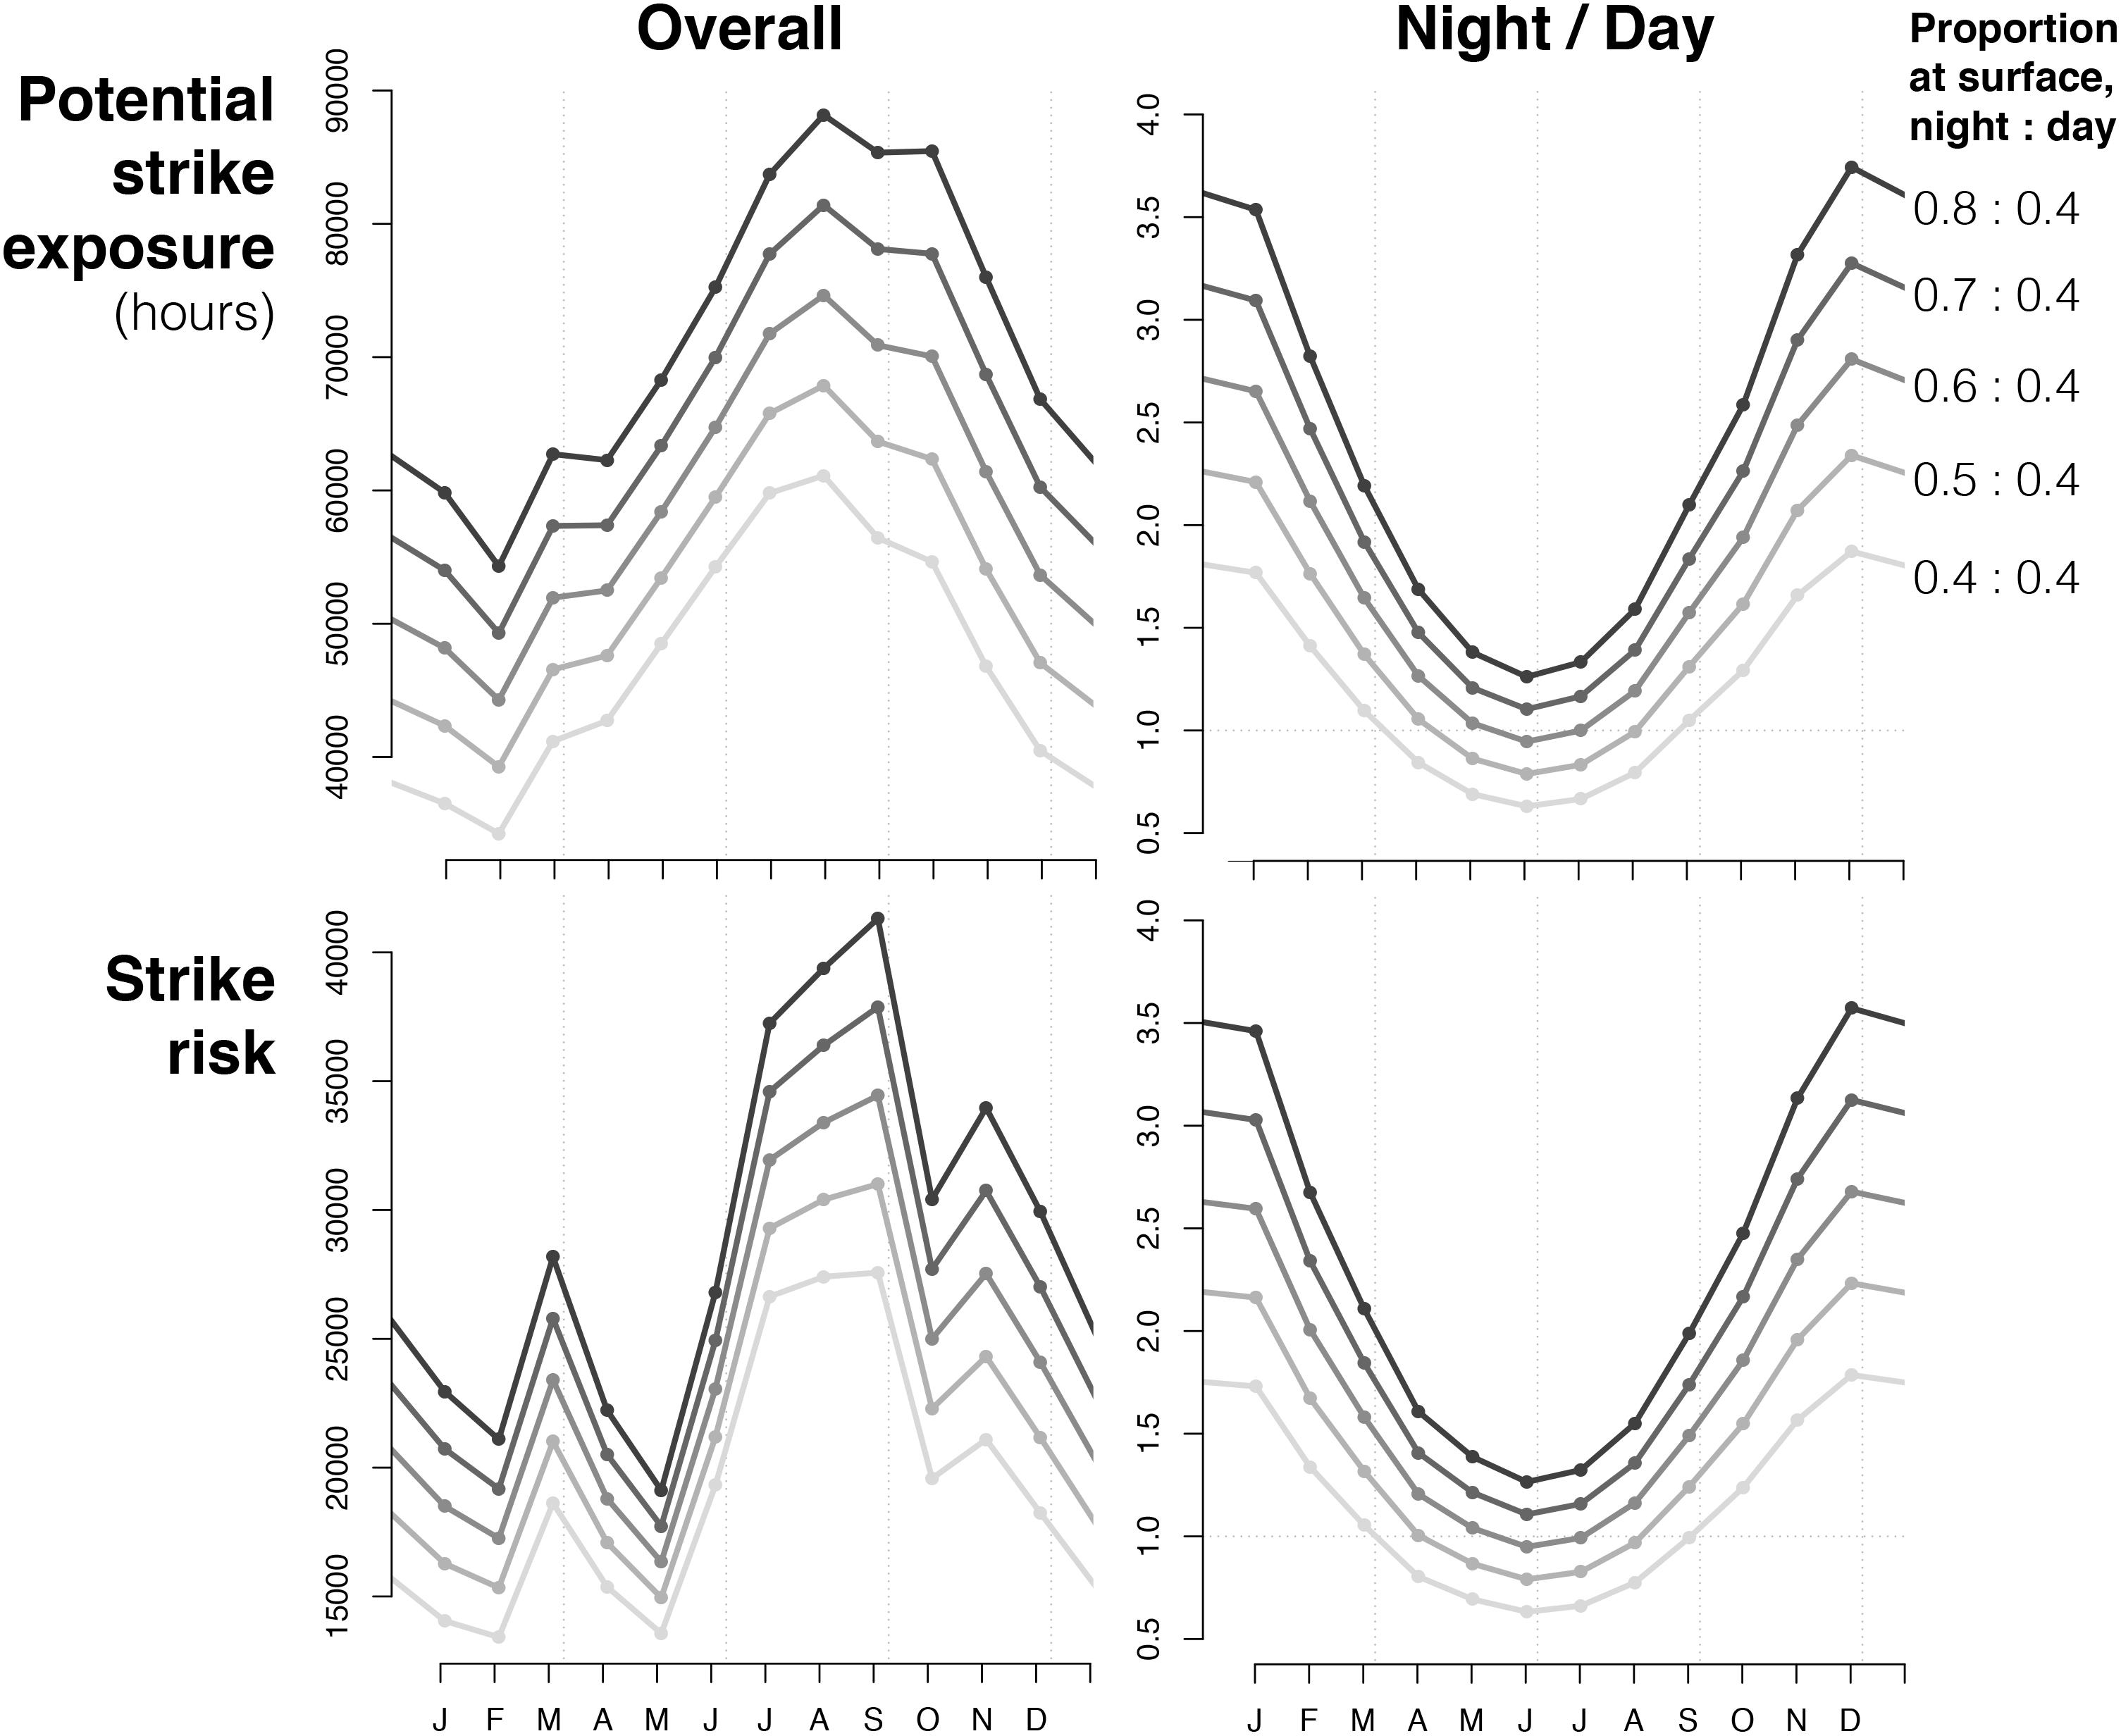
Figure 4. Monthly patterns of 2013 potential ship-strike exposure (i.e., traffic volume scaled by night/day proportion of time whales spend at surface) and strike risk (i.e., strike exposure scaled by habitat suitability) in 2013, with various scenarios for the proportion of time that fin whales spend near the surface during night and day. “Overall” is the cumulative amount of exposure (in hours) and risk (no units) for each month; “Night/Day” is the ratio of cumulative exposure/risk at night to that during day (values above 1.0 = exposure/risk is greater at night).
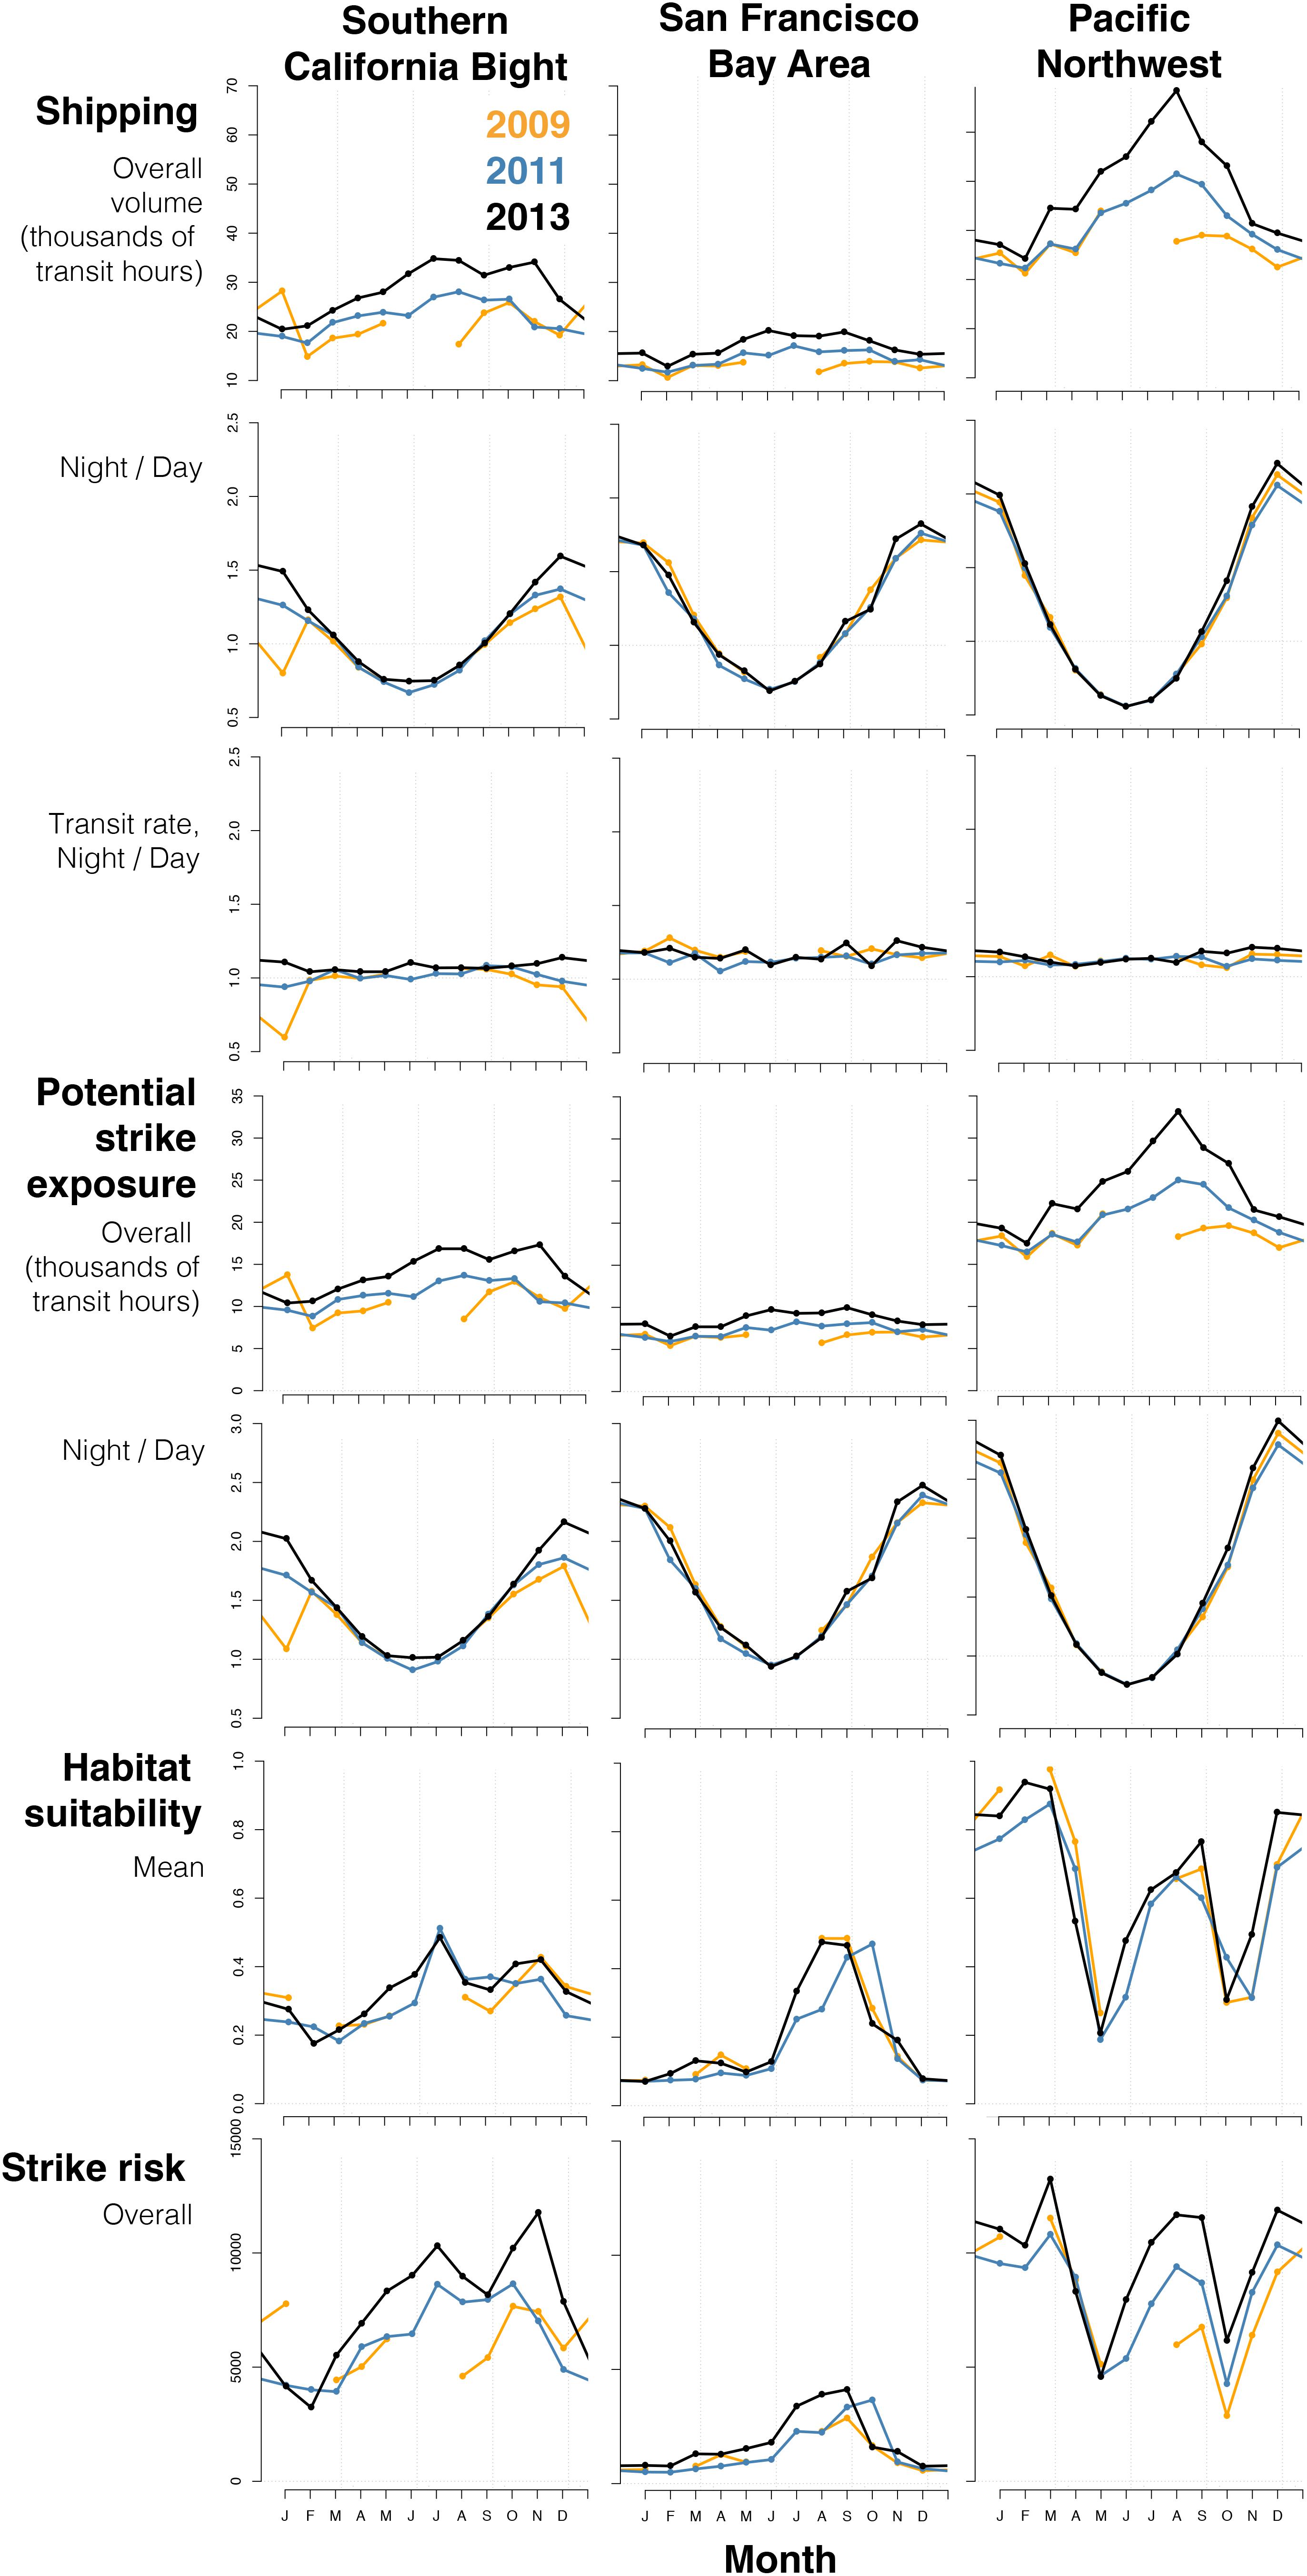
Figure 5. Monthly patterns in ship traffic, potential ship-strike exposure, habitat suitability, and strike risk in three of the busiest subregions of the California Current System. Note that results have not been scaled by the area of the subregion; only differences in seasonal patterns should be compared. Here, exposure and risk were calculated using a 1.36:1 diel ratio of night:day use of the upper 20 m.
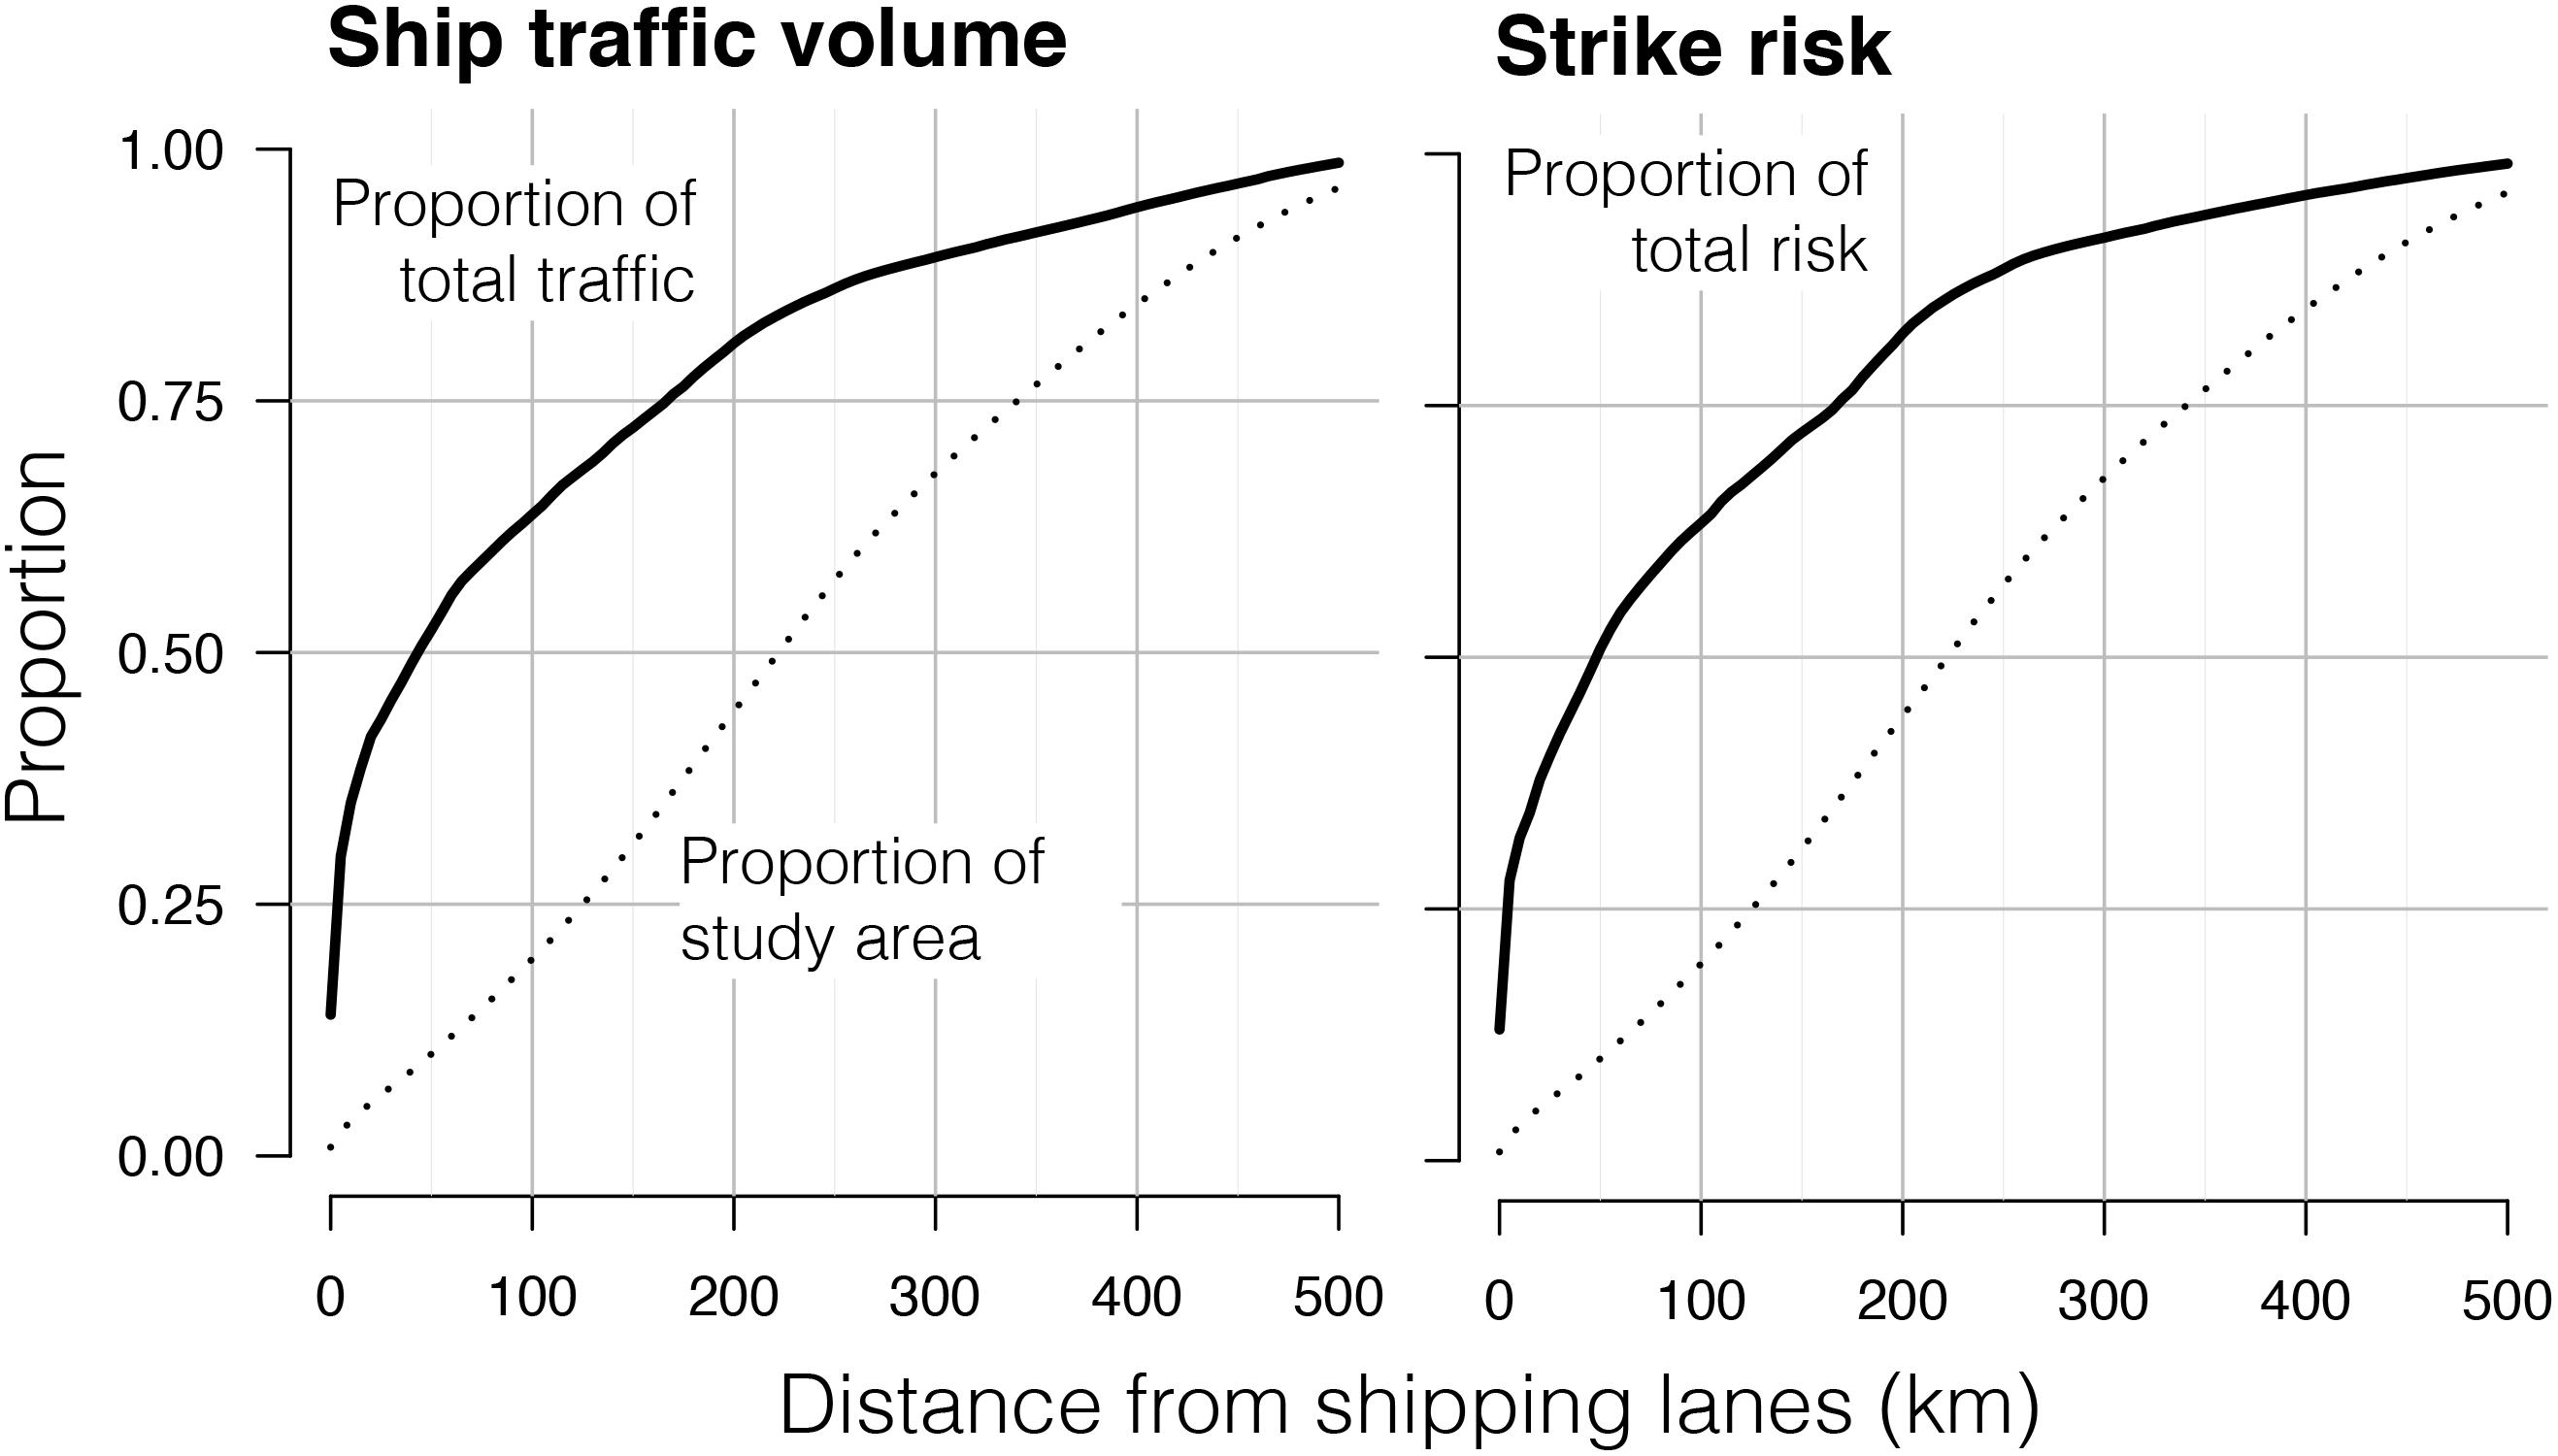
Figure 6. The proportion of overall traffic volume and ship-strike risk occurring within increasing radii of shipping lanes in the California Current System. The dotted line indicates the proportion of the study area occurring within a certain distance of lanes. The position of the black line at that same distance indicates the proportion of the study area-wide sum total of the variable occurring within that area. For example: ∼70% of ship traffic volume occurs within 100 km of lanes, despite representing only ∼25% of the study area. Risk was calculated using the empirical diel ratio (1.36:1) of night:day use of the upper 20 m.
Below we present further details, organized in decreasing order of geographic scope. All findings from all years are visualized in the Supplementary Material, including an atlas with maps of results for all stages of analysis for all months in all three years.
California Current System
Ships in the AIS dataset had an average reported length of 183.44 m, beam of 27.60 m, and draft of 8.39 m (Supplementary Table S1). Mean transit speed decreased between 2009 (12.79 kn) and 2011 (12.60 kn, 1% decrease), and again from 2011 to 2013 (11.03 kn, 12% decrease; two sample, one-sided t-test, df = 58,334, p < 0.0001; also verified with two-sample, one-sided Kolmogorov–Smirnov test, p < 0.0001) (Supplementary Table S2 and Supplementary Figure S1). No strong patterns in the diel ratio of ship speed were evident in study area maps (Supplementary Figure S1), regional maps, or the approaches to shipping lanes (Supplementary Figure S2, showing 2013 only).
Total distance covered by ship traffic, in kilometers, increased by 2% from 2011 (27.3 million) to 2013 (27.9 million). Due to the decrease in transit speed between these years, traffic volume (transit hours) increased by 21% from 2011 (1.2 million) to 2013 (1.4 million) (Supplementary Table S2 and Figure 3). The highest overall traffic volume occurred in late summer (July–September; Figure 3). Daytime traffic volume peaked in July, while nighttime traffic volume peaked in October (Supplementary Figure S3). The highest monthly diel ratio of traffic volume (1.9:1) occurred in December, while the lowest occurred in June (∼0.7, Figure 3). The diel ratio was greater than 1.0 for approximately half the year, from the end of summer to the beginning of spring. Both daytime and nighttime traffic rates, which scale traffic volume by the duration of diel periods (Table 1), were highest in August and lowest in January, for both day and night (Supplementary Figure S4). Nighttime rates were higher than daytime rates throughout the year, especially in winter months (diel ratio of ∼1.2).
Overall, potential strike exposure to ship traffic, which adjusts for diel modes of surface use (Table 1), was greatest from July to October and lowest in January and February (Figure 4). Exposure was greater at night in most months, and highest in October–November. Permutations of the diel ratio of surface use indicated that the highest diel ratios yielded the highest overall exposure, but the shape of the seasonal pattern was not changed. For diel ratios greater than 1.38, nighttime exposure was higher in every month of the year.
Using the empirical surface use diel ratio of 1.36:1, daytime exposure was highest in July and lowest in January. Nighttime exposure was highest in October and lowest in April–June. The diel ratio of overall exposure was highest in December–January (∼2.5) and lowest in May–July (∼0.95), indicating that exposure was greater at night for 9 months of the year.
In all 3 years examined, mean habitat suitability was greatest in July–September. The Southern California Bight and the Pacific Northwest consistently yielded the most suitable habitat in the study area (Supplementary Figure S5; see Supplementary Atlas for results from 2009 and monthly results for all years). Central Californian waters between Cape Conception and Cape Mendocino yielded low suitability in most months except July, August, and September. Complete results of the habitat suitability model are provided and discussed in Scales et al. (2017). Patterns in ship traffic, habitat suitability, and therefore ship-strike risk patterns were similar in 2011 and 2013. Mean ship-strike risk throughout the CCS was substantially higher in July–August, with local maxima in November and March (Figure 4; 2013 only). The highest diel ratios of surface use yielded the highest overall ship-strike risk. For all diel ratios of surface use that we tested, the majority of ship-strike risk throughout the year occurred at night. Ratios greater than 1.5:1 resulted in greater strike risk at night than during the day for every month of the year.
Subregional Patterns
A closer look at the subregions with the most traffic (the Southern California Bight, San Francisco Bay Area, and Pacific Northwest) demonstrated the influence of latitude and habitat suitability on seasonal patterns in strike risk (Figure 5 and Supplementary Figure S6). In all subregions, traffic rates (transit hours per hour of diel period) were higher at night all year long. The Southern California Bight experienced heavier traffic volume from July to November, while the San Francisco Bay Area experienced less seasonal variability (Figure 5), but was lower all year than both the Southern California Bight and the Pacific Northwest. Due to its higher latitudes, Juan de Fuca traffic underwent dramatic seasonal changes in diel ratios for traffic volume (>2.0:1 in winter, nearly 0.5:1 in summer).
Potential strike exposure was higher at night nearly year-round in the Southern California Bight and San Francisco Bay Area (Figure 5). In the Pacific Northwest, exposure was higher during day for May, June, and July, the longest daytime periods of the year within the study area. In all 3 years, mean habitat suitability in the Southern California Bight was highest in July, October, and November and lowest in February and March (Figure 5). In the San Francisco Bay Area, habitat suitability was relatively low in most months but increased abruptly in July–October. In the Pacific Northwest, habitat suitability was highest in December–March and August–September, with consistent drops in May and October. These patterns interacted to yield the greatest strike risk from July to November in the Southern California Bight, July to September in the Bay Area, and December–March and July–September in the Pacific Northwest.
Shipping Lanes
From 2011 to 2013, within the three shipping lanes (Los Angeles, San Francisco, and Juan de Fuca), ship traffic increased by 12% in terms of distance traveled (3.8−4.3 million km) and by 22% in terms of traffic volume (0.17−0.20 million transit hours) (Supplementary Table S2).
The three shipping lanes were found to constitute 0.87% of the study area (Los Angeles: 0.27%; San Francisco: 0.18%; Juan de Fuca: 0.42%; Supplementary Table S3). Given the similarities in traffic patterns for 2011 and 2013 the following shipping lane analyses were conducted using 2013 as a case study. Mean habitat suitability within Los Angeles and Juan de Fuca lanes was approximately 50% higher than the San Francisco lane. Habitat suitability within the Los Angeles lane was highest in late fall and early winter (Supplementary Figure S7). In the San Francisco lane, suitability was high during July–September only. In the Juan de Fuca lane, suitability was highest in winter.
Ships in the shipping lanes contributed 14% of overall traffic volume (Los Angeles: 3%; San Francisco: 3%; Juan de Fuca: 7%) (Supplementary Table S3). When data from all lanes were combined, these percentages remain roughly the same for day and night. The San Francisco lanes host a higher density of traffic (18.89 transit h km–1) than Los Angeles (11.66 transit h km–1) and Juan de Fuca (17.89 transit h km–1). Traffic density increased at night in San Francisco (to 21.63 transit h km–1), while it decreased in the other lanes. Although the diel ratio of traffic volume was close to 1.0 overall (0.98 in Los Angeles and 0.96 in Juan de Fuca), it was much higher in the San Francisco lane (1.37). Monthly patterns in traffic volume within lanes (Supplementary Figure S7) mirrored the pattern described above for the entire study area.
When using the empirical diel ratio of surface use of 1:36:1, shipping lanes contributed 14% of overall ship-strike exposure. The diel ratio of potential strike exposure was a mean of 1.43 across all lanes, highest in San Francisco (1.87), and lowest in Juan de Fuca (1.31). Using this diel ratio, traffic within lanes contributed 13% of overall ship-strike risk (Los Angeles: 5%; San Francisco: 2%; Juan de Fuca: 6%) (Supplementary Table S4). The highest 24-h density of strike risk occurred in the Los Angeles lanes, but the highest nighttime strike-risk density occurred in the San Francisco lane. Across all lanes, the risk of ship strike was nearly doubled at night (diel ratio of 1.94:1; Los Angeles = 1.80:1; San Francisco = 2.53:1; Juan de Fuca = 1.78:1). The seasonal pattern in the diel ratio of strike risk (highest in winter and lowest in summer) was present in all three lanes (Supplementary Figure S7).
Approximately 50% of traffic volume and strike risk in the study area occurred within 50 km of shipping lane boundaries, where ships are either queuing up to enter the lanes or fanning out as they exit (Figure 6). More than 65% of overall traffic volume and strike risk occurred within 100 km of shipping lanes (<25% of the study area).
Patterns in strike risk factors differed within the approaches to the three shipping lanes (0–200 km away) (Supplementary Figure S8). Overall speed declined in the approaches to the San Francisco and Los Angeles lanes, but there was no such change in the Juan de Fuca approach (Supplementary Figure S2). Habitat suitability decreased with increasing distance from the three lanes, indicating that lanes were located in potential high-use areas for fin whales. In all three approaches, traffic volume and strike risk increased dramatically within 25 km of the lanes. In the Los Angeles approach, most traffic volume occurred at night; the diel ratio was particularly high from 60 to 150 km out from the lane, with a prominent peak in nighttime traffic volume at approximately 110 km. Within 150 km of the San Francisco lane, most traffic volume occurred during day with the exception of the final 25 km. In the Juan de Fuca approach, traffic from 60 to 140 km occurred mostly during day.
When data from all months in 2013 were combined, strike risk was considerably higher at night throughout the approaches to all three lanes (diel ratio > 1.5) (Supplementary Figure S8). In the Los Angeles approach, strike risk was highest from 75 to 125 km away and peaks 110 km away (diel ratio = 2.6). In the San Francisco approach, strike risk was highest in the immediate vicinity of the lane (diel ratio = 2.1) but increased again beyond 150 km away. In the Juan de Fuca approach, strike risk was highest within 50 km of the lane (diel ratio varied between 1.7 and 2.1) with no clear pattern further out.
Strike Expectation and Speed Reductions
Our overall finding was that, given patterns of ship transit speed in the CCS, an avoidance response would only substantially impact overall ship strike rates if the probability of strike changed dramatically at speeds between 7 and 13 kn. The effectiveness of speed reductions therefore depends upon this strike threshold. Despite the diel patterns in strike risk reported above, 24-h reductions in speed would still be twice as effective as nighttime-only speed reductions (Figure 2C). If such reductions can only occur within a limited area, they would reduce ship-strike expectation most effectively when applied around shipping lanes in a 25–50 km buffer (Figure 2D). Further details are provided below.
Annual Changes in Strike Expectation
In both 2011 and 2013, avoidance models indicated that ship-strike expectation increased when strike thresholds were lower (i.e., when fin whales were less likely to avoid slower ships; Figure 2B). The steepest increases in strike expectation occurred between strike thresholds of 7 and 13 kn, indicating that patterns of fin whale response to ships in this speed range will have the greatest impact on overall strike rates. Changes in mean ship speed within this range would also affect strike rates. Due to the decline in mean speed between years (12% decrease from 12.6 kn in 2011; Supplementary Table S2 and Supplementary Figure S1), the exact location of the strike threshold determined whether ship-strike expectation increased or decreased from 2011 to 2013. If the fin whale strike threshold is below 9 kn, then strike expectation was much higher in 2013 in both absolute and proportional terms (Figure 2B). If the threshold is above 9 kn, strike expectation was higher in 2011. However, since overall risk was low in high strike threshold scenarios, the difference between the 2 years was negligible in absolute terms but proportionally substantial.
Nighttime Speed Reductions
Strike threshold models in our 2013 case study demonstrated the intuitive results that (i) the impact of speed reductions on strike expectation depended on the strike threshold of fin whales, (ii) that strike expectation lowered with greater speed reductions, and (iii) 24-h speed reductions yielded lower strike expectation than nighttime reductions (Figure 2C). For example, if the fin whale strike threshold was at 10 kn, a 24-h speed reduction of 1 kn would reduce strike expectation by approximately 15%. Doubling the speed reduction to 2 kn would also double the effect (∼30% reduction in strike expectation), but reductions of 3 kn or greater yielded diminishing returns. These threshold avoidance models demonstrated that speed reductions would have a substantial impact only if avoidance probability was a steep function of ship speed within only a certain and limited range of ship speed, 7–13 kn (Figure 2C).
In our simplified framework in which the strike threshold was the same both day and night, the efficacy of speed reductions at night was approximately half that of 24-h reductions (Figure 2C). At a strike threshold of 10 kn, for example, a nighttime-only reduction of 1 kn reduced overall strike expectation by <10%. Looking across all strike thresholds, the same drop in strike expectation could be achieved with a 24-h speed reduction of 1 kn or a nighttime-only reduction of 2.5−3.0 kn. In order to match the same effect of a 24-h speed reduction of 2 kn, nighttime reductions would have to be >5 kn.
Speed Reduction Buffers Around Shipping Lanes
Since shipping lanes contained only 14% of west coast traffic volume in our 2013 case study (Supplementary Table S3) and surrounding waters contained high volumes as well (for example, waters within 50 km of lanes contained 50% of overall traffic volume; Figure 6), the greatest reduction in strike expectation might be achieved with the strategic application of speed reductions within a spatial buffer surrounding lanes. Strike threshold models were used to explore what the most effective spatial buffer might be under various avoidance scenarios (Figure 2D).
Buffers of 25 and 50 km yielded the most dramatic reductions in strike expectation across strike threshold and speed reduction scenarios, with diminishing returns using greater buffer radii. For example, assuming a strike threshold of 10 kn, a 2-kn speed reduction applied within a 50 km buffer would yield a 20% drop in area-wide strike expectation; the same speed reduction applied strictly within lanes would reduce strike expectation by <5%.
Discussion
Collision with ships is considered the most pressing conservation issue for the endangered fin whales in U.S. waters (National Marine Fisheries Service [NMFS], 2010; Carretta et al., 2018). To understand the scope of this issue and address it strategically, the behavioral ecology of fin whales must be considered when assessing strike risk and evaluating potential mitigation measures. Current estimates suggest fin whale strike mortality rates alone are 2.7× the Potential Biological Removal limit for non-natural mortality (Rockwood et al., 2017), and these estimates did not account for increased surface use at night, which our findings suggest is when collision risk is highest. The improved strike risk estimates presented here enable us to highlight priority management areas, compare possible mitigation strategies within those areas, and identify future research priorities.
Our findings highlight the interacting factors governing strike risk, which influence the efficacy of management strategies. At night, when fin whales tend to remain near the surface, ship traffic rates are slightly higher than during the day. Traffic volume also exhibits strong diel patterns in the approaches to shipping lanes, perhaps due to the availability of on-shore labor. These patterns exacerbate risk during winter when nights are longest, particularly in higher latitudes. The distribution and extent of suitable habitat shift on a monthly basis underneath the relatively stable geography of shipping, and the alignment of all of these patterns within a given subregion determines the seasonality of ship-strike risk for fin whales. Throughout the CCS, however, total strike risk was generally highest at night all year long, even during long summer days. Within coastal shipping lanes, total annual nighttime strike risk was twice the daytime risk. In reality, this nighttime risk is likely compounded by reduced likelihoods of visual detection and avoidance on the part of the ship, and perhaps also the whale.
Comparable Studies and Future Directions
The geography of strike risk we found differs from the predicted mortality distributions in Rockwood et al. (2017), particularly in the Pacific Northwest and the waters of central California from Pt. Conception to Cape Mendocino, where our assessment of annual overall risk is comparatively low. The differences can be attributed primarily to our different data sources for fin whale distribution. We selected a habitat suitability model developed in part from tag data, which is susceptible to bias due to deployment location and inherently small sample sizes (Scales et al., 2017), because it was the only year-round dataset available for the entire west coast. Rockwood et al. (2017) used data from line-transect surveys conducted by the National Marine Fisheries Service Southwest Fisheries Science Center (NMFS SWFSC), which are systematically distributed in space but not in time; they are conducted between July and December and their spatial effort in each month depends on logistical constraints and weather (Becker et al., 2016). Interestingly, our monthly analyses indicate high levels of habitat suitability and strike risk for waters off central California in July through September, but low levels for other months. If we had based habitat suitability models only upon tag and environmental data from late summer and early fall (Scales et al., 2017), our findings would align better with Rockwood et al. (2017). The discrepancy in the Pacific Northwest may also be a result of our habitat suitability model’s extrapolation for this data-poor area (see the section “Materials and Methods” as well as discussion in the section “Limitations”).
The same NMFS SWFSC data were used in a ship-strike risk study for fin whales in the Southern California Bight (Redfern et al., 2013). Again, the fin whale distributions used in that model, which indicated higher densities offshore in the northern Southern California Bight, were similar to our habitat suitability distributions for summer and fall. In all other months, however, we found consistently high habitat suitability throughout the Southern California Bight, particularly inshore and in southern portions. Ultimately, ensemble approaches that examine multiple datasets, multiple modeling techniques, and ideally multiple species (e.g., Redfern et al., 2013) will be critical to understand variability in the system and uncertainty in model predictions.
Our strike risk estimates for the offshore waters of the Pacific Northwest subregion concurred in some respects with those in Nichol et al. (2017), in which fin whale distribution was based upon four-season aerial line-transect surveys off southwest Vancouver Island. In that study, the highest fin whale densities were observed offshore and above the continental slope, further out than the most suitable habitat predicted by Scales et al. (2017) and the present study (Supplementary Figure S5). Fin whales were found within the easternmost extent of their surveys in the Strait of Juan de Fuca, where heavy shipping traffic yielded high strike risk despite the low fin whale densities observed. Nichol et al. (2017) also modeled strike lethality for this region based on ship type and speed. They observed that the offshore fin whale distribution overlapped a region with faster ship traffic, which resulted in another high-risk area west of the shelf break.
The area in which our habitat suitability models diverge most dramatically from current knowledge, however, is within the interior waters between Vancouver Island and the mainland, where fin whale encounters are rare (Ford, 2014; Towers et al., 2018). At a minimum, the habitat suitability and strike risk we predicted highlight this area’s potential viability as future habitat for the recovering fin whale population. Given the density of ship traffic, the long hours of darkness during winter, and the present number of ship strikes reported in the region (Towers et al., 2018), our results further suggest that ship-strike risk here may be considerable, especially in winter. We recommend increased survey and tagging effort in these waters, particularly in winter months.
Our findings suggest that fin whale surface use and ship avoidance are key determinants of strike probabilities, but our knowledge of both is limited. Collecting data to inform these parameters, for both fin whales and other recovering baleen whale species, is a clear next step, particularly in areas where elevated ship traffic and whale habitat suitability overlap. Additional winter and spring occurrence data from throughout the CCS would also improve risk estimates for these months, when surface zone use may be highest (Keen et al., 2019). Research focused on the traffic patterns of, and whale responses to, smaller vessels would allow us to assess another potential source of strike risk. The National Marine Fisheries Service ship strike database, which we did access for this study, could be used to assess current knowledge of strikes involving small vessels.
Limitations
Our analyses were based on several simplifications and assumptions, which were necessary due to (i) the computational burden of processing AIS ship traffic data, and (ii) the paucity of data available on fin whale behavioral responses to ships. We assumed that AIS data are accurate and adequately represent the maritime traffic that poses the greatest risks to fin whales, but military traffic and many small watercraft are often excluded from AIS, so strike risk is likely greater than we determined here.
As stated previously, our models were also simplified to assume that all AIS-transmitting ships, whether 65 or 1,000 ft in length, represent the same risk to a fin whale. We did not categorize ship traffic or parse strike risk according to ship type, hull draft, or speed. Instead, we simplified models by treating the upper 20 m of the water column as the zone of risk (2.4× the mean hull draft in our AIS dataset) because that was the surface use boundary used in the most relevant diel dive behavior studies (Keen et al., 2019). In reality, the radius of a ship’s hydrodynamic draw, which could pull whales toward the ship’s hull as it passes close by, increases with both hull draft and transit speed (Silber et al., 2010). McKenna et al. (2015) assumed a zone of hydrodynamic risk of 2× the hull draft. Rockwood et al. (2017) compared whale mortality rates based on strike zones of 1× and 2× ship draft; doubling the strike zone increased whale mortality rates by 17–37%.
We also assumed that diel patterns in fin whale surface use were constant throughout the study area, across all months, and regardless of local habitat conditions, when in actuality behavior was likely more nuanced. Currently fin whale behavior while at the surface at night is not well understood. Depth-sensor tags in Keen et al. (2019) demonstrated that deep dives essentially ceased after nightfall, but behaviors within the surface zone could not be resolved with the tag technology in use. A multi-sensor tag deployed on a fin whale off California in Friedlaender et al. (2015) also recorded that deep dives ceased after dark, and the tag accelerometer provided no indication of feeding behavior at the surface. Analysis of the diel horizontal movements of the animals in the present study are forthcoming and may provide additional insight into behavior at night.
In their analysis of tag data from central and southern California, Keen et al. (2019) suggest that the diel ratio of surface use is highest in winter and spring, which would further compound the seasonal risk patterns we present here. We recommend further study into the seasonal and geographic variation of surface use, and the underlying drivers thereof, particularly in year-round high-use areas such as the Southern California Bight (Scales et al., 2017). The seasonal migratory movements of California–Oregon–Washington and Pacific Canada fin whales are not well understood, but are thought to diverge from the canonical migratory behaviors of other sympatric baleen whales (i.e., breeding in low latitude regions in winter, feeding in high-latitude regions in summer) (Ford, 2014; Scales et al., 2017). Extended occupancy within high-risk sub-regions would also increase ship-strike risk for some fin whales in and around the CCS.
Within our avoidance models we assumed that the strike probability function was the same both day and night, when in reality differences are likely created by altered behavioral states as well as compromised detectability for both whale and ship. Additionally, in predicting expected strike rates, our primary concern was the eventuality of collisions, not their lethality. The number of uncertainties in play make it difficult to extrapolate beyond an assessment of strike risk to a prediction of strike rates or mortality rates, which would be necessary in order to assess the population-level effects of the diel patterns presented here. We used the above assumptions to simplify our analysis, reserving theoretical computations for the stages involving the most uncertainty regarding fin whale behavior: the proportion of time spent at the surface and the avoidance response to ships given their transit speed. Avoidance response models allowed us to move beyond strike risk to scenarios of strike expectation and the potential efficacy of various ship speed reduction measures. In our analysis we prioritized avoidance modeling over predictions of lethality, which is also expected to be a function of ship speed (Conn and Silber, 2013), for three reasons: first, speed-dependent avoidance rates would have been needed in order to then estimate mortality rates; second, we consider it probable that avoidance rates likely reflect lethality patterns in most cases, since any ship that a fin whale fails to avoid is likely moving quickly enough to cause serious injury, if not mortality; and third, the uncertainties and assumptions involved in a lethality analysis would outweigh its usefulness in a management context. Data pertaining to the relationship between ship type, draft, speed, and strike lethality would be invaluable in these matters, and further encouragement of voluntary reporting by ships could be one means of addressing these knowledge gaps.
Several studies have treated whale avoidance response as a non-linear function of ship speed (e.g., Kite-Powell et al., 2007; Gende et al., 2011), while elsewhere it has been treated as linear (Conn and Silber, 2013). In the non-linear framework we used, speed reductions would measurably ameliorate strike rates only if the baseline speed in question is within a certain range of the whale’s avoidance threshold. For example, a 5-kn speed reduction from 25 to 20 kn may not improve a fin whale’s chances of avoidance, but the same reduction from 12 to 7 kn may help greatly. In fact, the former scenario may lead to an increase in strike expectation, since the drop in speed to 20 kn increases the temporal overlap of whales and ships in an area without reducing their probability of avoidance. A compounding factor here is the lethality of strikes, which is expected to diminish once low speeds are reached (Gende et al., 2011). Our models demonstrated (1) that the actual location of the fin whale strike threshold determines whether strike expectation increased or decreased from 2011 to 2013 (Figure 2B), and (2) that the efficacy of speed reductions hinges upon the location of the strike threshold for fin whales (Figures 2C,D). It should be noted that while we treated strike thresholds as a stable value in our models, the ability of fin whales to detect and avoid ships is likely dependent upon their behavioral state, light conditions, acoustic cues, previous experience with ships, and possibly many other dynamic factors.
In the Pacific Northwest, the high strike-risk prediction must be interpreted within the context of conflicting considerations. The habitat suitability models used were based on tags deployed primarily in California waters, with only a few tag deployments in the Pacific Northwest (Scales et al., 2017). Boat-based line-transect surveys in the U.S. waters of Washington and Oregon have yielded low fin whale densities (Becker et al., 2016); however, effort was limited in winter, when habitat suitability was predicted by the Scales et al. (2017) model to be highest. Acoustic detections of fin whales peak during winter and spring (Oleson and Hildebrand, 2012), lending support to the habitat predictions our results are based upon.
Ship-Strike Mitigation
Our analyses revealed that the coast’s shipping lanes contained 14% of traffic volume and contributed 13% of all strike risk, which confirm the conclusion in Rockwood et al. (2017) that mitigation measures enforced only within lanes would address just a small fraction of the CCS ship-strike problem. Modifications to lane placement, which may locally reduce fin whale strikes (although additional species with different distributions also need to be considered; Redfern et al., 2013), would also only partially alleviate a portion of the strike risk.
Given that the implementation of speed reductions is unlikely to be feasible at the scale of the entire CCS, we explored alternative solutions by scaling the application of speed reductions in space and time. Our avoidance models suggested that 24-h speed restrictions applied around and within lanes would be more effective and feasible than nighttime restrictions implemented everywhere. For example, a 2-kn speed reduction within 50 km of lanes would reduce CCS strike expectation by 20–30%, depending on strike threshold (8–13 kn, respectively; Figure 2D). To achieve the same strike reduction using nighttime-only restrictions, mean nighttime ship speed throughout the CCS would have to decrease by a minimum of 3 kn (Figure 2C). Our speed reduction buffer models could be helpful in future considerations of adjustments/extensions to shipping lanes off the California coast, and an additional measure of conservation and ship-strike risk reduction or impact could be achieved by correlating lane adjustments with ship speed reductions.
Monthly variation in strike risk suggests seasonal mitigation within some subregions of the CCS might be an effective strategy. These monthly changes were driven by shifting habitat suitability, latitudinal and seasonal variation in hours of darkness, and thus variation in total surface use by fin whales (Figure 5 and Supplementary Figure S6). Our models suggest the San Francisco Bay Area harbors highly suitable fin whale habitat, and correspondingly high strike risk, for only a few months of the year (August–October). However, it is important to note that while seasonal mitigation may be effective in the case of fin whales, other at-risk species that use the area must also be considered. In Southern California, habitat suitability and ship-strike risk are relatively high for the majority of the year (Figure 5 and Supplementary Figure S6), indicating that four-season mitigation policies would be most appropriate for this region.
Our avoidance models indicated that even if ship speed reduction policies are extreme, strike expectation could be reduced but not eliminated. Based on a reasonable strike avoidance threshold of 9–12 kn, a 3-kn reduction applied throughout the area would reduce the ship-strike expectation by roughly half. This would be a considerable step forward, but additional management would still be necessary to reduce mortality to within maximum sustainable levels (Rockwood et al., 2017). Speed reductions should therefore be considered an effective measure, one that also improves fuel efficiency, and reduces anthropogenic noise and emissions (Corbett and Fischbeck, 1997). However, a viable mitigation plan will also necessitate (i) considering mitigation measures beyond our study area, (ii) considering spatial management schemes such as the expansion of shipping lanes and Areas to Be Avoided, and (iii) reckoning with the economic infrastructure and the mentality of the consumer base that drive shipping levels to such great heights. However, the scale of a problem should never be used to warrant inaction, but rather to elevate urgency and resolve. Our hope is that the findings presented here will support effective solutions to the ship-strike problem in the CCS and elsewhere.
Data Availability Statement
Publicly available datasets were analyzed in this study. These data can be found here: http://marinecadastre.gov/ais/.
Author Contributions
All authors consulted on designing the analyses and edited the manuscript. KS conducted the habitat suitability modeling. BR and EK analyzed the AIS data. EK conducted all other analyses and wrote the first draft of the manuscript.
Conflict of Interest
The authors declare that the research was conducted in the absence of any commercial or financial relationships that could be construed as a potential conflict of interest.
Acknowledgments
We gratefully acknowledge the support of the U.S. Navy, specifically N45, Living Marine Resources, and U.S. Pacific Fleet. We thank our collaborators from the Marine Mammal Monitoring on Naval Ranges group at the Naval Undersea Warfare Center. We also wish to thank Sean Hastings at the NOAA Channel Islands National Marine Sanctuary as well as Jay Barlow and Eric Archer at the NOAA Southwest Fisheries Science Center, and two reviewers for helpful comments on this manuscript.
Supplementary Material
The Supplementary Material for this article can be found online at: https://www.frontiersin.org/articles/10.3389/fmars.2019.00730/full#supplementary-material
Footnotes
- ^ https://catalog.data.gov/dataset/shipping-fairways-lanes-and-zones-for-us-waters44831
- ^ http://marinecadastre.gov/ais/
References
Aguilar, A. (2009). “Fin whale: Balaenoptera physalus” in Encyclopedia of Marine Mammals, eds. W.F. Perrin, B. Würsig, J.G.M. Thewissen. (Amsterdam: Elsevier), 368–371.
Becker, E., Forney, K., Fiedler, P., Barlow, J., Chivers, S., Christopher, E., et al., (2016). Moving towards dynamic ocean management: how well do modeled ocean products predict species distributions? Remote Sens. 8:149. doi: 10.3390/rs8020149
Burrows, J. A., Johnston, D. W., Straley, J. M., Chenoweth, E. M., Ware, C., Curtice, C., et al. (2016). Prey density and depth affect the fine-scale foraging behavior of humpback whales Megaptera novaeangliae in Sitka Sound, Alaska, USA. Mar. Ecol. Proc. Ser. 561, 245–260. doi: 10.3354/meps11906
Calambokidis, J., Schorr, G. S., Steiger, G. H., Francis, J., Bakhtari, M., Marshall, G., et al. (2007). Insights into the underwater diving, feeding, and calling behavior of blue whales from a suction-cup-attached video-imaging tag (CRITTERCAM). Mar. Technol. Soc. J. 41, 19–29. doi: 10.4031/002533207787441980
Carretta, J. V., Forney, K. A., Oleson, E., Martien, K., Muto, M. M., Lowry, M. S., et al. (2018). US Pacific Marine Mammal Stock Assessments. NOAA-TIM-NMFS-SWFSC-488, US Department of Commerce. Silver Spring, MD: NOAA.
Committee on the Status of Endangered Wildlife in Canada [COSEWIC] (2019). Available at: http://www.cosewic.ca/index.php/en-ca/ (accessed June 27, 2019).
Conn, P. B., and Silber, G. K. (2013). Vessel speed restrictions reduce risk of collision-related mortality for North Atlantic right whales. Ecosphere 4, 1–15. doi: 10.1890/ES13-00004.1
Corbett, J. J., and Fischbeck, P. (1997). Emissions from ships. Science 80, 823–824. doi: 10.1126/science.278.5339.823
R Core Team (2016). R: A Language and Environment for Statistical Computing. Vienna: R Foundation for Statistical Computing.
Douglas, A. B., Calambokidis, J., Raverty, S., Jeffries, S. J., Lambourn, D. M., and Norman, S. A. (2008). Incidence of ship strikes of large whales in Washington State. J. Mar. Biol. Assoc. 88, 1–12.
Fonnesbeck, C. J., Garrison, L. P., Ward-Geiger, L. I., and Baumstark, R. D. (2008). Bayesian hierarchical model for evaluating the risk of vessel strikes on North Atlantic right whales in the SE United States. Endanger. Species Res. 6, 87–94. doi: 10.3354/esr006087
Friedlaender, A. S., Goldbogen, J. A., Hazen, E. L., Calambokidis, J., and Southall, B. L. (2015). Feeding performance by sympatric blue and fin whales exploiting a common prey resource. Mar. Mammal Sci. 31, 345–354. doi: 10.1111/mms.12134
Friedlaender, A. S., Hazen, E. L., Nowacek, D. P., Halpin, P. N., Ware, C., Weinrich, M. T., et al. (2009). Diel changes in humpback whale Megaptera novaeangliae feeding behavior in response to sand lance Ammodytes spp. behavior and distribution. Mar. Ecol. Proc. Ser. 395, 91–100. doi: 10.3354/meps08003
Friedlaender, A. S., Tyson, R. B., Stimpert, A. K., Read, A. J., and Nowacek, D. P. (2013). Extreme diel variation in the feeding behavior of humpback whales along the western Antarctic Peninsula during autumn. Mar. Ecol. Proc. Ser. 494, 281–289. doi: 10.3354/meps10541
Friedlaender, A.S., Johnston, D.W., Tyson, R.B., Kaltenberg, A., Goldbogen, J.A., Stimpert, A.K., et al. (2016). Multiple-stage decisions in a marine central-place forager. R. Soc. Open Sci. 3:160043. doi: 10.1098/rsos.160043
Gende, S. M., Hendrix, A. N., Harris, K. R., Eichenlaub, B., Nielsen, J., and Pyare, S. (2011). A Bayesian approach for understanding the role of ship speed in whale-ship encounters. Ecol. Appl. 21, 2232–2240. doi: 10.1890/10-1965.1
Jahoda, M., Lafortuna, L., and Sciara, D. I. (2003). Mediterranean fin whale’s (Balaenoptera physalus) response to small vessels and biopsy sampling assessed through passive tracking and timing of respiration. Mar. Mammal Sci. 19, 96–110. doi: 10.1111/j.1748-7692.2003.tb01095.x
Jensen, A. S., and Silber, G. K. (2003). Large Whale Ship Strike Database. U.S. Department of Commerce, NOAA Technical Memorandum. Silver Spring, MD: NOAA.
Keen, E. M., Falcone, E. A., Andrews, R. D., and Schorr, G. S. (2019). Diel dive behavior of fin whales (Balaenoptera physalus) in the Southern California Bight. Aquat. Mamm. 45, 233–243. doi: 10.1578/am.45.2.2019.233
Kite-Powell, H. L., Knowlton, A., and Brown, M. (2007). Modeling the Effect of Vessel Speed on Right Whale Ship Strike Risk. Project report for NOAA/NMFS Project NA04NMF47202394. England: Edgerton Research Laboratory and Woods Hole Oceanographic Institution
Laist, D. W., Knowlton, A. R., Mead, J. G., Collet, A. S., and Podesta, M. (2001). Collisions Between Ships and Whales. Mar. Mammal Sci. 17, 35–75. doi: 10.1111/j.1748-7692.2001.tb00980
McKenna, M., Katz, S., Condit, C., and Walbridge, S. (2012). Response of commercial ships to a voluntary speed reduction measure: are voluntary strategies adequate for mitigating ship-strike risk? Coast. Manag. 40, 634–650. doi: 10.1080/08920753.2012.727749
McKenna, M. F., Calambokidis, J., Oleson, E. M., Laist, D. W., and Goldbogen, J. A. (2015). Simultaneous tracking of blue whales and large ships demonstrates limited behavioral responses for avoiding collisions. Endang. Species Res. 27, 219–232. doi: 10.3354/esr00666
National Marine Fisheries Service [NMFS] (2010). Recovery Plan for the Fin Whale (Balaenoptera physalus). Silver Spring, MD: National Marine Fisheries Service.
Neilson, J. L., Gabriele, C. M., Jensen, A. S., Jackson, K., and Straley, J. M. (2012). Summary of reported whale-vessel collisions in Alaskan waters. J. Mar. Biol. 2012, 1–18. doi: 10.1155/2012/106282
Nichol, L. M., Wright, B. M., O’Hara, P., and Ford, J. K. B. (2017). Risks of lethal vessel strikes to humpback and fin whales off the west coast of Vancouver Island, Canada. Endang. Species Res. 32, 373–390. doi: 10.3354/esr00813
Nowacek, D. P., Johnson, M. P., and Tyack, P. L. (2004). North Atlantic right whales (Eubalaena glacialis) ignore ships but respond to alerting stimuli. Proc. Biol. Sci. 271, 227–231. doi: 10.1098/rspb.2003
Oleson, E., and Hildebrand, J. (2012). Marine Mammal Demographics Off the Outer Washington Coast and Near Hawaii(No. NPS-OC-12-001CR). Monterey: Naval Postgraduate School.
Panigada, S., Pesante, G., Zanardelli, M., Capoulade, F., Gannier, A., and Weinrich, M. T. (2006). Mediterranean fin whales at risk from fatal ship strikes. Mar. Pollut. Bull. 52, 1287–1298. doi: 10.1016/j.marpolbul.2006.03.014
Panigada, S., Pesante, G., Zanardelli, M., and Oehen, S. (2003). “Day and night-time behaviour of fin whales in the Western Ligurian Sea,” in Proceedings of theInternational Conference on Oceans, San Diego, CA.
Panigada, S., Zanardelli, M., Canese, S., and Jahoda, M. (1999). How deep can baleen whales dive? Mar. Ecol. Proc. Ser. 187, 309–311. doi: 10.3354/meps187309
Redfern, J. V., McKenna, M. F., Moore, T. J., Calambokidis, J., Deangelis, M. I., Becker, E. A., et al. (2013). Assessing the risk of ships strike large whales in marine spatial planning. Conserv. Biol. 27, 292–302. doi: 10.1111/cobi.12029
Rockwood, R. C., Calambokidis, J., and Jahncke, J. (2017). High mortality of blue, humpback and fin whales from modeling of vessel collisions on the U. S. West Coast suggests population impacts and insufficient protection. PLoS One 12:e0183052. doi: 10.1371/journal.pone.0183052
Scales, K. L., Schorr, G. S., Hazen, E. L., Bogard, S. J., Miller, P. I., Andrews, R. D., et al. (2017). Should I stay or should I go? Modelling year-round habitat suitability and drivers of residency for fin whales in the California current. Divers. Distrib. 23, 1204–1215. doi: 10.1111/ddi.12611
Silber, G. K., Slutsky, J., and Bettridge, S. (2010). Hydrodynamics of a ship/whale collision. J. Exp. Mar. Biol. Ecol. 391, 10–19. doi: 10.1016/j.jembe.2010.05.013
Towers, J. R., Malleson, M., McMillan, C. J., Cogan, J., Berta, S., and Birdsall, C. (2018). Occurrence of fin whales (Balaenoptera physalus) between Vancouver Island and continental North America. Northwest. Nat. 99, 49–57. doi: 10.1898/nwn17-16.1
Tyson, R. B., Friedlaender, A. S., and Nowacek, D. P. (2016). Does optimal foraging theory predict the foraging performance of a large air-breathing marine predator? Anim. Behav. 116, 223–235. doi: 10.1016/j.anbehav.2016.03.034
van der Hoop, J. M., Vanderlaan, A. S. M., and Taggart, C. T. (2012). Absolute probability estimates of lethal vessel strikes to North Atlantic right whales in Roseway Basin, scotian shelf. Ecol. Appl. 22, 2021–2033. doi: 10.1890/11-1841.1
Vanderlaan, A. S. M., and Taggart, C. T. (2007). Vessel collisions with whales: the probability of lethal injury based on vessel speed. Mar. Mammal Sci. 23, 144–156. doi: 10.1111/j.1748-7692.2006.00098.x
Wiley, D. N., Thompson, M., Pace, R. M. III, and Levenson, J. (2011). Modeling speed restrictions to mitigate lethal collision between ships and whales in the stellwagen bank national marine sanctuary, USA. Biol. Conserv. 144, 2377–2381. doi: 10.1016/j.biocon.2011.05.007
Keywords: ship strike, fin whale, Balaenoptera physalus, California Current, diel dive behavior, behavioral ecology
Citation: Keen EM, Scales KL, Rone BK, Hazen EL, Falcone EA and Schorr GS (2019) Night and Day: Diel Differences in Ship Strike Risk for Fin Whales (Balaenoptera physalus) in the California Current System. Front. Mar. Sci. 6:730. doi: 10.3389/fmars.2019.00730
Received: 01 March 2019; Accepted: 11 November 2019;
Published: 28 November 2019.
Edited by:
Joshua Nathan Smith, Murdoch University, AustraliaReviewed by:
Angela R. Szesciorka, University of California, United StatesJuliana Castrillon, Griffith University, Australia
Copyright © 2019 Keen, Scales, Rone, Hazen, Falcone and Schorr. This is an open-access article distributed under the terms of the Creative Commons Attribution License (CC BY). The use, distribution or reproduction in other forums is permitted, provided the original author(s) and the copyright owner(s) are credited and that the original publication in this journal is cited, in accordance with accepted academic practice. No use, distribution or reproduction is permitted which does not comply with these terms.
*Correspondence: Eric M. Keen, ZXJpYy5rQG1hcmVjb3RlbC5vcmc=; ZXJpY21rZWVuQGdtYWlsLmNvbQ==