 Erika Fabbrizzi1,2,3*
 Michele Scardi3,4
 Enric Ballesteros5
 Lisandro Benedetti-Cecchi3,6
 Emma Cebrian7Giulia Ceccherelli8
 Francesco De Leo3Alan Deidun9
 Giuseppe Guarnieri3,10
 Annalisa Falace11
 Silvia Fraissinet10
 Chiara Giommi12
 Vesna Mačić13Luisa Mangialajo14
 Anna Maria Mannino15
 Luigi Piazzi8
 Mohamed Ramdani16
 Gil Rilov17Luca Rindi3,6
 Lucia Rizzo2
 Gianluca Sarà12
 Jamila Ben Souissi18Ergun Taskin19
 Simonetta Fraschetti1,2,3
- 1Department of Biology, University of Naples Federico II, Naples, Italy
- 2Stazione Zoologica Anton Dohrn, Naples, Italy
- 3CoNISMa, Rome, Italy
- 4Department of Biology, Tor Vergata University of Rome, Rome, Italy
- 5Centre d’Estudis Avançats de Blanes-CSIC, Girona, Spain
- 6Department of Biology, University of Pisa, Pisa, Italy
- 7Facultat de Ciències, Departament de Ciències Ambientals, Universitat de Girona, Girona, Spain
- 8Department of Chemistry and Pharmacy, University of Sassari, Sassari, Italy
- 9Department of Geosciences, University of Malta, Msida, Malta
- 10Department of Biological and Environmental Sciences and Technologies, University of Salento, Lecce, Italy
- 11Department of Life Sciences, University of Trieste, Trieste, Italy
- 12Laboratory of Ecology, Earth and Marine Sciences Department, University of Palermo, Palermo, Italy
- 13Institute of Marine Biology, University of Montenegro, Kotor, Montenegro
- 14Université Côte d’Azur, CNRS, UMR 7035 ECOSEAS, Nice, France
- 15Department of Biological, Chemical and Pharmaceutical Sciences and Technologies, University of Palermo, Palermo, Italy
- 16Department of Zoology and Animal Ecology, Mohammed V University of Rabat, Rabat, Morocco
- 17National Institute of Oceanography, Israel Oceanographic and Limnological Research (IOLR), Haifa, Israel
- 18Institut National Agronomique de Tunisie, University of Carthage, Tunis, Tunisia
- 19Faculty of Arts and Sciences, Department of Biology, Manisa Celal Bayar University, Manisa, Turkey
Macroalgal forests are one of the most productive and valuable marine ecosystems, but yet strongly exposed to fragmentation and loss. Detailed large-scale information on their distribution is largely lacking, hindering conservation initiatives. In this study, a systematic effort to combine spatial data on Cystoseira C. Agardh canopies (Fucales, Phaeophyta) was carried out to develop a Habitat Suitability Model (HSM) at Mediterranean scale, providing critical tools to improve site prioritization for their management, restoration and protection. A georeferenced database on the occurrence of 20 Cystoseira species was produced collecting all the available information from published and grey literature, web data portals and co-authors personal data. Data were associated to 55 predictor variable layers in the (ASCII) raster format and were used in order to develop the HSM by means of a Random Forest, a very effective Machine Learning technique. Knowledge about the distribution of Cystoseira canopies was available for about the 14% of the Mediterranean coastline. Absence data were available only for the 2% of the basin. Despite these gaps, our HSM showed high accuracy levels in reproducing Cystoseira distribution so that the first continuous maps of the habitat across the entire basin was produced. Misclassification errors mainly occurred in the eastern and southern part of the basin, where large gaps of knowledge emerged. The most relevant drivers were the geomorphological ones, followed by anthropogenic variables proxies of pollution and urbanization. Our model shows the importance of data sharing to combine a large number of spatial and environmental data, allowing to individuate areas with high probability of Cystoseira occurrence as suitable for its presence. This approach encourages the use of this modeling tool for the prediction of Cystoseira distribution and for supporting and planning conservation and management initiatives. The step forward is to refine the spatial information of presence-absence data about Cystoseira canopies and of environmental predictors in order to address species-specific assessments.
Introduction
Increasing human pressures such as coastal development, habitat destruction, pollution, maritime traffic, fisheries and illegal fishing together with climate change are strongly affecting the distribution of marine coastal species and habitats (Claudet and Fraschetti, 2010; Coll et al., 2010). New and emerging uses of marine resources (e.g., seabed mining, aquaculture) are also expected as additional sources of disturbance for marine coastal ecosystems (Wolff et al., 2018). This changing scenario calls for science-based information to understand the processes driving present trajectories of ecological change. In this framework, a solid knowledge of the distribution of species and their habitats over large spatial and temporal scales is critical to support all stages of marine spatial planning, to inform action prioritizations for scientists and decision-makers and to provide guidance for sustainable exploitation of marine resources, minimizing the negative impacts of present and future human activities (Douvere, 2010; Levin et al., 2014; Martin et al., 2014).
Recently, increasing efforts to carry out systematic collections of spatial data have been conducted from different areas of the world with significant progresses for a variety of species and habitats (Duarte, 2002; Orth et al., 2006; Waycott et al., 2009; Van Soest et al., 2012; Yesson et al., 2017). In Europe, a network of organizations is currently working together to integrate and share information to combine available marine data across EU countries (European Marine Observation and Data Network, EMODnet1). In this respect, the Mediterranean Sea should be a hub of information: it has been intensely studied since the last century and several initiatives have been carried out to document and combine the available knowledge about the occurrence and status of key target species/habitats such as coralligenous outcrops and maërl beds (Martin et al., 2014), Posidonia oceanica meadows (Telesca et al., 2015), coral assemblages (e.g., Cladocora caespitosa) (Chefaoui et al., 2017), sea pens (Bastari et al., 2018), and gorgonian species (Boavida et al., 2016; Ghanem et al., 2018). Despite these efforts, Gubbay et al. (2016) document a substantial lack of quantitative information on definition, distribution and temporal trends of the status of most of Mediterranean habitats: data collected has often limited spatial and temporal scope, scattered over different institutions in small datasets for specific species groups or habitats (Portman et al., 2013), with important gaps in different levels of information, such as the evaluation of conservation status (Coll et al., 2012, 2010).
Real data very often do not cover large spatial extensions so that modeling approaches and extensive extrapolations are needed to fill gaps in knowledge (Martin et al., 2014). Different tools have been used to address a deeper understanding of large-scale distribution of species and to fill gaps in actual knowledge, in relation to the type and resolution of available data (presence-only data, presence-absence data and data on predictive environmental variables) (Guisan and Zimmermann, 2000). Maximum entropy (Maxent algorithm), Random Forest (RF), generalized linear and additive models (GLMs and GAMs) are some of the modeling techniques used in these studies to develop predictive occurrence maps for target species/habitats (hereafter referred to as Habitat Suitability Models, HSMs).
All these examples, and others not listed here, demonstrate the wide range of applications for which systematic conservation planning can be applied at different scales, based on data from field surveys, expert knowledge and model-based estimations of species distribution (Guisan and Zimmermann, 2000; Levin et al., 2014). Despite limitations and associated uncertainties, HSMs can be a cost-effective approach to integrate real data, as they can help documenting where sensitive marine species and habitats are expected to occur (McArthur et al., 2010; Gorman et al., 2013; Martin et al., 2014), and predicting their possible shifts in distribution under global climate change (Guisan and Wilfried, 2005; Rodríguez et al., 2007; Martínez et al., 2018).
Macroalgal forests represent a paradigmatic example of key threatened benthic habitat featured by sparse but increasing spatial information, deserving further efforts to improve the management of those pressures determining their increasing loss across the Mediterranean and elsewhere (Benedetti-Cecchi et al., 2001). Macroalgal forests are one of the most productive and valuable, yet undervalued habitats, undergoing dramatic changes (Mangialajo et al., 2008; Thibaut et al., 2005, 2015; Blanfuné et al., 2016; Mancuso et al., 2018). Along temperate rocky coasts worldwide, large canopy-forming algae (Laminariales and Fucales) were dominant in both intertidal and subtidal habitats, providing shelter, food and nursery areas to a multitude of marine communities, increasing three-dimensional complexity and spatial heterogeneity of rocky substrates, enhancing biodiversity and productivity in coastal ecosystems (Ballesteros et al., 1998; Fowler-Walker and Connell, 2002; Steneck et al., 2002; Cheminée et al., 2013; Gianni et al., 2013; Gorman et al., 2013; Piazzi et al., 2018). However, the cumulative impacts of local anthropogenic pressures combined with other global stressors are driving the decline of brown algae and their associated communities in several regions of the world subject to increased human threats (Airoldi and Beck, 2007; Lamela-Silvarrey et al., 2012; Sala et al., 2012; Gianni et al., 2013; Strain et al., 2014; Mineur et al., 2015; Thibaut et al., 2015; Bianchi et al., 2018).
In the Mediterranean Sea, the genus Cystoseira C. Agardh (Fucales, Phaeophyta) is one of the most representative of the Sargassaceae family and includes a total of 45 taxa (Guiry and Guiry, 2010) with habitat-forming species dominating several assemblages from the very shallow to deep waters (−50 m) (Feldmann, 1937; Giaccone and Bruni, 1973; Ballesteros et al., 1998; ESRI, 2012; García-Fernández and Bárbara, 2016). Reductions in their cover and biomass, prompted by the integration of multiple natural and artificial effects, promote their replacement by turf-forming, filamentous or other ephemeral seaweeds (Murray and Littler, 1978; Benedetti-Cecchi et al., 2001, 2015; Thibaut et al., 2005; Ballesteros et al., 2007; Pinedo et al., 2007; Airoldi et al., 2008; Connell et al., 2008; Falace et al., 2010; Perkol-Finkel and Airoldi, 2010; Fraschetti et al., 2011; Giakoumi et al., 2012). Moreover, macroalgal forests can be overgrazed to barrens by urchins or fish (Fraschetti et al., 2001; Sala et al., 2011; Guarnieri et al., 2014; Vergés et al., 2014). Due to their role in supporting biodiversity and food webs, the loss of these long-lived brown algae is leading to a decrease in critical ecosystem services such as fisheries (Thibaut et al., 2015; Buonomo et al., 2018) and also to a reduction in the potential to sequestrate carbon dioxide and to mitigate climate change.
There is an increasing attention toward the state of macroalgal forests from both a conservation (Annex II of the Barcelona Convention, COM/2009/0585/FIN) and a restoration point of view (MERCES project, 20162; AFRIMED project, 2018,3), to better understand the potential of reverting present trajectories of change through active restoration. Furthermore, Cystoseira assemblages are being considered as habitats of critical importance for the EU (Directive 92/43/EEC; Annex I, included in “Rocky reefs”) and as indicators to assess ecological status in the context of the Water Framework Directive (WFD; Directive 2000/60/EC). Despite the increasing interest, there are still many information gaps in the spatial distribution of Cystoseira canopies across the Mediterranean Sea and the drivers involved in the observed shifts. Understanding causal relationships and filling these gaps of knowledge is a crucial step to reverse current patterns of regression.
The aims of this study are (1) to synthesize knowledge about the distribution of Cystoseira species and (2) to develop a HSM for Cystoseira species living in the shallow rocky substrates through the Random Forest technique (RF) (Breiman, 2001), considering areas where both presence and absence data were available at Mediterranean scale. RF is a Machine Learning technique which, starting from a set of selected predictor variables and combining an ensemble of classification trees, is able to identify suitable and unsuitable areas for holding Cystoseira species. The developed HSM has been used to identify environmental predictors which are related to Cystoseira spatial distribution and to predict the occurrence of Cystoseira canopies at locations where information was not available. Our model can be regarded as a valuable tool for the assessment of species distribution on shallow rocky shores to guide their management, conservation and active restoration.
Materials and Methods
Georeferenced Data for Cystoseira Species
A systematic review was conducted consisting of three steps: (1) articles identification using two databases [ISI Web of Science (WOS) and Scopus] searched for the 1985–2018 time frame (cut-off date 31 March 2018), (2) abstract screening, and (3) review of pertinent articles. The aim of this activity was to collect all the information about the georeferenced occurrence of the genus Cystoseira at Mediterranean scale. The systematic literature screening was carried out by searching in the “Title,” “Abstract,” and “Keyword” fields using Web of Science Core Collection. The following combination of terms was included in the search: (“Cystoseira” OR “Cystoseira canopies” OR “Fucales” OR “brown algae” OR “macroalgal forest∗” OR “habitat form∗”) AND (“distribution” OR “occurrence” OR “shift” OR “habitat loss” OR “decline”) AND “Mediterranean Sea.” We also searched the citation lists of selected articles, using the same search terms. Supplementary Figures S1, S2 show respectively the number of publications per year and the number of publications per country obtained from the literature screening. Unpublished information, gray literature and maps have been also searched and cataloged (Supplementary Table S1).
The georeferenced database with the spatial distribution of Cystoseira across the Mediterranean Sea, initially produced in the framework of the FP7 EU project CoCoNet (FP7, Grant agreement no: 287844), was also used. In addition, co-authors of this manuscript personally contributed with their data (Supplementary Table S2). New data were also acquired from the monitoring program CARLIT (CARtography of LITtoral and upper-sublittoral benthic communities) (Ballesteros et al., 2007). The EMODnet biology data portal (Guardia, 20184) which contains a dataset on the distribution of Cystoseira across the Mediterranean Sea, the Black Sea and the Eastern Atlantic Ocean was also used.
Most collected data were only available in.jpeg or.pdf format, or only as a description in a text. Therefore, this information was digitized as shapefile points or polylines in order to be associated with a map, using the Open Source QGIS software (QGIS Development Team, 2018. QGIS Geographic Information System. O3.Open Source Geospatial Foundation5). The two resulting vector shapefiles of points and polylines showed the georeferenced distribution of Cystoseira species along Mediterranean coasts. Each data entry was accompanied by the geographic coordinates, data origins and data providers, sampling method, date and depth, publication date and which species of the genus were sampled, when this information was available.
Absence records, which were only available for a limited number of locations, were assembled in a line shapefile mainly generated from maps found in the collected articles, but also from expert opinion.
In order to develop a HSM for Cystoseira canopies across the Mediterranean Sea, we firstly extracted from the whole dataset only those records documenting the presence of species in the shallow rocky substrates, excluding those corresponding to species that are only found at deeper stands: C. algeriensis Feldmann, C. corniculata (Turner) Zanardini, C. crinitophylla Ercegovic, C. dubia Valiante, C. montagnei J. Agardh, C. sauvageauana Hamel, C. schiffneri Hamel, C. sedoides (Desfontaines) C. Agardh, C. squarrosa De Notaris, C. tamariscifolia (Hudson) Papenfuss, C. zosteroides (Turner) C. Agardh. Occurrence data of C. amentacea (C. Agardh) Bory, C. barbata (Stackhouse) C. Agardh, C. brachycarpa J. Agardh, C. compressa (Esper) Gerloff & Nizamuddin, C. crinita Duby, C. elegans Sauvageau, C. foeniculacea (Linnaeus) Greville, C. humilis Schousboe ex Kützing and C. mediterranea Sauvageau were included in the model subset, together with all records collected as Cystoseira spp. produced by sampling surveys in which the CARLIT method was applied, since it is focused on the identification of shallow rocky substrates (Ballesteros et al., 2007).
These data, combined with the available absence records, were assembled in a single vector shapefile. Then the vector layer was converted to the (ASCII) raster format, using the same procedure, grid resolution, geographical extent and coordinate system as the layers of the predictor variables which were selected as input to the model (see next section). The resulting Cystoseira raster layer was featured by values covering the entire Mediterranean coastline and was composed of three types of pixels: “absence” pixels (coded as 1), “presence” pixels (coded as 2) and “no-data” pixels (coded as 3), with the last one corresponding to all the sections of Mediterranean shoreline where no information was available.
Modeling Cystoseira Occurrence: Selection of Predictor Variables
A set of 55 predictor variables was associated with the dataset with the occurrence of the Cystoseira spp. as input to the modeling procedure. Most of these predictor variables derived from Halpern et al. (2008) and Wolff et al. (2018). Some have been obtained from data geoportals, e.g., the Copernicus Marine Environment Monitoring Service6, and others were instead based on GIS calculations (the complete list of predictor variables, together with their sources, is shown in the Table 1). Predictor layers were selected on the basis of the coverage of the information they provided. We only used variables with data coverage over the entire Mediterranean basin and with the highest available resolution. Following this criterion, we collected values for environmental variables (e.g., wind stress and the waves energy along the coastline) and anthropogenic variables (e.g., pollution, population density and shipping intensity). All the 55 selected layers were converted to a common raster format, having as geographical extent the Mediterranean Sea, in WGS 84 coordinate system and with a resolution of 0.004166 decimal degrees (i.e., each pixel was about 460 m along the latitudinal axis, and from about 330 m to 380 m along the longitudinal one, depending on latitude). The rasterization process was carried out using the package “raster” (Hijmans, 2017. R package version 2.6–77) in the R open source data analysis software (R Core Team, 20168). The same raster format was applied to Cystoseira spp. occurrence data to ensure the appropriate matching with the predictor layers.
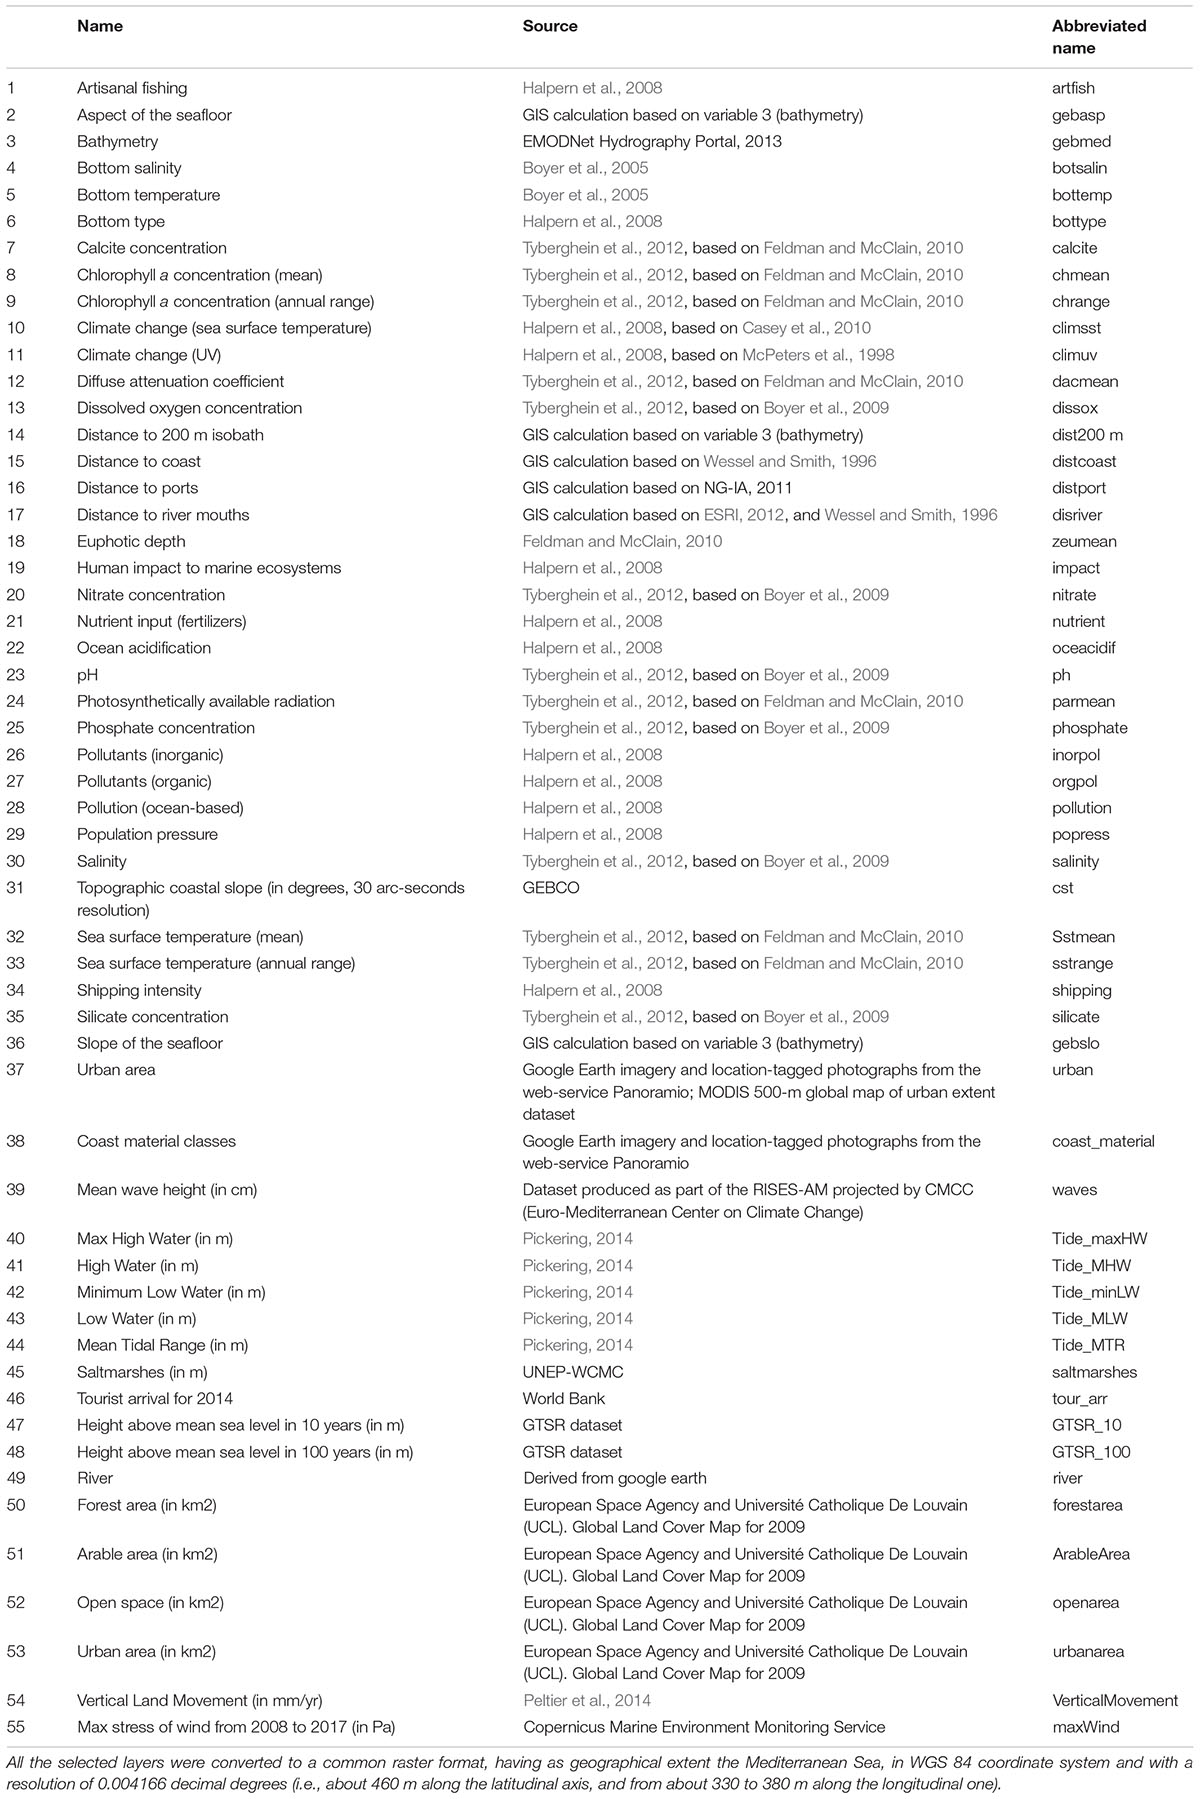
Table 1. Predictor variables used for the HSM with their units, source and the abbreviated name.
Furthermore, since most layers coming from the above sources did not provide data for the shoreline, where Cystoseira species potentially occur, we developed a procedure to estimate the value of the pixels of the shoreline. We considered the value of the first non-empty pixel of the layer for qualitative predictors and the mean value of neighbor pixels for quantitative predictors, within a search radius of 10 pixels at most. In particular, the mean value was obtained on the Moore neighborhood or, otherwise, on the smallest frame with at least a non-empty pixel. Thereby, all the predictor variables provided data for each pixel over the Mediterranean shoreline where Cystoseira records were distributed (presence, absence, and no-data).
Modeling Approach
From the Cystoseira raster layer we extracted a subset including only regions where both presence and absence data were available. Hence, the distribution of Cystoseira canopies across the Mediterranean Sea was modeled focusing on a dataset composed by 8,143 pixels: 5,475 “presence” pixels and 2,668 “absence” pixels. The Machine Learning (ML) method selected to model the distribution of Cystoseira canopies was the RF (Breiman, 2001). This technique, based on a set of classification trees, needs two subsets of data: a training set to tune the model and a test set to validate model performances. We split our dataset in a training and a test set (with the 20% of the dataset assigned to the test set and the remaining 80% to the training set) following the next steps: at first, we superimposed a grid of 0.50 decimal degrees square cells to the whole Mediterranean basin. Then, we randomly assigned cells to the test set excluding those containing less than 100 records (i.e., 100 pixels of the Cystoseira raster layer). This number corresponded to the first quartile of the distribution of records among all the cells. Only cells where the presence/absence records were not too unbalanced (no more than 80% of presence records) were selected in order to better reflect the overall characteristics of the dataset. Moreover, care was taken to avoid geographical segregation in assigning cells, so as to be representative, as much as possible, of multiple environmental conditions occurring across Mediterranean regions. This procedure minimized the influence of spatial autocorrelation in the test procedure, as only at the boundaries of the test set cells a negligible number of pixels closely resembling those in the training set cells could be found.
The RF predicted the class (i.e., presence or absence) of each record in the training and the test set taking the majority voting (the 50%, at least) of the overall trees which composed the forest. We trained several RFs through a Fortran 90 program obtained from the original Fortran 77 source code by Leo Breiman and Adele Cutler9. The only changes to the original code were in the input of training parameters from file and in the dynamic allocation of the arrays, while the algorithm and the output file format were not modified.
RFs, by combining multiple classification trees in a single output, require the tuning of different parameters which affect the forest growth with repercussions on model accuracy: the number of trees in the forest and the number of cases in the terminal leaves of the trees, which have to be tuned in order to minimize the generalization error and to avoid overfitting; the number of predictor variables randomly selected at each split, which, remaining constant during the forest growth, shows large effects on the strength of each individual tree and on the correlation between any pair of them (Breiman, 2001). RFs were grown using 250 and 500 trees in the forest, a number of predictor variables per split at each node of the trees ranging between 4 and 14 and six different number of cases in the terminal leaves of the forests (1, 10, 25, 50, 100, and 150).
Since our dataset was unbalanced in the number of presence and absence records, the cut-off value (t = 0.50) was optimized by analyzing the Receiver Operating Characteristic (ROC) curve (Zweig and Campbell, 1993), in order to find the best compromise between the predictions of true and false positives, i.e., between sensitivity and specificity of the model. Then, we calculated the Kappa statistics (Cohen, 1960) to identify the best model among those we trained, considering also the Area Under the ROC curve (AUC) as a measure of the overall accuracy of the models. Furthermore, measuring the Kappa statistics over the test set (built to be as independent as possible from the training set) implies evaluating the model robustness just as a null model does with parametric modeling approaches. Indeed, this coefficient measures the agreement among raters (or between model output and observed data) by assessing the deviation from random agreement (McHugh, 2012). Kappa statistics and ROC curve were calculated using the “caret” package (Kuhn, 2017. R package version 6.0–7810) and “pROC” package (Robin et al., 2011. BMC Bioinformatics, 12, p. 77. doi: 10.1186/1471-2105-12-7711) in the R environment.
The importance of predictor variables was assessed by comparing the permutation importance measure (or the Mean Decrease Accuracy, MDA) (Breiman, 2001) with the Gini importance measure (or the Mean Decrease Impurity, MDI) (Breiman, 2003), both calculated at the end of the training phase. In the first instance, cases out of the bootstrap samples used in the training phase of the RF (OOB records), are randomly permuted in the values of predictor variables. The difference between the misclassification rate of original and permuted OOB values, divided by the standard error, is used as a measure of the importance of predictor variables, as the increase in this difference is proportional to variable importance. In the second case, every time a node is split according to a predictor variable, the Gini Importance for the two descendent nodes is less than the one for the parent nodes. An alternate measure of variable importance is so provided by the total decrease in node impurity for each variable averaged overall the trees in the RF. In any case, the two measures of variable importance were often consistent with each other.
We also validated the performance of the selected model by getting the predictions for regions where only presence records were available, i.e., records that were not used either in the training or in the test set for the RF. The performance of the models on these records was evaluated by looking at the total number of trees in the forest that voted for presence.
At the end, the model was used as a tool to predicting presence and absence of Cystoseira species for areas where no information was available (i.e., no-data records). In the Supplementary Figure S3, a flow diagram illustrating the main steps from data access to HSM and the analysis of the variables relative importance is presented.
Results
Distribution and Coverage of Cystoseira Species Across the Mediterranean Sea
The currently known distribution, obtained by combining line (presence: 12,968; absence: 564) and point (presence: 19,782) records, is shown in Figure 1, depicting areas where Cystoseira canopies are known to be either present or absent. Spatial coverage is geographically biased since most data derived from a specific monitoring activity within the EU Water Framework Directive on macroalgae (CARLIT index), carried out only on the western Mediterranean Sea. Types and number of collected records are specified for each of the 22 Mediterranean countries in the Supplementary Table S3. The table shows for which countries occurrence data were available and where information was reported at species level. In addition, both the presence and the absence shapefiles are available on request to the corresponding author, allowing the examination of finer details which were hard to represent in the map shown in Figure 1, aimed at giving an overview of the collected dataset.
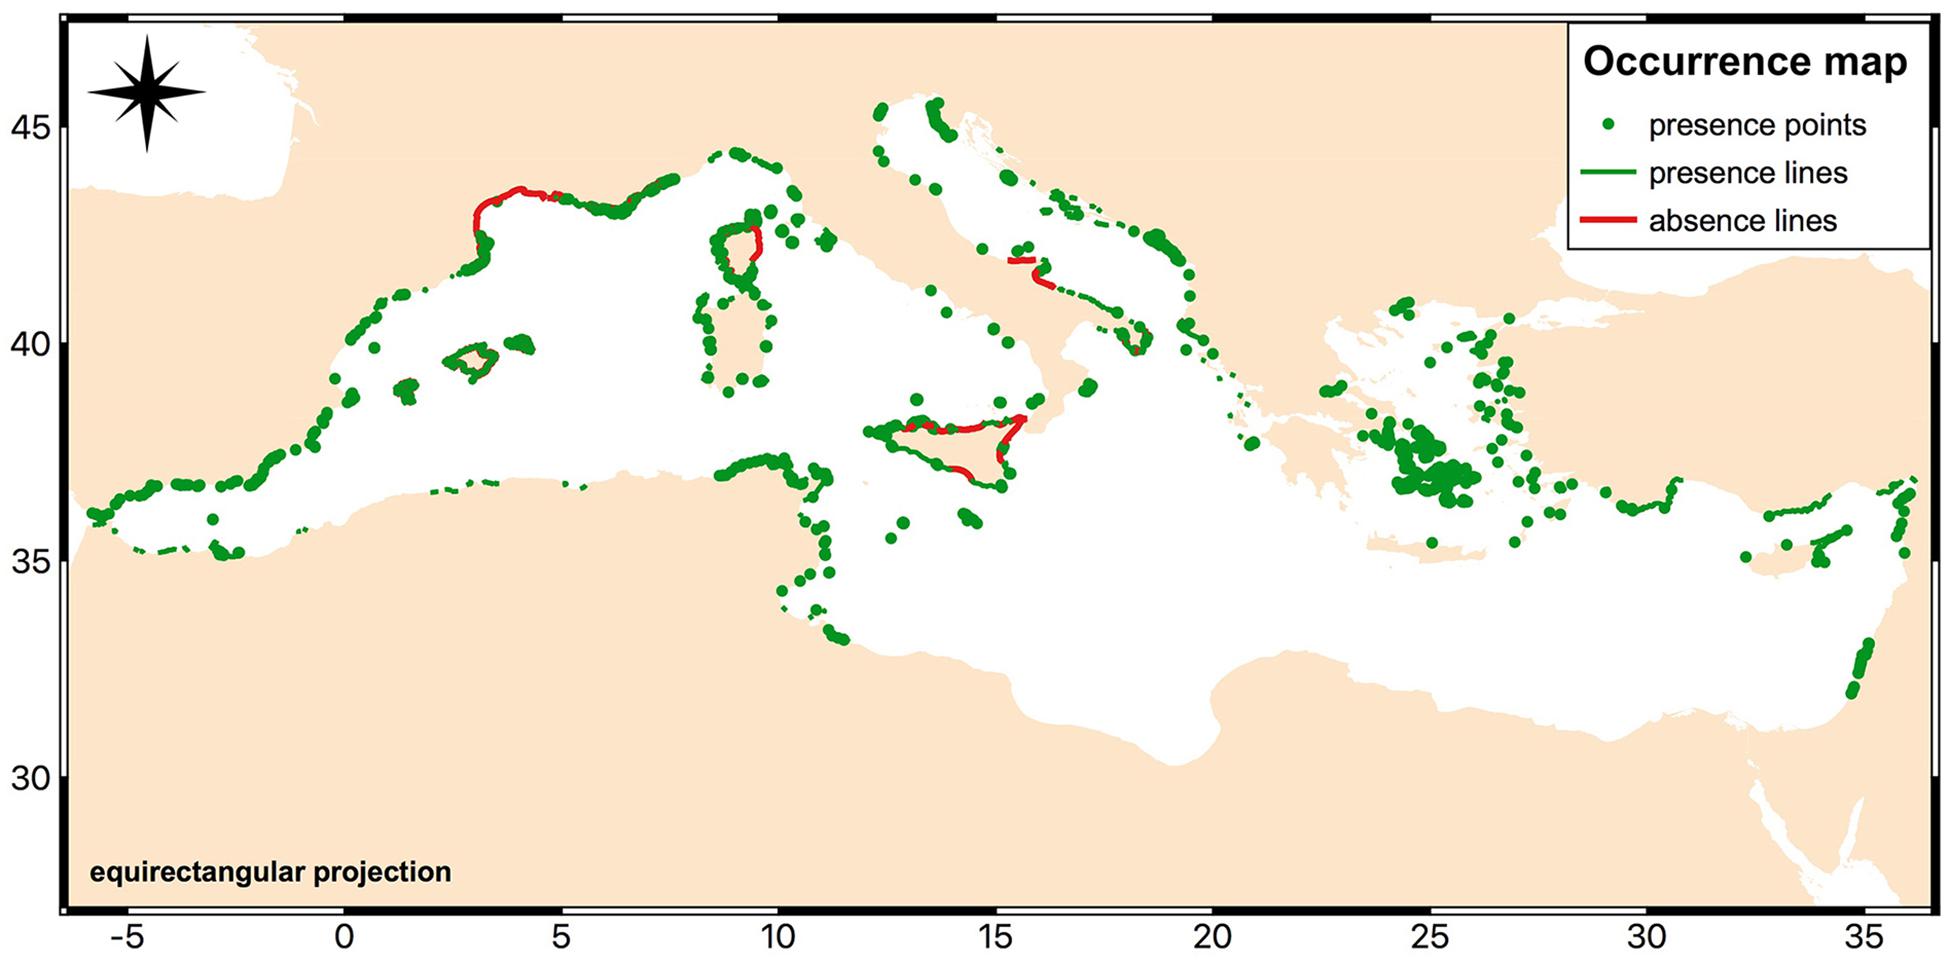
Figure 1. Distribution of Cystoseira canopies across the Mediterranean Sea. Map created with QGIS software (QGIS Development Team, 2018. QGIS Geographic Information System. O3.Open Source Geospatial Foundation: https://www.qgis.org/it/site/).
Presence data, from both line and point records, covered 15 out of 22 Mediterranean countries. For only four out of these 22 countries absence data were also available (Albania, France, Italy, and Spain). Cystoseira canopies were found to be present along the Mediterranean coastline for 6,342.41 km out of a total coastal length of 46,000 km. Cystoseira absence, expressed as line records only, accounted for 1,328.27 km. No presence or absence data were available along the rest of the coasts of the basin. Obviously, the linear length estimates were only based on line records.
An exhaustive list of all the Cystoseira species included in the dataset, with their respective number of occurrences, is also provided in the Supplementary Table S4. The species with the highest number of available records are C. amentacea, C. mediterranea, and C. compressa which represent about the 40% of the dataset collectively, considering both point and line records. This information is mostly available for shallow rocky infralittoral habitat, where a lot of ecological studies and systematic monitoring have been conducted, depicting in this way a biased scenario of the presence of Cystoseira at basin scale. In addition, most studies did not provide information at species level and a total of 18,742 records were mapped at genus level as Cystoseira spp.
The Cystoseira raster layer, produced in order to develop the HSM for Cystoseira canopies based on a RF and obtained from the rasterization of the infralittoral species subset, was composed of 113,021 pixels stretched over all the Mediterranean coastline. Of these, 100,609 were coded as “no-data” pixels, 9,744 were “presence” pixels and the remaining 2,688 were “absence” pixels. The subset mainly included records of canopy-forming species (90% of all records) but also records of species which may not be “forest”-forming (e.g., C. compressa).
Habitat Suitability Model for Cystoseira Canopies
To develop the HSM for Cystoseira canopies we used only data from areas where both presence and absence information were available. These areas included the Karaburun Peninsula and Sazani Island in Albania, Apulia and Sicily regions in Italy, Corsica and the southern coast of France, the eastern coast of the Iberian Peninsula with the Balearic archipelago in the western Mediterranean Sea. Figure 2 shows the aforementioned areas and, for reason of scaling, we illustrated the amount of the available data with the presence/absence ratio using cells of different dimensions and colors. Practically, from the “Cystoseira” raster layer we extracted a subset of data composed by 8,143 pixels: 5,475 “presence” pixels and 2,668 “absence” pixels. Then, we split this dataset in two further subsets, the training set and the test set, needed, respectively, to train and validate the RF model. The training set was composed of 6,531 records, of which 4,402 were reported as presence and 2,129 as absence. The remaining 1,612 records, divided into 9 separated Mediterranean areas, were assigned to the test set. Of these records, 1,073 were reported as presence and 539 as absence.
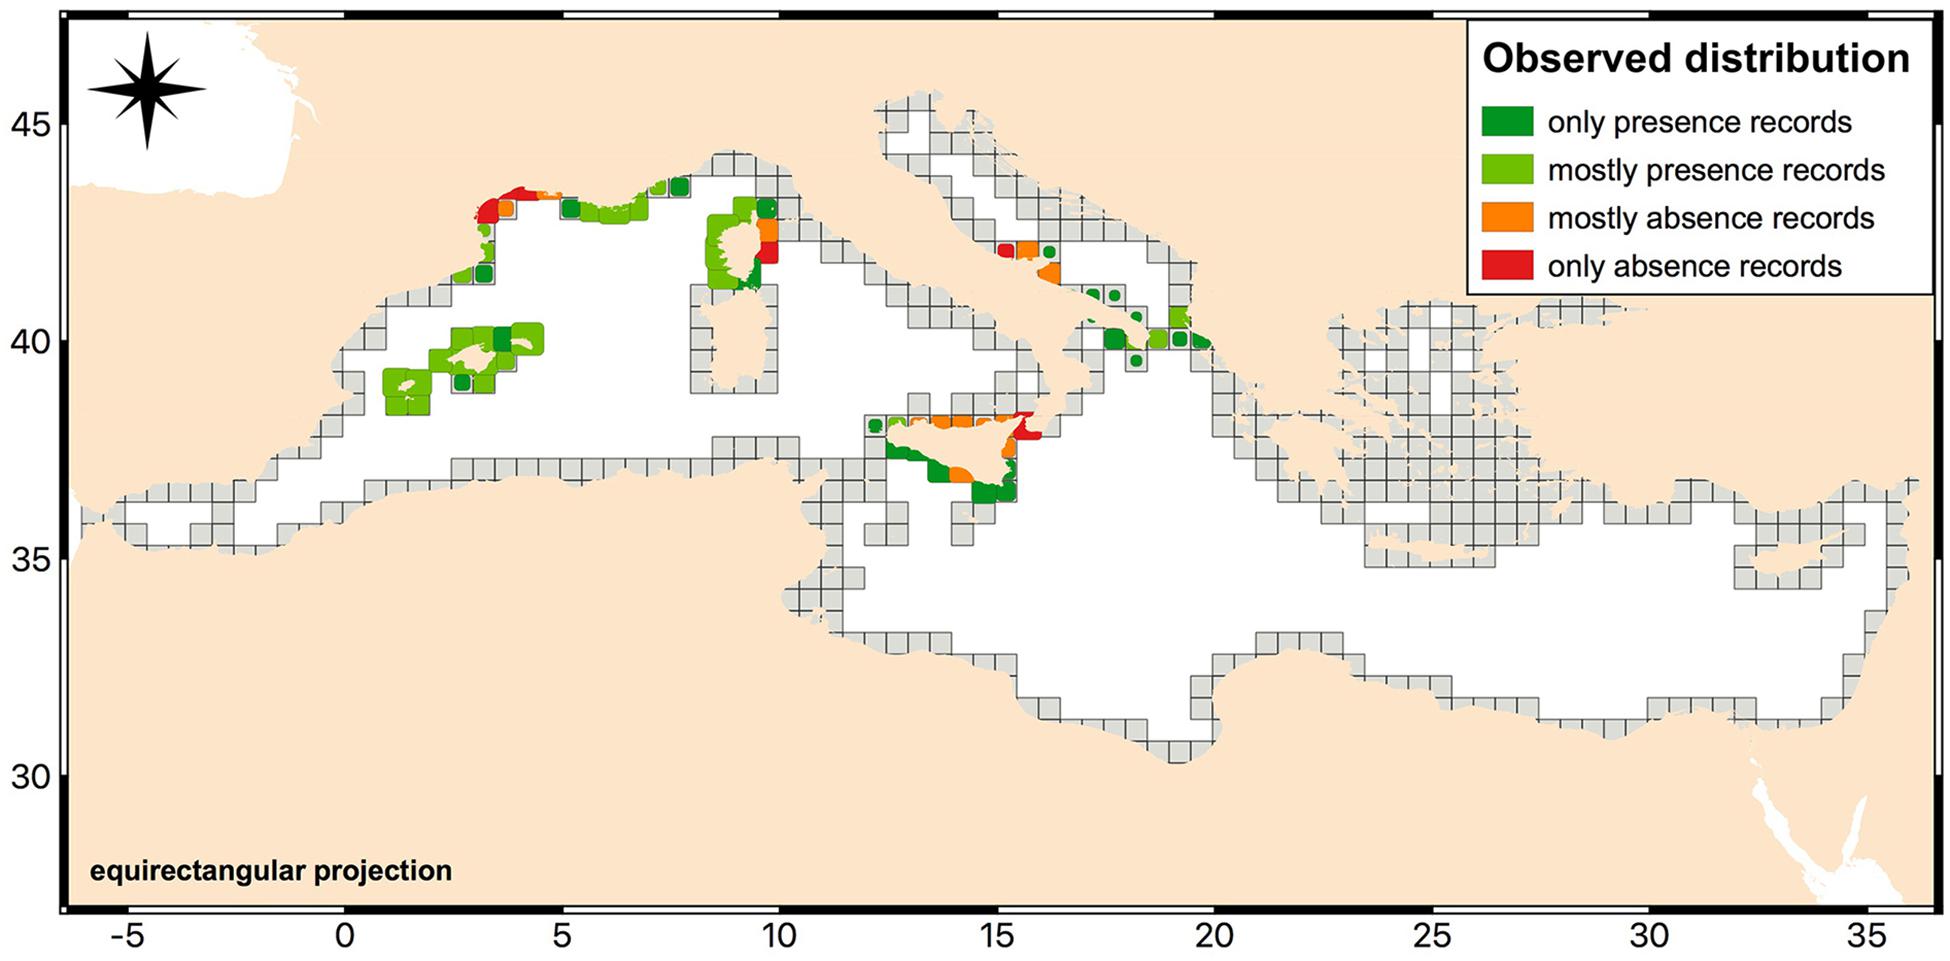
Figure 2. Observed distribution of records of Cystoseira infralittoral species used in order to develop the HSM. The map shows only the areas where both presence and absence information were available. The colors used reflect the ratio between presence and absence data per cells. The dimension of cells is representative of the amount of available data. Map created with QGIS software (QGIS Development Team, 2018. QGIS Geographic Information System. O3.Open Source Geospatial Foundation: https://www.qgis.org/it/site/).
The modeling process was trained with all the 55 predictor variable layers (Table 1), associated with presence/absence data, since a RF is able to select the most relevant predictor variables out of the whole set of those available. Moreover, its efficiency is not impaired by correlations between variables as the best split at the nodes of each tree is selected from a random subset of them. This property is one of the strengths of the RF technique, which selects only relevant variables even in presence of non-informative ones (Ishwaran, 2007; Louppe et al., 2013; Catucci and Scardi, 2020), thus becoming insensitive to the collinearity issues that might hinder other modeling methods.
A total of 132 RFs, tuned with different combination of parameters, was trained. Model elected as the best was obtained from the following combination of parameters: 500 trees in the forest, 25 cases in the terminal leaves of the forest and 9 predictor variables per split at each node of the trees. RF’s outputs were analyzed by the computation of Kappa statistics, which gave an evaluation of the overall accuracy of the models. Kappa statistics of the selected model, calculated for the default cut-off value (t = 0.50), were 0.919 for the training set and 0.573 for the test set. Since our dataset was unbalanced in the number of presence and absence records, we optimized the cut-off value through the analysis of the ROC curve based on the test set, in order to overcome the bias that affected RF predictions toward presence (given that around the 70% of records in the training set were for presence). The optimized cut-off value was found to be 0.61 (Figure 3B). It did not affect the Kappa statistics for the training set, which remained quite unchanged (K = 0.917), but allowed an improvement for the test set (K = 0.637). These values resulted the largest in comparison with those obtained from any other RF we run and are indicative of a good model accuracy. Confusion matrices for the training and the test set calculated before and after the optimization of the cut-off value are shown in the Table 2. The optimized cut-off value improved predictions over false positives for the training set and, to a larger extent, for the test set. While the decrease in false positives was inevitably accompanied by an increase in false negatives, the overall accuracy of model predictions grew by adopting the optimal cut-off value.
Figure 3. ROC curves of the best RF trained with the AUC for both the training (A) and the test set (B). The optimal cut-off, represented by the red dot in the Figure 3B, was calculated on the analysis of the ROC curve based on the test set.
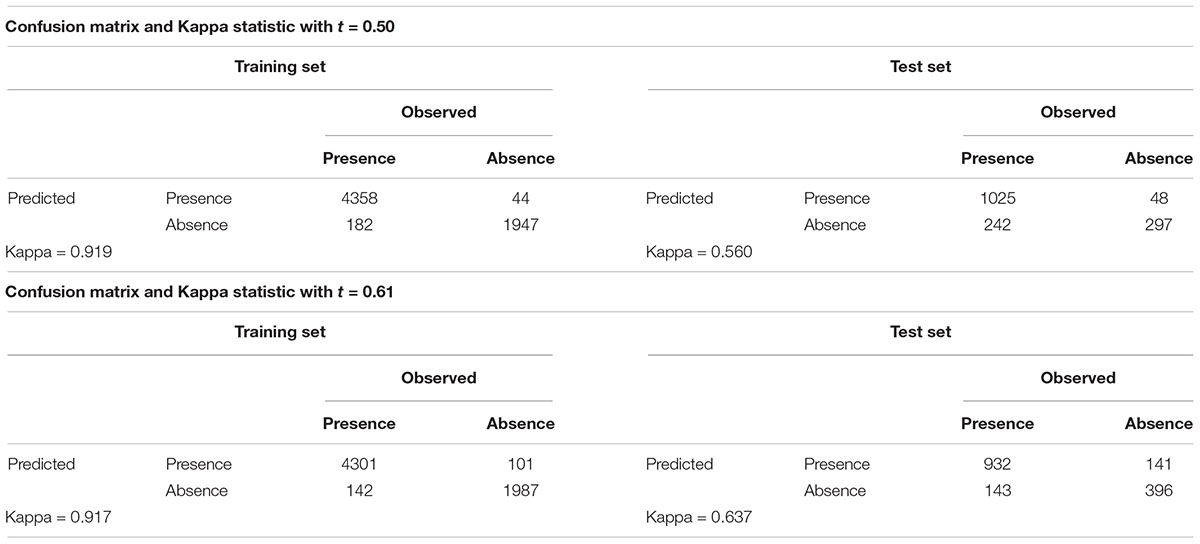
Table 2. Confusion matrices and Kappa statistics for the RF output before and after the optimization of the cut-off value.
Through the ROC curve analysis, we also examined the AUC value as indicator of model accuracy. As shown in Figure 3, the AUC was 0.988 for the training set (Figure 3A) and 0.875 for the test set (Figure 3B). These values, which were not affected by the cut-off value, confirmed our evaluation of model output since they resulted considerably large not only for the training, but also for the test set.
The Relative Importance of Predictor Variables
Variable importance was assessed on the basis of the comparison between the permutation importance measure and the Gini importance measure, both calculated according to the original RF algorithm during the training procedure. From this analysis we identified a group of predictor variables which played a major role, although ranking differently, in increasing classification accuracy according to both the importance measures used (Figure 4). The most relevant predictor variables were the topographic coastal slope (“cst”) and coast materials (“coast_material”), which both can be regarded as an expression of coastline geomorphology.
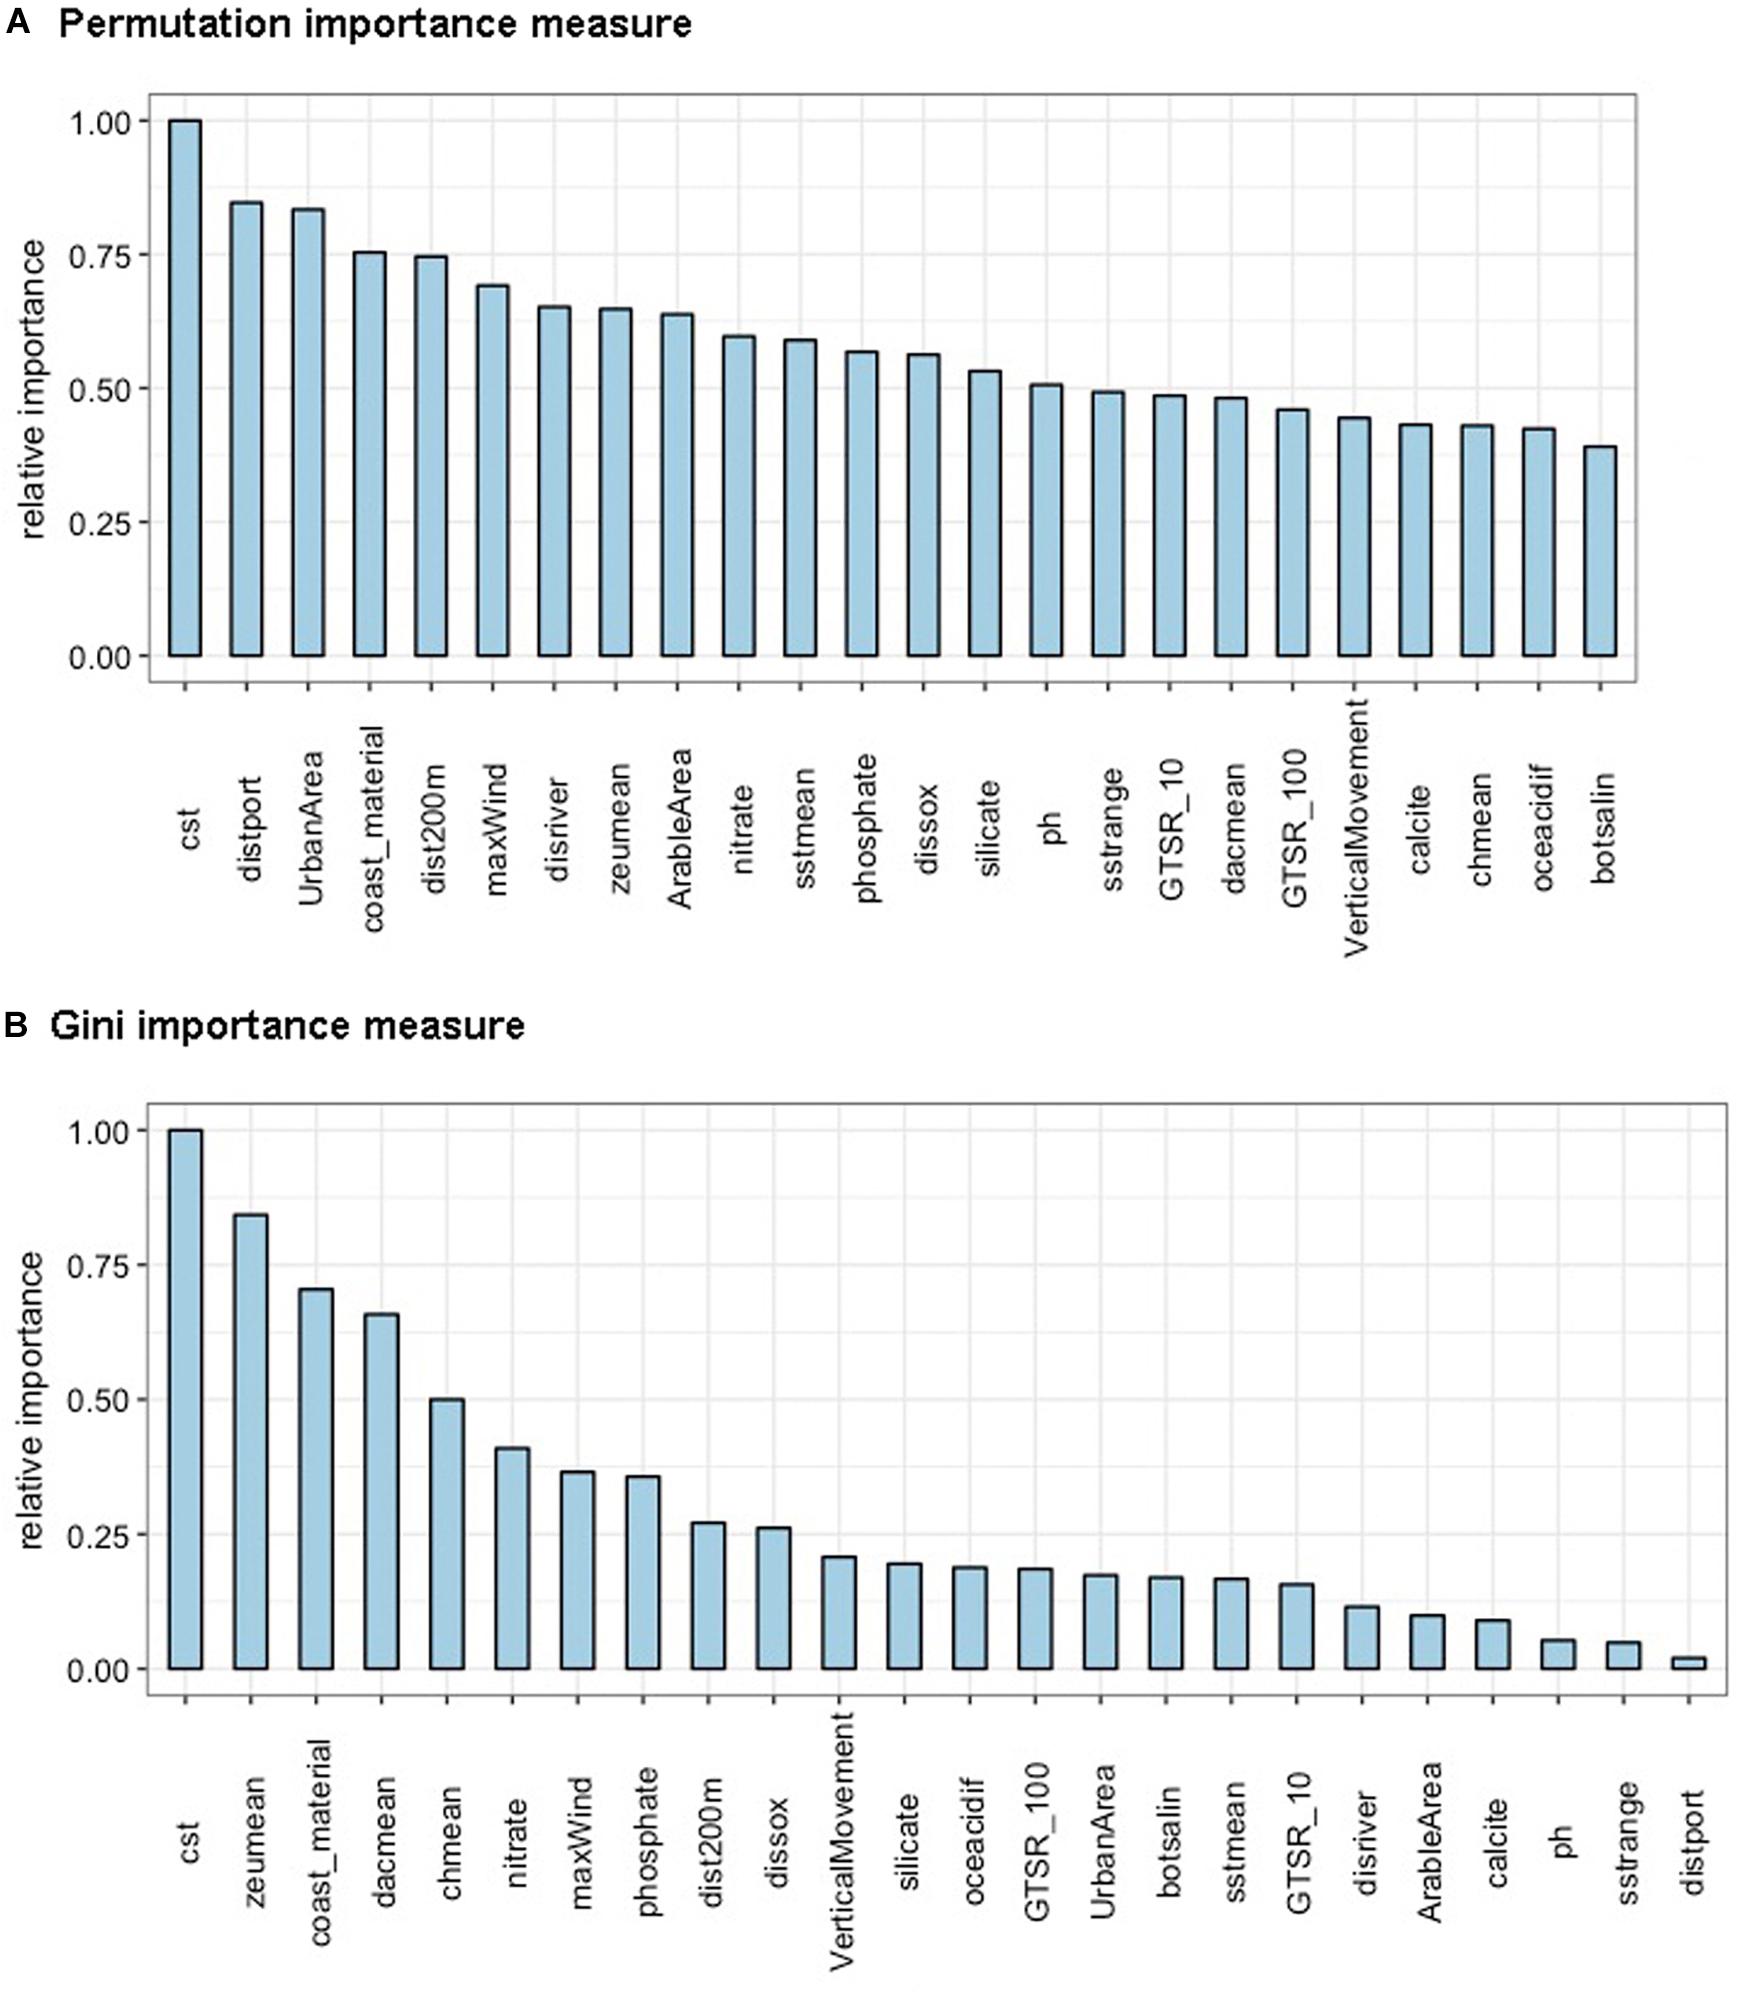
Figure 4. Most relevant variables according to importance values obtained from both the permutation (A) and the Gini importance measures (B). Name of the variables in alphabetical order: “ArableArea” = arable area (in km2); “botsalin” = bottom salinity; “calcite” = calcite concentration; “chmean” = chlorophyll a concentration (mean); “coast_material” = coast material classes; “cst” = topographic coastal slope (in degrees, 30 arc-seconds resolution); “dacmean” = diffuse attenuation coefficient; “disriver” = distance to river mouths; “dissox” = dissolved oxygen concentration; “dist200 m” = distance to 200 m isobath; “distport” = distance to ports; “GTSR_10” = height above mean sea level in 10 years (in m); “GTSR_100” = height above mean sea level in 100 years (in m); “maxWind” = max stress of wind from 2008 to 2017 (in Pa); “nitrate” = nitrate concentration; “oceacidif” = ocean acidification; “ph” = pH; “phosphate” = phosphate concentration; “silicate” = silicate concentration; “sstmean” = sea surface temperature (mean); “sstrange” = sea surface temperature (annual range); “UrbanArea” = urban area (in km2); “VerticalMovement” = vertical land movement (in mm/yr); “zeumean” = euphotic depth.
Looking at the permutation importance measure (Figure 4A), the following factors linked to human pressures were identified among the variables mostly affecting the RF output: distance to ports (“distport”) and coastal development expressed as urban areas (“Urban Area”). Variables related to natural pressures, as the distance to the 200 m isobath (“dist200 m”), the max stress of the wind (“maxWind”) and the distance to river mouths (“distriver”), were also detected as important according to the permutation measure. On the other hand, the Gini importance measure (Figure 4B) highlighted that some seawater physical variables, for instance the euphotic depth (“zeu mean”), the diffuse attenuation coefficient (“dac mean”), the mean of chlorophyll a (“chmean”) and the nitrate concentration (“nitrate”), contributed significantly to the splits in the RF trees.
Model Validation and Purpose
While confusion matrices and statistics based on comparison between observed and modeled occurrences were evaluated on presence and absence records in the test set, we used all the presence records excluded from the training and test set to investigate model accuracy. These records corresponded to 4,269 “presence” pixels of the Cystoseira raster layer (Figure 5). For each record, the number of trees in the forest that voted for presence was analyzed. This number was then scaled into a (0,1) range and assumed, taking into account the optimized cut-off value, as estimates for Cystoseira presence to be analyzed in order to improve the assessment of the strength of model predictions. Thus, records associated with a RF output larger than 0.61 were considered correctly predicted, in accordance with the optimal cut-off value. We analyzed RF output values distribution by grouping presence records in nine Mediterranean regions aiming at assessing model accuracy on spatially independent areas (Figure 6). Distributions obtained from seven of these regions showed quite high probability of presence for most records, meaning that these areas were predicted to have suitable conditions for Cystoseira occurrence, consistently with the observed status. Sardinia resulted having the highest frequency of correctly predicted cases with the median RF output value around the 0.9. The west coast of north Italy, the eastern coast of Adriatic Sea, the Aegean Sea, the African coasts, the western and the southern areas of Mediterranean Sea followed immediately after Sardinia, with RF output concentrated between the 0.7 and the 0.8 classes. These areas were essentially predicted as suitable by the model, but with less confidence than the first one. For the remaining regions, i.e., the eastern Mediterranean regions and the northern Adriatic Sea, the number of cases in which trees voted for presence significantly decreased, pointing out that the model identifies these areas as almost unsuitable for holding Cystoseira species. Indeed, the median RF output value for the latter cases shifted between the 0.3 and the 0.6 (i.e., less than the optimal cut-off value).

Figure 5. Observed distribution of Cystoseira records used in the model validation. The map shows the areas where only presence information was available. Map created with QGIS software (QGIS Development Team, 2018. QGIS Geographic Information System. O3.Open Source Geospatial Foundation: https://www.qgis.org/it/site/).
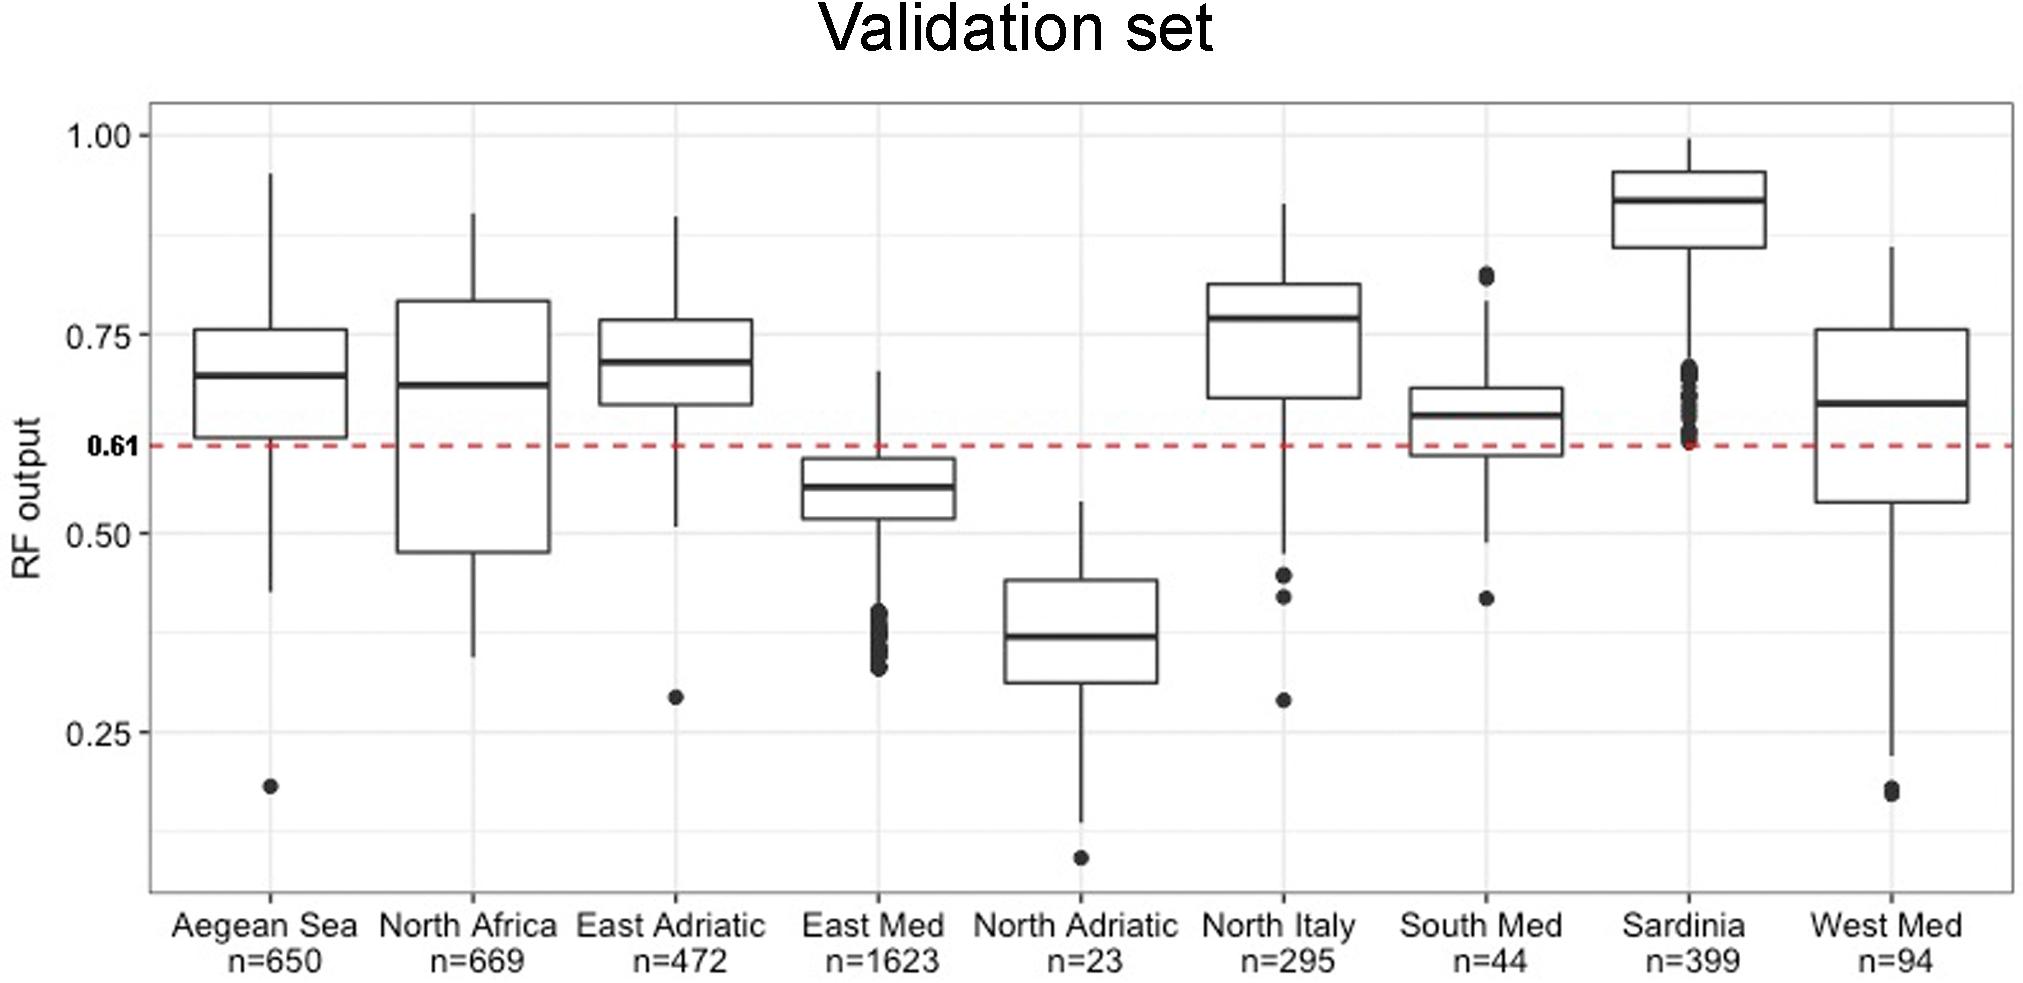
Figure 6. Distribution of the RF output values for the validation set, i.e., for the Mediterranean areas where only presence records were available. The red dashed line represents the optimal cut-off (t = 0.61).
Ultimately, developing a HSM for species of the Cystoseira genus living in the shallow rocky infralittoral habitat enabled also to carry out an exploratory analysis with the purpose of figuring out how Cystoseira forests are distributed along all those sites where no data were available across the Mediterranean Sea. Considering the spatial resolution of this study, we mapped 100,609 records for which no information occurred (i.e., “no-data” pixels of the Cystoseira raster layer). Using model predictions and proceeding as for “presence” pixels considered for model validation, we investigated, for each record, the number of trees in the RF that “voted” for presence, which is related to the predicted probability of presence. Our model classified 47,783 of these records as “absence” given that the RF output was lower than the optimized cut-off value and 52,826 as “presence” with an RF output larger than or equal to the cut-off value. To understand the distribution of Cystoseira occurrences across the basin, we firstly classified pixels on the basis of the abiotic properties of the coastline (i.e., “coast_material” variable), considering them as a limiting factor able to control canopies occurrence. Hence, we grouped records falling on “rock/unerodible” pixels, where canopies could potentially occur, and separated these records from those which covered “sand/mud” pixels, considered as unsuitable for Cystoseira growth. Figure 7A shows the distribution of the RF output values for the first group of pixels, which were regarded as possibly suitable for holding Cystoseira living in the shallow rocky infralittoral habitat species: the modal class of RF output values lies on the right of the optimal cut-off value, shown as a red dashed line in the figure. The left tail of the distribution represents all records predicted as “absence” in spite of potentially suitable geomorphological conditions. On the other side, Figure 7B shows the distribution of the RF output values for “sand/mud” pixels and reveals that these pixels, as expected, are mostly predicted as unsuitable, with the modal class of RF output on the left of the optimal cut-off value, in accordance with the unsuitable coast material. In this case, the right tail of the distribution shows records predicted as “presence” even though geomorphological conditions are unsuitable and could be regarded as model misclassifications, most probably related to the coarse resolution of our pixels (which might include small suitable areas), to the particular coast exposure or composition, or even to the lack of sufficient data in developing the HSM.
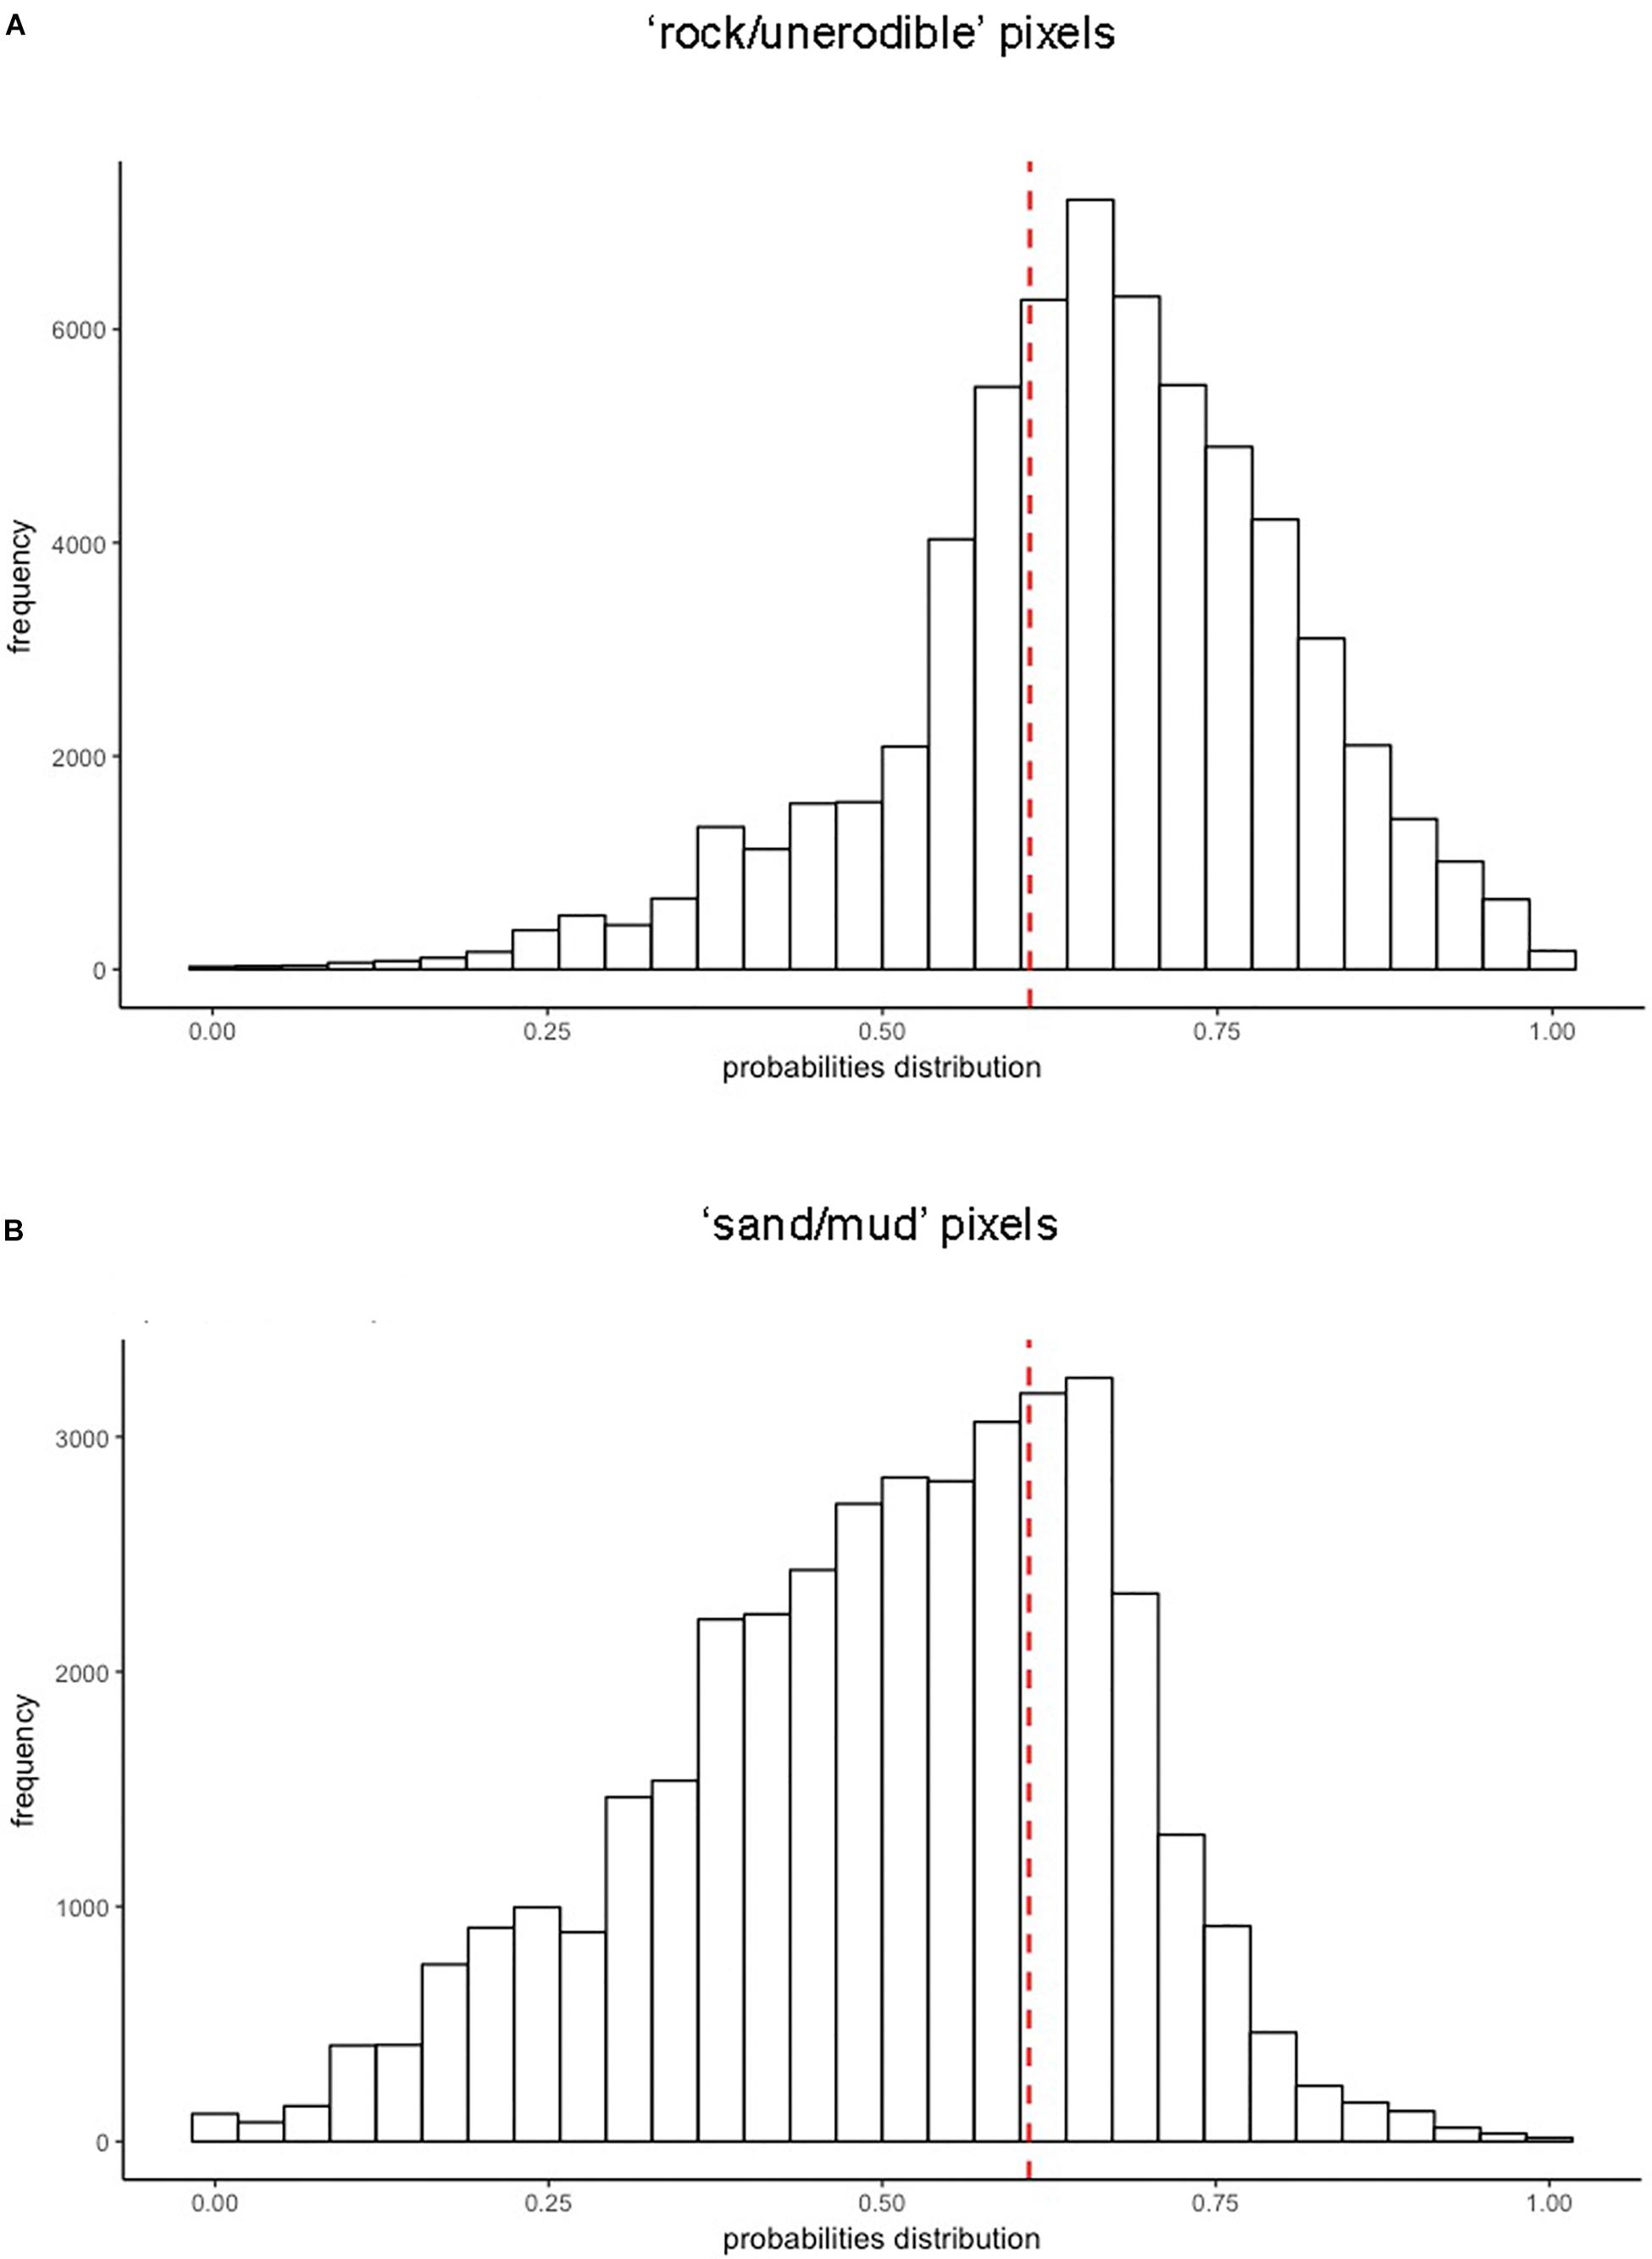
Figure 7. Distribution RF output values for “no-data” records, grouped on the basis of the type of coastline: (A) “rock/unerodible” pixels; (B) “sand/mud” pixels. Red dashed lines represent the optimal cut-off (t = 0.61).
In the Figure 8 we presented an overview of our habitat suitability assessment. High resolution details of the model predictions are provided in the raster ASCII format as a zip file in the Supplementary Data Sheet S1.
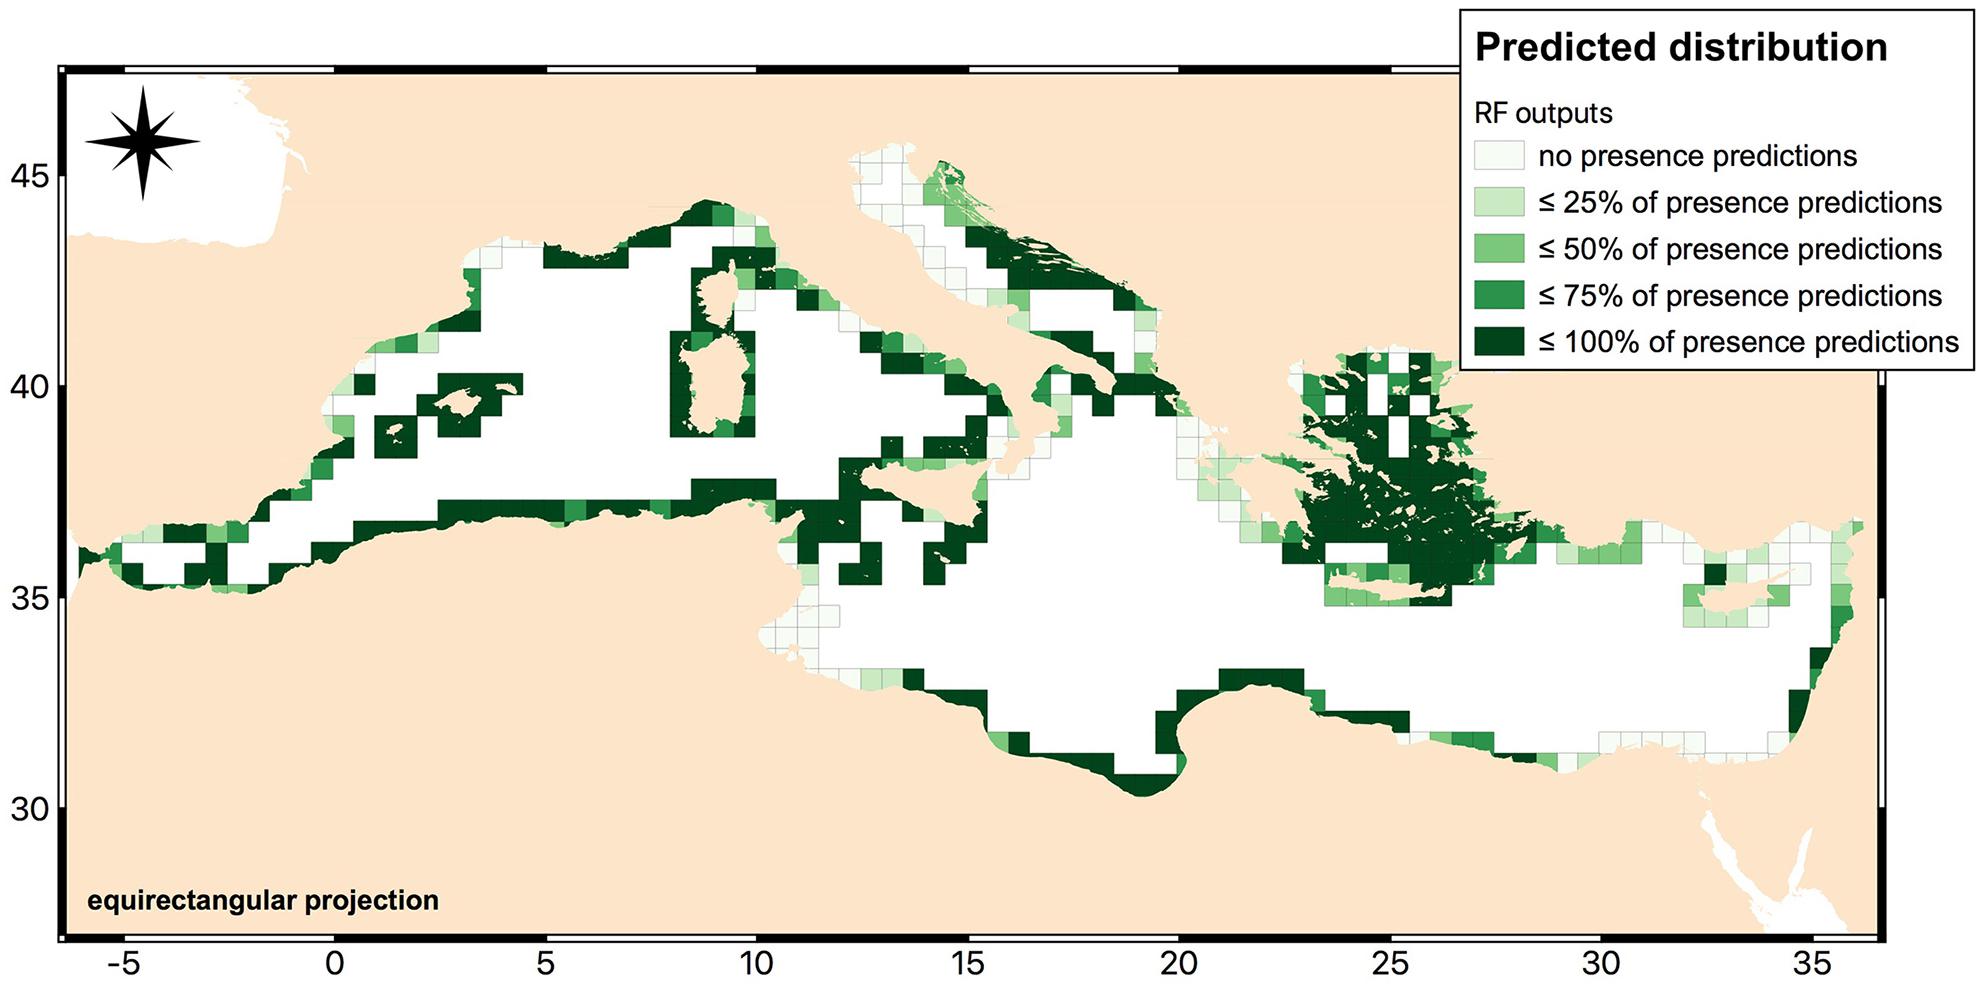
Figure 8. Map of the predicted distribution of Cystoseira infralittoral species according to RF outputs. The map is based on a combined dataset of canopy-forming species and records of species which may not be “forest”-forming (e.g., C. compressa). It has been created with QGIS software (QGIS Development Team, 2018. QGIS Geographic Information System. O3.Open Source Geospatial Foundation: https://www.qgis.org/it/site/).
Discussion
We produced the first effort able to deliver a georeferenced dataset of Cystoseira forests strongly affected by human pressures and deserving conservation priorities across the whole Mediterranean basin. This first crucial step enabled us to deepen our understanding on canopies distribution and to fill gaps in our knowledge by developing a HSM for a subset of Cystoseira species distributed on the shallow rocky shores.
To develop the HSM, we considered areas where both presence and absence records were available, using all other Mediterranean regions to validate and test model performances. Our model showed a quite high accuracy level in reproducing Cystoseira distribution, endorsed by a large number of occurrence and environmental data, but also enhanced by the identification of the species of the shallow rocky shores as a rather uniform ecological target to be modeled. On the other hand, the spatial resolution of our study, imposed by the available resolution for predictor variables, precluded a species-specific distribution assessment. Fine-scale data are indeed needed in order to improve the model in this sense (Cefalì et al., 2018). Our database suffers from all the limitations already described across the literature. Research efforts (published and unpublished) differ among countries (Coll et al., 2010), and large data gaps emerged in the eastern and southern part of the basin. Furthermore, heterogeneous sampling methods or false absences in occupancy surveys can lead to underestimation if the imperfect detection of the species is not accounted for Katsanevakis et al. (2017). These issues might have affected our spatial representation of Cystoseira canopies, resulting in an incorrect estimate of species distribution.
Despite the limits, the chosen approach based on the RF technique allowed us to highlight the most relevant predictor variables affecting the HSM and therefore those variables better candidates to explain Cystoseira canopies distribution and potential for regression. Considering both the importance measures obtained as RF outputs, the topographic coastal slope and the nature of substrate along the coast were identifies as the main factors in controlling Cystoseira canopies distribution, in accordance with the specific coastal conditions required for the infralittoral species development, limited to intertidal and shallow subtidal rocky shores (ESRI, 2012; Mancuso et al., 2018). Some anthropogenic variables emerged as relatively important from this analysis, but they followed the importance of the geomorphological ones. These variables (i.e., the distance to ports and to the urban areas), proxies of pollution and urbanization, have been claimed to drive the loss of Cystoseira forests in many Mediterranean regions in the last 20 years (Cormaci and Furnari, 1999; Benedetti-Cecchi et al., 2001; Thibaut et al., 2005; Mangialajo et al., 2008; Sales and Ballesteros, 2009; Perkol-Finkel and Airoldi, 2010). Finally, environmental variables, such as the distance to river mouths, the euphotic depth, the diffuse attenuation coefficient, the mean of chlorophyll a and the nitrate concentration, also displayed a significant role in the RF growth. Actually, these predictors can be regarded as indicators of nutrient enhancement, water turbidity and eutrophication levels which are included in several studies amongst the main causes for the regression of Cystoseira species (Cormaci and Furnari, 1999; Arévalo et al., 2007; Sales and Ballesteros, 2009; Fraschetti et al., 2011; Sala et al., 2012; Mancuso et al., 2018). Nevertheless, attention should be drawn to the fact that RF, given its potential to reflect the resemblance between the local spatial structure of predictor variables and species distribution, does not allow to reveal causal relationships. In our model, RF highlights that anthropogenic pressures, directly or indirectly, could have important roles in affecting the distribution of Cystoseira species, identifying several factors to be prioritized in conservation actions devoted to this genus. However, experimental studies are needed to identify the drivers for the observed canopies regression, as well as a shift from a single-threat approach toward a multiple-stressor one should be adopted in order to understand patterns of distribution and trajectories of change in Cystoseira forests (Benedetti-Cecchi et al., 2015; Mancuso et al., 2018). Notwithstanding, recently developed methods based on the hybridization of experimental and observational data provide novel opportunities to leverage the scope and causal inferential strength of large-scale studies (Benedetti-Cecchi et al., 2018). For example, these methods allow integrating empirical estimates of biological interactions into species distribution models, effectively increasing the predictive accuracy and ability to attribute causality of these models. This might be particularly critical for Cystoseira since another potentially strong but yet unexplored predictor for the presence of macroalgal forests is the emergence of highly effective grazers, invasive Indo Pacific rabbitfish (especially Siganus luridus), which in the southeast Mediterranean (Turkey, Israel) already decimate all erect, edible, macroalgae down to turf barrens (Rilov et al., 2018). The fishes are rapidly spreading to the west and north and the rate of spread of is probably strongly related to water temperature (and is thus probably facilitated by ocean warming).
From the validation phase of the modeling procedure we determined the predictive accuracy in spatially independent Mediterranean areas in order to better evaluate model performances. Indeed, testing the model in a wider variety of spatial context means to better define the range of applications for which the model predictions are suited (Guisan and Zimmermann, 2000). In most cases model accuracy was high and presence records matched with pixels classified as suitable for holding Cystoseira canopies. In particular, Sardinia resulted having the highest frequency of correctly predicted cases and this result possibly derives from the low presence of anthropogenic pressures affecting the area. Model predictions showed an evident misclassification rate only for the eastern Mediterranean regions and the northern Adriatic Sea. Reasons for model biases probably lie in distinctive conditions, including the presence of human threats or unsuitable environmental conditions, characterizing these coastal areas. A finer resolution of predictor variables would enhance the RF ability to correctly reproduce Cystoseira distribution, pointing out environmental heterogeneities hidden under a coarser resolution used in this study. Data on the environmental drivers affecting intertidal and nearshore ecosystems (e.g., human impacts or the type of shoreline) are largely incomplete (Halpern et al., 2008), reducing our ability to assess the present and the future state of marine habitats. Moreover, it should be stressed that especially for the eastern Mediterranean regions, outdated occurrence data may have led to an inaccurate representation of the current distribution of the canopies.
Final Remarks
Underpinned by model outputs, we will better direct our management and restoration efforts on the basis of the predictions on the presence/absence of the species, also combined to the information about human pressures. A first model attempt was performed by Buonomo et al. (2018) analyzing intertidal Cystoseira populations in order to predict their future ranges according to different climatic scenarios in the Mediterranean Sea. According to that model an important loss of suitable areas is expected across the range of distribution of the habitat-forming seaweed species already by 2050, with cascading effects on the whole ecosystem and the services that it provides.
In this respect, the model output from this study allows to investigate areas classified as suitable with high probability of Cystoseira occurrence, to assess if the predicted status of presence matched the real one and thus to define new suitable locations for restoration plans. As a result, the HSM could be seen as a useful baseline tool for the assessment of Cystoseira distribution and for the establishment of future-oriented marine planning initiatives from both conservation and restoration point of view, at least as far as the species on the shallow rocky shores. However, there is still a long way until we can use these predictions for true management and (mainly) restoration. Actually, both have to rely on species-specific actions and a (more) spatially accurate information on the environmental factors at the places to be managed or restored. In the case of restoration, it is also pivotal that the pressures that drove the disappearance of the canopies have been mitigated. For this reason, acting on reducing and carefully planning the distribution of local pressures should be considered a priority (Buonomo et al., 2018). In any case, to assess the spatial generality of models, an exhaustive evaluation of how the quality of its output varies within different regional context is required (Gorman et al., 2013). As stressed from the model validation, predictions for Mediterranean regions where model performances are quite limited due to environmental distinctiveness and heterogeneities (e.g., the eastern Mediterranean areas) may not reproduce the actual canopies distribution. In this regard, the large proportion of “no-data” records is an important limit in the development of the HSM and therefore in the understanding of the potential distribution of Cystoseira forests across all the Mediterranean coastlines.
Improving model outputs with a finer resolution of predictor variable layers and better dataset with species occurrences would allow more reliable predictions also for these regions and would promote the identification of species-specific suitable and unsuitable areas making our model more sensitive to ecological differences among species.
Data Availability Statement
The dataset produced for this study will be made available by the authors, without undue reservation, to any qualified researcher in the shapefile format.
Author Contributions
SIMFRA and MS conceived the study. EF carried out the data analysis. MS provided the guidance on modeling efforts. SIMFRA and EF wrote the manuscript. All authors contributed to the data collection and manuscript revision. SIMFRA coordinated all steps in finalizing the manuscript.
Conflict of Interest
The authors declare that the research was conducted in the absence of any commercial or financial relationships that could be construed as a potential conflict of interest.
Funding
This research was funded by the EU Interreg MED AMAre Project (http://msp-platform.eu/projects/amare-actions-marine-protected-areas) and the project MERCES of the European Union’s Horizon 2020 Research (Grant Agreement No. 689518, http://www.merces-project.eu). EF was supported by Regione Lazio within the project Torno Subito, 2017 (http://www.tornosubito.laziodisu.it).
Acknowledgments
We thank the collaborators on the AMAre, MERCES, and CoCoNet projects who provided the background information supporting this study. We also acknowledge the role of the project AFRIMED (EASME/EMFF/2017/1.2.1.12 – Sustainable Blue Economy).
Supplementary Material
The Supplementary Material for this article can be found online at: https://www.frontiersin.org/articles/10.3389/fmars.2020.00020/full#supplementary-material
Footnotes
- ^ http://www.emodnet.eu/
- ^ http://www.merces-project.eu/
- ^ https://ec.europa.eu/easme/en/afrimed-algal-forest-restoration-mediterranean-sea
- ^ http://www.emodnet-biology.eu
- ^ https://www.qgis.org/it/site/
- ^ http://marine.copernicus.eu
- ^ https://CRAN.R-project.org/package=raster
- ^ https://www.R-project.org/
- ^ https://www.stat.berkeley.edu/~breiman/RandomForests/cc_software.htm
- ^ https://CRAN.R-project.org/package=caret
- ^ http://www.biomedcentral.com/1471-2105/12/77/
References
Airoldi, L., Balata, D., and Beck, M. W. (2008). The gray zone: relationships between habitat loss and marine diversity and their applications in conservation. J. Exp. Mar. Biol. Ecol. 366, 8–15. doi: 10.1016/j.jembe.2008.07.034
Airoldi, L., and Beck, M. W. (2007). “Loss, status and trends for coastal marine habitats of Europe,” in Oceanography and Marine Biology, eds R. N. Gibson, R. J. A. Atkinson, and J. D. M. Gordon, (Boca Raton, FL: CRC Press), 345–405. doi: 10.1201/9781420050943.ch7
Arévalo, R., Pinedo, S., and Ballesteros, E. (2007). Changes in the composition and structure of mediterranean rocky-shore communities following a gradient of nutrient enrichment: descriptive study and test of proposed methods to assess water quality regarding macroalgae. Mar. Pollut. Bull. 55, 104–113. doi: 10.1016/j.marpolbul.2006.08.023
Ballesteros, E. (1990). Structure and dynamics of the community of Cystoseira zosteroides (Turner) C. Agardh (Fucales, Phaeophyceae) in the Northwestern Mediterranean. Sci. Mar. 54, 217–229.
Ballesteros, E., Sala, E., Garrabou, J., and Zabala, M. (1998). Community structure and frond size distribution of a deep Water stand of Cystoseira spinosa (Phaeophyta) in the Northwestern Mediterranean. Eur. J. Phycol. 33, 121–128. doi: 10.1080/09670269810001736613
Ballesteros, E., Torras, X., Pinedo, S., García, M., Mangialajo, L., and de Torres, M. (2007). ‘A new methodology based on littoral community cartography dominated by macroalgae for the implementation of the European water framework directive’. Mar. Pollut. Bull. 55, 172–180. doi: 10.1016/j.marpolbul.2006.08.038
Bastari, A., Pica, D., Ferretti, F., Micheli, F., and Cerrano, C. (2018). Sea pens in the mediterranean sea: habitat suitability and opportunities for ecosystem recovery. ICES J. Mar. Sci. 75, 1722–1732. doi: 10.1093/icesjms/fsy010
Benedetti-Cecchi, L., Bulleri, F., Dal Bello, M., Maggi, E., Ravaglioli, C., and Rindi, L. (2018). Hybrid datasets: integrating observations with experiments in the Era of macroecology and big data. Ecology 99, 2654–2666. doi: 10.1002/ecy.2504
Benedetti-Cecchi, L., Pannacciulli, F., Bulleri, F., Moschella, P., Airoldi, L., Relini, G., et al. (2001). Predicting the consequences of anthropogenic disturbance: large-scale effects of loss of canopy algae on rocky shores. Mar. Ecol. Prog. Ser. 214, 137–150. doi: 10.3354/meps214137
Benedetti-Cecchi, L., Tamburello, L., Maggi, E., and Bulleri, F. (2015). Experimental perturbations modify the performance of early warning indicators of regime shift. Curr. Biol. 25, 1867–1872. doi: 10.1016/j.cub.2015.05.035
Bianchi, C. N., Caroli, F., Guidetti, P., and Morri, C. (2018). Seawater warming at the Northern reach for southern species: gulf of genoa, NW mediterranean. J. Mar. Biolog. Assoc. U.K. 98, 1–12. doi: 10.1017/S0025315417000819
Blanfuné, A., Boudouresque, C. F., Verlaque, M., and Thibaut, T. (2016). The fate of Cystoseira rinita, a forest-forming fucale (Phaeophyceae, Stramenopiles), in France (North Western Mediterranean Sea). Estuar. Coast. Shelf Sci. 181, 196–208. doi: 10.1016/j.ecss.2016.08.049
Boavida, J., Assis, J., Silva, I., and Serrão, E. A. (2016). Overlooked habitat of a vulnerable gorgonian revealed in the mediterranean and Eastern Atlantic by ecological niche modelling. Sci. Rep. 6:36460. doi: 10.1038/srep36460
Boyer, T., Levitus, S., Garcia, H., Locarnini, R. A., Stephens, C., and Antonov, J. (2005). Objective analyses of annual, seasonal, and monthly temperature and salinity for the world ocean on a 0.25° grid. Int. J. Climatol. 25, 931–945. doi: 10.1002/joc.1173
Boyer, T. P., Antonov, J. I., Baranova, O. K., Garcia, H. E., Johnson, D. R., Mishonov, A. V., et al. (2009). “World ocean database 2009,” in NOAA Atlas NESDIS 66, ed. S. Levitus, (Washinton, DC: U.S. Government Printing Office).
Breiman, L. (2003). “Two-eyed algorithms and problems,” in Knowledge Discovery in Databases: PKDD 2003, Vol. 2838, eds N. Lavrač, D. Gamberger, L. Todorovski, and H. Blockeel, (Berlin: Springer), 9–9. doi: 10.1007/978-3-540-39804-2-2
Buonomo, R., Chefaoui, R. M., Lacida, R. B., Engelen, A. H., Serrão, E. A., and Airoldi, L. (2018). Predicted extinction of unique genetic diversity in marine forests of Cystoseira spp. Mar. Environ. Res. 138, 119–128. doi: 10.1016/j.marenvres.2018.04.013
Casey, K. S., Brandon, T. B., Cornillon, P., and Evans, R. (2010). “The past, present, and future of the AVHRR Pathfinder SST program,” in Oceanography from Space, eds V. Barale, J. Gower, and L. Alberotanza, (Dordrecht: Springer), 273–287. doi: 10.1007/978-90-481-8681-5-16
Catucci, E., and Scardi, M. (2020). A Machine Learning approach to the assessment of the vulnerability of Posidonia oceanica meadows. Ecol. Ind. 108:105744. doi: 10.1016/j.ecolind.2019.105744
Cefalì, M. E., Ballesteros, E., Riera, J. L., Chappuis, E., Terradas, M., Mariani, S., et al. (2018). The optimal sampling design for littoral habitats modelling: a case study from the north-western Mediterranean. PLoS One 13:e0197234. doi: 10.1371/journal.pone.0197234
Chefaoui, R. M., Casado-Amezúa, P., and Templado, J. (2017). Environmental drivers of distribution and reef development of the Mediterranean coral Cladocora caespitosa. Coral Reefs 36, 1195–1209. doi: 10.1007/s00338-017-1611-8
Cheminée, A., Sala, E., Pastor, J., Bodilis, P., Thiriet, P., Mangialajo, L., et al. (2013). Nursery value of Cystoseira forests for Mediterranean rocky reef fishes. J. Exp. Mar. Biol. Ecol. 442, 70–79. doi: 10.1016/j.jembe.2013.02.003
Claudet, J., and Fraschetti, S. (2010). Human-driven impacts on marine habitats: a regional meta-analysis in the Mediterranean sea. Biol. Conserv. 143, 2195–2206. doi: 10.1016/j.biocon.2010.06.004
Cohen, J. (1960). A coefficient of agreement for nominal scales. Educ. Psychol. Meas. 20, 37–46. doi: 10.1177/001316446002000104
Coll, M., Piroddi, C., Albouy, C., Ben Rais Lasram, F., Cheung, W. W. L., Christensen, V., et al. (2012). The Mediterranean sea under siege: spatial overlap between marine biodiversity, cumulative threats and marine reserves: the Mediterranean sea under siege. Glob. Ecol. Biogeogr. 21, 465–480. doi: 10.1111/j.1466-8238.2011.00697.x
Coll, M., Piroddi, C., Steenbeek, J., Kaschner, K., Ben Rais Lasram, F., Aguzzi, J., et al. (2010). The biodiversity of the mediterranean sea: estimates, patterns, and threats. PLoS One 5:e11842. doi: 10.1371/journal.pone.0011842
Connell, S., Russell, B., Turner, D., Shepherd, S., Kildea, T., Miller, D., et al. (2008). Recovering a lost baseline: missing kelp forests from a Metropolitan coast. Mar. Ecol. Prog. Ser. 360, 63–72. doi: 10.3354/meps07526
Cormaci, M., and Furnari, G. (1999). “Changes of the benthic algal flora of the Tremiti Islands (Southern Adriatic) Italy,” in Proceedings of the Sixteenth International Seaweed Symposium, eds J. M. Kain, M. T. Brown, and M. Lahaye, (Dordrecht: Springer), 75–79. doi: 10.1007/978-94-011-4449-0-9
Douvere, F. (2010). Marine Spatial Planning: Concepts, Current Practice and Linkages to Other Management Approaches. Ph.D. thesis, Ghent University, Belgium.
Duarte, C. M. (2002). The future of seagrass meadows. Environ. Conserv. 29, 192–206. doi: 10.1017/S0376892902000127
Falace, A., Alongi, G., Cormaci, M., Furnari, G., Curiel, D., Cecere, E., et al. (2010). Changes in the benthic algae along the Adriatic sea in the last three decades. Chem. Ecol. 26, 77–90. doi: 10.1080/02757541003689837
Feldman, G. C., and McClain, C. R. (2010). Ocean Color Web, SeaWiFS Reprocessing. Greenbelt, MD: NASA Goddard Space Flight Center.
Feldmann, J. (1937). Recherches Sur La Vegetation Marine de La Méditerranée. Première Thèse, University of Michigan, La Côte Des Albères.
Fowler-Walker, M., and Connell, S. (2002). Opposing states of subtidal habitat across temperate Australia: consistency and predictability in kelp Canopy-Benthic associations. Mar. Ecol. Prog. Ser. 240, 49–56. doi: 10.3354/meps240049
Fraschetti, S., Bianchi, C. N., Terlizzi, A., Fanelli, G., Morri, C., and Boero, F. (2001). Spatial variability and human disturbance in shallow subtidal hard substrate assemblages: a regional approach. Mar. Ecol. Prog. Ser. 212, 1–12. doi: 10.3354/meps212001
Fraschetti, S., Terlizzi, A., Guarnieri, G., Pizzolante, F., D’Ambrosio, P., Maiorano, P., et al. (2011). Effects of unplanned development on marine biodiversity: a lesson from Albania (Central Mediterranean Sea). J. Coast. Res. 270, 106–115. doi: 10.2112/SI-58-10
García-Fernández, A., and Bárbara, I. (2016). Studies of Cystoseira assemblages in Northern Atlantic Iberia. Anales Del Jardín Botánico de Madrid 73:e035. doi: 10.3989/ajbm.2403
Ghanem, R., Soufi Kechaou, E., Ben Souissi, J., and Garrabou, J. (2018). Overview on the distribution of gorgonian species in Tunisian marine coastal waters (Central Mediterranean). Sci. Mar. 82, 55–66. doi: 10.3989/scimar.04675.07A
Giaccone, G., and Bruni, A. (1973). Le Cistoseire e La Vegetazione Sommersa Del Mediterraneo. Via Festa del Perdono: Università degli Studi.
Giakoumi, S., Cebrian, E., Kokkoris, G. D., Ballesteros, E., and Sala, E. (2012). Relationships between Fish, Sea Urchins and Macroalgae: the structure of shallow rocky sublittoral communities in the cyclades, Eastern Mediterranean. Estuar. Coast. Shelf Sci. 109, 1–10. doi: 10.1016/j.ecss.2011.06.004
Gianni, F., Bartolini, F., Airoldi, L., Ballesteros, E., Francour, P., Guidetti, P., et al. (2013). Conservation and restoration of marine forests in the Mediterranean sea and the potential role of marine protected areas. Adv. Oceanogr. Limnol. 4, 83–101. doi: 10.1080/19475721.2013.845604
Gorman, D., Bajjouk, T., Populus, J., Vasquez, M., and Ehrhold, A. (2013). Modeling kelp forest distribution and biomass along temperate rocky coastlines. Mar. Biol. 160, 309–325. doi: 10.1007/s00227-012-2089-0
Guardia, R. (2018). CeDoc de Biodiversitat Vegetal: BCN-Phycophyta. CeDoc of Plant Biodiversity (CeDocBIV). Barcelona: University Barcelona. Available at: http://www.emodnet-biology.eu
Guarnieri, G., Bevilacqua, S., Vignes, F., and Fraschetti, S. (2014). Grazer removal and nutrient enrichment as recovery enhancers for overexploited rocky subtidal habitats. Oecologia 175, 959–970. doi: 10.1007/s00442-014-2944-4
Gubbay, S., Sanders, N., Haynes, T., Janssen, J. A. M., Rodwell, J. R., Nieto, A., et al. (2016). European Red List of Habitats. Part 1: Marine Habitats. Luxembourg: Publication office of the European Union (IS).
Guisan, A., and Wilfried, T. (2005). Predicting species distribution: offering more than simple habitat models. Ecol. Lett. 8, 993–1009. doi: 10.1111/j.1461-0248.2005.00792.x
Guisan, A., and Zimmermann, N. E. (2000). Predictive habitat distribution models in ecology. Ecol. Model. 135, 147–186. doi: 10.1016/S0304-3800(00)00354-9
Halpern, B. S., Walbridge, S., Selkoe, K. A., Kappel, C. V., Micheli, F., D’Agrosa, C., et al. (2008). A global map of human impact on marine ecosystems. Science 319, 948–952. doi: 10.1126/science.1149345
Hijmans, R. J. (2017). Raster: Geographic Data Analysis and Modeling. R Package Version 2.6-7. Available at: https://CRAN.R-project.org/package=raster
Ishwaran, H. (2007). Variable importance in binary regression trees and forests. Electron. J. Stat. 1, 519–537. doi: 10.1214/07-EJS039
Katsanevakis, S., Sini, M., Dailianis, T., Gerovasileiou, V., Koukourouvli, N., Topouzelis, K., et al. (2017). Identifying where vulnerable species occur in a data-poor context: combining satellite imaging and underwater occupancy surveys. Mar. Ecol. Prog. Ser. 577, 17–32. doi: 10.3354/meps12232
Kuhn, M. (2017). Caret: Classification and Regression Training. R Package Version 6.0-78. Available at: https://CRAN.R-project.org/package=caret
Lamela-Silvarrey, C., Fernández, C., Anadón, R., and Arrontes, J. (2012). Fucoid assemblages on the North Coast of Spain: past and present (1977–2007). Bot. Mar. 55, 199–207. doi: 10.1515/bot-2011-0081
Levin, N., Coll, M., Fraschetti, S., Gal, G., Giakoumi, S., Göke, C., et al. (2014). Biodiversity data requirements for systematic conservation planning in the Mediterranean sea. Mar. Ecol. Prog. Ser. 508, 261–281. doi: 10.3354/meps10857
Louppe, G., Wehenkel, L., Sutera, A., and Geurts, P. (2013). “Understanding variable importances in forests of randomized trees,” in Proceedings of the NIPS’13 26th International Conference on Neural Information Processing System, Vol. 1, eds C. J. C. Burges, L. Bottou, M. Welling, Z. Ghahramani, and K. Q. Weinberg, (Nevada: Curran Associates Inc), 431–439.
Mancuso, F. P., Strain, E. M. A., Piccioni, E., De Clerck, O., Sarà, G., and Airoldi, L. (2018). Status of vulnerable Cystoseira populations along the Italian infralittoral fringe, and relationships with environmental and anthropogenic variables. Mar. Pollut. Bull. 129, 762–771. doi: 10.1016/j.marpolbul.2017.10.068
Mangialajo, L., Chiantore, M., and Cattaneo-Vietti, R. (2008). Loss of Fucoid algae along a gradient of Urbanisation, and structure of Benthic assemblages. Mar. Ecol. Prog. Ser. 358, 63–74. doi: 10.3354/meps07400
Martin, C. S., Giannoulaki, M., De Leo, F., Scardi, M., Salomidi, M., Knittweis, L., et al. (2014). Coralligenous and Maërl habitats: predictive modelling to identify their spatial distributions across the Mediterranean sea. Sci. Rep. 4:5073. doi: 10.1038/srep05073
Martínez, B., Radford, B., Thomsen, M. S., Connell, S. D., Carreño, F., Bradshaw, C. J. A., et al. (2018). Distribution models predict large contractions of habitat-forming seaweeds in response to ocean warming. Divers. Distrib. 24, 1350–1366. doi: 10.1111/ddi.12767
McArthur, M. A., Brooke, B. P., Przeslawski, R., Ryan, D. A., Lucieer, V. L., Nichol, S., et al. (2010). On the use of Abiotic surrogates to describe marine Benthic biodiversity. Estuar. Coast. Shelf Sci. 88, 21–32. doi: 10.1016/j.ecss.2010.03.003
McHugh, M. L. (2012). Interrater reliability: the Kappa statistic. Biochem. Med. 22, 276–282. doi: 10.11613/bm.2012.031
McPeters, R. D., Bhartia, P. K., Krueger, A. J., Herman, J. R., Wellemeyer, C. G., Seftor, C. J., et al. (1998). Earth Probe Total Ozone Mapping Spectrometer (TOMS): Data Products User’s Guide, Documentation. Washington, D.C: National Aeronautics and Space Administration (NASA). Available at: http://cedadocs.ceda.ac.uk/id/eprint/10
Mineur, F., Arenas, F., Assis, J., Davies, A. J., Engelen, A. H., Fernandes, F., et al. (2015). European seaweeds under pressure: consequences for communities and ecosystem functioning. J. Sea Res. 98, 91–108. doi: 10.1016/j.seares.2014.11.004
Murray, S. N., and Littler, M. M. (1978). Patterns of algal succession in a Perturbated marine intertidal community. J. Phycol. 14, 506–512. doi: 10.1111/j.1529-8817.1978.tb02477.x
Orth, R. J., Carruthers, T. J. B., Dennison, W. C., Duarte, C. M., Fourqurean, J. W., Heck, K. L., et al. (2006). A global crisis for seagrass ecosystems. BioScience 56, 987–996. doi: 10.1016/j.tree.2019.04.004
Peltier, W. R., Argus, D. F., and Drummond, R. (2014). Space geodesy constrains ice age terminal deglaciation: the global ICE-6G_C (VM5a) model. JGR Solid Earth 120, 450–487. doi: 10.1002/2014JB011176
Perkol-Finkel, S., and Airoldi, L. (2010). Loss and recovery potential of marine habitats: an experimental study of factors maintaining resilience in subtidal algal forests at the Adriatic sea. PLoS One 5:e10791. doi: 10.1371/journal.pone.0010791
Piazzi, L., Bonaviri, C., Castelli, A., Ceccherelli, G., Costa, G., Curini-Galletti, M., et al. (2018). Biodiversity in canopy-forming algae: structure and spatial variability of the Mediterranean Cystoseira assemblages. Estuar. Coast. Shelf Sci. 207, 132–141. doi: 10.1016/j.ecss.2018.04.001
Pickering, M. D. (2014). The Impact of Future Sea-Level Rise on the Tides. Southampton: University of Southampton. PhD thesis.
Pinedo, S., García, M., Satta, M. P., de Torres, M., and Ballesteros, E. (2007). Rocky-shore communities as indicators of water quality: a case study in the Northwestern Mediterranean. Mar. Pollut. Bull. 55, 126–135. doi: 10.1016/j.marpolbul.2006.08.044
Portman, M. E., Notarbartolo-di-Sciara, G., Agardy, T., Katsanevakis, S., Possingham, H. P., and Di-Carlo, G. (2013). He who hesitates is lost: why conservation in the Mediterranean sea is necessary and possible now. Mar. Policy 42, 270–279. doi: 10.1016/j.marpol.2013.03.004
QGIS Development Team (2018). QGIS Geographic Information System. O3. Chicago, IL: Open Source Geospatial Foundation. Available at: http://qgis.osgeo.org
R Core Team (2016). R: A Language and Environment for Statistical Computing. Vienna: R Foundation for Statistical Computing. Available at: https://www.R-project.org/
Rilov, G., Peleg, O., Yeruham, E., Garval, T., Vichik, A., and Raveh, O. (2018). Alien turf: overfishing, overgrazing and invader domination in South-Eastern Levant Reef ecosystems. Aquat. Conserv. 28, 351–369. doi: 10.1002/aqc.2862
Robin, X., Turck, N., Hainard, A., Tiberti, N., Lisacek, F., Sanchez, J.-C., et al. (2011). pROC: an open-source package for R and S+ to analyze and compare ROC curves. BMC Bioinform. 12:77. doi: 10.1186/1471-2105-12-77
Rodríguez, J. P., Brotons, L., Bustamante, J., and Seoane, J. (2007). The application of predictive modelling of species distribution to biodiversity conservation. Divers. Distrib. 13, 243–251. doi: 10.1111/j.1472-4642.2007.00356.x
Sala, E., Ballesteros, E., Dendrinos, P., Di Franco, A., Ferretti, F., Foley, D., et al. (2012). The structure of mediterranean Rocky Reef ecosystems across environmental and human gradients, and conservation implications. PLoS One 7:e32742. doi: 10.1371/journal.pone.0032742
Sala, E., Kizilkaya, Z., Yildirim, D., and Ballesteros, E. (2011). Alien marine fishes deplete algal biomass in the Eastern Mediterranean. PLoS One 6:e17356. doi: 10.1371/journal.pone.0017356
Sales, M., and Ballesteros, E. (2009). Shallow Cystoseira (Fucales: Ochrophyta) assemblages thriving in sheltered areas from Menorca (NW Mediterranean): relationships with environmental factors and anthropogenic pressures. Estuar. Coast. Shelf Sci. 84, 476–482. doi: 10.1016/j.ecss.2009.07.013
Steneck, R. S., Graham, M. H., Bourque, B. J., Corbett, D., Erlandson, J. M., Estes, J. A., et al. (2002). Kelp forest ecosystems: biodiversity, stability, resilience and future. Environ. Conserv. 29, 436–459. doi: 10.1017/S0376892902000322
Strain, E. M. A., Thomson, R. J., Micheli, F., Mancuso, F. P., and Airoldi, L. (2014). Identifying the interacting roles of stressors in driving the global loss of Canopy-Forming to mat-forming algae in marine ecosystems. Glob. Change Biol. 20, 3300–3312. doi: 10.1111/gcb.12619
Telesca, L., Belluscio, A., Criscoli, A., Ardizzone, G., Apostolaki, E. T., Fraschetti, S., et al. (2015). Seagrass Meadows (Posidonia oceanica) distribution and trajectories of change. Sci. Rep. 5:12505. doi: 10.1038/srep12505
Thibaut, T., Blanfuné, A., Boudouresque, C. F., and Verlaque, M. (2015). Decline and local extinction of Fucales in the French riviera: the harbinger of future extinctions? Mediterr. Mar. Sci. 16, 206–224. doi: 10.12681/mms.1032
Thibaut, T., Pinedo, S., Torras, X., and Ballesteros, E. (2005). Long-Term decline of the populations of fucales (Cystoseira spp. and Sargassum spp.) in the Albères Coast (France, North-Western Mediterranean). Mar. Pollut. Bull. 50, 1472–1489. doi: 10.1016/j.marpolbul.2005.06.014
Tyberghein, L., Verbruggen, H., Pauly, K., Troupin, C., Mineur, F., and De Clerck, O. (2012). Bio-ORACLE: a global environmental dataset for marine species distribution modelling. Glob. Ecol. Biogeogr. 21, 272–281. doi: 10.1111/j.1466-8238.2011.00656.x
Van Soest, R. W. M., Boury-Esnault, N., Vacelet, J., Dohrmann, M., Erpenbeck, D., De Voogd, N. J., et al. (2012). Global diversity of sponges (Porifera). PLoS One 7:e35105. doi: 10.1371/journal.pone.0035105
Vergés, A., Tomas, F., Cebrian, E., Ballesteros, E., Kizilkaya, Z., Dendrinos, P., et al. (2014). Tropical rabbitfish and the deforestation of a warming temperate sea. J. Ecol. 102, 1518–1527. doi: 10.1111/1365-2745.12324
Waycott, M., Duarte, C. M., Carruthers, T. J. B., Orth, R. J., Dennison, W. C., Olyarnik, S., et al. (2009). Accelerating loss of seagrasses across the Globe Threatens Coastal ecosystems. Proc. Natl. Acad. Sci. U.S.A. 106, 12377–12381. doi: 10.1073/pnas.0905620106
Wessel, P., and Smith, W. H. F. (1996). A global, self-consistent, hierarchical, high-resolution shoreline database. J. Geophys. Res. Solid Earth 101, 8741–8743. doi: 10.1029/96JB00104
Wolff, C., Vafeidis, A. T., Muis, S., Lincke, D., Satta, A., Lionello, P., et al. (2018). A Mediterranean coastal database for assessing the impacts of sea-level rise and associated Hazards. Sci. Data 5:180044. doi: 10.1038/sdata.2018.44
Yesson, C., Bedford, F., Rogers, A. D., and Taylor, M. L. (2017). The global distribution of deep-water Antipatharia Habitat. Deep Sea Res. Part II 145, 79–86. doi: 10.1016/j.dsr2.2015.12.004
Keywords: Cystoseira canopies, habitat suitability model, Mediterranean Sea, Random Forest, species distribution
Citation: Fabbrizzi E, Scardi M, Ballesteros E, Benedetti-Cecchi L, Cebrian E, Ceccherelli G, De Leo F, Deidun A, Guarnieri G, Falace A, Fraissinet S, Giommi C, MaÄiÄ V, Mangialajo L, Mannino AM, Piazzi L, Ramdani M, Rilov G, Rindi L, Rizzo L, Sarà G, Souissi JB, Taskin E and Fraschetti S (2020) Modeling Macroalgal Forest Distribution at Mediterranean Scale: Present Status, Drivers of Changes and Insights for Conservation and Management. Front. Mar. Sci. 7:20. doi: 10.3389/fmars.2020.00020
Received: 11 April 2019; Accepted: 13 January 2020;
Published: 04 February 2020.
Edited by:
Angel Borja, Technological Center Expert in Marine and Food Innovation (AZTI), SpainReviewed by:
José M. Rico, University of Oviedo, SpainMichelle Jillian Devlin, Centre for Environment, Fisheries and Aquaculture Science, United Kingdom
Copyright © 2020 Fabbrizzi, Scardi, Ballesteros, Benedetti-Cecchi, Cebrian, Ceccherelli, De Leo, Deidun, Guarnieri, Falace, Fraissinet, Giommi, Mačić, Mangialajo, Mannino, Piazzi, Ramdani, Rilov, Rindi, Rizzo, Sarà, Souissi, Taskin and Fraschetti. This is an open-access article distributed under the terms of the Creative Commons Attribution License (CC BY). The use, distribution or reproduction in other forums is permitted, provided the original author(s) and the copyright owner(s) are credited and that the original publication in this journal is cited, in accordance with accepted academic practice. No use, distribution or reproduction is permitted which does not comply with these terms.
*Correspondence: Erika Fabbrizzi, ZXJpa2EuZmFiYnJpenppQGdtYWlsLmNvbQ==