 Katriina Juva
 Sascha Flögel
 Johannes Karstensen
 Peter Linke
 Wolf-Christian Dullo1
- 1Paleo-Oceanography, GEOMAR Helmholtz Centre for Ocean Research Kiel, Kiel, Germany
- 2Marine Geosystems, GEOMAR Helmholtz Centre for Ocean Research Kiel, Kiel, Germany
- 3Physical Oceanography, GEOMAR Helmholtz Centre for Ocean Research Kiel, Kiel, Germany
Cold-water coral (CWC) communities form complex benthic ecosystems in a distinct part of the water column. The exact processes supporting CWC reef growth and changes with time are still partly unsolved. Besides local hydrographic conditions, noticeable interactions of tidal flow with topography have been reported for CWC sites. Recent studies have suggested a tidally driven hydraulic control of flow over topographic features as a driver for local overturning at cold-water coral sites. This mechanism proposed a link between surface productivity and coral growth depths and is a driver of resuspension of the bottom material. Only few studies have concentrated on how these processes vary with the health status and structure of the cold-water coral occurrences. In this study, we explore the processes over tidal cycles by analyzing in situ stratification, hydrography and velocity data which we then combine with local topography from seven Desmophyllum pertusum (previously Lophelia pertusa) dominated eastern Atlantic CWC sites, from the Arctic to the southern hemisphere. The “quality” of CWC sites varies from thriving to declining and dead reefs. We show that living and healthy corals are concentrated at sites, where local hydrodynamics create overturning and mixing which overcomes on a daily basis gravitational particle sinking and thus re-supply food to filter-feeding corals. We find a very wide range of local hydrographic and biogeochemical conditions at the sites which suggests they play only a secondary role for CWC health.
Introduction
Cold-water coral (CWC) communities form complex ecosystems on topographic highs, on continental shelves and on the upper-slope of continental margin (Frederiksen et al., 1992). The reef-scale mechanisms driving their distribution and growth are yet not fully understood. One theory to explain CWC framework initiation and development is the so-called “environmental control theory” (Roberts et al., 2009), which assumes that the favorable environmental conditions control the distribution and growth of the CWCs. A variety of favorable conditions have been proposed based on the local hydrological and biogeochemical characterization (e.g., oxygen, carbon chemistry, nutrients, temperature, salinity, density and stratification) of the sites (Dodds et al., 2007; Davies et al., 2008; Dullo et al., 2008; Freiwald et al., 2009; White and Dorschel, 2010; Flögel et al., 2014b) as well as food supply, controlled by surface productivity (White et al., 2005; Duineveld et al., 2007). Other studies found CWC occurrence is linked to local topography-bottom flow interactions (Genin et al., 1986; Frederiksen et al., 1992; Mienis et al., 2007; Davies et al., 2009; Rüggeberg et al., 2011; Van Haren et al., 2014). Even though most of the thriving CWCs have been found within aforementioned “favorable” conditions it is interesting to note that some thrive in apparently “non-favorable” conditions when considering one specific parameter e.g., in waters with low pH (Georgian et al., 2016b; Baco et al., 2017; Gómez et al., 2018) or with reduced oxygen (< 1 ml l–1) (Hanz et al., 2019). It is assumed that CWC can cope with environmental stress caused by single parameter non-favorable conditions but require higher energetic effort to maintain their functioning (Diaz and Rosenberg, 1995; McCulloch et al., 2012; Sokolova et al., 2012). These sub-optimal sites are, however, found in areas with high primary production and it has been suggested that high quality food may compensate the extra necessary energy for CWCs to survive under environmental stress (Cohen and Holcomb, 2009; Georgian et al., 2016b; Hanz et al., 2019). The availability of food has been linked to the physiological performance [e.g., calcification and respiratory metabolism (Naumann et al., 2011; Larsson et al., 2013; Baussant et al., 2017)] and condition (fitness) of corals (Büscher et al., 2017). Other experimental studies have shown no feeding effects in low pH conditions (Maier et al., 2016; Büscher et al., 2017; Gómez et al., 2018) which suggests that CWC populations may prefer different optimal environmental ranges and that CWCs are able to recover from short-term stress, but exposure to long-term unfavorable conditions may increase coral mortality (Dodds et al., 2007; Lunden et al., 2014).
Most dominant reef-forming CWC species like Desmophyllum pertusum (previously Lophelia pertusa) (Addamo et al., 2016) and Madrepora oculata are filter feeders that can feed on a range of organic matter sources such as phytoplankton (Davies et al., 2009), zooplankton (Naumann et al., 2011) or a combination of both (Van Oevelen et al., 2009, 2018; Maier et al., 2019). The source of the food particles lies in near-surface primary productivity layers (Duineveld et al., 2004; Kiriakoulakis and Wolff, 2005; Cathalot et al., 2015) in zooplankton swimming depths or in bottom layers, where the usable carbon content in re-suspended material might be very low due to microbial activity in the benthic layer (Ritzrau et al., 1997; Davies et al., 2009). Laboratory experiments by Orejas et al. (2016) and Purser et al. (2010) have shown efficient prey capture by corals at low flow rates (for zooplankton at flow rates < 2.5 cm s–1 and for phytoplankton < 7 cm s–1). This differs from in situ observations, where CWCs are associated with high flow speeds of > 20 cm s–1 (Mortensen et al., 2001; Thiem et al., 2006; White and Dorschel, 2010) and high tidal activity (Mienis et al., 2007, 2012, Davies et al., 2009, 2010). The highest polyp extension rate is seen when hydrographic conditions and flow velocities change due to e.g., tidal influences both in laboratory (Mortensen, 2001) and in situ experiments (Johanson et al., 2017). In the latter case, the highest polyp activity is seen a couple of hours after high tide (Johanson et al., 2017).
The hydrodynamics controlling food supply have got more attention during recent years. A link between primary productive surface and CWC depths can be formed by hydraulic control of stratified flow over topographic features such as mounds, sills, escarpments, canyons, etc. This kind of topographic feature generates disturbances in flow and water-column stratification (Soetaert et al., 2016). The processes include for example internal waves and local up- or downwelling (Pratt, 1986; Dewey et al., 2005; Jackson et al., 2012). The first sub-basin scale studies aiming to include the interaction between internal tides and topography in relation to the abundance of suspension- and filter-feeders were published in the early 1990s by Rice et al. (1990) and Farmer and Armi (1986). Today, the tidally driven hydraulic control of stratified flow over topographic features has been identified both with observations (White, 2007; Davies et al., 2009; Findlay et al., 2013; Cyr et al., 2016) and simulations (Mohn et al., 2014; Soetaert et al., 2016) as the major driver for oscillation of water mass interface that creates periodically varying living conditions and vertical mixing at CWC reefs.
The stratified flow is under hydraulic control when it is forced to transition from subcritical to supercritical flow (Armi, 1986; Findlay et al., 2013). This transition can be described by the dimensionless Froude number, Fr = U0/c0. It represents the ratio of the speed with which advection and wave propagation carry information of a disturbance throughout a system (Mayer and Fringer, 2017). Small (Large) Fr represents subcritical (supercritical) flow. When Fr becomes close to 1, the flow is under hydraulic control. Several Fr estimations have been used to estimate the hydraulic control of flow or the topographic blocking at CWC sites (Davies et al., 2009; Mohn et al., 2014; Cyr et al., 2016). The previous estimations have not, however, captured both the near-seafloor stratification or water mass boundaries (White and Dorschel, 2010; Hebbeln et al., 2014) and the oscillating nature of the bottom flow.
Previous studies that link hydrodynamics and CWC reef growth and distribution have focused on thriving CWC communities on high (> 100 m) CWC mounds on the Irish margin (Frederiksen et al., 1992; Davies et al., 2009; Mohn et al., 2014; Cyr et al., 2016). CWCs are found, however, globally from the tropics to the polar regions (Freiwald et al., 2017) and they grow on a variety of morphological structures. CWC occurrences vary from single colonies to large frameworks (Davies et al., 2017). Flögel et al. (2014b) have shown that this difference in quality of CWC sites is linked to distinct oceanographic and hydrographic settings. One aspect of this study is to investigate whether the hydraulic control is important for CWC sites in all qualities on basin scale or whether it is only characteristic for NE Atlantic thriving CWC reefs.
To better understand the impact of varying ocean dynamics on CWC habitats, we use high-resolution physical, biogeochemical, and ecosystem data from seven CWC sites on the eastern margin of the Atlantic, from the sub-arctic to the subtropical southern hemisphere (Figure 1). We use observations from a wide range of hydrographic and hydrodynamic settings. To distinguish between different health states of CWC sites, we employ a categorization following Flögel et al. (2014b). The chosen sites are dominated by the scleractinian reef-forming coral D. pertusum. Multi-variable lander studies have previously been used in single locations e.g., in the Gulf of Cadiz (Mienis et al., 2012), Bay of Biscay (Dullo et al., 2018) and coastal Scotland (Davies et al., 2009) but they have never been applied to an eastern Atlantic North-South transect.
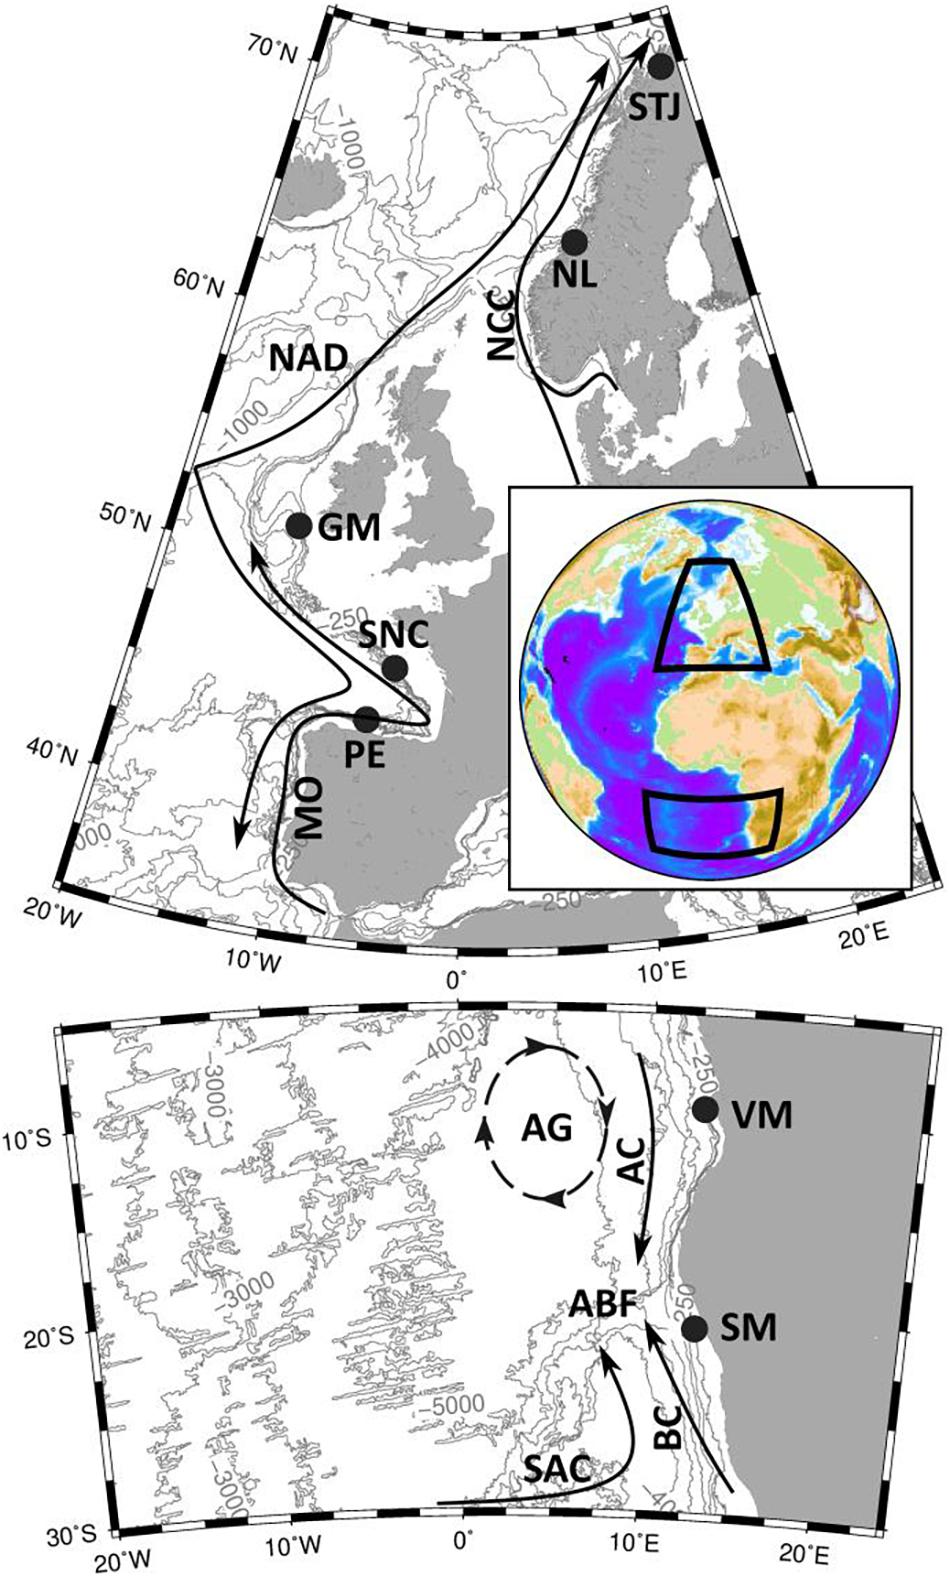
Figure 1. The study sites on the Eastern Atlantic continental margin with main currents. The 250 m, 500 m, 1000 m, 2000 m, 3000 m, 4000 m and 5000 m depth contours are shown based on the ETOPO-1 bathymetry grid. STJ, Stjernsund; NL, Nordleksa; GM, Galway Mound; SNC, St. Nazaire Canyon; PE, Pagés Escarpment; VM, Valentine Mound; SM, Sylvester Mound; NCC, Norwegian Coastal Current; NAD, North Atlantic Drift; MO, Mediterranean Overflow; AG, Angola Gyre; AC, Angola Current; SAC, South Atlantic Current; BC, Benguela Current; ABF, Angola-Benguela Front.
Regional Settings of the Sites
The seven studied CWC sites are located along the eastern Atlantic from the sub-arctic into the subtropical southern hemisphere within three areas: near-shore Norway (two sites), the western European Atlantic margin (three sites) and southwestern African margin (two sites) (Figure 1). These regions have characteristic water masses and ocean currents that set up the large scale boundary conditions for the CWC distribution and growth. The morphological structures vary from mounds and sills (four sites) to ridges and escarpments (three sites). In order to compare the effect of the distance from the living corals on hydrography and on flow, we add one subsite in the vicinity of a CWC sill on a sea-floor without corals as a reference site (Figure 2).
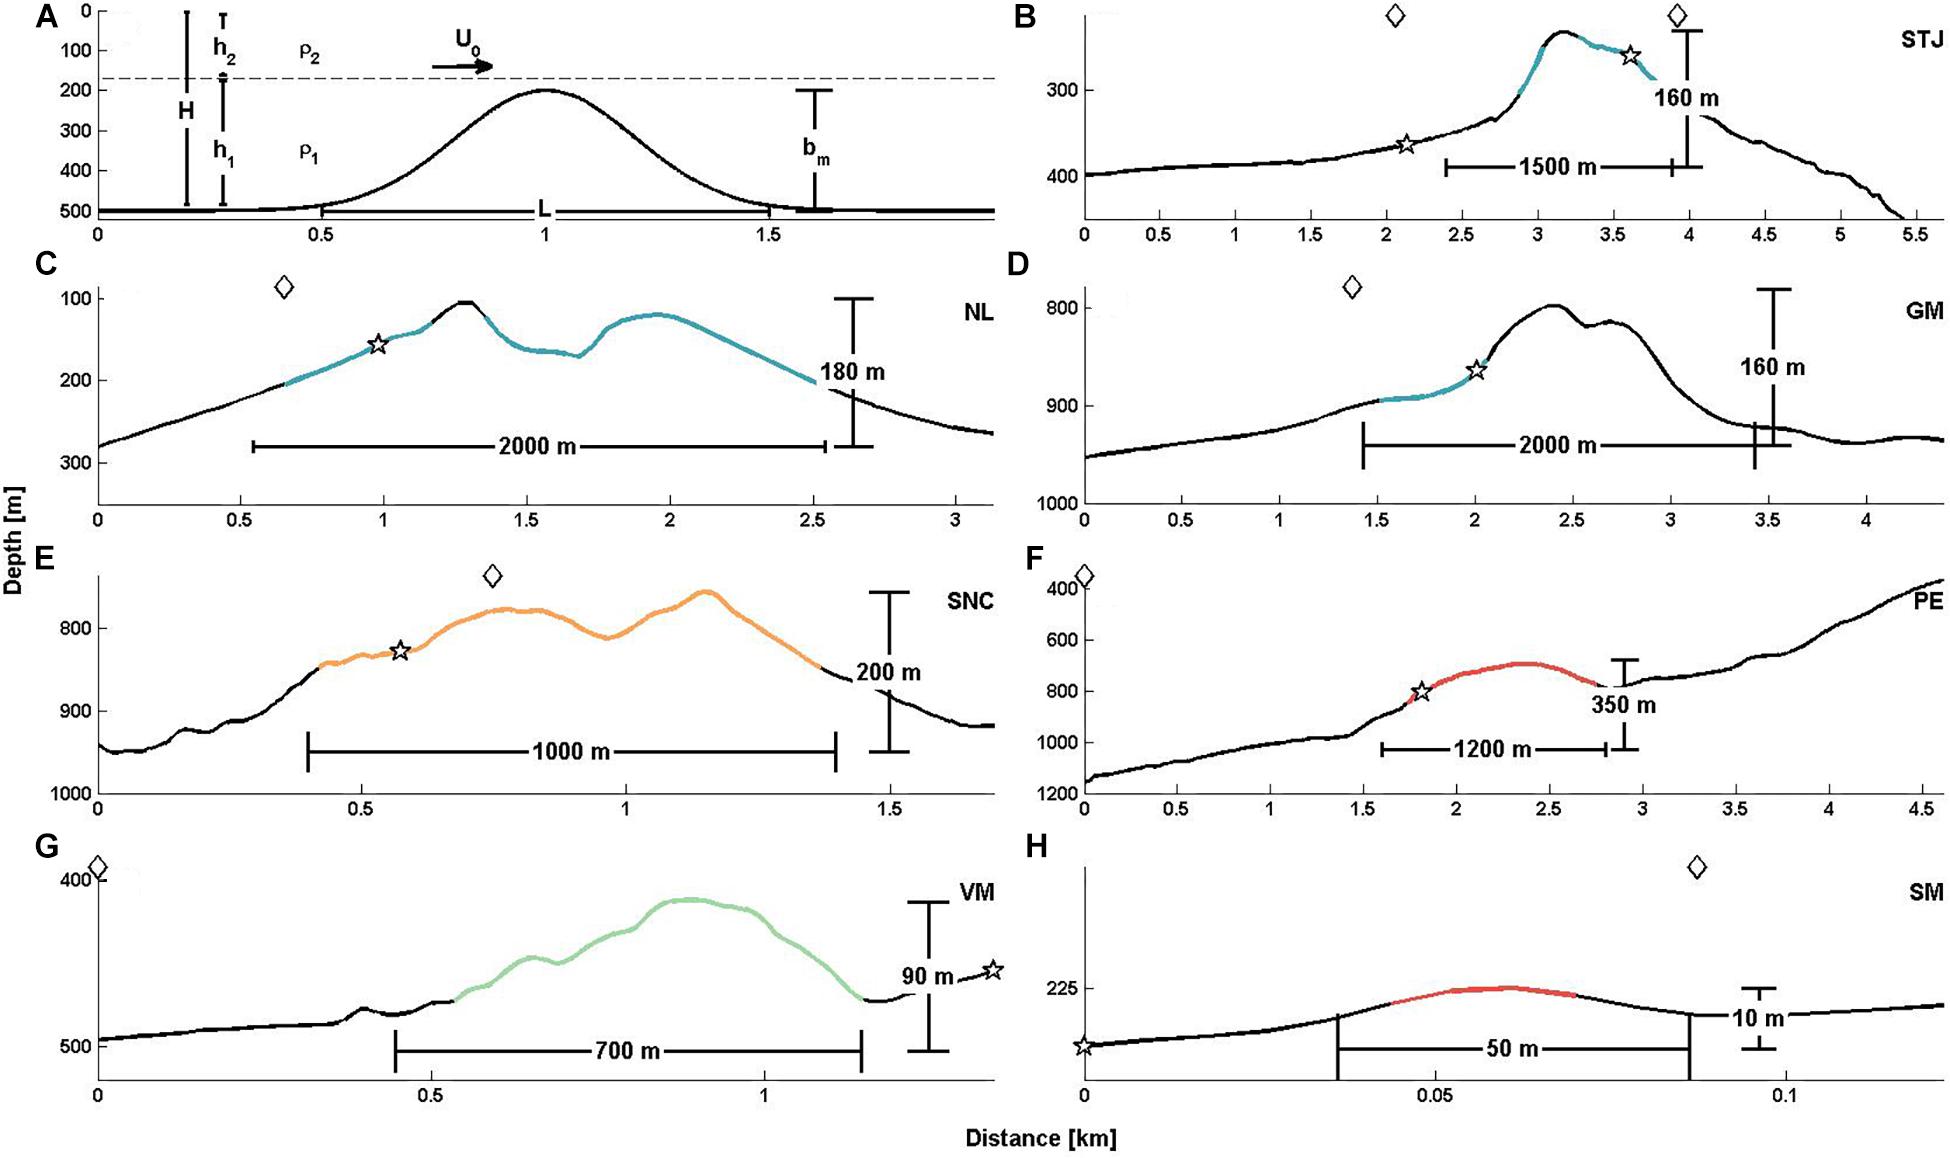
Figure 2. (A) Definition sketch. H, total water depth; h1, lower layer water depth; h2, upper layer water depth; ρ1, mean density of the lower layer; ρ2, mean density of the upper layer; U0, horizontal flow speed; L, the width of the topography; bm, the height of the topography. (B–H) The morphology of sites with CWC growth marked by CWC category representative color (blue: I, green: II, orange: III, red: IV). The deployed lander positions are indicated by stars. In STJ two landers (STJP on the left side and STJS on the right side of the sill) were deployed. Diamonds in the upper part of each panel indicate the individual CTD locations. STJ, Stjernsund; NL, Nordleksa; GM, Galway Mound; SNC, St. Nazaire Canyon; PE, Pagés Escarpment; VM, Valentine Mound; SM, Sylvester Mound. Topography for GM from Beyer et al. (2006), and for VM and SM from Tamborrino et al. (2019).
To distinguish the thriving and healthy CWC sites from declining and dead ones, we use a categorization based on ROV video and still-photo footage following Flögel et al. (2014b). The sites are classified into four categories based on the coral growth density and the vertical and horizontal dimensions of the CWC framework and coral growth. Category I represents the healthy CWC reefs and mounds with significant vertical (> 1 m) and horizontal (> 100 m2) CWC growth dimensions. The living colonies dominate (> 2/3 of coverage) over the dead ones and the colonies have several living generations. In the case of CWC mounds, the coral framework can be up to several 100s meters high. Three of the studied sites belong to this category (Table 1). Smaller but healthy CWC sites belong to category II (Table 1), where corals have patchier growth pattern with colonies of some square meters and limited vertical elevation. One of the studied sites belongs to this category. Category III sites (Table 1) are dominated by dead CWC framework with only small and isolated living CWC colonies. One of the sites belongs to this category. Two of our sites do not have any living CWCs but only dead CWCs and coral rubble, and thus belong to category IV (Table 1).
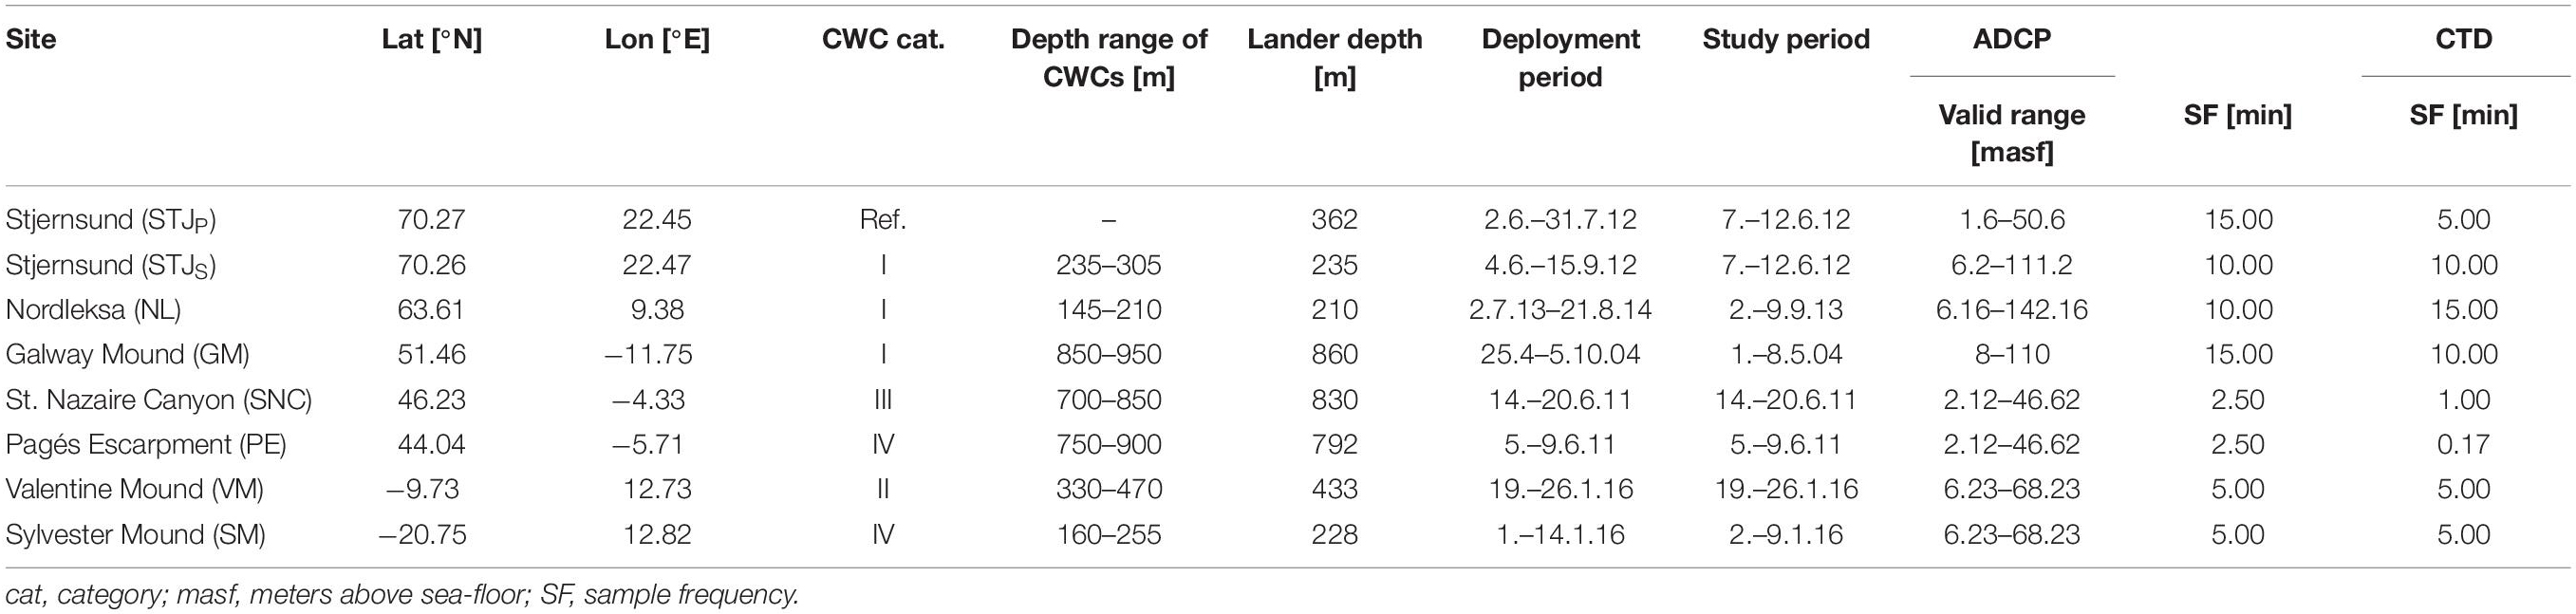
Table 1. The sites used in this study and the deployment details; name of the site, lander coordinates, site category, reported depth range of CWC presence, lander deployment depth, deployment and study periods, measurement details for lander ADCP and CTD.
Hydrography of the Sites
CWC reefs are usually found below the surface waters at intermediate water depths (200–1000 m), but the absolute growth depth of CWCs can vary between 40 and 3000 meters (Freiwald and Roberts, 2005). Therefore, we concentrate here on those water masses that are relevant to CWCs and ocean currents linked to them (Emery, 2003).
The waters off Norway are characterized by the Norwegian Coastal Water (NCW), which is a mixture of saline Atlantic Water (AW) carried to the area via the North Atlantic Drift (NAD) and fresh water input from rivers, the North Sea runoff and the Baltic Sea. NCW is dominant water mass in the northward flowing Norwegian Coastal Current (NCC). The cold, fresh, and oxygen-rich seasonal Winter Mode Water (WMW) forms during the winter and is usually present in between the surface waters and the NCW from spring to autumn (Sætre and Ljøen, 1971; Mork, 1981).
The water masses along the western European Atlantic margin are predominantly of North Atlantic and Mediterranean origin (Pollard et al., 1996). Below the surface waters, the uppermost water mass is the Eastern North Atlantic Central Water (ENACW) flowing southwards along the coast (Pingree and Le Cann, 1989). The lower part of the ENACW is laterally influenced by the Eastern Atlantic Subarctic Intermediate Water (EASIW) indicated by a salinity minimum. Below, salinity increases and oxygen levels drop due to the influence of Mediterranean Outflow Water (MOW). Mediterranean Outflow (MO) flows from the Mediterranean as a contour current (Pingree and Le Cann, 1989; Daniault et al., 1994; Iorga and Lozier, 1999) to the Bay of Biscay toward the north. The deepest water mass below the MOW is the southward flowing North Atlantic Deep Water (NADW).
The southwestern African coast is an eastern boundary upwelling system where upwelling is driven by coastal parallel winds. Upwelling takes place from Cape Agulhas (∼34°S) to the Angola Benguela Frontal Zone (∼15°S) (Hutchings et al., 2009). The upwelled waters in the south and further off-shore are dominated by Eastern South Atlantic Central Water (ESACW). It is mixture of water masses formed in the South Atlantic, namely the South Atlantic Central Water (SACW, Gordon, 1981; Mittelstaedt, 1991; Poole and Tomczak, 1999) and thermocline water that originate from the Indian Ocean and enters the South Atlantic by Agulhas Current intrusions around the South Cape of Africa (Poole and Tomczak, 1999; Mohrholz et al., 2008). The water mass further to the north and more coastal is the low saline, oxygen depleted and nutrient rich Angola Gyre subtype of the SACW. This subtype of the SACW originates in the subtropical Angola Gyre and enters the Namibian margin via the Angola Current (Duncombe Rae, 2005; Mohrholz et al., 2008). The intermediate and deep water masses of the region are the northward flowing cool and fresh Antarctic Intermediate Water (AAIW, Stramma and Schott, 1999) and the NADW beneath it.
Topography of the Sites
The northernmost site is located in the Stjernsund in northern Norway. This WNW–ESE oriented sound connects the open North Atlantic with the Altafjord. The main geomorphologic formation within the sound is an asymmetric morainic sill, which hosts one of the northernmost D. pertusum reefs (STJ, 70.02°N, 22.02°E, Figures 2B, 3A). The crest depths of the sill vary between 203 m and 236 m. Thriving CWC colonies (category I) cover the sill on the WNW slope between 235 m and 305 m water depths and on the ESE slope between 245 m and 280 m. Living corals have colony thicknesses of 2–8 m on average. The horizontal extent of the CWC complex is up to one square kilometer (Rüggeberg et al., 2011).
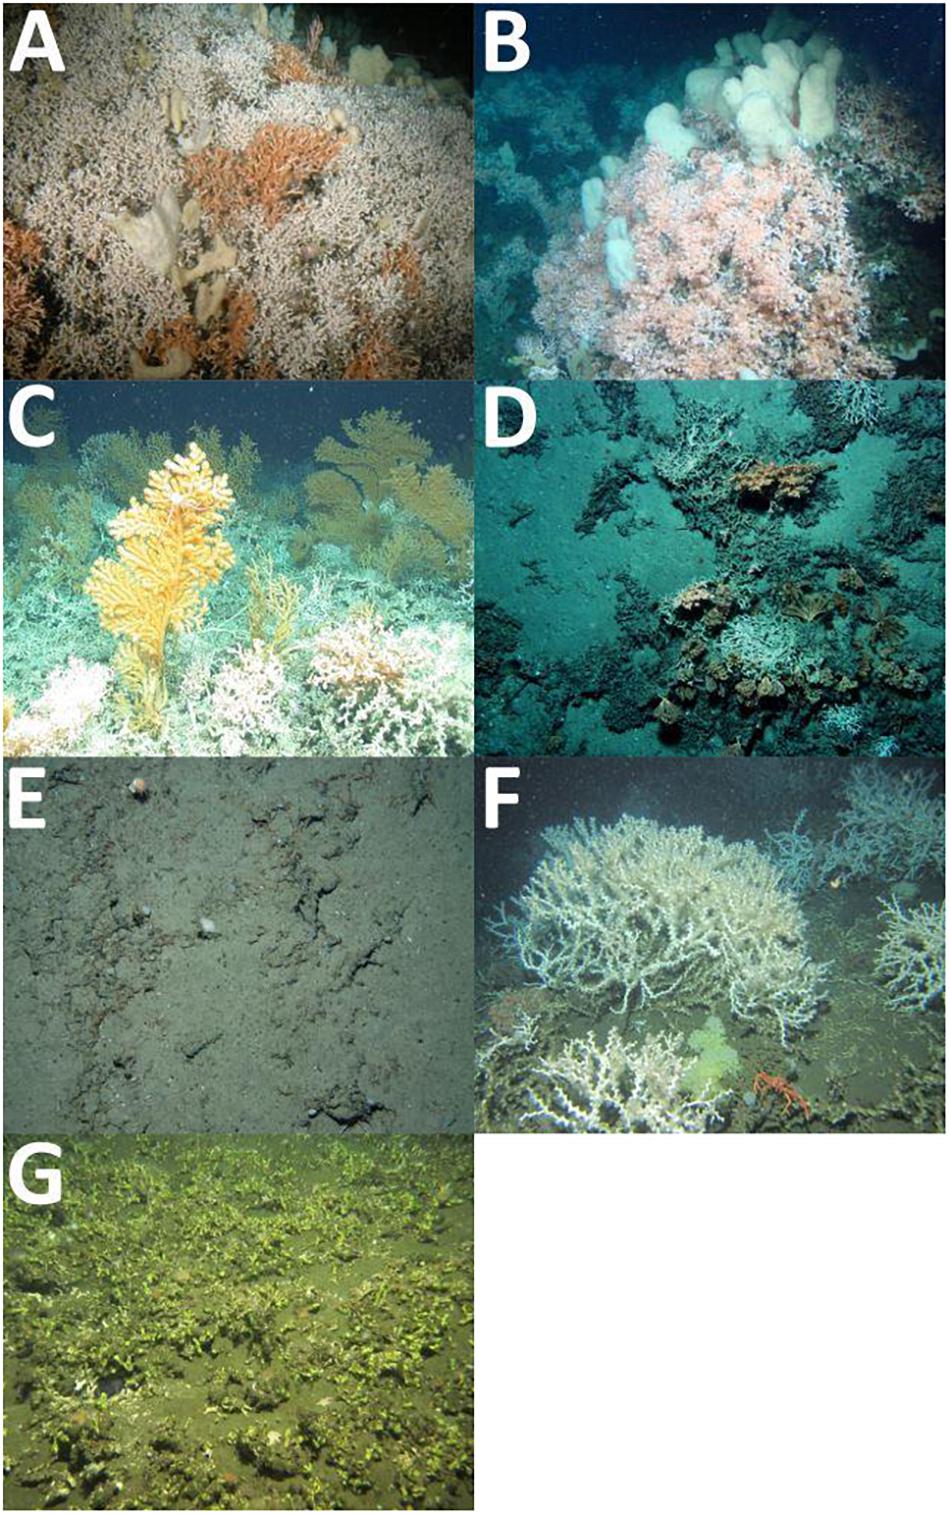
Figure 3. In situ photographs of CWC sites: (A) Stjernsund, dense living D. pertusum colonies with sponges (Freiwald and Dullo, 2014), (B) Nordleksa, living D. pertusum colonies with sponges (Form et al., 2015), (C) Galway Mound, dense CWC reef,© MARUM University of Bremen, (D) St. Nazaire Canyon, single coral colonies, (E) Pagés Escarpment, coral rubble, (F) Valentine Mounds, living D. pertusum colonies (mound top) with sponges © MARUM University of Bremen (2016), (G) Sylvester Mound, dead coral framework with dense colonization of yellow bryozoans, actiniarians and sponges © MARUM University of Bremen (2016).
Off central Norway, the category I CWC reef at Nordleksa (NL, 63.61°N, 9.38°E, Figures 2C, 3B) is located at the mouth of the Trondheimsfjord. CWCs are growing on a ridge-like formation with a steep N–NW slope. Its summit is at 125 m and base at 300 m water depth. The CWCs cover an area of about 1,700 m in W–E and about 600 m in N–S direction, with a saddle like depression between the two main reef tops. The living corals are found at depths between 145 and 210 m. The vertical dimension of the patches is > 1 m (Form et al., 2014, 2015).
Southwest from Ireland on the eastern slope of the Porcupine Sea Bight, Galway Mound (GM, 54.46°N, 11.75°W, Figures 2D, 3C) is part of the deep CWC mound chain of the Belgica Mound Province (De Mol et al., 2007; Wheeler et al., 2007). The mound is approximately 1 km wide and 2 km long, nearly symmetrical in NNE–SSW direction with the longest axis perpendicular to the dip of the slope (De Mol et al., 2002). Galway Mound has its summit at 790 m and its base at 950 m water depth. Thriving CWC colonies (category I) cover the southern flank of the mound densely from 850 m to 950 m water depth (Dorschel et al., 2007).
In the northern Bay of Biscay, the Armorican margin is characterized by a broad shelf with a steep slope. It is characterized by numerous spurs and canyons among which the St. Nazaire Canyon (SNC, 46.23°N, 4.33°W, Figures 2E, 3D) is a prominent one. This almost N–S oriented canyon has W–E oriented spurs. Living scleractinian colonies (category III) are mostly found on ridges within a depth range of 700–850 m. They are isolated and few in number compared to the dead CWCs. Not far distal from the crest of the ridges the corals are already covered by sediments. The studied ridge is on the eastern side of the canyon, SW–NE oriented approximately 3 km long and 0.5 km wide. It rises approximately 200 m above its surroundings (Flögel et al., 2014a).
In the southern Bay of Biscay, west of the Le Danois Bank on the Cantabrian Margin, the Pagés Escarpment (PE, 44.04°N, 5.71°W, Figures 2F, 3G) rises steeply from 2000 m to 260 m (Dullo et al., 2018). The northern summit is at 680 m and base is at 1030 m while the southern escarpment rises to 260 m and has its base is at 750 m water depth. Only D. pertusum rubble (category IV) is found in water depths of 714–865 m. Anthropogenic impact is significant in this area (Flögel et al., 2014a).
On the Angolan margin, healthy CWC reefs dominated by D. pertusum are found on the top of mounds at water depths between 330 m and 470 m whereas single colonies are found 250–500 m water depth. The studied mound (VM, 9.73°S, 12.73°E, Figures 2G, 3F) is part of the Valentine Mounds cluster. It is SW–NE oriented and rises from 503 m to 413 m. Coral patches dominated by D. pertusum (category II) are found from the summit to 473 m water depth. The coral patches are 2–3 m wide and < 1 m high with living colony thickness < 0.3 m. Additionally, individual colonies are found from 473 m depth down to the mound base (Hebbeln et al., 2017).
On the northern Namibian margin, the dead CWC mounds are part of a larger geomorphologic setting dominated by a NNW–SSE stretching escarpment. Mounds have a rather circular shape and their heights increase from the south to the north (Hebbeln et al., 2017). Sylvester Mound (SM, 20.75°S, 12.82°E, Figures 2G, 3F) is part of the CWC mound cluster west of the escarpment. Mounds occur at a narrow water depth interval ranging from 219 to 246 m and they are 3–12 m high. Only D. pertusum coral rubble (category IV) is covering this 10 m high mound (Hebbeln et al., 2017).
Materials and Methods
Data used in this study have been collected on nine cruises with RV Meteor (M) and RV Poseidon (POS) over the years 2004–2016. Data are from eight different locations at seven sites (Figures 1–3 and Table 2).
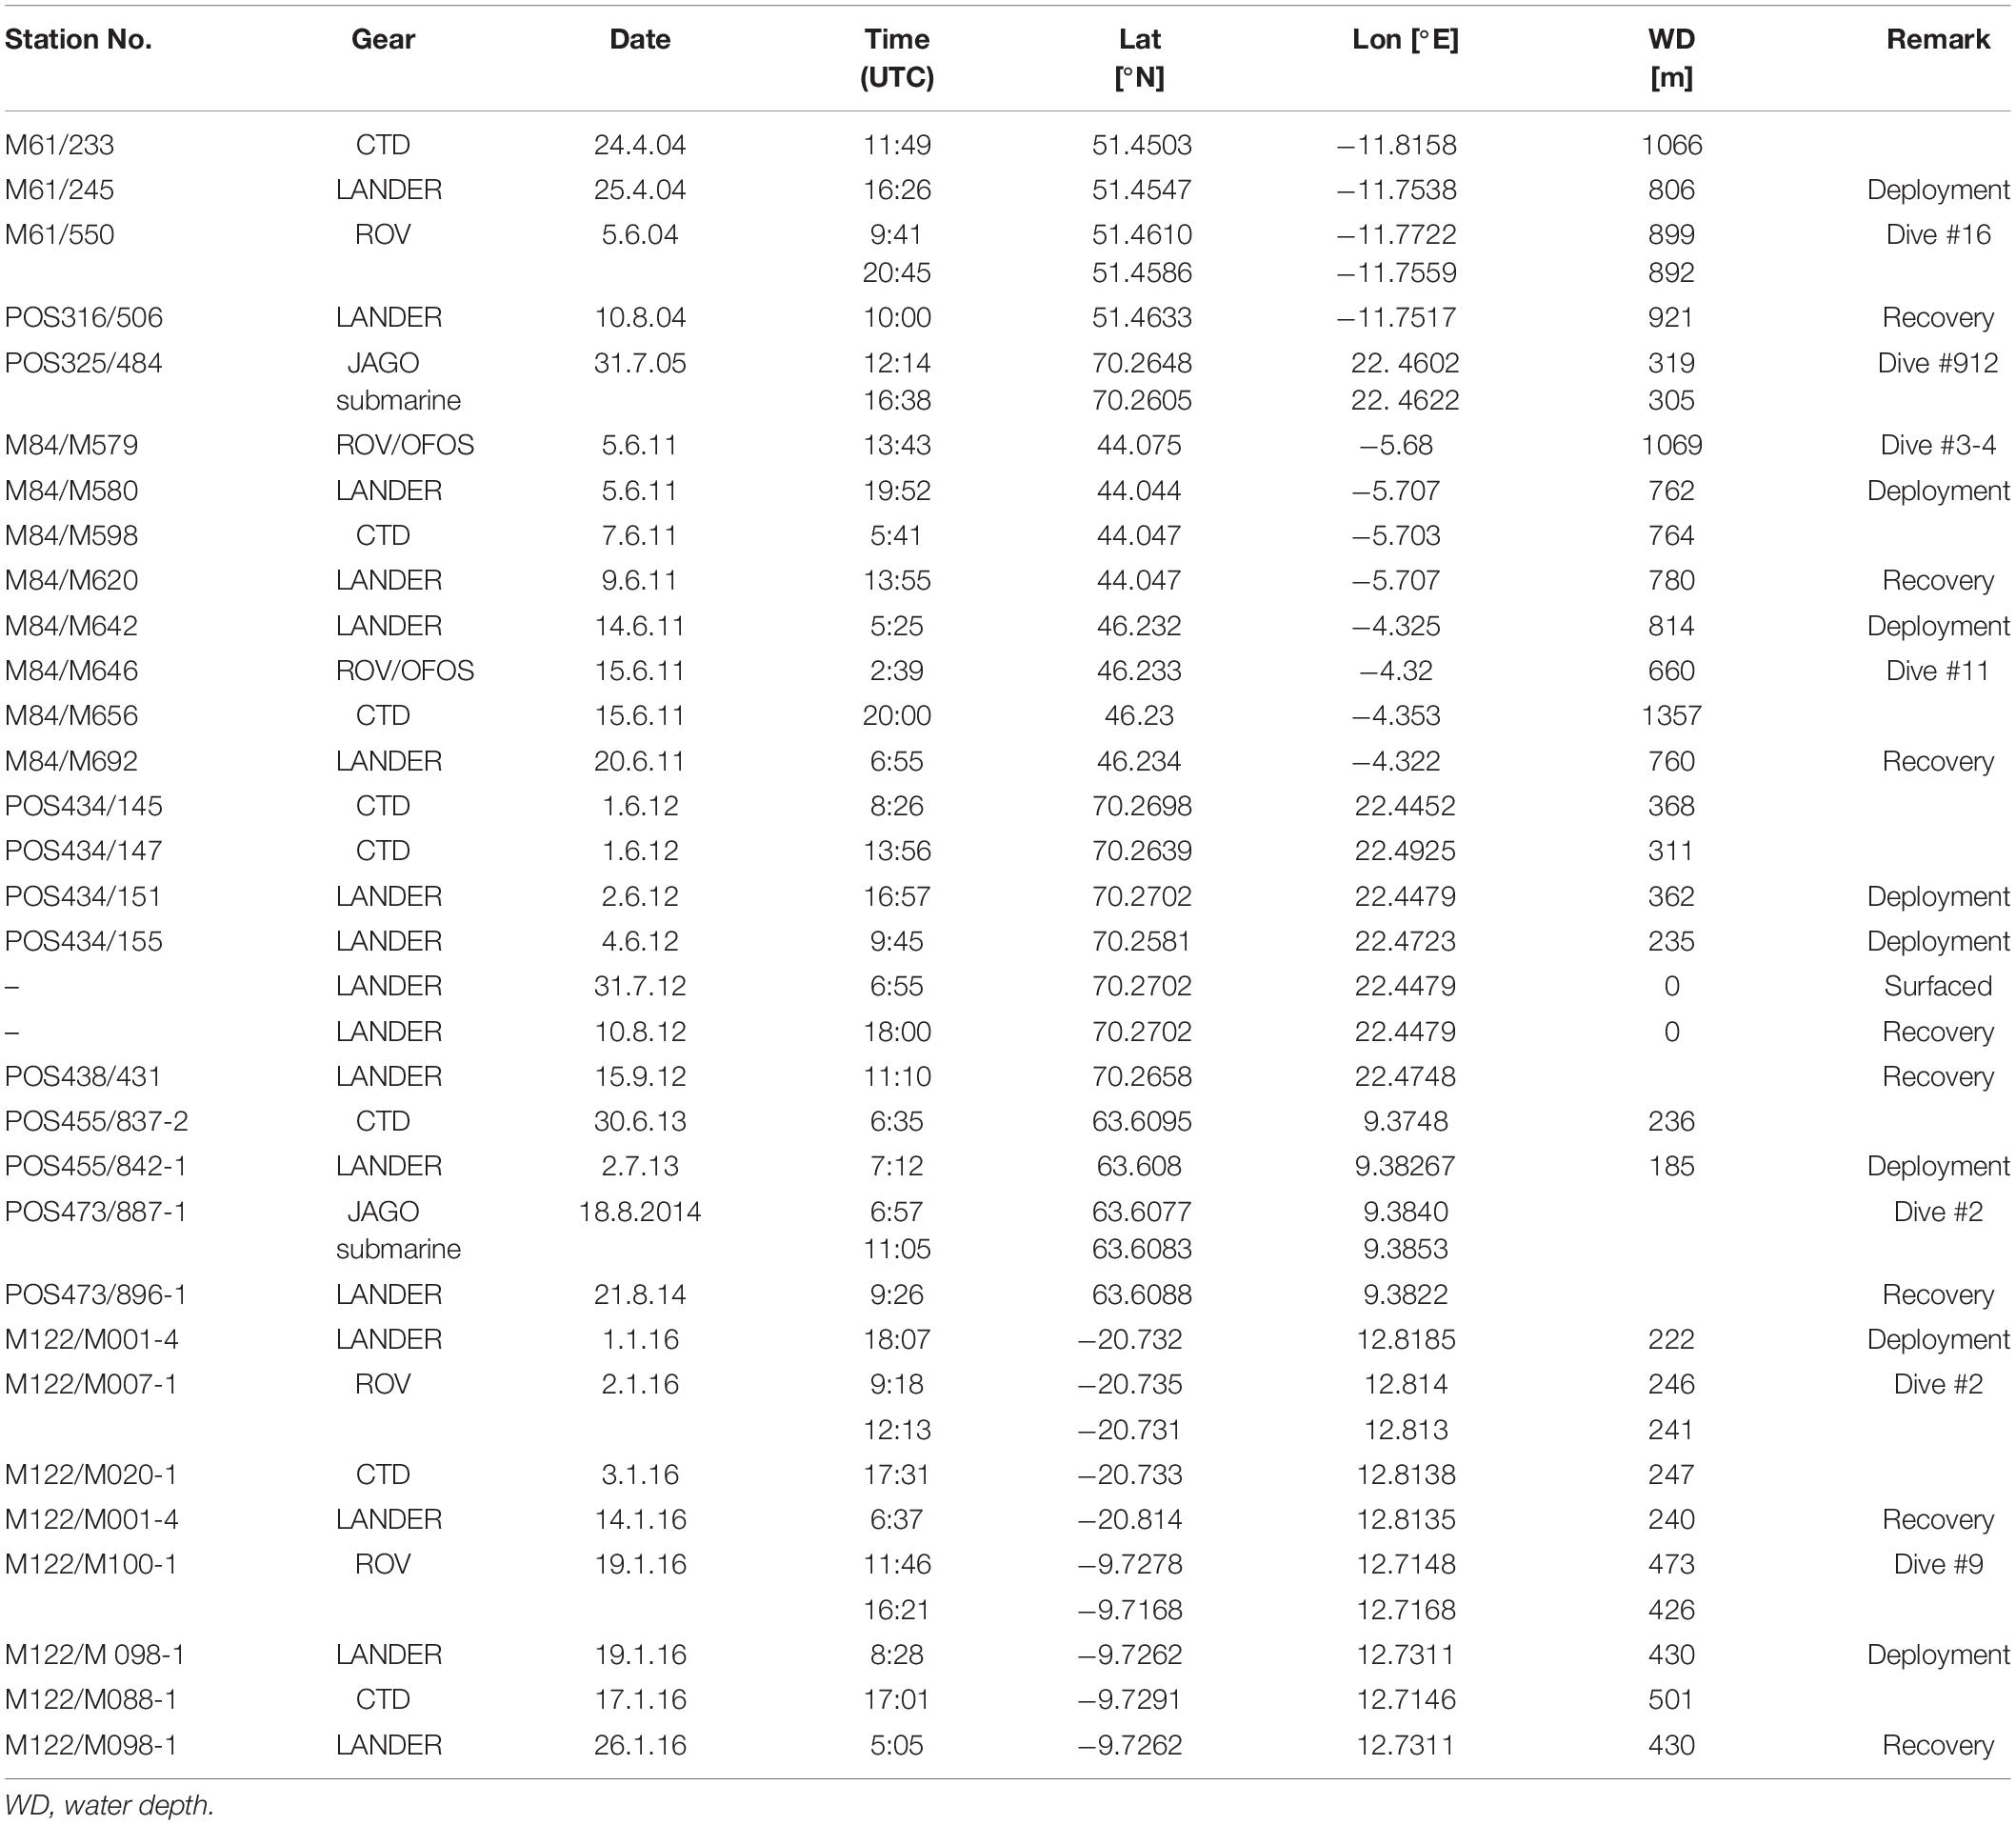
Table 2. Metadata for CTD casts, ROV and submarine dives and lander deployments.
Sampling
The main instrumentation used were sea-floor monitoring lander systems instrumented with physical and biogeochemical sensors (Table 1). During deployment and recovery of these bottom landers, local water column temperature, salinity, oxygen as well as local topography were surveyed with the ship (Table 2). Accuracy and sensitivity of the ship-borne instruments are shown in Table 3. The temporal variability at the sites was recorded with instrumentation mounted on bottom landers (Tables 1, 2). Upward looking Acoustic Doppler Current Profiler (ADCP, Table 3) recorded currents from about 2 to 120 m above the sea floor, with common range for all deployments of from 8 to 35 m above the sea floor (Table 3). The additional biogeochemical sensors varied from deployment to deployment. Therefore, only the data derived from the ADCP and CTD measurements is included in this study.
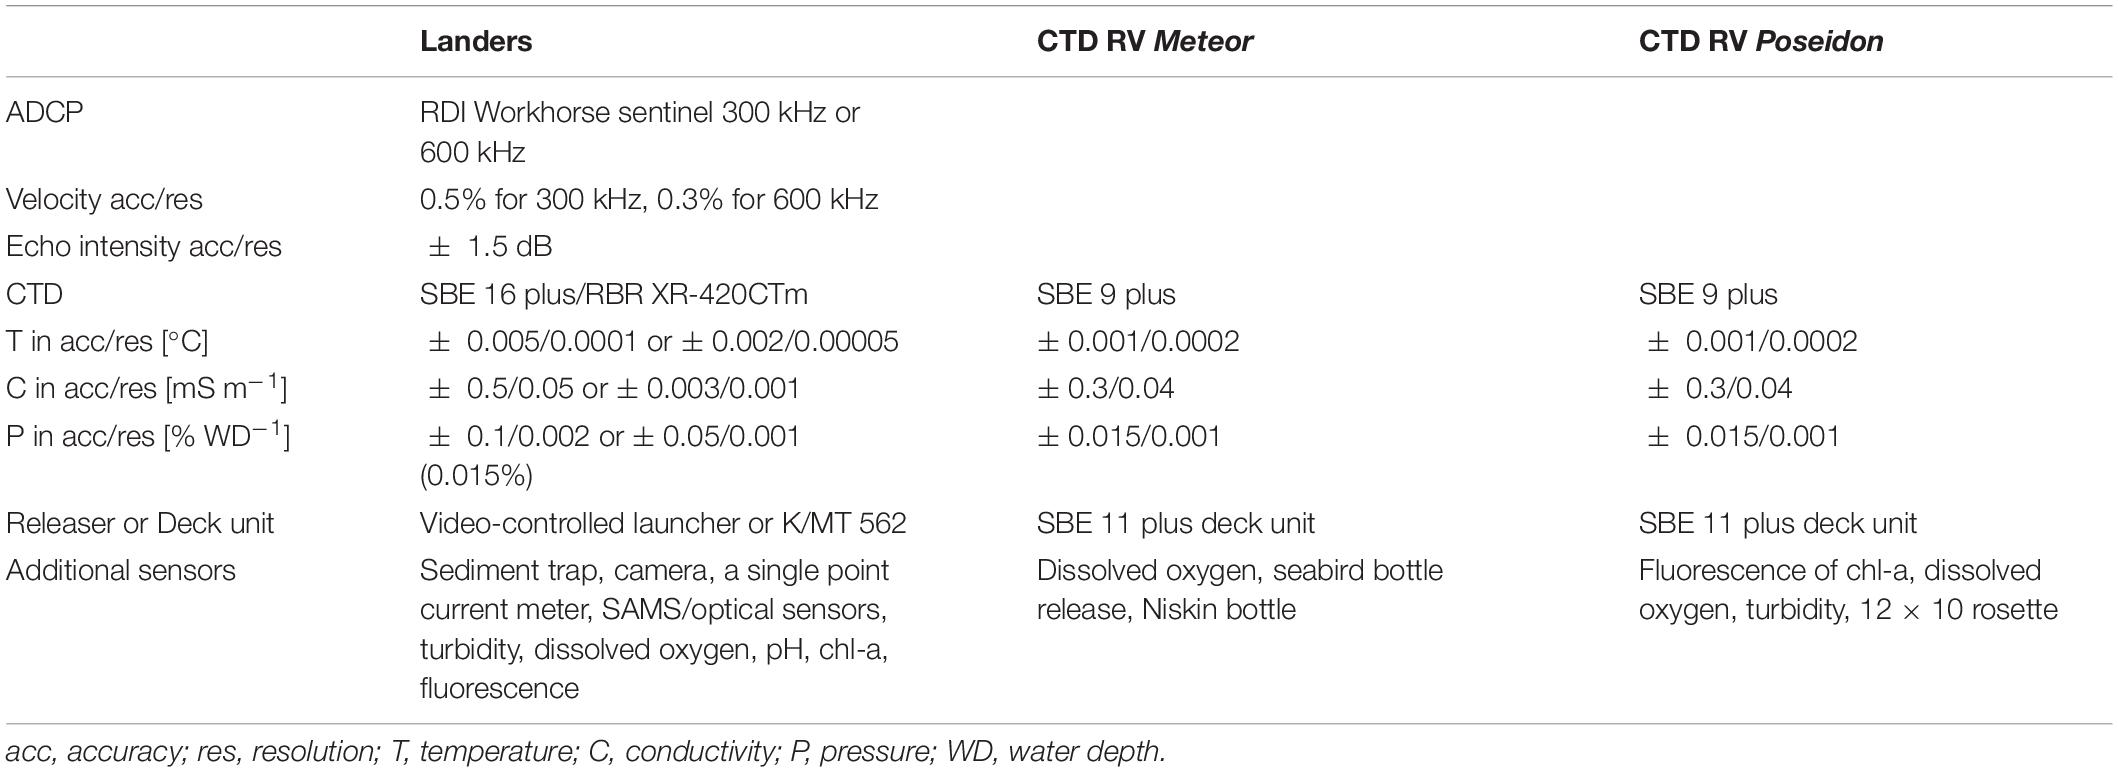
Table 3. Instrumentation details and metadata for landers and onboard CTDs.
Cruises and Deployments
The sites of near-shore Norway are in the Stjernsund (subsites STJS and STJP) and at Nordleksa (NL). At the STJ, two subsites were studied: STJS on the top of the sill, where one lander was deployed at 234 m water depth and STJP on the NW slope of the sill as a non-coral reference site at 362 m water depth (Figure 2B). Landers were deployed from the spring to the end of the summer 2012 [cruises POS434 (Pfannkuche, 2012a) and POS438 (Pfannkuche, 2012b)]. At NL, a lander was deployed on the reef saddle at 175 m water depth. During the deployment, from summer 2013 to summer 2014 [cruises POS455 (Form et al., 2014) and POS473 (Form et al., 2015)], the lander moved horizontally 100–200 m due to strong currents. The data used in this study were taken from an interval of 87 days when the lander was stable at 210 m water depth (Figure 2C).
The three sites on the western European Atlantic margin are Galway Mound (GM), St. Nazaire Canyon (SNC) and the Pagés Escarpment (PE). At GM, the lander was deployed at 804 m water depth (Figure 2D) from the spring to the autumn 2004 [cruises M61 (Pfannkuche et al., 2004) and POS316 (Pfannkuche and Utecht, 2005)]. In the Bay of Biscay, data at sites SNC and PE were collected during June 2011 during cruise M84-5 (Flögel et al., 2014a). At SNC the lander was deployed on a ridge at 806 m water depth for 5 days (Figure 2E) and at PE on the northern side of the escarpment at 776 m water depth for 3.5 days (Figure 2F).
The two sites off the southwestern African coast are the Valentine Mounds (VM) off Angola and the Sylvester Mound (SM) off Namibia (Hanz et al., 2019). They were studied during January 2016 during a cruise M122 (Hebbeln et al., 2017). The lander was deployed west from VM at 430 m water depth for 7 days (Figure 2G) and at the southeastern base of SM at 222 m water depth for 14 days (Figure 2H).
Data Preparation
For subsequent data analysis, the raw CTD and ADCP data were converted. CTD data were converted to absolute salinity (SA), conservative temperature (Θ), potential density (ρ) and potential density anomaly (σΘ) i.e., sigma-theta values (McDougall and Barker, 2011). The current measurements were corrected for the local magnetic declination based on IGRF-11 model data (Finlay et al., 2010). The echo intensity was converted to mean volume backscatter (Sv) (Deines, 1999). This is used as an indicator for the abundance of particles in the water column. The horizontal velocity components (eastward, ue, and northward, un) were rotated using variance ellipses (Lilly, 2017). Accordingly, the mean direction velocity components (um) are in the direction of the most energetic fluctuations while components perpendicular are interpreted as a cross flow (uc). The vertical velocity component, uw, was not altered.
Since the deployment periods varied from 3.5 days to up to more than 1 year, we used 1 week time series where possible and the whole deployment period, where deployment times were shorter than 1 week. The study period of all deployments is sufficient to capture short-term variability such as semi-diurnal internal tides, but we are aware of possible effects of different lengths of the datasets.
Data Analysis
The mean conditions around the CWCs are described with the time-averaged mean values and standard deviation (SD) of hydrography and flow time series. For analysis, a 1-h running mean is used to remove higher frequency spikes and outliers (Lilly, 2017).
The site-characteristic dominant tidal frequencies, ω, and their amplitudes, a, were analyzed with the harmonic analysis toolbox T_Tide (Pawlowicz et al., 2002). The tidal signals for barotropic and baroclinic tidal signals were analyzed by using bottom pressure and horizontal velocity fields at 8 (u8) and 35 (u35) meters above the sea-floor (masf). Only tidal signals with signal-to-noise ratio (snr) > 2 are considered significant.
The effect of near-bottom mean direction velocity (um,8) on hydrography and correlation between flow components was estimated using zero-normalized cross-correlation (ZNCC) analysis. For analysis, the signals were first de-trended, the signal mean was subtracted and the signal was divided by its standard deviation. Since the sampling interval between the flow and hydrography measurements vary, those time series were interpolated to 10-min sample intervals for the analysis. ZNCC measures the Pearson correlation coefficient, R, between two time series with time delay (τ). When signals are positively (negatively) correlated, the ZNCC function maximum (minimum) indicates the τ where signals are best aligned. With positive (negative) τ the primary variable is leading (lagging from) the secondary variable. The strong and symmetric periodicity of the ZNCC function implies that processes are regular throughout the time series. We used ZNCC with a maximum time lag of 24 h to compare the influence of the mean direction velocity at 8 masf (um,8) on bottom density (σΘ), vertical velocity at 8 masf (uw,8), and mean direction velocity at 35 masf (um,35). Only significant (p < 0.001) correlations are presented.
Finally, for hydraulic control estimations we consider the flow around the CWCs to be hydrostatic two-layer flow introduced by Baines and Johnson (2016) with uniform velocity over topographic features. We also take into account the time-varying and stratified nature of the flow (Marshall et al., 1997; Dewey et al., 2005). The topographic effects for this flow can be described in terms of the two-layer Froude number, Fr, topography height ratio, Hm, the layer thickness ratio, r, non-hydrostatic parameter, ε, and excursion number, Ex, where
where U is the horizontal flow speed, c0 is the speed of long waves in two-layer fluid at rest, ρ1 and ρ2 denote the lower and upper layer densities, Δρ = ρ1-ρ2, g is gravity, h1 and h2 are the lower and upper layer thicknesses, H = h1 + h2 is the total water depth, bm is the height of the morphologic structure, L is the horizontal length scale i.e., the width of the morphologic structure, N = (∂ρg/(ρ∂z))1/2 is the buoyancy frequency used to represent the water column stratification and ω is the oscillating (tidal) frequency. A definition sketch is given in Figure 2A. The Fr–Hm diagram shows parameter ranges where the stratified flow is subcritical or supercritical over the topography, and where the flow is blocked or partially blocked by the morphologic structure (Figure 4; Baines, 1998, 2015; Baines and Johnson, 2016). If the morphologic structure blocks the flow partially and the lower layer is thinner than the upper layer (r < 0.5), hydrostatic flow generates a hydraulic jump. The motion can be considered hydrostatic or quasi-steady, if Ex ≫ 1 (Dewey et al., 2005), and ε ≪ 1 (Marshall et al., 1997). Under these conditions, the advective timescale is larger than the tidal time scale so that the flow experiences the total height of the morphologic structure (Ex ≫ 1) during the tidal cycle but it is smaller than the buoyancy period (ε ≪ 1) so that the non-hydrostatic effects can be neglected. The interaction between the flow and topography should be quasi-steady so that flow disturbances have time to grow and develop.
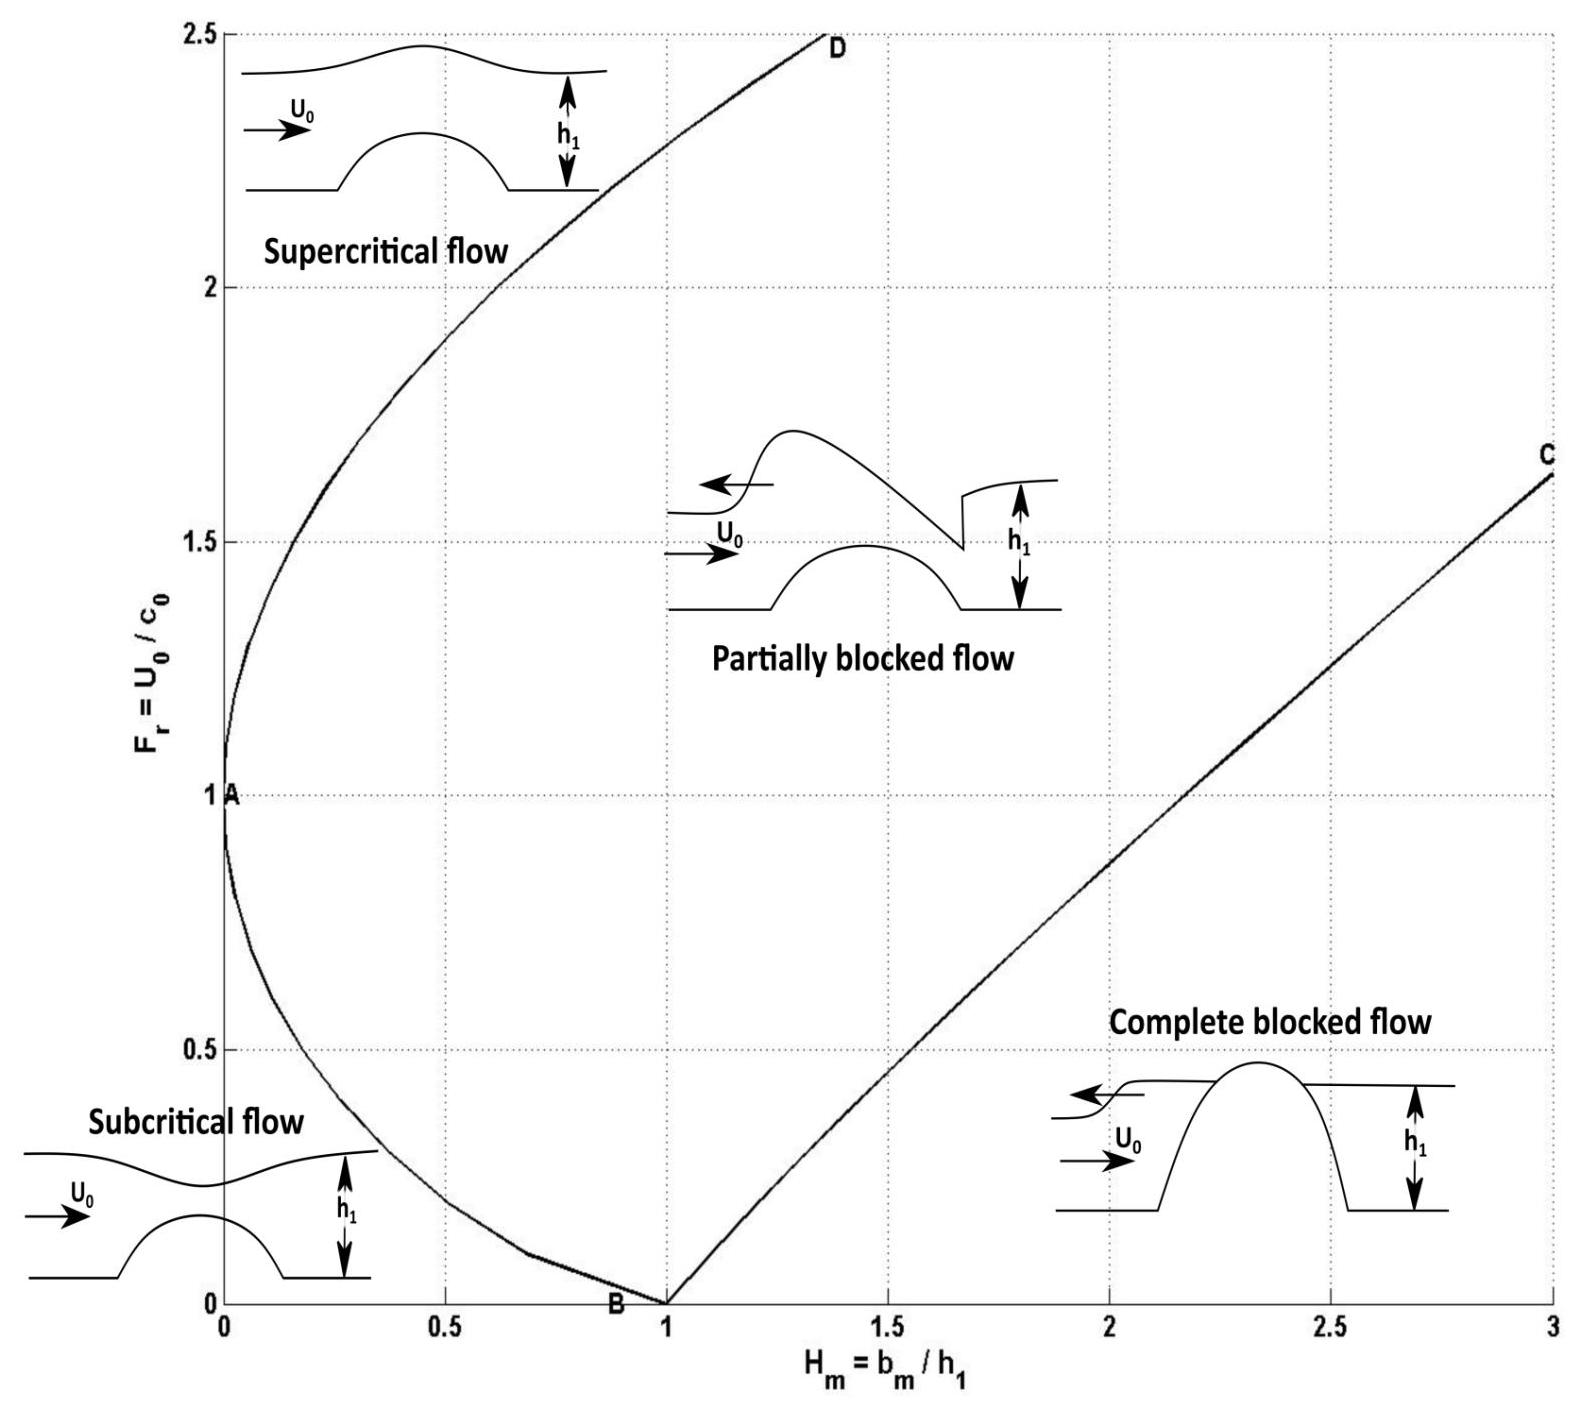
Figure 4. Regime diagram for hydrostatic two-layer flow over a topography near Boussinesq limit (ρ1/ρ2 ≈ 0.99). U0 is the mean horizontal flow speed, h1 the initial lower layer thickness and c0 the internal wave speed. In the region DABC the flow is partially blocked, with an upstream hydraulic jump controlled by a critical condition at the obstacle crest. Above AD, the flow is supercritical, below AB subcritical and right from BC blocked. Modified after (Baines, 1998).
For the site specific Hm, we can determine lower limit for Fr and hence flow velocity U (when c0 is assumed constant) for partially blocked conditions, Ucr = Fr(Hm) × c0. The development of a significant hydraulic jump requires that the flow supports partially blocked conditions for a period comparable to tcr > L/(2 × Ucr) (Dewey et al., 2005). The vertical displacement scale i.e., the maximum vertical movement of the isopycnals, Δh, is controlled by stratification, flow, the height of the morphologic structure and time and length scales. If the time scale is large (Ex ≫ 1), and the height of the topography (bm > U/N) or the depth of the fluid (H – bm > U/N) do not affect the motion, the vertical displacement is Δh = Umean/N (Legg and Klymak, 2008).
Results
Water Column Structure
The CTD casts allow the identification of the regional water masses and their boundaries. The water masses are characterized by their temperature (Θ), salinity (SA) and oxygen (O2) values (Figure 5), and their boundaries are found at the stratification (N) maxima (Figure 6). The boundary between water layers h1 and h2 is taken at the stratification maximum closest to the summit of the morphologic structure. We include the water column from the surface to the base of the morphologic structure.
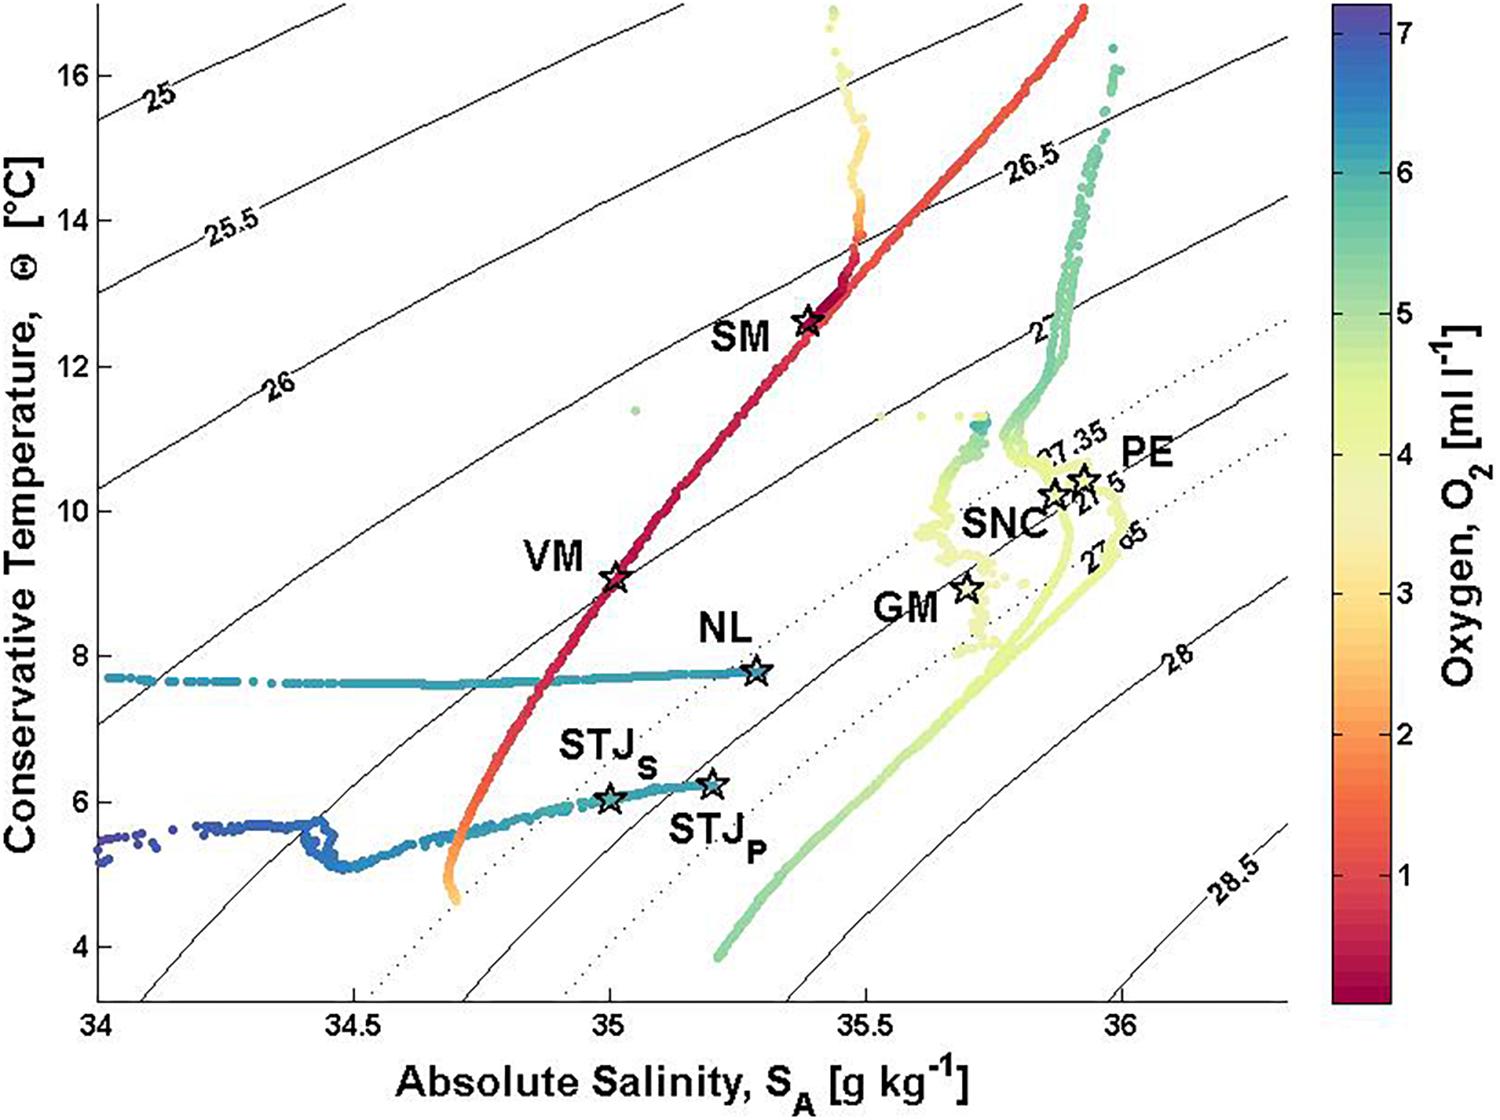
Figure 5. Water column ΘSA-O2 plot. The sigma-theta range of 27.35–27.65 kg m– 3 from Dullo et al. (2008) marked with dotted lines. The lander positions relative to water columns are marked with stars. STJS, Stjernsund CWCs; STJP, Stjernsund reference; NL, Nordleksa; GM, Galway Mound; SNC, St. Nazaire Canyon; PE, Pagés Escarpment; VM, Valentine Mound; SM, Sylvester Mound.
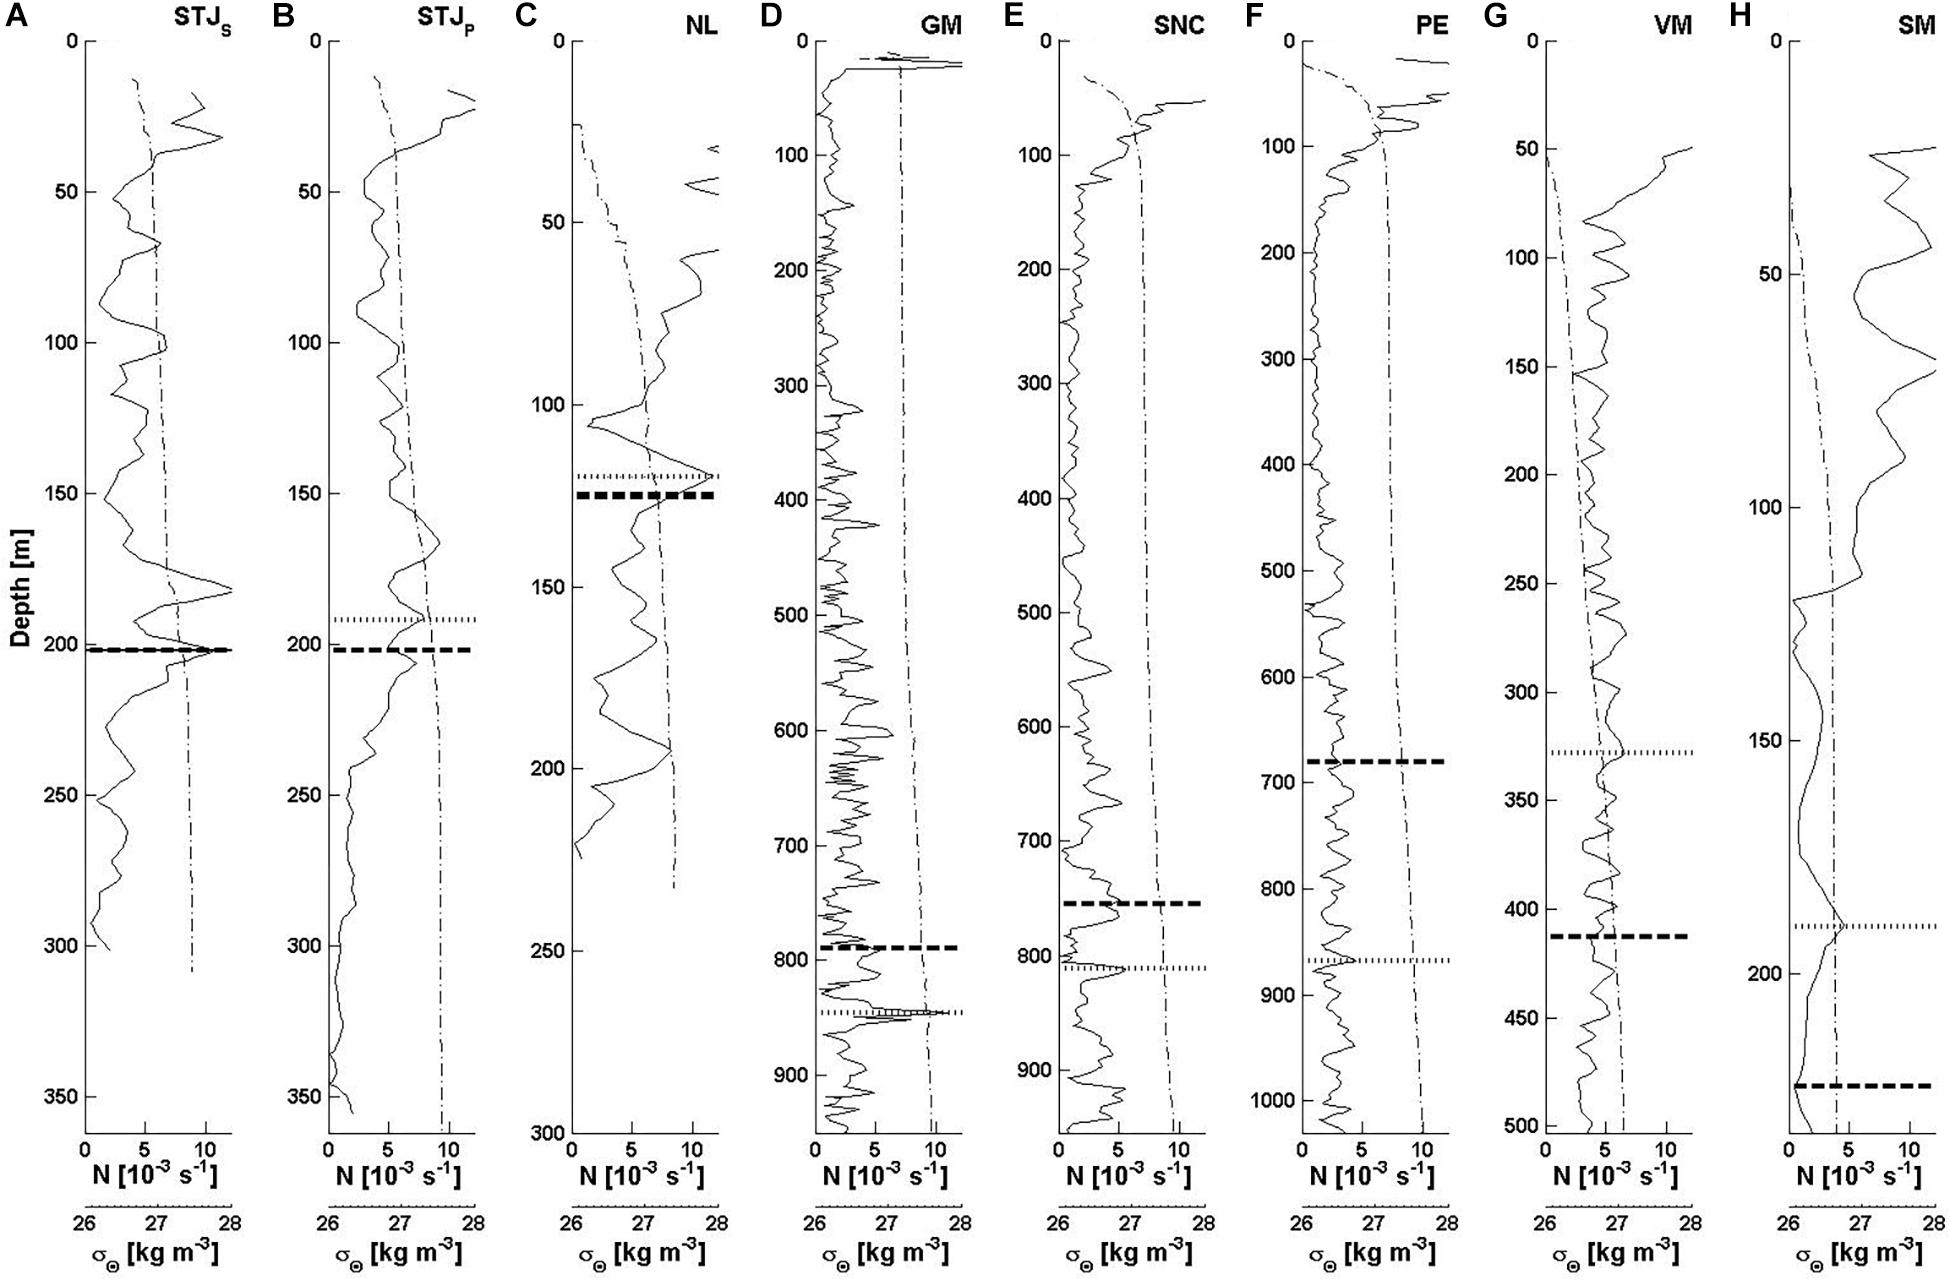
Figure 6. Water column stratification, N (solid thin line), and sigma-theta, σΘ (dash-dot thin line), for (A) STJS, Stjernsund CWCs; (B) STJP, Stjernsund reference; (C) NL, Nordleksa; (D) GM, Galway Mound; (E) SNC, St. Nazaire Canyon; (F) PE, Pagés Escarpment; (G) VM, Valentine Mound; and (H) SM, Sylvester Mound. The deep layer stratification maximum (dotted thick line) and summit depth of the morphologic structure (dashed thick line) show the depths (h1, h2 and bm) used in the analysis. At STJS only one line is shows, because the stratification maximum and the summit depth coincide. Note that the scale of the y-axis varies from the surface to the base depth of the morphologic structure. The displayed ranges are N = 0–12 × 10–3 s–1 and σΘ = 26–28 kg m–3.
At both Norwegian sites, waters are well stratified, cold and oxygen-rich. The seasonal temperature minimum, WMW, is measurable below the surface layer. At site STJ, the WMW is located within the NCW at depths between 100 and 150 m (Θ < 5.2°C) and at NL above the NCW at depths 40–120 m (Θ < 7.6°C). At both sites, the NCW occupies most of the water column and the influence of AW is only seen near the bottom with SA > 35 g kg–1 (Figure 5). The CWCs are found in well oxygenated waters (O2;CWC = 6.11–6.21 ml l–1). At NL, the mean stratification is stronger (N = 7.7 × 10⁻³s–1) than at STJ (STJP: N = 4.1 × 10⁻³s–1 and STJS: N = 4.3 × 10⁻³s–1). Below the surface layer, the stratification maximum is at the boundary between the WMW and the NCW (STJS: h2 = 202 m, STJP: h2 = 192 m, NL: h2 = 120 m) (Figures 6A–C).
On the western European Atlantic margin, waters are relatively saline and weakly stratified. The ENACW is found below the surface layer to around 400–550 m, where the salinity minimum (GM: 35.61 g kg–1, SNC: 35.79 g kg–1 and PE: 35.77 g kg–1) indicates the presence of the EASIW. The salinity maxima and oxygen minima below the EASIW (GM: SA = 35.59 g kg–1, O2 = 3.68 ml l–1, SNC: SA = 35.73 g kg–1, O2 = 4.15 ml l–1 and PE: SA = 35.84 g kg–1, O2 = 3.92 ml l–1) show the presence of the MOW. The cold, fresh and oxygen-rich NADW occupies the waters below the MOW (Θ < 8°C, SA < 35.5 g kg–1 and O2 > 4.5 ml l–1) (Figure 5). Oxygen concentrations at the depth range of CWCs are lower than at the near-shore Norway (O2;CWC = 3.81–4.24 ml l–1). The mean stratification is weak (N ≈ 2.5 × 10⁻³s–1). The deep-layer stratification maximum is found at the boundary between the EASIW and the MOW (GM: h2 = 846 m, SNC: h2 = 812 m, PE: h2 = 868 m). It is strongest at GM followed by SNC and PE (Figures 6D–F).
At sites VM and SM, waters are warm and oxygen-depleted. Below the warm and saline surface waters lies the SACW where oxygen drops to minimum (O2 < 1 ml l–1). At site SM, the SACW occupies the remaining water column. At VM, the presence of the AAIW is seen below 580 m with oxygen increase to levels O2 > 1 ml l–1 and temperature drop to Θ < 7°C (Figure 5). The oxygen levels at the depth of CWC occurrence are hypoxic (VM: O2;CWC = 0.52 ml l–1 and SM: O2;CWC = 0.10 ml l–1). The water columns are well stratified (VM: N = 5.2 × 10⁻³s–1 and SM: N = 5.6 × 10⁻³s–1). The maximum stratification around mounds at VM and at SM is found at 328 m and 190 m water depths, respectively (Figures 6G,H).
Lander Measurements
The near-seafloor hydrography (Θ, SA and σΘ, Figures 7A,B) and flow velocity measurements (Figures 7C,D) give the mean conditions and short term variations for the respective coral sites. The velocity regimes are shown for 8 masf and 35 masf (Figures 7C,D).
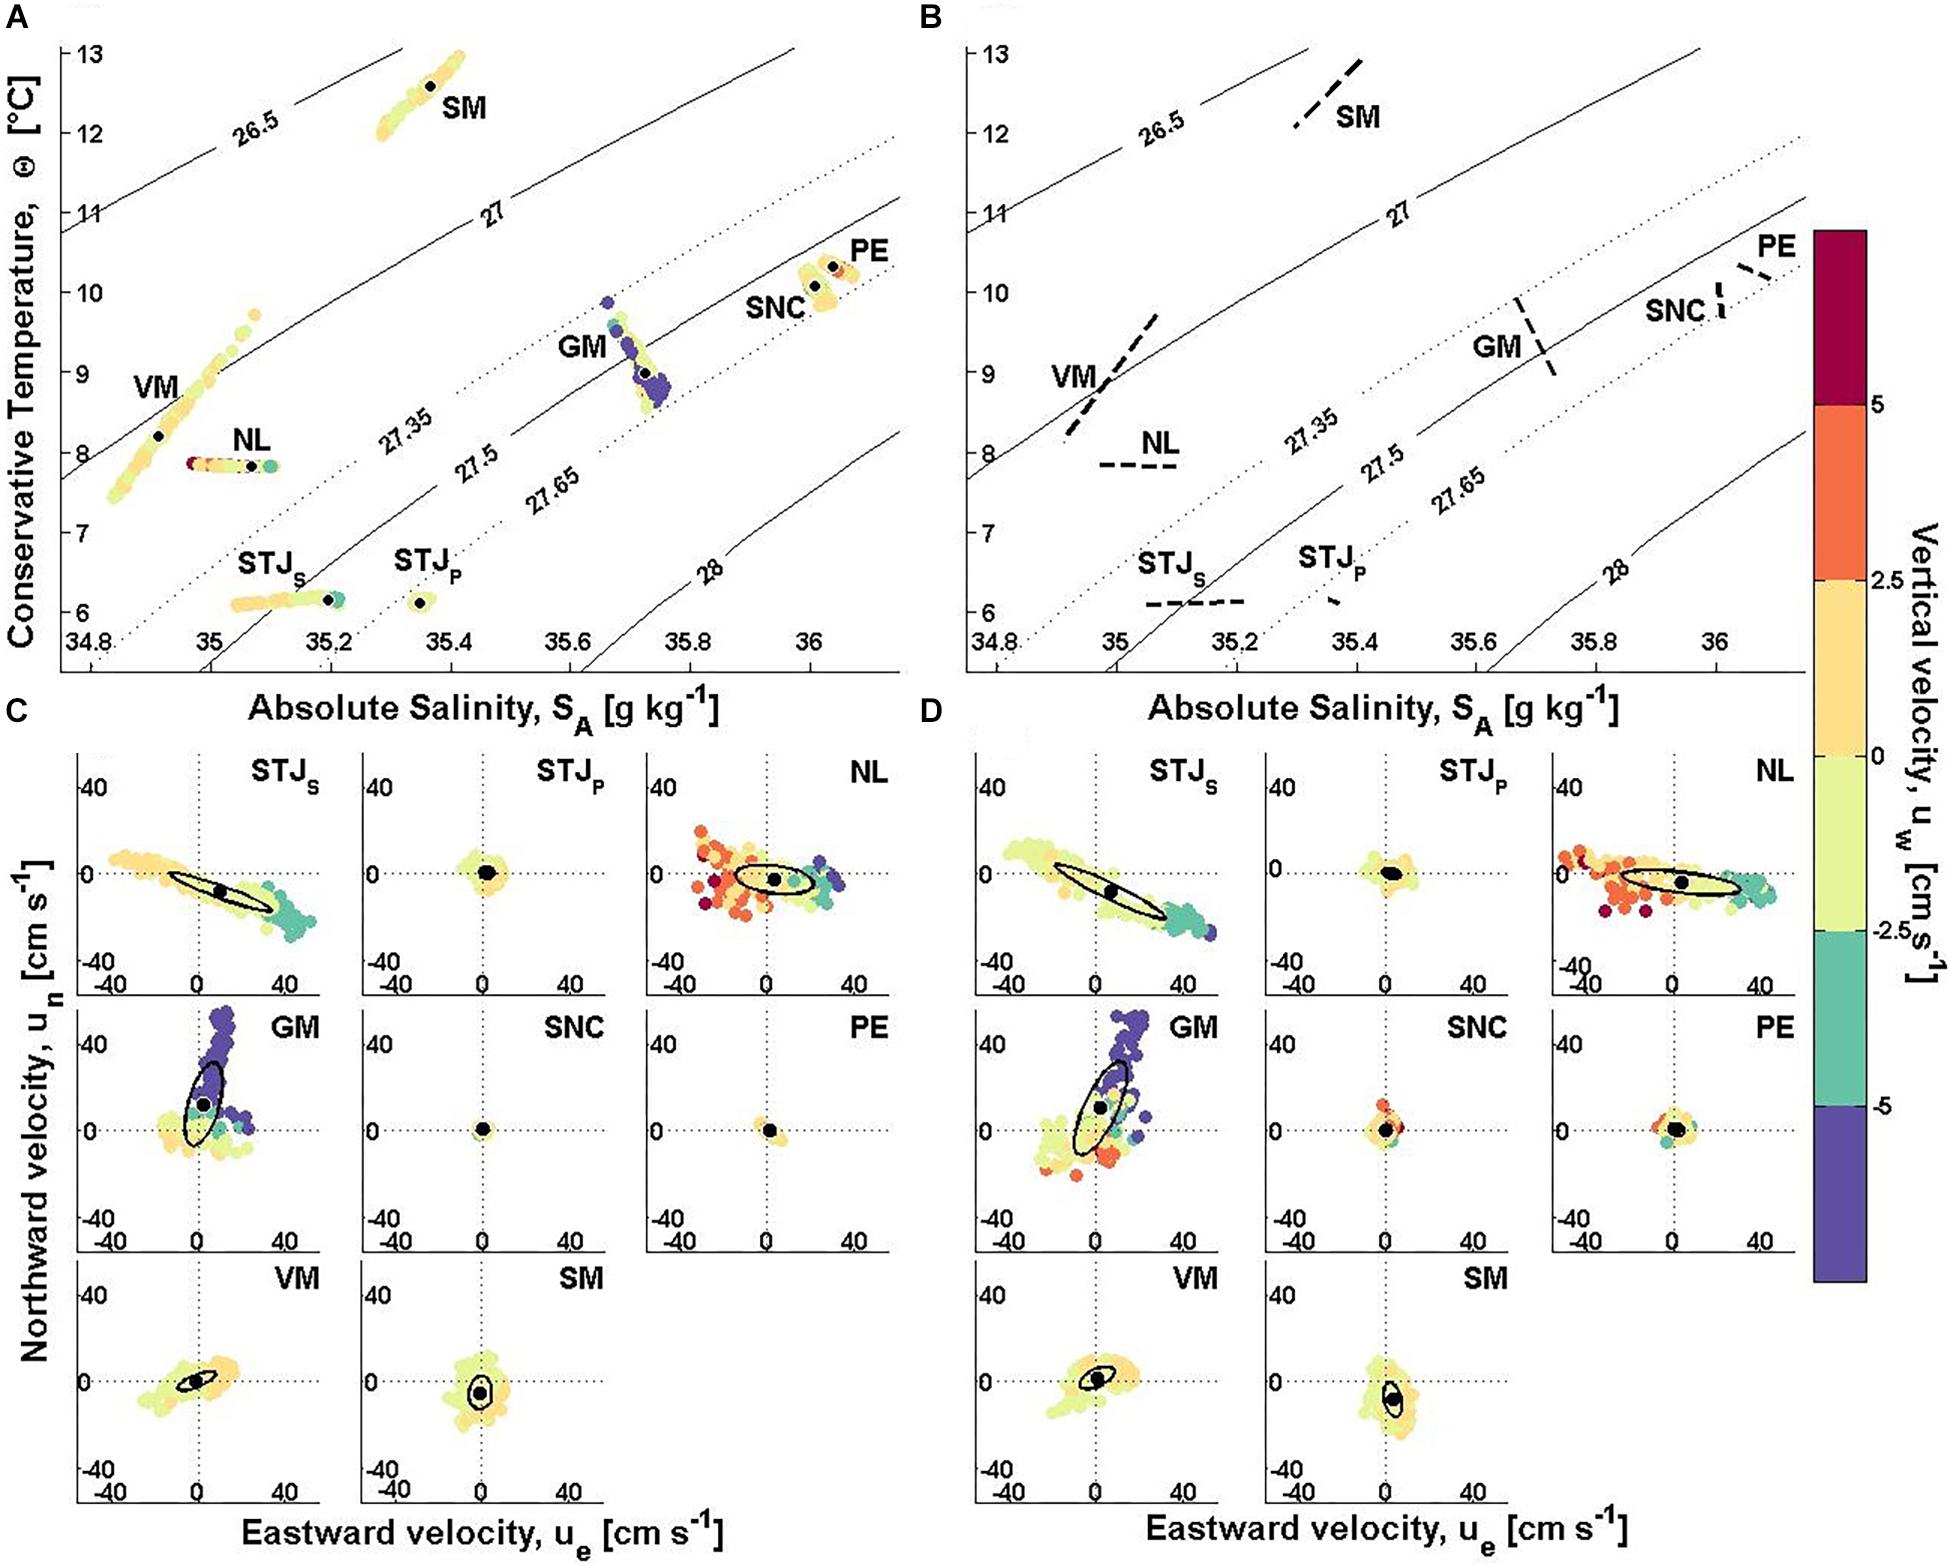
Figure 7. Hydrographic and velocity data from lander deployments. (A) ΘSA-uw plot (negative values upward). The mean Θ, SA–values are marked with black dots. (B) The maximum density change within one tidal cycle (back dashed lines). The sigma-theta range 27.35–27.65 kg m–3 from Dullo et al. (2008) marked with dotted lines in panel (A,B). Horizontal velocity from 8 masf (C) and 35 masf (D) with variance ellipses (black ellipse) and mean velocity (black dot). Color scale shows the vertical velocity as in panel (A). Axis scale is ± 50 cm s–1 in panel (C,D). STJS, Stjernsund CWCs; STJP, Stjernsund reference; NL, Nordleksa; GM, Galway Mound; SNC, St. Nazaire Canyon; PE, Pagés Escarpment; VM, Valentine Mound; SM, Sylvester Mound.
Hydrography
The mean bottom water temperature, Θ, varies between 6.10°C and 12.58°C. Water is cool (Θ < 8.5°C) at near-shore Norway (sites STJP, STJS and NL) and at VM, in between (8.5 and 10.5°C) at GM, SNC and PE and warm at SM (Θ > 10.5°C). The variations in temperature are small (SDΘ < 0.05°C) at near-shore Norway and at PE in comparison to other sites where temperature variations are up to tenfold as large (SDΘ = 0.1–0.5°C). The mean bottom salinity, SA, ranges between 34.91 g kg–1 and 36.04 g kg–1. Water is relatively fresh (SA < 35.1 g kg–1) at NL and VM, and saline (SA > 35.7 g kg–1) on the western European Atlantic margin (sites GM, SNC and PE). The salinity variations are small (SDSA < 0.02 g kg–1) at STJP, GM, SNC and PE compared to the other sites (SDSA > 0.035 g kg–1). The mean sigma-theta, σΘ, varies from 26.63 kg m–3 to 27.68 kg m–3. Water is less dense (σΘ < 27.25 kg m–3) at NL, VM and SM, compared to the other sites (σΘ > 27.55 kg m–3). The variations in density are small at STJP and PE (SDσΘ < 0.017 kg m–3), in between (SDσΘ = 0.023–0.047) at STJS, NL, VM, SM and SNC, and large at GM (SDσΘ = 0.058 kg m–3).
Flow Characteristics
The time-averaged horizontal flow speed, Umean, varies between 1.6–26.1 cm s–1 and 3.2–27.5 cm s–1 at 8 masf and 35 masf, respectively. Flow speeds are weak (Umean < 5.5 cm s–1) at STJP,8,35, SNC8,35 and PE8,35, in between (Umean = 8–12 cm s–1) at VM8,35 and SM8,35 and strong (Umean > 18 cm s–1) at STJS,8,35, NL8,35 and GM8,35. The peak horizontal flow speed, Umax, varies between 5.6–61.2 cm s–1 and 12.4–72.9 cm s–1 at 8 masf and 35 masf, respectively. It is low (Umax < 14 cm s–1) at STJP,8,35, SNC8,35 and PE8,35, medium (Umax = 20–40 cm s–1) at NL8, VM8,35 and SM8,35, and high (Umax > 55 cm s–1) at STJS,8,35, NL35 and GM8,35. The flow speed is suitable for feeding (< 7 cm s–1) < 10% of the time at STJS,8,35, NL8,35, 15–30% at GM8,35, SM8,35, around 40% at VM8,35 and > 50% at STJP,8,35, SNC8,35 and PE8,35.
The vertical velocity, uw, varies between −23.0–5.0 cm s–1 and –26.5–9.2 cm s–1 at 8 masf and 35 masf, respectively. The vertical velocities are low (|uw| < 2 cm s–1) at STJP,8,35, VM8,35 and SM8,35. Vertical velocities |uw| > 5 cm s–1 are recorded at the other sites. The flow is inclined downslope at PE8 and SNC8,35 and upslope at the other sites.
The flow direction is controlled by local topography and large scale circulation. The predominant horizontal flow direction at 8 masf is along the sound or fjord axis at the near-shore Norwegian sites (STJS and STJP: E–ESE, NL: E–ESE). At the other sites it is along the mounds (GM: NNE, VM: ENE), across the escarpment or the ridge (SNC: SE, PE: ESE–SE) or along the continental slope (SM: SSW–S). The mean flow direction varies between 8 masf and 35 masf < 6° at STJS, STJP, NL and VM, around 10° at GM and < 20° at PE and SM. At SNC the flow direction change is largest from SE to NNE. The flow oscillates from the main direction to its opposite direction at all sites.
Tides
Tidal analysis of the pressure records (Table 4) explains 89.7–98.7% of the pressure fluctuations with 3–5 significant constituents. At all sites, the semidiurnal (M2) signal generates largest amplitude and is thus the most significant constituent. At the near-shore Norway, M2 generates an amplitude of 0.91–0.94 dbar, followed by diurnal K1 (0.08–0.12 dbar) signal. On the southwestern European Atlantic margin, the M2 generates the amplitude of 1.30–1.70 dbar followed by K1 (0.12–0.15 dbar) at sites SNC and PE, and M3 (0.02 dbar) at site GM. At VM and SM, the M2 has amplitude of 0.3–0.6 dbar followed by K1 (0.06–0.09 dbar).
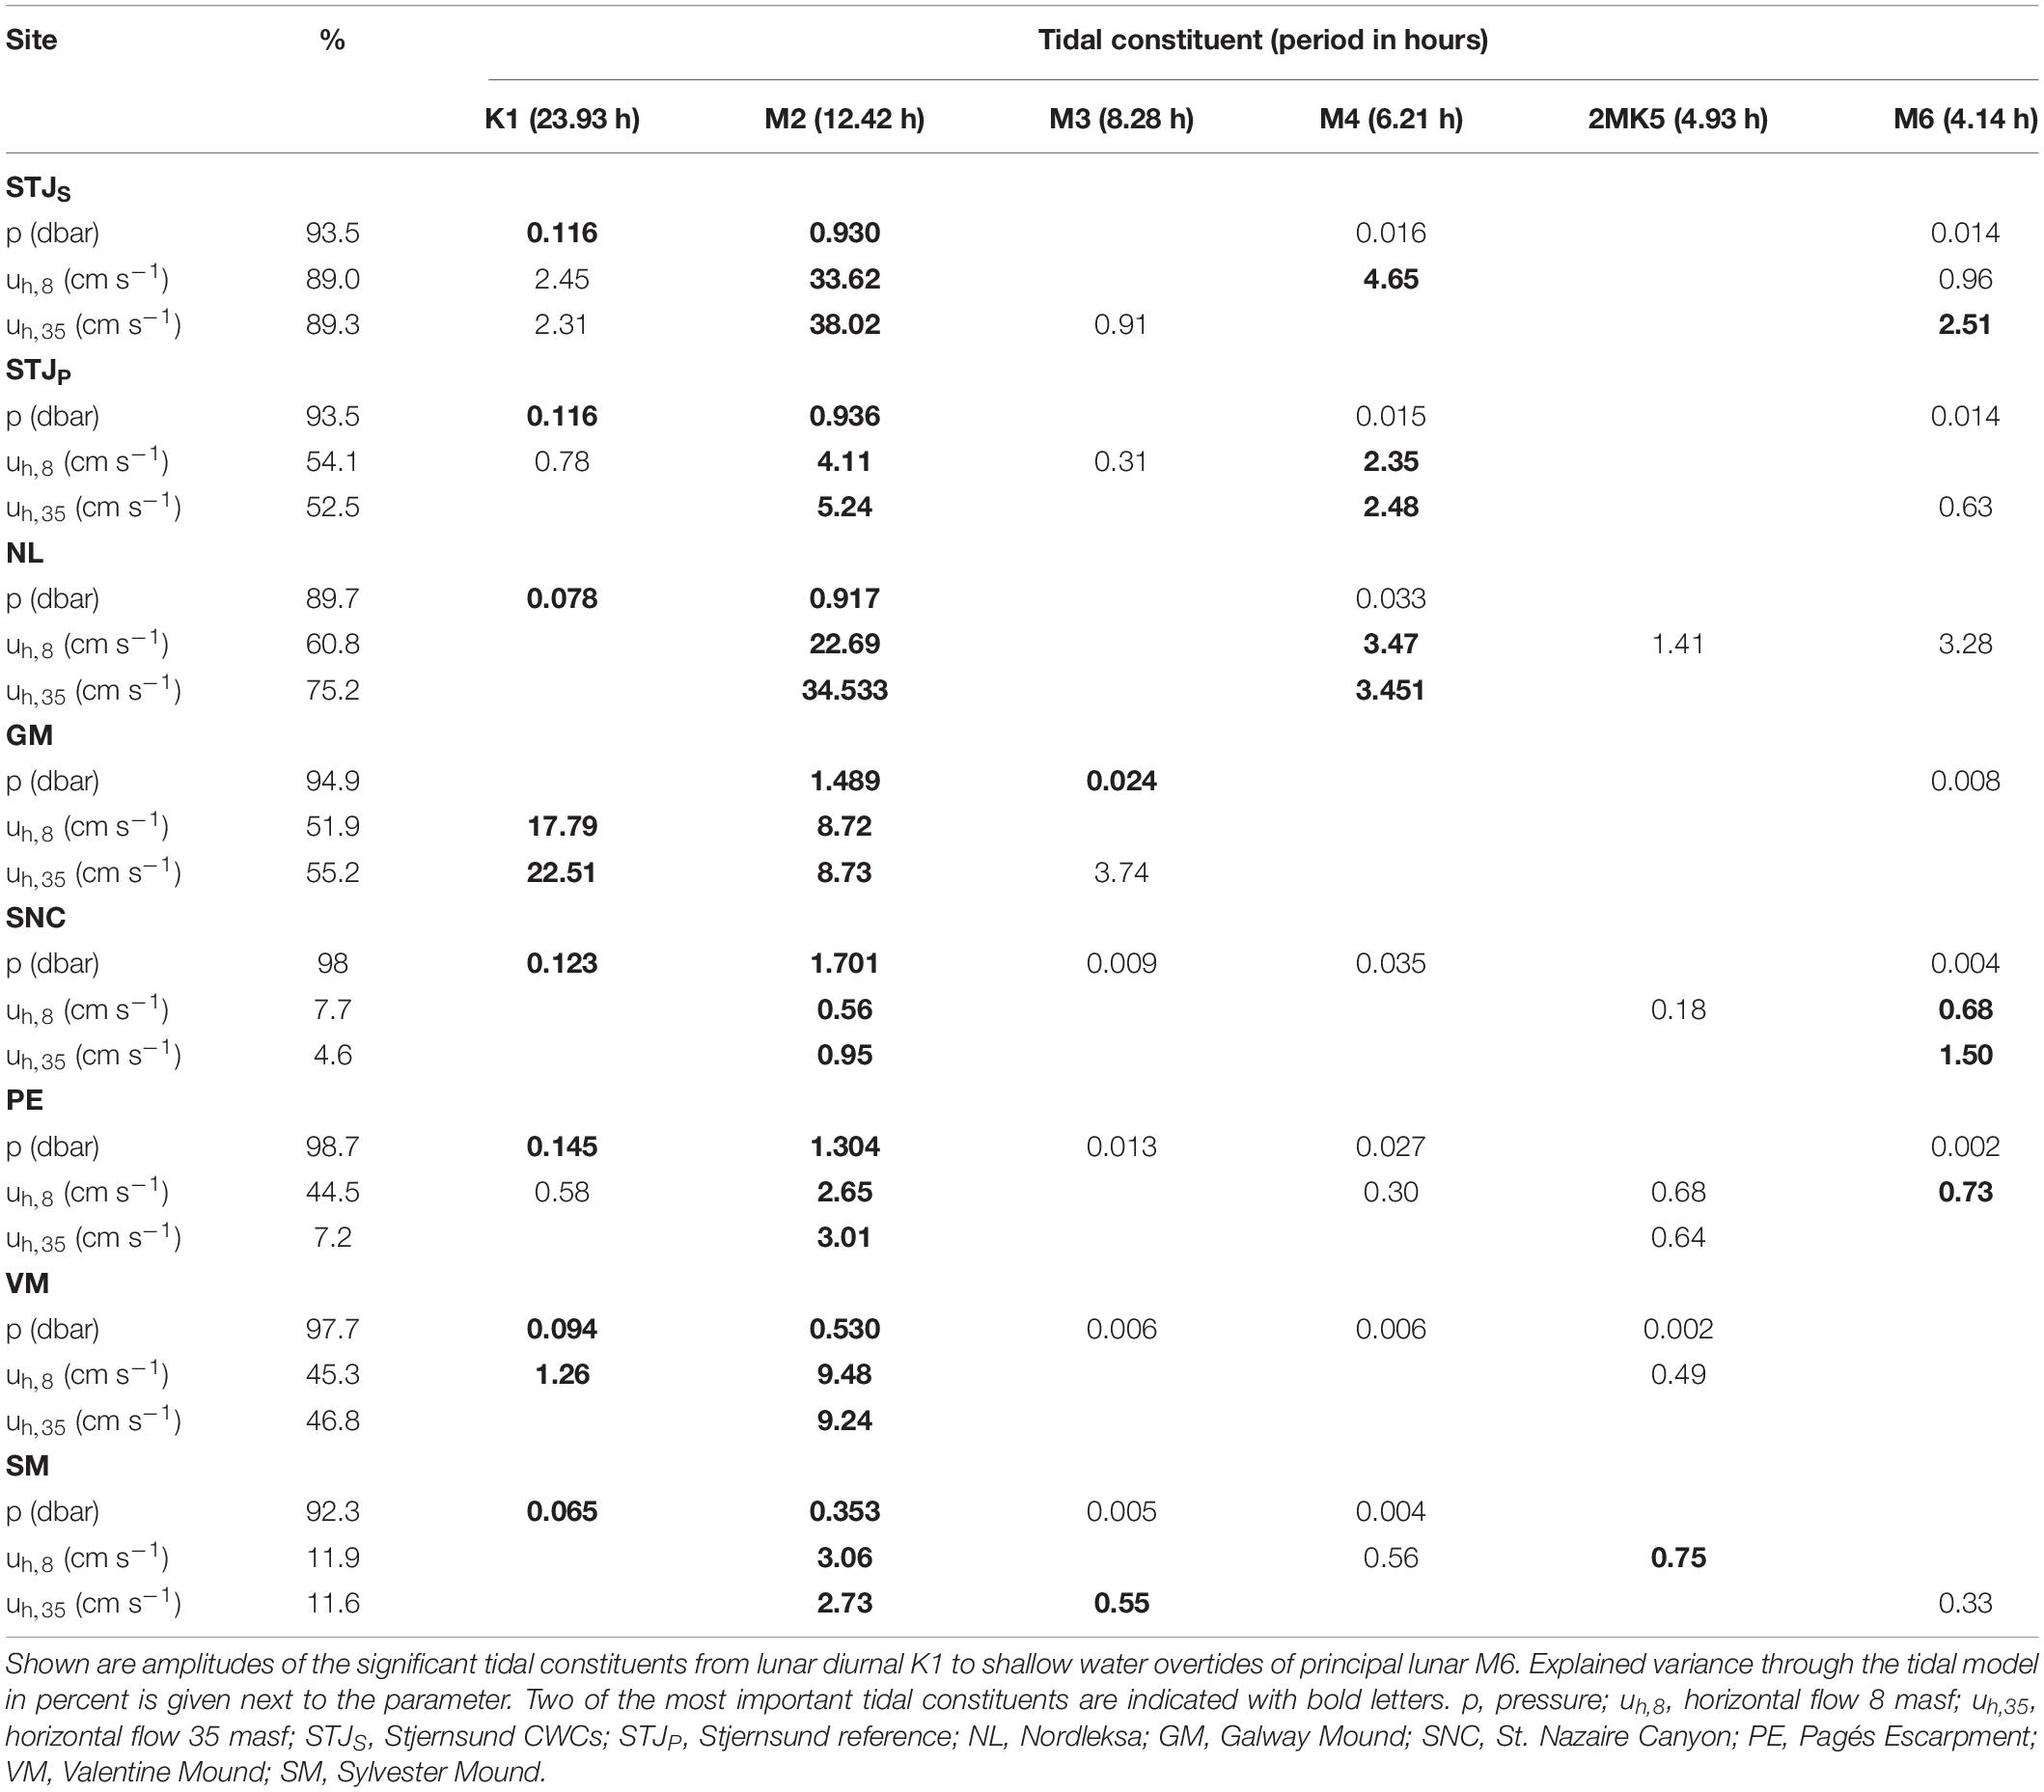
Table 4. Tidal analysis for bottom pressure and flow record based on the harmonic analysis toolbox T_Tide (Pawlowicz et al., 2002).
The analyses of the tidal constituents from the horizontal velocity records reveal a different picture (Table 4). With 1–5 significant tidal constituents, tidal analysis explains 7.7–89.0 and 4.6–89.3% of the horizontal velocity fluctuations at 8 masf and 35 masf, respectively. Fluctuations at tidal frequencies explain > 75% of the horizontal velocities at STJS,8,35 and NL35, 44–61% at STJP,8,35, NL8, GM8,35, PE8 and VM8,35 and < 15% at SNC8,35, PE35 and SM8,35. The M2 generates amplitudes of > 20 cm s–1 at STJS,8,35 and NL8,35, 8–10 cm s–1 at GM8,35 and VM8,35 and < 5.5 cm s–1 at STJP,8,35, SNC8,35, PE8,35 and SM8,35. It is the most significant constituent at all sites except at GM8,35 and SNC8,35, where K1 (17.8–22.5 cm s–1) and M6 (0.7–1.5 cm s–1) are the most significant constituents, respectively.
Cross-Correlation
The hydrographical parameters are not steady, but seem to follow the velocity fluctuations. The density is salinity driven off Norway and temperature driven elsewhere due to the local water masses. To simplify, only cross-correlations with σΘ are discussed.
For sites of category I or II (i.e., STJS, NL, GM and VM) the cross-correlations of um,8 with σΘ and velocity components uw,8 and um,35 vary from moderate to strong (|R| > 0.6) and offsets are relatively small (|T| < 6 h) (Table 5). The um,8 and uw,8 have moderate to strong correlations (|R| ≥ 0.6) with small offset (τ ≤ 20 min). At STJS, NL and GM strong um,8 occurs same time as upward velocities and at VM strong um,8 velocities occur 20 minutes before maximum downward velocity. The changes in the mean direction velocity components at 8 masf and 35 masf happen simultaneously (R > 0.89, τ = 0 min) at these sites. The um,8 and σΘ have moderate or strong correlation (|R| > 0.65) with |T| < 6 h. At STJS and VM the peak in bottom density is followed by maximum um,8 values (τ = −2.75 to −0.5 h). At GM and NL, the maximum σΘ values follows the peak um,8 after τ = 4.8 h and 5.7 h, respectively and coincide with the minimum um,8 velocities (Figure 8). The changes in flow direction are semidiurnal at STJS, NL and VM and diurnal at GM. This drives the variation in hydrography and during the acceleration phase of um,8 and uw,8 the density increases from its daily minimum to a maximum. σΘ drops to its minimum when the flow turns and relaxes. The maximum density change within one tidal cycle (M2 at STJ, NL and VM, K1 at GM) is > 0.1 kg m–3 at all four sites (Figure 7B). When this tidal density change is compared to water column density measurements (Figure 6), the maximum tidal density change corresponds to a vertical isopycnal displacement of 240 m at GM, around 70 m at STJS and VM and 30 m at NL.
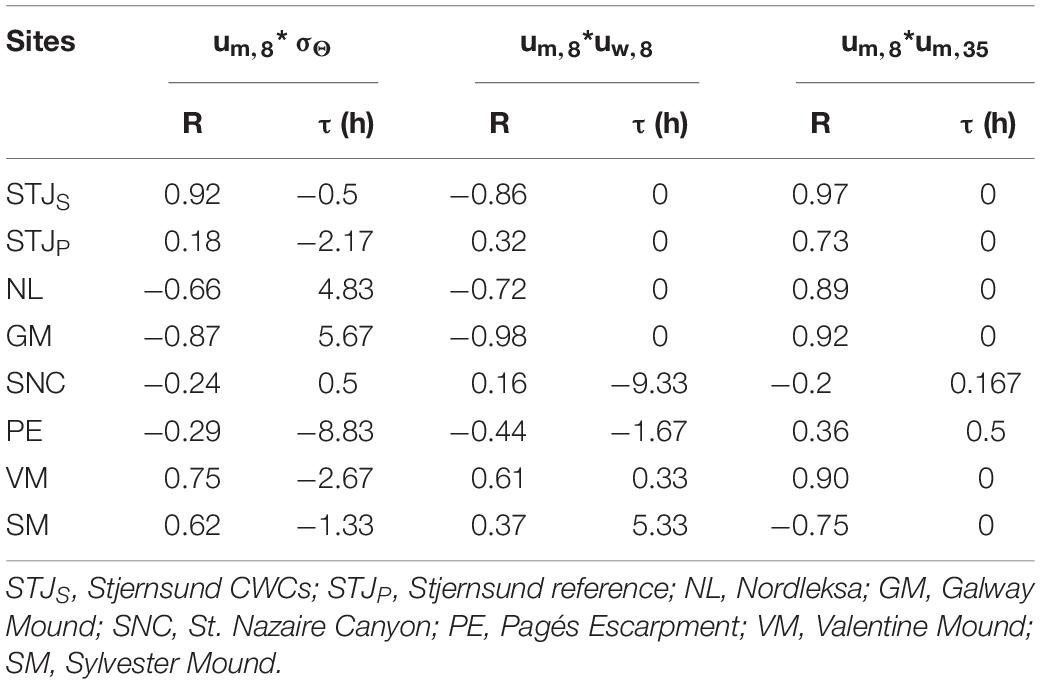
Table 5. Cross-correlations between mean direction velocity component at 8 masf (um,8) with sigma-theta (σΘ), vertical velocity component at 8 masf (uw,8) and the mean direction velocity component at 35 masf (um,35) with maximum correlation (R) and offset (τ) in hours.
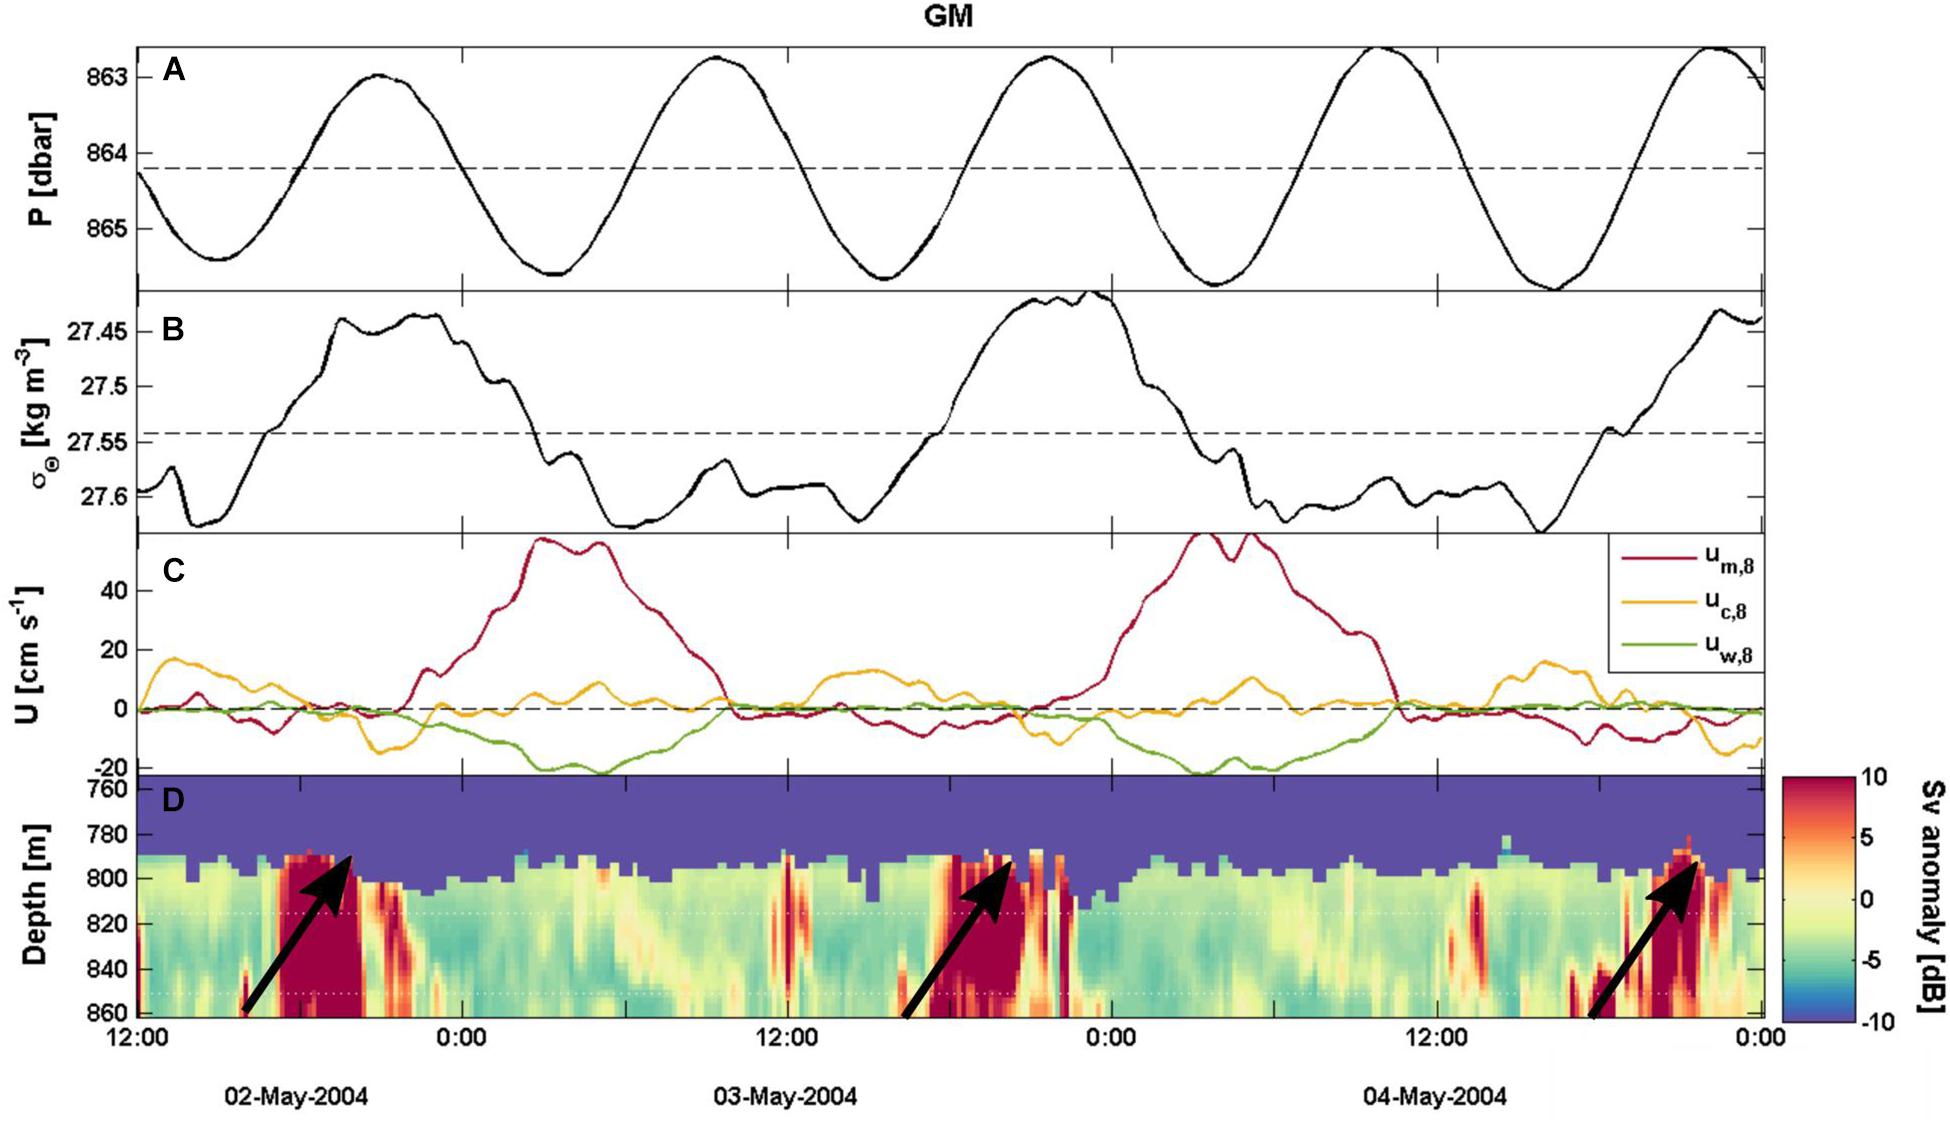
Figure 8. Selected 2.5-days time series from Galway mound for (A) pressure, (B) sigma-theta, (C) velocity components for 8 masf (red: um, yellow: uc, green: uw), and (D) mean volume backscatter (Sv) anomaly showed as Hovmöller diagram (Høvmoller, 1949) with red (blue) representing stronger (weaker) than average backscatter.
For sites in category III and IV (i.e., SNC, PE and SM) or for the reference location (STJP) the cross-correlations of um,8 with velocity components or sigma-theta are lower than for the category I–II sites (Table 5). At PE, SM and STJP um,8 and uw,8 have weak correlation (|R| = 0.3–0.45) with lag |T| ≤ 5.4 h. At SM and STJP strong um,8 is linked to downward or weak upward vertical flow and at PE upward or weak downward vertical flow. At SNC, um,8 and uw,8 have no correlation (R = 0.16, τ = −9.33 h). At SNC and PE, um,8 and um,35 have weak or no correlation (|R| ≤ 0.36 with τ ≤ 0.5 h). At STJP and SM the correlations between um,8 and um,35 are similar to category I–II sites (|R| > 0.7 with τ = 0 min). At sites SNC, PE and STJP, um,8 and σΘ have no correlation (|R| ≤ 0.30, |T| < 9 h). At SM, correlation between um,8 and σΘ is moderate (R = 0.62, τ = −1.33 h) meaning that minimum densities are usually reached before the peak mean direction velocities. At these sites the maximum density change within one tidal cycle (M2) (Figure 7B), corresponds to a vertical isopycnal movement of > 120 m at SNC and SM around 80 m at PE and around 2 m at STJP when compared to water column density values (Figure 6).
Hydrodynamics
When local topography, water column structure and velocity measurements are combined, we get flow type estimations for each site. In Figure 9 the results are shown for the time-averaged horizontal velocity (Umean) and peak horizontal velocity (Umax) linked to high tide. The velocities needed for partially blocked flow vary between Ucr = 0.3–80 cm s–1 with time scales tcr = 0.04–6.5 h. At SNC and PE flow is blocked and partially blocked conditions are never met since Ucr is over twice as large as Umax. At GM partially blocked flow is seen once a day (Ucr = 26 cm s–1) except for 7.5.2004. At NL and STJS the flow is partially blocked almost all the time, with Ucr < 3.5 cm s–1. At SM and STJP flow is mostly subcritical, but reaches partially blocked conditions irregularly (0–2 times per day) throughout the study periods. At VM flow is partially blocked twice a day before 20.1.2016 (Ucr = 19.4 cm s–1). After this, the flow speed decreases and flow is subcritical at the site.
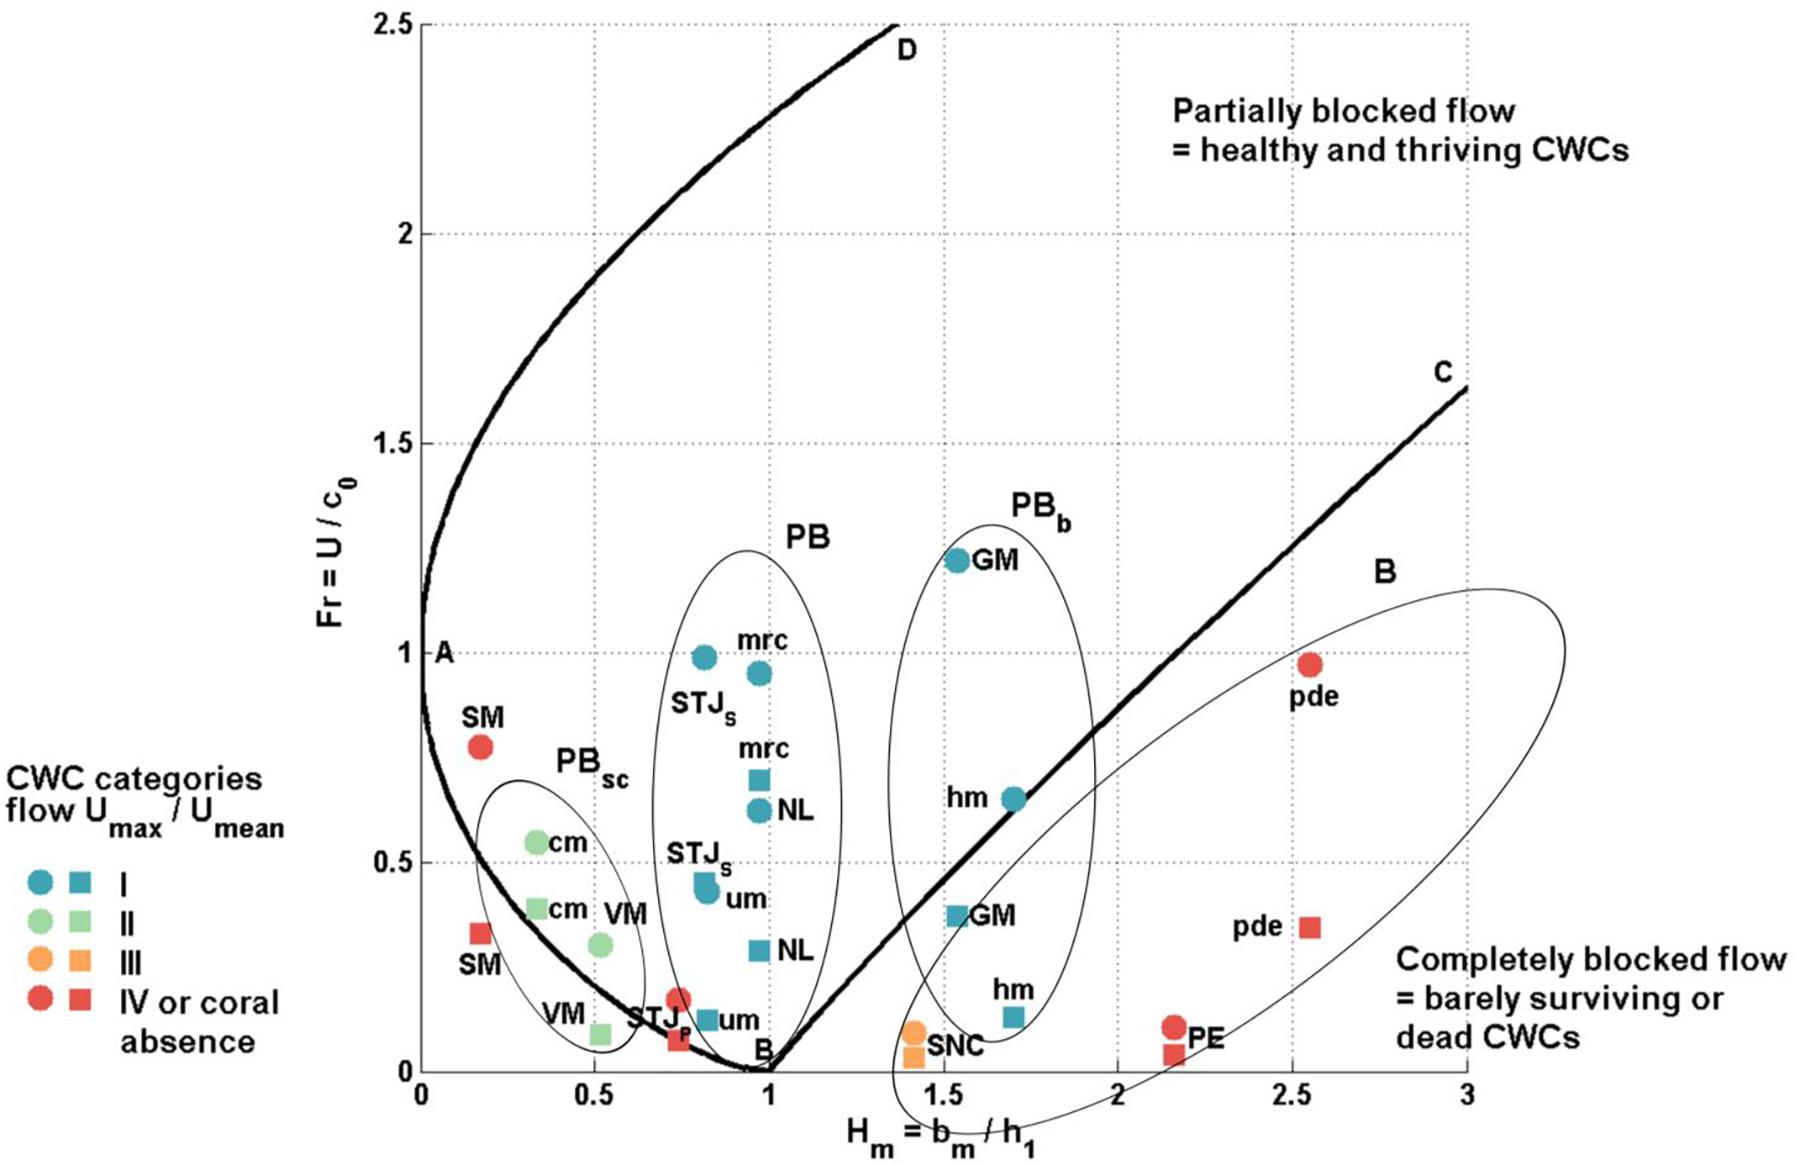
Figure 9. The two layer Froude number, topography height ratio (Fr, Hm) diagram. Mean horizontal flow velocity (square) and maximum horizontal flow velocity (circle) cases are shown. Sites used in this study (STJS, Stjernsund CWCs; STJP, Stjernsund reference; NL, Nordleksa; GM, Galway Mound; SNC, St. Nazaire Canyon; PE, Pagés Escarpment; VM, Valentine Mounds; SM, Sylvester Mound) are shown in capital letters. Sites from literature (hm, Haas CWC mound; um, unnamed smaller mound; mrc, Mingulay Reef complex; cm, Campeche CWC mound; pde: Pen Duick Escarpment) are written with small letters. CWC categories marked in colors (blue: I, green: II, orange: III, red: IV and CWC absence). The four CWC growth states are shown with ellipses; PBsc: Healthy category II sites with subcritical flow where flow is partially blocked during high tide, PB: Healthy category I sites with partially blocked flow, PBb: Tall and healthy CWC mounds with mostly completely blocked flow where partially blocked flow conditions are met only during the high or spring tide, B: Dead or declining sites in category III–IV with constantly blocked flow. The locations SM and STJP are excluded from the growth states since the flow is not quasi-steady during the high tide. Flow type separation lines after (Baines, 1998).
Even though the flow is at least partly partially blocked at most of the sites, the formation of hydraulic jump is restricted if the flow is not quasi-steady. This is the case at SM, where advection time scale is larger than the buoyancy period (ε = 2.8). At STJP, SNC and PE the flow is too slow for quasi-steady conditions (Ex ≤ 1).
The isopycnal displacement (Δh = Umean/N) is > 60 m at STJS and GM, between 15–25 m at NL, VM and SM, around 11 m at PE and STJP and 6 m at SNC. This is restricted by layer thickness ratio at NL (r > 0.5) and the height of the morphologic structure at SM (Umean/N > bm).
When the tide turns, flow relaxes and the upstream wave can propagate upward as a non-linear internal bore if the formation of the hydraulic jump has been under hydrostatic conditions. Strong mean volume backscatter signals (Sv) coincide with this relaxation phase at GM (Figure 8). The signal of resuspended particles propagates upward ∼10 m h–1 over 6 h and the signal of the settling particles is visible for the next 12 h. Weaker and disturbed semidiurnal signals are seen at NL, STJS and VM (not shown). At SM and at STJP the fluctuation of the strong Sv signals are neither diurnal nor semidiurnal but irregular with some stronger signals during the study period. At SNC and at PE there is no structure in Sv.
Discussion
At reef scales, several parameters coincide with healthy and high quality CWC occurrences: relatively anisotropic flow with oscillating flow direction, hydrostatic partially blocked flow during high tide, and strong correlation between velocity parameters and bottom density. These can be shown with the Froude number (Fr)–topography height ratio (Hm) diagram (Baines and Johnson, 2016). Healthy CWCs are found at sites, where regular hydraulic control of tidal flow leads to enhanced hydraulic jumps, local overturning, and internal bores. These processes provide several food-supply sources and prevent sedimentation.
This process has previously been reported as the major driver for oscillation of water mass interface and vertical mixing at CWC reefs. The linked overturning is assumed to carry deep water and re-suspended particles to the CWCs (Davies et al., 2009). The turn of the tide is linked to enhanced mixing, overturning, and increasing oxygen levels at CWC depths (Davies et al., 2009; Soetaert et al., 2016). Model studies suggest that down-ward movement can be very fast, transporting particles from the surface to intermediate depths (> 500 m) in less than an hour (Soetaert et al., 2016). Based on observations, the strength of the overturning is linked to the height of the CWC mounds (Cyr et al., 2016). In simulations, the overturning strength is enhanced by steep topographic slopes (large 2bm/L) and slowly oscillating flows (large ω and vertical tidal excursion) (Legg and Klymak, 2008). Decreasing stratification leads to larger vertical length scales of overturning, as the vertical displacement scale (Δh = U/N) increases (Legg and Klymak, 2008). Our observations strengthen the theory that hydraulic control of tidal flow is important to CWC growth on basin scales. The strength of the process varies with the health status of the sites.
State of Flow as a CWC Reef Growth Indicator
Our results indicate that living and healthy CWCs concentrate at sites, where quasi-steady tidal flow is partially blocked. To compare our results to literature data, we add data from five Atlantic CWC sites. These include three category I sites from offshore Ireland [SE Rockall Bank: Haas CWC mound (hm), an unnamed smaller mound (um) (Cyr et al., 2016) and the Mingulay Reef complex (mrc) (Davies et al., 2009)]. One category II site from the Gulf of Mexico (Campeche CWC mound (cm)) (Hebbeln et al., 2014) and one category IV site from the Gulf of Cadiz (Pen Duick Escarpment, pde) (Mienis et al., 2012) are also used. Their calculated hydrodynamical parameters are described in Table 6 and their state of flow in Figure 9.
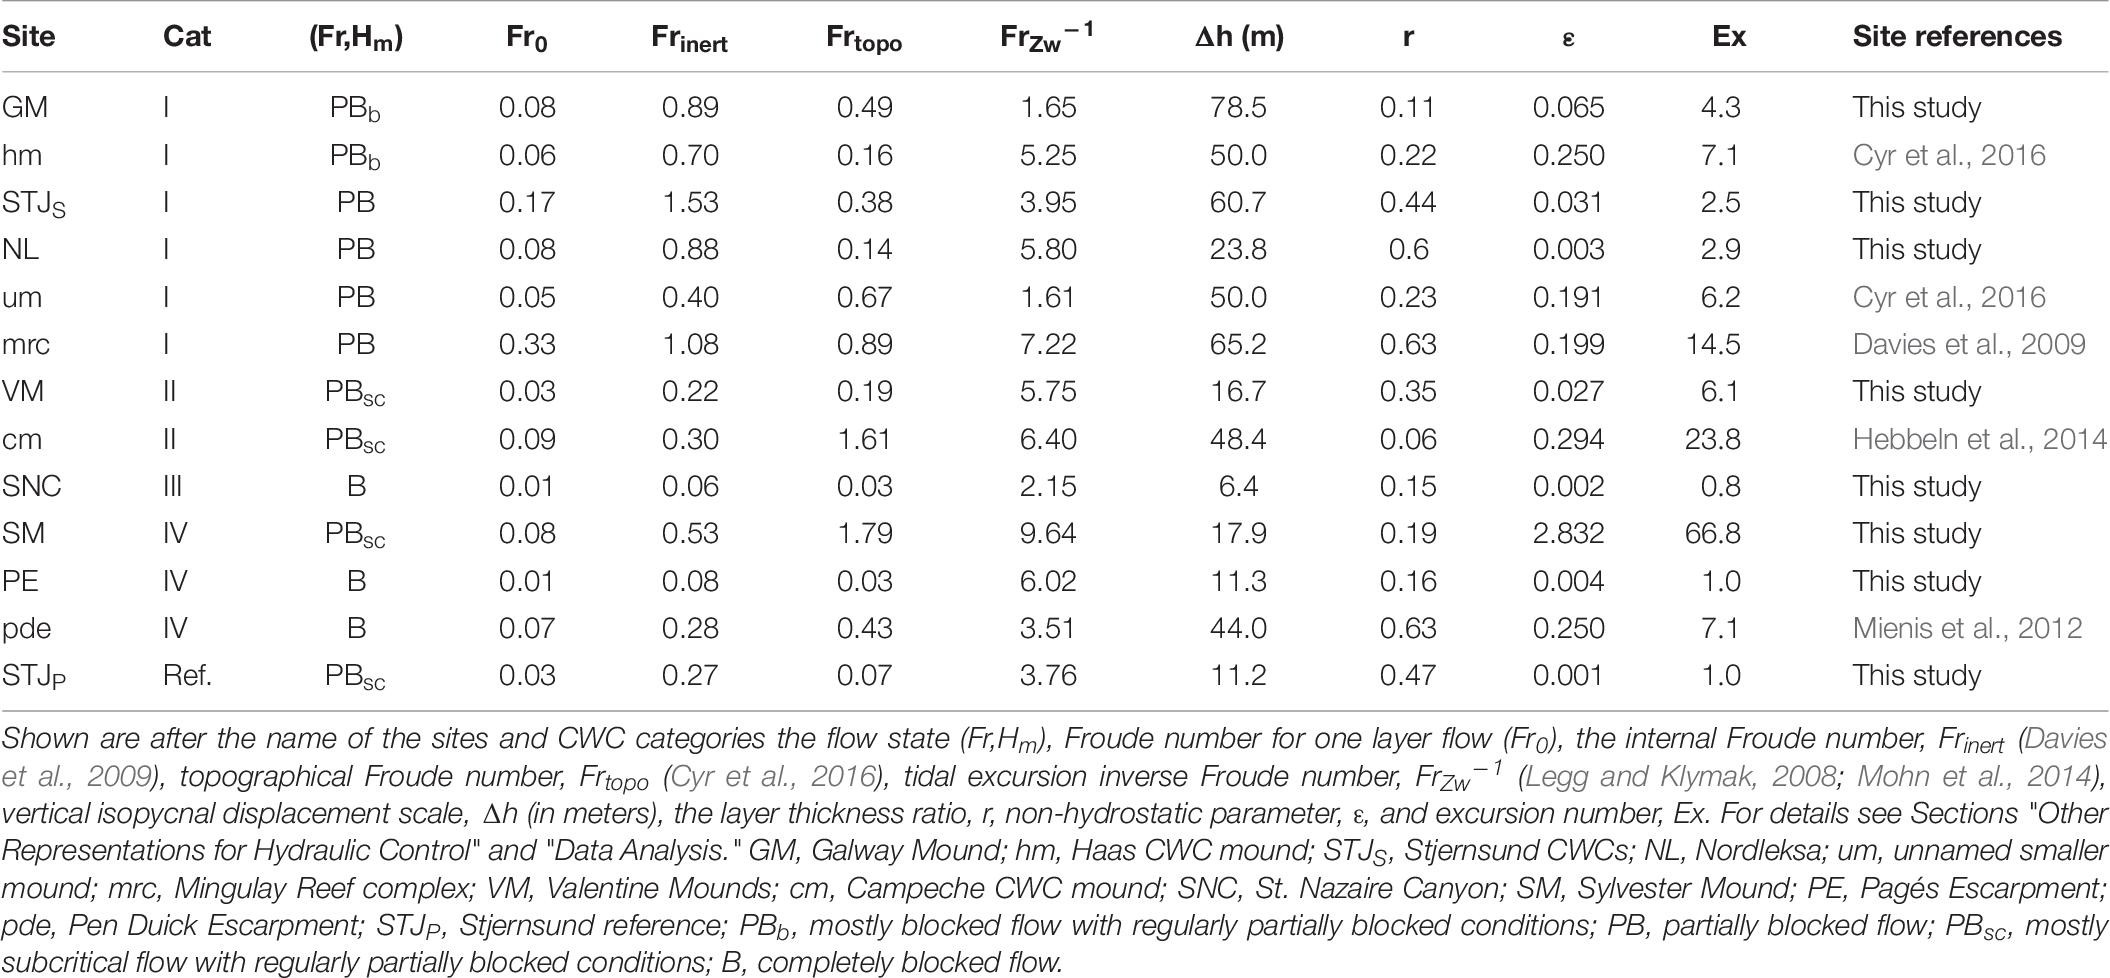
Table 6. Dynamical deep sea parameters for CWC sites and the parameters to estimate the quasi-steady flow conditions.
With a total of 12 sites and 13 locations, we can distinguish four different cases linking Fr–Hm to CWC growth. These are healthy category I CWC mounds (GM and hm) with regularly partially blocked flow with Hm > 1.5 (state PBb), healthy category I CWC sites (STJS, NL, um and mrc) with partially blocked flow with Hm ≈ 1 (state PB), category II and IV CWC sites (SM, cm and VM) and non-coral subsite (STJP) with partially subcritical flow with Hm < 0.6 (state PBsc), dead or declining sites in category III–IV (SNC, PE and pde) with constantly blocked flow (state B) with partially subcritical flow.
At healthy CWC mounds with regularly partially blocked flow (PBb), the flow is partially blocked only when flow speeds are higher than the mean flow (Ucr > Umean). It seems that the higher the speed required for the partially blocked situation, the stronger the hydraulic jump and generation of internal bores. At hm (Ucr = 46 cm s–1 and Umax = 50 cm s–1) overturning with over 100 m isopycnal displacement is reported only during spring tides (Cyr et al., 2016) and at GM (Ucr = 26 cm s–1 and Umax = 61 cm s–1) the estimated maximum isopycnal displacement is over 70 m (see Section “Hydrodynamics”). Both GM and hm are tall (> 100 m) CWC mounds where corals have been growing without hiatus since the last glacial (Eisele et al., 2008; Mienis et al., 2009) and where corals are virtually absent from the summit. This strengthens the idea first given by Cyr et al. (2016), that CWC mounds can reach a maximum height favorable for turbulent environments under present hydrodynamical conditions. This height is the limit, because mound starts to block the flow during neap tide, preventing the mixing to reach its summit regularly and the mound reaches a steady state where it no longer grows vertically.
Healthy CWC sites with Hm ≈ 1 (PB) have partially blocked flow conditions even under very low velocities. This creates a turbulent environment over the topographic feature. The site morphologies vary from small (bm < 100 m) CWC mounds (um and mrc) to sill and bank settings (NL and STJS). At all sites, corals have been growing since the last glacial period (López Correa et al., 2012; Douarin et al., 2014). At NL, um and mrc corals grow on the summit of the mounds and bank. At STJS corals do not grow at the summit but on the flanks of the sill.
Partially subcritical sites (PBsc) have subcritical conditions during mean or low horizontal velocities and partially blocked conditions during the peak velocity phase. VM and cm are both healthy (category II) CWC sites, where corals have been growing continuously for at least 34 ka (Wefing et al., 2017) and 10.1 ka (Matos et al., 2017), respectively. Even though flow at SM is partially blocked, corals have vanished there around 5 ka ago. This time coincides with the intensification in upwelling and a decline in oxygen (Tamborrino et al., 2019) within the area. The reference site (STJP) is located in a portion of the sound with a horizontal sea-floor and with low flow velocity. Even though the hydrographical (temperature, salinity, oxygen) ranges are suitable for CWC growth, there is no local overturning or mixing that would enhance particle flow to this point. Both SM and STJP have unsteady flow over the tidal cycle and no hydraulic jumps are excepted during the partially blocked flow conditions.
Dead or declining sites (B) are found in the Bay of Biscay and the Gulf of Cadiz, where corals are reported to live at the edge of their survival limit and most of the CWC findings are from dead sites. In the Gulf of Cadiz, large scale coral growth has stopped around 9 ka ago (Wienberg et al., 2010). Common for these sites are low flow velocities (Umax < 25 cm s–1) and high sedimentation rates which cause corals to be covered with sediments (Mienis et al., 2012). Since the flow is always blocked, there are no mixing processes over topography. Particles in the water column are evenly distributed most likely due to slow currents and low tidal activity (Bernárdez et al., 2017). This might be the reason, why there is no structure in the backscatter signal at SNC and PE. Even when the favorable hydrographical conditions are met, hydrodynamics prevents veritable coral frameworks to grow on these sites.
Besides the partially blocked flow state, the flow has to be quasi-steady and topography tall compared to isopycnal movement so that flow disturbances have time to grow and develop. The PBb sites have quasi-steady flow and the topography height does not limit the maximum vertical displacement, Δh. For PB sites the flow is quasi-steady over the tidal cycle, but the water layer ratio (r > 0.5) at NL and mrc affects the vertical displacement of the isopycnals. The flow is not quasi-steady at totally blocked sites (B) at Bay of Biscay, since the time scale is too short (Ex ≈ 1) and the sites act as internal wave maker. At pde, the flow is quasi-steady, but totally blocked. For the sites that are partially subcritical (PBsc), the situation is more complicated. For these, only cm and VM have quasi-steady flows, where conditions support hydraulic jumps. At SM, the advection timescale is short relative to buoyancy period (ε > 1) and the height of the topography is small compared to possible vertical displacement of the isopycnals (bm < Umean/N). At location STJP, the advection time scale is too short for hydraulic control to occur (Ex ≈1).
Short and Long Term Changes in Velocity Field and Hydrography
The strength of the bottom currents is affected by the respective phase of the tidal cycle, with maximum velocities occurring during the spring tides. A model study by Soetaert et al. (2016) shows that overturning and mixing at CWC mounds are strongest during spring tide and weakest during neap tide. A 1-week study period is not long enough to capture both, neap and spring tides. Thus, higher than measured velocities can be expected to occur at those sites that were studied during neap tide periods (PE, SM, STJ, mrc and cm). From these, sites SM, STJ, mrc and cm reach partially blocked conditions with measured velocities and at PE the required velocity Ucr > 10 × Umax. It is unlikely that time varying magnitude of U would change the flow states of the sites on the Fr–Hm diagram.
More likely the flow states are affected by the changes in the water column structure. This is driven by short-term and seasonal changes in the wind fields that cause changes in local currents and hydrography. Off southwestern Africa, the biannual change in the Angola–Benguela front is due to changes in the wind field. This causes changes in water masses and hence in oxygen levels at SM (Junker et al., 2017). Trade winds are strongest during May–September, when cold, oxygen-rich ESACW dominates the Namibian margin. The flow reverses during October–April when warm, nutrient-rich and oxygen depleted SACW dominates the area. Anoxic conditions have been reported to occur along the Namibian margin in February–May (Junker et al., 2017). Along the Angolan margin, the wind field is more stable (Shannon et al., 1987) and the near-shore seasonal variations are caused by seasonal variations in the Cuanza and Congo river inputs (Kopte et al., 2017). The seasonality of temperature and stratification are strong on the Norwegian coast (Sætre and Ljøen, 1971; Mork, 1981). The water column mixes and is weakly stratified during the winter storms. Due to the presence of the WMW, water column is strongly stratified during spring and summer months.
Environmental Conditions
Hydrographic (temperature and salinity) and oxygen conditions have been documented from most of the known living CWC sites. The known ranges for D. pertusum in PSS-78/EOS-80 for temperature are 4–13.9°C (Roberts et al., 2006; Freiwald et al., 2009; Davies and Guinotte, 2011), salinity 31.7–38.8 psu (Freiwald et al., 2004; Davies et al., 2008), dissolved oxygen 1.0–7.2 ml l–1 (Dodds et al., 2007; Davies et al., 2008, 2010; Ramos et al., 2017), and sigma-theta 27.35–27.6 kg m–3 (in the eastern Atlantic) (Dullo et al., 2008). The conversion errors between PSS-78/EOS-80 and TEOS-10 are small at the Atlantic and thus our results are comparable to the known ranges. The recorded temperature (6.12–12.53°C) and salinity (33.8–36.1 g kg–1) values fit well into these defined ranges. The CWCs grow in less dense waters at NL and at VM compared to the previously defined ranges, but outside the eastern Atlantic thriving CWCs are found outside this range e.g., in the Mediterranean (Flögel et al., 2014b) and in the Gulf of Mexico (Hebbeln et al., 2014). Corals at Nordleksa are within this sigma-theta range during spring months when the influence of AW is strongest (not shown). At the northern Atlantic sites, dissolved oxygen levels (3.7–6.2 ml l–1) are well within previously reported limits, but the observed concentration of dissolved oxygen on the Angolan and Namibian margins are both hypoxic. At VM, the corals thrive at the lowest reported oxygen levels of 0.46–0.69 ml l–1 (Hanz et al., 2019). In summary, given the enormous ranges of hydrographic and oxygen conditions a clear link to ideal environmental conditions for CWC growth cannot be drawn and most likely these factors are of secondary importance.
Our study suggests that the local food supply is important part of ideal environmental conditions for CWCs. The thriving coral sites (category I and II) described in this study benefit both hydrodynamical processes that deliver food particles on diurnal bases to corals during maximum flow phases (partially blocked flow conditions with Umax) and low velocity phases (U < 7 cm s–1 for < 40% of the time) for optimal food capture (Purser et al., 2010; Orejas et al., 2016) whereas the declining sites showed unfavorable conditions for hydrodynamical food supply processes (blocked flow conditions, flow speed mostly < 7 cm s–1). Sufficient level of food is crucial to CWCs since under starvation both coral fitness and physiological performance drop (Naumann et al., 2011; Larsson et al., 2013; Baussant et al., 2017). In elevated temperature conditions, increased food supply has been observed to stimulate CWC growth but not to compensate for adverse effects of ocean acidification (Büscher et al., 2017). Under low pH and undersaturated aragonite conditions, CWC net calcification has been observed to decrease but the high quality food supply mitigates the physiological impacts on respiration and prey capture (Georgian et al., 2016b). In field studies, corals are found to even thrive in hypoxic conditions in the Gulf of Mexico (Lunden et al., 2014; Georgian et al., 2016a) and off Namibia (Hanz et al., 2019) as long as sufficient high quality food is available whereas laboratory studies have shown coral mortality in hypoxic conditions (Dodds et al., 2007; Lunden et al., 2014) and in water temperatures > 14°C (Lunden et al., 2014).
On geological time scales, the demise of CWC colonies has been observed in sediment core data during glacial periods (Raddatz et al., 2013). The demise has been linked to hypoxia (< 2 ml l–1; Fink et al., 2012), warming in bottom water temperatures (> 12°C; Wienberg and Titschack, 2017; Wienberg et al., 2018) and decrease in surface productivity. While major environmental overturns might cause the demise of CWCs at one site, they might support coral re-settlement at another site (e.g., Frank et al., 2011). During glacial periods the sea level has been about 120 m below the present and hence the tidal interaction level has been deeper than in the modern ocean. The change of the depth of the water mass boundaries on glacial/interglacial time scales has been suggested as an explanation for CWC reef development (Wang et al., 2019). A recent study by Hebbeln et al. (2019) highlights the food supply as the most prominent key driver of demise/re-establishment of the CWCs and stresses the interactions between the water column and the local hydrodynamics.
Under ongoing global change, the ocean is predicted to become warmer, more acidic and less oxygenated. The discussed studies have shown the negative effects of rising temperature (e.g., Lunden et al., 2014), ocean acidification (Gómez et al., 2018) and ocean deoxygenation (Fink et al., 2012) and their interactions (Büscher et al., 2017; Wienberg et al., 2018) on CWC ecosystems but the projected changes in climate will also shift the primary productivity northeastwards (Barton et al., 2016) due to changes in ocean warming, circulation and stratification. The latter two will also affect the tidal dynamics control and CWC growth described here more than predicted sea-level rise (few centimeters per decade, Dangendorf et al., 2017) within the next decades when both overall density decreases and the surface stratification (upper 200 m) strengthens (Capotondi et al., 2012). The stratification maxima and hence the layer thicknesses will change depending of the area. If the N maximum moves toward surface, topography height ratio (Hm) will decrease. On the other hand, larger differences in the upper and lower layer densities will yield increase in the speed of the long waves and hence decrease in Froude number (Fr). Together these changes would shift the flow states in Fr-Hm diagram toward the down-left corner and sites which are currently PBsc or healthy small mounds on subcritical boundary, may not experience partially blocked conditions in future.
Other Representations for Hydraulic Control
Simple one-layer flow in relatively shallow water Fr0 = Umean/(NH) gives only little information from the deep-water coral sites. Therefore, several estimations (Equation 2) have been used to capture the dynamics around the CWCs. In addition to the two-layer Froude number used in this study, these are the internal Froude number, Frinert (Davies et al., 2009), topographical Froude number, Frtopo (Cyr et al., 2016), and tidal excursion inverse Froude number, FrZw–1 (Legg and Klymak, 2008; Mohn et al., 2014), where,
Where ρb is water density at summit depth, ρs is the surface water density and ρmean is the mean density of the water column. From these, quasi-steady conditions (Ex > 1 and ε < 1) are expected when using Frinert and Frtopo. The FrZw–1 is independent from the magnitude of the flow. The values for these dynamical parameters are shown in Table 6.
Frinert describes the flow conditions over the crest depth of the morphologic structures. Similar to Fr0, hydraulic control is expected when Frinert ≈ 1. This parameter picks well the sites with known overturning since Frinert = 1 ± 0.2 at GM, hm, mrc and NL. For the two category I not in this range, the flow is supercritical at STJS (Frinert = 1.53) and subcritical at um (Frinert = 0.4). For other sites, the flow with Frinert is subcritical (< 0.53).
Frtopo describes the obstruction of the steady flow by the topography (Legg and Klymak, 2008). The values Frtopo ≪ 1 are used to describe conditions where overturning is possible. For conditions with small Frtopo, however, the disturbances will be restricted to the horizontal plane. As Frtopo increases toward 1, non-linear lee-waves are expected to occur. The range for this non-linear regime is suggested to be Frtopo = 0.5–0.8 (Baines, 1998; Vosper et al., 1999). At large Frtopo, the flow may exhibit three-dimensional wakes and be more turbulent (Dewey et al., 2005). Of sites used in this study, Frtopo > 1 at VM and cm. Within the 0.5–0.8 range are GM and um. Mingulay reef complex (Frtopo = 0.89) and Haas mound (Frtopo = 0.16) are known for overturning events, but with the values used, this is not shown with this estimation.
The tidal excursion inverse Froude number describes the effect of vertical tidal excursion distance and stratification over a tidal cycle to bottom flow. Internal jumps are expected in high velocity and weak stratification regimes with FrZw–1 > 3. The hydrodynamic model study from NE Atlantic by Mohn et al. (2014) shows that areas with coral present have higher FrZw–1 values than coral absence and background areas (FrZw–1 < 1.5). All of the sites used in this study have FrZw–1 > 1.5. Surprisingly, GM, um and SNC are the only sites with FrZw–1 < 3.
These parameters describing the bottom flow dynamics depend on local water column characteristics such as stratification and depth, the dimensions of the topographic feature and the bottom flow. It is important that the right parameter is used for further model studies and hydraulic control estimations driven from observations.
Conclusion
The data of this study represent a compilation of stratification, ambient water mass characteristics and the bottom water flow at CWC sites colonized by D. pertusum in the eastern Atlantic from the Arctic to the southern hemisphere. It sheds new light on the processes which determine coral distribution and growth. Even though large scale environmental conditions are useful for statistical habitat suitability models, on the reef scale hydrodynamical processes give more information about the quality of the coral occurrences. High-quality and healthy D. pertusum reefs are found in areas where quasi-steady tidal flow is partially blocked by the CWC morphology and the two-layer Froude number is > 0.35 and the topography height ratio Hm = 0.3–1.7. Our study suggests that the hydrodynamical setting causes a quasi-steady particle supply for filter-feeding corals. In contrast to episodic food supply theories based on spring blooms our observations suggest diurnal re-supply of sinking particles back to the water column to heights that are in reach for the feeding the CWCs. Steady (diurnal basis) supply of high-quality food would be a key factor when diagnosing a change in the CWC environment, where environmental stress set by e.g., ocean acidification (low pH) or low oxygen concentrations, may be of secondary importance but will increase food and energy demand. Indeed, the local stratification (e.g., the vertical displacement of the isopycnals) and the topography are important factors that determine the strength of the internal tidal bores and thus keep the particles resupply process running. Changes in stratification, flow magnitude and the height of the morphologic structure (e.g., by sea level changes during glacial/non-glacial periods, by ocean warming/cooling or by outgrowth of the CWC mounds) may cause starving of the CWC habitat. The future plan is to link hydraulic control to vertical growth rates as well as to distinguish the different food sources by estimating the uptake of resuspended particles.
Data Availability Statement
The datasets generated for this study are available on request to the corresponding author. The cruise M122 CTD data is available: https://doi.pangaea.de/10.1594/PANGAEA.904192.
Author Contributions
SF led the project. KJ performed the analyses and interpretation of the results with assistance from JK. KJ wrote the manuscript with assistance from SF. All authors contributed substantially to the work and revision of the manuscript.
Funding
This study was supported by several agencies and projects: Helmholtz association funded projects HGF ROBEX, HGF ARCHES, HGF ACROSS, and HGF MOSES. Also project BMBF MOLAB and European Union’s Horizon 2020 Research and Innovation Program under grant agreement 63321 (AtlantOS) supported the cruises and data collection and the GEOMAR Helmholtz Centre for Ocean Research Kiel provided the facilities to conduct the study. KJ was funded by the Research Council of Norway project Fate of cold-water coral reefs – identifying drivers of ecosystem change (FATE) and by the Osk. Huttunen Foundation doctorate researcher grant.
Conflict of Interest
The authors declare that the research was conducted in the absence of any commercial or financial relationships that could be construed as a potential conflict of interest.
Acknowledgments
We would like to thank captains, crew, chief-scientists, and scientific teams during cruises M122, POS473, POS455, POS438, POS434, M84-5, POS325, POS16, and M61 on RV Meteor and on RV Poseidon (2004–2016). We are also grateful for the valuable feedback provided by the two reviewers, Marina Carreiro-Silva and Lorenzo Angeletti.
References
Addamo, A. M., Vertino, A., Stolarski, J., García-Jiménez, R., Taviani, M., and Machordom, A. (2016). Merging scleractinian genera: the overwhelming genetic similarity between solitary Desmophyllum and colonial Lophelia. BMC Evol. Biol. 16:108. doi: 10.1186/s12862-016-0654-8
Armi, L. (1986). The hydraulics of two flowing layers with different densities. J. Fluid Mech. 163, 27–58. doi: 10.1017/S0022112086002197
Baco, A. R., Morgan, N., Roark, E. B., Silva, M., Shamberger, K. E. F., and Miller, K. (2017). Defying dissolution: discovery of Deep-Sea scleractinian coral reefs in the North Pacific. Sci. Rep. 7:5436. doi: 10.1038/s41598-017-05492-w
Baines, P. G. (1998). Topographic Effects in Stratified Flows. Cambridge: Cambridge University Press.
Baines, P. G. (2015). Internal hydraulic jumps in two-layer systems. J. Fluid Mech. 787, 1–15. doi: 10.1017/jfm.2015.662
Baines, P. G., and Johnson, E. R. (2016). Non-linear topographic effects in two-layer flows. Front. Earth Sci. 4:9. doi: 10.3389/feart.2016.00009
Barton, A. D., Irwin, A. J., Finkel, Z. V., and Stock, C. A. (2016). Anthropogenic climate change drives shift and shuffle in North Atlantic phytoplankton communities. Proc. Natl. Acad. Sci. U.S.A. 113, 2964–2969. doi: 10.1073/pnas.1519080113
Baussant, T., Nilsen, M., Ravagnan, E., Westerlund, S., and Ramanand, S. (2017). Physiological responses and lipid storage of the coral Lophelia pertusa at varying food density. J. Toxicol. Environ. Heal. A 80, 266–284. doi: 10.1080/15287394.2017.1297274
Bernárdez, P., Prego, R., Filgueiras, A. V., Ospina-Álvarez, N., Santos-Echeandía, J., Álvarez-Vázquez, M. A., et al. (2017). Lithogenic sources, composition and intra-annual variability of suspended particulate matter supplied from rivers to the Northern Galician Rias (Bay of Biscay). J. Sea Res. 130, 73–84. doi: 10.1016/j.seares.2017.05.006
Beyer, A., Schenke, H. W., Klenke, M., and Niederjasper, F. (2006). Terrain model of the eastern slope of the porcupine seabight (50 m grid size). PANGAEA Supplement to: Beyer, A et al. (2003): High resolution bathymetry of the eastern slope of the Porcupine Seabight. Mar. Geol. 198, 27–54. doi: 10.1016/S0025-3227(03)00093-8
Büscher, J. V., Form, A. U., and Riebesell, U. (2017). Interactive effects of ocean acidification and warming on growth, fitness and survival of the cold-water coral Lophelia pertusa under different food availabilities. Front. Mar. Sci. 4:401. doi: 10.3389/fmars.2017.00101
Capotondi, A., Alexander, M. A., Bond, N. A., Curchitser, E. N., and Scott, J. D. (2012). Enhanced upper ocean stratification with climate change in the CMIP3 models. J. Geophys. Res. Ocean 117:C04031. doi: 10.1029/2011JC007409
Cathalot, C., Van Oevelen, D., Cox, T. J. S., Kutti, T., Lavaleye, M., Duineveld, G., et al. (2015). Cold-water coral reefs and adjacent sponge grounds: hotspots of benthic respiration and organic carbon cycling in the deep sea. Front. Mar. Sci. 2:37. doi: 10.3389/fmars.2015.00037
Cohen, A. L., and Holcomb, M. (2009). Why corals care about ocean acidification uncovering the mechanism. Oceanography 22, 118–127. doi: 10.5670/oceanog.2009.102
Cyr, F., Van Haren, H., Mienis, F., Duineveld, G., and Bourgault, D. (2016). On the influence of cold-water coral mound size on flow hydrodynamics, and vice versa. Geophys. Res. Lett. 43, 775–783. doi: 10.1002/2015GL067038
Dangendorf, S., Marcos, M., Wöppelmann, G., Conrad, C. P., Frederikse, T., and Riva, R. (2017). Reassessment of 20th century global mean sea level rise. Proc. Natl. Acad. Sci. U.S.A. 114, 5946–5595. doi: 10.1073/pnas.1616007114
Daniault, N., Mazé, J. P., and Arhan, M. (1994). Circulation and mixing of Mediterranean water west of the Iberian Peninsula. Deep. Res. Part I 41, 1685–1714. doi: 10.1016/0967-0637(94)90068-X
Davies, A. J., Duineveld, G. C. A., Lavaleye, M. S. S., Bergman, M. J. N., and Van Haren, H. (2009). Downwelling and deep-water bottom currents as food supply mechanisms to the cold-water coral Lophelia pertusa (Scleractinia) at the mingulay reef complex. Limnol. Oceanogr. 54, 620–629. doi: 10.4319/lo.2009.54.2.0620
Davies, A. J., Duineveld, G. C. A., van Weering, T. C. E., Mienis, F., Quattrini, A. M., Seim, H. E., et al. (2010). Short-term environmental variability in cold-water coral habitat at Viosca Knoll, Gulf of Mexico. Deep. Res. Part I Oceanogr. Res. Pap. 57, 199–212. doi: 10.1016/j.dsr.2009.10.012
Davies, A. J., and Guinotte, J. M. (2011). Global habitat suitability for framework-forming cold-water corals. PLoS One 6:e18483. doi: 10.1371/journal.pone.0018483
Davies, A. J., Wisshak, M., Orr, J. C., and Murray Roberts, J. (2008). Predicting suitable habitat for the cold-water coral Lophelia pertusa (Scleractinia). Deep. Res. Part I Oceanogr. Res. Pap. 55, 1048–1062. doi: 10.1016/j.dsr.2008.04.010
Davies, J. S., Guillaumont, B., Tempera, F., Vertino, A., Beuck, L., Ólafsdóttir, S. H., et al. (2017). A new classification scheme of European cold-water coral habitats: implications for ecosystem-based management of the deep sea. Deep Sea Res. Part II Top. Stud. Oceanogr. 145, 102–109. doi: 10.1016/j.dsr2.2017.04.014
De Mol, B., Kozachenko, M., Wheeler, A., Alvares, H., Henriet, J. P., and Olu-Le Roy, K. (2007). Thérése mound: a case study of coral bank development in the Belgica Mound Province, Porcupine Seabight. Int. J. Earth Sci. 96, 103–120. doi: 10.1007/s00531-005-0496-x
De Mol, B., Van Rensbergen, P., Pillen, S., Van Herreweghe, K., Van Rooij, D., McDonnell, A., et al. (2002). Large deep-water coral banks in the Porcupine Basin, southwest of Ireland. Mar. Geol. 188, 193–231. doi: 10.1016/S0025-3227(02)00281-5
Deines, K. L. (1999). “Backscatter estimation using broadband acoustic Doppler current profilers,” in Proceedings of the 6th IEEE Working Conference on Current Measurement, San Diego, CA, 249–253. doi: 10.1109/CCM.1999.755249
Dewey, R., Richmond, D., and Garrett, C. (2005). Stratified tidal flow over a bump. J. Phys. Oceanogr. 35:1911. doi: 10.1175/JPO2799.1
Diaz, R. J., and Rosenberg, R. (1995). Marine benthic hypoxia: a review of its ecological effects and the behavioural responses of benthic macrofauna. Oceanogr. Mar. Biol. Annu. Rev. 33, 245–303.
Dodds, L. A., Roberts, J. M., Taylor, A. C., and Marubini, F. (2007). Metabolic tolerance of the cold-water coral Lophelia pertusa (Scleractinia) to temperature and dissolved oxygen change. J. Exp. Mar. Bio. Ecol. 349, 205–214. doi: 10.1016/j.jembe.2007.05.013
Dorschel, B., Hebbeln, D., Foubert, A., White, M., and Wheeler, A. J. (2007). Hydrodynamics and cold-water coral facies distribution related to recent sedimentary processes at Galway Mound west of Ireland. Mar. Geol. 244, 184–195. doi: 10.1016/j.margeo.2007.06.010
Douarin, M., Sinclair, D. J., Elliot, M., Henry, L. A., Long, D., Mitchison, F., et al. (2014). Changes in fossil assemblage in sediment cores from mingulay reef complex (NE Atlantic): implications for coral reef build-up. Deep. Res. Part II Top. Stud. Oceanogr. 99, 286–296. doi: 10.1016/j.dsr2.2013.07.022
Duineveld, G. C. A., Lavaleye, M. S. S., and Berghuis, E. M. (2004). Particle flux and food supply to a seamount cold-water coral community (Galicia Bank, NW Spain). Mar. Ecol. Prog. Ser. 277, 13–23. doi: 10.3354/meps277013
Duineveld, G. C. A., Lavaleye, M. S. S., Bergman, M. J. N., De Stigter, H., and Mienis, F. (2007). Trophic structure of a cold-water coral mound community (Rockall Bank, NE Atlantic) in relation to the near-bottom particle supply and current regime. Bull. Mar. Sci. 81, 449–467.
Dullo, W. C., Flögel, S., and Rüggeberg, A. (2008). Cold-water coral growth in relation to the hydrography of the Celtic and Nordic European continental margin. Mar. Ecol. Prog. Ser. 371, 165–176. doi: 10.3354/meps07623
Dullo, W. C., Flögel, S., and Rüggeberg, A. (2018). “Water mass measurements around benthic communities: a comparative study between yo-yo conductivity-temperature-depth (CTD) casts and high-resolution time series data acquisition of bottom waters from the pagés escarpment in the southern bay of biscay,” in Diversity in Coastal Marine Sciences, eds C. W. Finkl, and C. Makowski, (Cham: Springer), 181–200. doi: 10.1007/978-3-319-57577-3_11
Duncombe Rae, C. M. M. (2005). A demonstration of the hydrographic partition of the Benguela upwelling ecosystem at 26° 40’S. Afr. J. Mar. Sci. 27, 617–628. doi: 10.2989/18142320509504122
Eisele, M., Hebbeln, D., and Wienberg, C. (2008). Growth history of a cold-water coral covered carbonate mound – Galway Mound, Porcupine Seabight, NE-Atlantic. Mar. Geol. 253, 160–169. doi: 10.1016/j.margeo.2008.05.006
Emery, W. J. (2003). “Water types and water masses.,” in Encyclopedia of Atmospheric Sciences, 2nd Edn, eds HoltonCurry, and Pyle, (Atlanta, GA: Elsevier), 1556–1567.
Farmer, D. M., and Armi, L. (1986). Maximal two-layer exchange over a sill and through the combination of a sill and contraction with barotropic flow. J. Fluid Mech. 164, 53–76. doi: 10.1017/S002211208600246X
Findlay, H. S., Artioli, Y., Moreno Navas, J., Hennige, S. J., Wicks, L. C., Huvenne, I., et al. (2013). Tidal downwelling and implications for the carbon biogeochemistry of cold-water corals in relation to future ocean acidification and warming. Glob. Chang. Biol. 19, 2708–2719. doi: 10.1111/gcb.12256
Fink, H. G., Wienberg, C., Hebbeln, D., McGregor, H. V., Schmiedl, G., Taviani, M., et al. (2012). Oxygen control on Holocene cold-water coral development in the eastern Mediterranean Sea. Deep. Res. Pt. I Oceanogr. Res. Pap. 62, 89–96. doi: 10.1016/j.dsr.2011.12.013
Finlay, C. C., Maus, S., Beggan, C. D., Bondar, T. N., Chambodut, A., Chernova, T. A., et al. (2010). International geomagnetic reference field: the eleventh generation. Geophys. J. Int. 183, 1216–1230. doi: 10.1111/j.1365-246X.2010.04804.x
Flögel, S., Becheler, R., De Cleyn, A., Da Cunha, M., Dullo, W. C., Fietzke, C., et al. (2014a). Cold-Water Corals in the Bay of Biscay – Occurrences and Distribution in Space and Time (TransBiscay) – Cruise No. M84/5, May 31 – June 21, 2011, Vigo (Spain) – Brest (France). Bremen: DFG-Senatskommission für Ozeanographie. doi: 10.2312/cr_m84_5
Flögel, S., Dullo, W. C., Pfannkuche, O., Kiriakoulakis, K., and Rüggeberg, A. (2014b). Geochemical and physical constraints for the occurrence of living cold-water corals. Deep. Res. Pt. II Top. Stud. Oceanogr. 99, 19–26. doi: 10.1016/j.dsr2.2013.06.006
Form, A. U., Büscher, J. V., Hissmann, K., Flögel, S., Wisshak, M., Rüggeberg, A., et al. (2014). RV POSEIDON Cruise Report POS455 LORELEI Lophelia Reef Lander Expedition and Investigation. Breberhaven – Kiel, 24.06. – 17.07.2013. Kiel. Kiel: GEOMAR Helmholtz-Zentrum für Ozeanforschung. doi: 10.3289/CR_POS_455
Form, A. U., Büscher, J. V., Hissmann, K., Flögel, S., Wisshak, M., Rüggeberg, A., et al. (2015). RV POSEIDON Cruise Report POS473 LORELEI II: LOphelia REef Lander Expedition and Investigation II, Tromsø – Bergen – Esbjerg, 15.08. – 31.08. – 04.09.2014. Kie: GEOMAR Helmholtz-Zentrum für Ozeanforschung. doi: 10.3289/CR_POS_473
Frank, N., Freiwald, A., López Correa, M., Wienberg, C., Eisele, M., Hebbeln, D., et al. (2011). Northeastern Atlantic cold-water coral reefs and climate. Geology 39, 743–746. doi: 10.1130/G31825.1
Frederiksen, R., Jensen, A., and Westerberg, H. (1992). The distribution of the scleractinian coral Lophelia pertusa around the Faroe Islands and the relation to internal tidal mixing. Sarsia 77, 157–171. doi: 10.1080/00364827.1992.10413502
Freiwald, A., Beuck, L., Rüggeberg, A., Taviani, M., and Hebbeln, D. (2009). The white coral community in the central Mediterranean Sea revealed by ROV surveys. Oceanography 22, 58–74. doi: 10.5670/oceanog.2009.06
Freiwald, A., and Dullo, W. C. (2014). CRUISE REPORT RV Poseidon Cruise 325 [POS325 – Nordic Reefs], Bremerhaven – Tromsø, Leg 1: Bremerhaven – Tromsø, 12 July – 24 July 2005; Leg 2: Tromsø – Tromsø, 24 July – 3 August 2005 12 July – 3 August 2005. Kiel: GEOMAR Helmholtz-Zentrum für Meeresforschung Kiel.
Freiwald, A., Fosså, J. H., Grehan, A., Koslow, T., and Roberts, J. M. (2004). Cold-water coral reefs. Environment 22, 615–625.
Freiwald, A., Rogers, A., Hall-Spencer, J., Guinotte, J., Davies, A., Yesson, C., et al. (2017). Global Distribution of Cold-Water Corals (Version 5.0). Fifth Update to the Dataset in Freiwald et al. (2004). by UNEP-WCMC, in Collaboration With Andre Freiwald and John Guinotte. Available online at: http://data.unep-wcmc.org/datasets/3 (accessed July 2, 2019).
Genin, A., Dayton, P. K., Lonsdale, P. F., and Spiess, F. N. (1986). Corals on seamount peaks provide evidence of current acceleration over deep-sea topography. Nature 322, 59–61. doi: 10.1038/322059a0
Georgian, S. E., Deleo, D., Durkin, A., Gomez, C. E., Kurman, M., Lunden, J. J., et al. (2016a). Oceanographic patterns and carbonate chemistry in the vicinity of cold-water coral reefs in the Gulf of Mexico: implications for resilience in a changing ocean. Limnol. Oceanogr. 61, 648–665. doi: 10.1002/lno.10242
Georgian, S. E., Dupont, S., Kurman, M., Butler, A., Strömberg, S. M., Larsson, A. I., et al. (2016b). Biogeographic variability in the physiological response of the cold-water coral Lophelia pertusa to ocean acidification. Mar. Ecol. 37, 1345–1359. doi: 10.1111/maec.12373
Gómez, C. E., Wickes, L., Deegan, D., Etnoyer, P. J., and Cordes, E. E. (2018). Growth and feeding of deep-sea coral Lophelia pertusa from the California margin under simulated ocean acidification conditions. PeerJ 6:e5671. doi: 10.7717/peerj.5671
Gordon, A. L. (1981). South Atlantic thermocline ventilation. Deep Sea Res. Pt. A Oceanogr. Res. Pap. 28, 1239–1264. doi: 10.1016/0198-0149(81)90033-9
Hanz, U., Wienberg, C., Hebbeln, D., Duineveld, G., Lavaleye, M., Juva, K., et al. (2019). Environmental factors influencing benthic communities in the oxygen minimum zones on the Angolan and Namibian margins. Biogeosciences 16, 4337–4356. doi: 10.5194/bg-16-4337-2019
Hebbeln, D., Portilho-Ramos, R., da, C., Wienberg, C., and Titschack, J. (2019). The fate of cold-water corals in a changing world: a geological perspective. Front. Mar. Sci 6:119. doi: 10.3389/fmars.2019.00119
Hebbeln, D., Wienberg, C., Bender, M., Bergmann, F., Dehning, K., Dullo, W.-C., et al. (2017). ANNA Cold-Water Coral Ecosystems off Angola and Namibia - Cruise No. M122 -December 30, 2015 – January 31, 2016 - Walvis Bay (Namibia) – Walvis Bay (Namibia). Bremen: DFG-Senatskommission für Ozeanographie. doi: 10.2312/cr_m122
Hebbeln, D., Wienberg, C., Wintersteller, P., Freiwald, A., Becker, M., Beuck, L., et al. (2014). Environmental forcing of the Campeche cold-water coral province, southern Gulf of Mexico. Biogeosciences 11, 1799–1815. doi: 10.5194/bg-11-1799-2014
Hutchings, L., van der Lingen, C. D., Shannon, L. J., Crawford, R. J. M., Verheye, H. M. S., Bartholomae, C. H., et al. (2009). The benguela current: an ecosystem of four components. Prog. Oceanogr. 83, 15–32. doi: 10.1016/j.pocean.2009.07.046
Iorga, M. C., and Lozier, M. S. (1999). Signatures of the Mediterranean outflow from a North Atlantic climatology: 1. Salinity and density fields. J. Geophys. Res. Ocean. 104, 25985–26009. doi: 10.1029/1999JC900115
Jackson, C. R., Da Silva, J. C. B., and Jeans, G. (2012). The generation of nonlinear internal waves. Oceanography 25, 108–123. doi: 10.5670/oceanog.2012.46
Johanson, A. N., Flögel, S., Dullo, W. C., Linke, P., and Hasselbring, W. (2017). Modeling polyp activity of Paragorgia arborea using supervised learning. Ecol. Inform. 39, 109–118. doi: 10.1016/j.ecoinf.2017.02.007
Junker, T., Mohrholz, V., Siegfried, L., and van der Plas, A. (2017). Seasonal to interannual variability of water mass characteristics and currents on the Namibian shelf. J. Mar. Syst. 165, 36–46. doi: 10.1016/j.jmarsys.2016.09.003
Kiriakoulakis, K., and Wolff, G. A. (2005). “Particulate organic matter around two oceanic seamounts from the NE Atlantic,” in Proceedings of the 17th British Organic Geochemical Society Meeting, Liverpool.
Kopte, R., Brandt, P., Dengler, M., Tchipalanga, P. C. M., Macuéria, M., and Ostrowski, M. (2017). The angola current: Flow and hydrographic characteristics as observed at 11°S. J. Geophys. Res. Ocean. 122, 1177–1189. doi: 10.1002/2016JC012374
Larsson, A. I, Lundälv, T., and Van Oevelen, D. (2013). Skeletal growth, respiration rate and fatty acid composition in the cold-water coral Lophelia pertusa under varying food conditions. Mar. Ecol. Prog. Ser. 483, 169–184. doi: 10.3354/meps10284
Legg, S., and Klymak, J. (2008). Internal hydraulic jumps and overturning generated by tidal flow over a tall steep ridge. J. Phys. Oceanogr. 38, 1949–1964. doi: 10.1175/2008JPO3777.1
Lilly, J. M. (2017). jLab: A Data Analysis Package for MATLAB, V. 1.6.5. Available online at: http://www.jmlilly.net/jmlsoft.html (accessed December 20, 2017).
López Correa, M., Montagna, P., Joseph, N., Rüggeberg, A., Fietzke, J., Flögel, S., et al. (2012). Preboreal onset of cold-water coral growth beyond the Arctic Circle revealed by coupled radiocarbon and U-series dating and neodymium isotopes. Quat. Sci. Rev. 34, 24–43. doi: 10.1016/j.quascirev.2011.12.005
Lunden, J. J., McNicholl, C. G., Sears, C. R., Morrison, C. L., and Cordes, E. E. (2014). Acute survivorship of the deep-sea coral Lophelia pertusa from the Gulf of Mexico under acidification, warming, and deoxygenation. Front. Mar. Sci. 1:78. doi: 10.3389/fmars.2014.00078
Maier, C., Popp, P., Sollfrank, N., Weinbauer, M. G., Wild, C., and Gattuso, J. P. (2016). Effects of elevated pCO2 and feeding on net calcification and energy budget of the Mediterranean cold-water coral Madrepora oculata. J. Exp. Biol. 219(Pt 20), 3208–3217. doi: 10.1242/jeb.127159
Maier, S. R., Bannister, R. J., Van Oevelen, D., and Kutti, T. (2019). Seasonal controls on the diet, metabolic activity, tissue reserves and growth of the cold-water coral Lophelia pertusa. Coral Reefs 39, 173–187. doi: 10.1007/s00338-019-01886-6
Marshall, J., Hill, C., Perelman, L., and Adcroft, A. (1997). Hydrostatic, quasi-hydrostatic, and nonhydrostatic ocean modeling. J. Geophys. Res. C Ocean. 102, 5733–5752. doi: 10.1029/96JC02776
Matos, L., Wienberg, C., Titschack, J., Schmiedl, G., Frank, N., Abrantes, F., et al. (2017). Coral mound development at the Campeche cold-water coral province, southern Gulf of Mexico: Implications of Antarctic Intermediate Water increased influence during interglacials. Mar. Geol. 392, 53–65. doi: 10.1016/j.margeo.2017.08.012
Mayer, F. T., and Fringer, O. B. (2017). An unambiguous definition of the Froude number for lee waves in the deep ocean. J. Fluid Mech. 831, 1–9. doi: 10.1017/jfm.2017.701
McCulloch, M., Trotter, J., Montagna, P., Falter, J., Dunbar, R., Freiwald, A., et al. (2012). Resilience of cold-water scleractinian corals to ocean acidification: boron isotopic systematics of pH and saturation state up-regulation. Geochim. Cosmochim. Acta 87, 21–34. doi: 10.1016/j.gca.2012.03.027
McDougall, T. J., and Barker, P. M. (2011). Getting Started With TEOS-10 and the Gibbs Seawater (GSW) Oceanographic Toolbox. Scor/Iapso Wg127, 28. doi:SCOR/IAPSO WG127. Available online at: www.TEOS-10.org (accessed May, 2011).
Mienis, F., De Stigter, H. C., De Haas, H., Van der Land, C., and Van Weering, T. C. E. (2012). Hydrodynamic conditions in a cold-water coral mound area on the Renard Ridge, southern Gulf of Cadiz. J. Mar. Syst. 96, 61–71. doi: 10.1016/j.jmarsys.2012.02.002
Mienis, F., de Stigter, H. C., White, M., Duineveld, G., de Haas, H., and van Weering, T. C. E. (2007). Hydrodynamic controls on cold-water coral growth and carbonate-mound development at the SW and SE rockall trough margin, NE Atlantic Ocean. Deep. Res. Part I Oceanogr. Res. Pap. 54, 1655–1674. doi: 10.1016/j.dsr.2007.05.013
Mienis, F., van der Land, C., de Stigter, H. C., van de Vorstenbosch, M., de Haas, H., Richter, T., et al. (2009). Sediment accumulation on a cold-water carbonate mound at the southwest rockall trough margin. Mar. Geol. 11, 40–50. doi: 10.1016/j.margeo.2009.06.014
Mittelstaedt, E. (1991). The ocean boundary along the northwest African coast: circulation and oceanographic properties at the sea surface. Prog. Oceanogr. 26, 307–355. doi: 10.1016/0079-6611(91)90011-A
Mohn, C., Rengstorf, A., White, M., Duineveld, G., Mienis, F., Soetaert, K., et al. (2014). Linking benthic hydrodynamics and cold-water coral occurrences: a high-resolution model study at three cold-water coral provinces in the NE Atlantic. Prog. Oceanogr. 122, 92–104. doi: 10.1016/j.pocean.2013.12.003
Mohrholz, V., Bartholomae, C. H., van der Plas, A. K., and Lass, H. U. (2008). The seasonal variability of the northern Benguela undercurrent and its relation to the oxygen budget on the shelf. Cont. Shelf Res. 28, 424–441. doi: 10.1016/j.csr.2007.10.001
Mork, M. (1981). Circulation phenomena and frontal dynamics of the norwegian coastal current. Philos. Trans. R. Soc. A Math. Phys. Eng. Sci. 302, 635–647. doi: 10.1098/rsta.1981.0188
Mortensen, P. B. (2001). Aquarium observations on the deep-water coral Lophelia pertusa (L., 1758) (Scleractinia) and selected associated invertebrates. Ophelia 54, 83–104. doi: 10.1080/00785236.2001.10409457
Mortensen, P. B., Hovland, T., Fosså, J. H., and Furevik, D. M. (2001). Distribution, abundance and size of Lophelia pertusa coral reefs in mid-Norway in relation to seabed characteristics. J. Mar. Biol. Assoc. (U. K.) 81, 581–597. doi: 10.1017/S002531540100426X
Naumann, M. S., Orejas, C., Wild, C., and Ferrier-Pages, C. (2011). First evidence for zooplankton feeding sustaining key physiological processes in a scleractinian cold-water coral. J. Exp. Biol. 214(Pt 21), 3570–3576. doi: 10.1242/jeb.061390
Orejas, C., Gori, A., Rad-Menéndez, C., Last, K. S., Davies, A. J., Beveridge, C. M., et al. (2016). The effect of flow speed and food size on the capture efficiency and feeding behaviour of the cold-water coral Lophelia pertusa. J. Exp. Mar. Bio. Ecol. 481, 34–40. doi: 10.1016/j.jembe.2016.04.002
Pawlowicz, R., Beardsley, B., and Lentz, S. (2002). Classical tidal harmonic analysis including error estimates in MATLAB using TDE. Comput. Geosci. 28, 929–937. doi: 10.1016/S0098-3004(02)00013-4
Pfannkuche, O. (2012a). Short Report POSEIDON Cruise 434 [POS434]: 4D- Observation of Hydro-Dynamical, Chemical, and Biological Properties and its Influence on Cold-Water Coral Growth in the Stjernsund, Norway; Bergen – Tromsø - Kiel, 25. May – 14. June 2012. Kiel: Helmholtz-Zentrum für Ozeanforschung Kiel. doi: 10.3289/SCR_POS_434
Pfannkuche, O. (2012b). Short Report POSEIDON Cruise 438 [POS438]: 4D- Observation of Hydro-Dynamical, Chemical, and Biological Properties and its Influence on Cold-Water coral Growth in the Stjernsund, Norway; Tromsø - Tromsø - Kiel, 10. Sept. – 27. Sept. 2012. Kiel: Helmholtz-Zentrum für Ozeanforschung Kiel. doi: 10.3289/SCR_POS_438
Pfannkuche, O., Bannert, B., Beck, T., Beuck, L., Dullo, W.-C., Flögel, S., et al. (2004). Geo-Biological Investigations on Azooxanthellate Cold-Water Coral Reefs on the Carbonate Mounds Along the Celtic Continental Slope. L. A. t. M. Meteor Cruise No. 61, Lisbon – Cork.
Pfannkuche, O., and Utecht, C. (2005). FS Poseidon Cruise Report POS 316 Carbonate Mounds and Aphotic Corals in the NE-Atlantic Reykjavik-Lissabon 03.08. – 17.08.2004. IFM-GEOMAR Report; 3. Kiel: IFM-GEOMAR.
Pingree, R. D., and Le Cann, B. (1989). Celtic and Armorican slope and shelf residual currents. Prog. Oceanogr. 23, 303–338. doi: 10.1016/0079-6611(89)90003-7
Pollard, R. T., Griffiths, M. J., Cunningham, S. A., Read, J. F., Pérez, F. F., and Ríos, A. F. (1996). Vivaldi 1991 – A study of the formation, circulation and ventilation of Eastern North Atlantic Central Water. Prog. Oceanogr. 37, 167–192. doi: 10.1016/S0079-6611(96)00008-0
Poole, R., and Tomczak, M. (1999). Optimum multiparameter analysis of the water mass structure in the Atlantic Ocean thermocline. Deep Sea Res. Pt. I Oceanogr. Res. Pap. 46, 1895–1921. doi: 10.1016/S0967-0637(99)00025-4
Pratt, L. (1986). Hydraulic control of sill flow with bottom friction. J. Phys. Oceanogr. 16, 1970–1980. doi: 10.1175/1520-04851986016<1970:HCOSFW<2.0.CO;2
Purser, A., Larsson, A. I, Thomsen, L., and van Oevelen, D. (2010). The influence of flow velocity and food concentration on Lophelia pertusa (Scleractinia) zooplankton capture rates. J. Exp. Mar. Bio. Ecol. 395, 55–62. doi: 10.1016/j.jembe.2010.08.013
Raddatz, J., Liebetrau, V., Rüggeberg, A., Hathorne, E., Krabbenhöft, A., Eisenhauer, A., et al. (2013). Stable Sr-isotope, Sr/Ca, Mg/Ca, Li/Ca and Mg/Li ratios in the scleractinian cold-water coral Lophelia pertusa. Chem. Geol. 352, 143–152. doi: 10.1016/j.chemgeo.2013.06.013
Ramos, A., Sanz, J. L., Ramil, F., Agudo, L. M., and Presas-Navarro, C. (2017). “The giant cold-water coral mounds barrier off mauritania,” in Deep-Sea Ecosystems Off Mauritania: Research of Marine Biodiversity and Habitats in the Northwest African Margin, eds A. Ramos, F. Ramil, and J. Sanz, (Dordrecht: Springer). doi: 10.1007/978-94-024-1023-5_13
Rice, A. L., Thurston, M. H., and New, A. L. (1990). Dense aggregations of a hexactinellid sponge, Pheronema carpenteri, in the Porcupine Seabight (northeast Atlantic Ocean), and possible causes. Prog. Oceanogr. 24, 179–196. doi: 10.1016/0079-6611(90)90029-2
Ritzrau, W., Thomsen, L., Lara, R. J., and Graf, G. (1997). Enhanced microbial utilisation of dissolved amino acids indicates rapid modification of organic matter in the benthic boundary layer. Mar. Ecol. Prog. Ser. 156, 43–50. doi: 10.3354/meps156043
Roberts, J. M., Wheeler, A. J., and Freiwald, A. (2006). Reefs of the deep: the biology and geology of cold-water coral ecosystems. Science 312, 543–547. doi: 10.1126/science.1119861
Roberts, J. M., Wheeler, A. J., Freiwald, A., and Cairns, S. D. (2009). Cold-Water Corals: The Biology and Geology of Deep-Sea Coral Habitats. Cambridge: Cambridge University Press. doi: 10.1017/CBO9780511581588
Rüggeberg, A., Flögel, S., Dullo, W. C., Hissmann, K., and Freiwald, A. (2011). Water mass characteristics and sill dynamics in a subpolar cold-water coral reef setting at Stjernsund, northern Norway. Mar. Geol. 282, 5–12. doi: 10.1016/j.margeo.2010.05.009
Sætre, R., and Ljøen, R. (1971). “The norwegian costal current,” in Proceedings of the First International Conference on Port and Ocean Engineering (Trondheim: Norwegian University of Science and Technology).
Shannon, L. V., Agenbag, J. J., and Buys, M. E. L. (1987). Large- and mesoscale features of the Angola-Benguela front. South African J. Mar. Sci. 5, 11–34. doi: 10.2989/025776187784522261
Soetaert, K., Mohn, C., Rengstorf, A., Grehan, A., and Van Oevelen, D. (2016). Ecosystem engineering creates a direct nutritional link between 600-m deep cold-water coral mounds and surface productivity. Sci. Rep. 6, 35057. doi: 10.1038/srep35057
Sokolova, I. M., Frederich, M., Bagwe, R., Lannig, G., and Sukhotin, A. A. (2012). Energy homeostasis as an integrative tool for assessing limits of environmental stress tolerance in aquatic invertebrates. Mar. Environ. Res. 79, 1–15. doi: 10.1016/j.marenvres.2012.04.003
Stramma, L., and Schott, F. (1999). The mean flow field of the tropical Atlantic Ocean. Deep. Res. II 46, 279–303. doi: 10.1016/S0967-0645(98)00109-X
Tamborrino, L., Wienberg, C., Titschack, J., Wintersteller, P., Mienis, F., Schröder-Ritzrau, A., et al. (2019). Mid-Holocene extinction of cold-water corals on the Namibian shelf steered by the Benguela oxygen minimum zone. Geology 47, 1185–1188. doi: 10.1130/g46672.1
Thiem, Ø, Ravagnan, E., Fosså, J. H., and Berntsen, J. (2006). Food supply mechanisms for cold-water corals along a continental shelf edge. J. Mar. Syst. 60, 207–219. doi: 10.1016/j.jmarsys.2005.12.004
Van Haren, H., Mienis, F., Duineveld, G. C. A., and Lavaleye, M. S. S. (2014). High-resolution temperature observations of a trapped nonlinear diurnal tide influencing cold-water corals on the Logachev mounds. Prog. Oceanogr. 125, 16–25. doi: 10.1016/j.pocean.2014.04.021
Van Oevelen, D., Duineveld, G., Lavaleye, M., Mienis, F., Soetaert, K., and Heip, C. H. R. (2009). The cold−water coral community as hotspot of carbon cycling on continental margins: A food−web analysis from Rockall Bank (northeast Atlantic). Limnol. Oceanogr. 54, 1829–1844. doi: 10.4319/lo.2009.54.6.1829
Van Oevelen, D., Duineveld, G. C. A., Lavaleye, M. S. S., Kutti, T., and Soetaert, K. (2018). Trophic structure of cold-water coral communities revealed from the analysis of tissue isotopes and fatty acid composition. Mar. Biol. Res. 14, 287–306. doi: 10.1080/17451000.2017.1398404
Vosper, S. B., Castro, I. P., Snyder, W. H., and Mobbs, S. D. (1999). Experimental studies of strongly stratified flow past three-dimensional orography. J. Fluid Mech. 390, 223–249. doi: 10.1017/S0022112099005133
Wang, H., Lo Iacono, C., Wienberg, C., Titschack, J., and Hebbeln, D. (2019). Cold-water coral mounds in the southern Alboran Sea (western Mediterranean Sea): internal waves as an important driver for mound formation since the last deglaciation. Mar. Geol. 412, 1–18. doi: 10.1016/j.margeo.2019.02.007
Wefing, A. M., Arps, J., Blaser, P., Wienberg, C., Hebbeln, D., and Frank, N. (2017). High precision U-series dating of scleractinian cold-water corals using an automated chromatographic U and Th extraction. Chem. Geol. 475, 140–148. doi: 10.1016/j.chemgeo.2017.10.036
Wheeler, A. J., Beyer, A., Freiwald, A., de Haas, H., Huvenne, V. A. I., Kozachenko, M., et al. (2007). Morphology and environment of cold-water coral carbonate mounds on the NW European margin. Int. J. Earth Sci. 96, 37–56. doi: 10.1007/s00531-006-0130-6
White, M. (2007). Benthic dynamics at the carbonate mound regions of the Porcupine Sea Bight continental margin. Int. J. Earth Sci. 96, 1–9. doi: 10.1007/s00531-006-0099-1
White, M., and Dorschel, B. (2010). The importance of the permanent thermocline to the cold water coral carbonate mound distribution in the NE Atlantic. Earth Planet. Sci. Lett. 296, 395–402. doi: 10.1016/j.epsl.2010.05.025
White, M., Mohn, C., de Stigter, H., and Mottram, G. (2005). “Deep-water coral development as a function of hydrodynamics and surface productivity around the submarine banks of the Rockall Trough, NE Atlantic,” in Cold-Water Corals and Ecosystems, eds N. E. Atlantic, A. Freiwald, and J. M. Roberts, (Berlin: Springer), 503–514. doi: 10.1007/3-540-27673-4_25
Wienberg, C., Frank, N., Mertens, K. N., Stuut, J. B., Marchant, M., Fietzke, J., et al. (2010). Glacial cold-water coral growth in the Gulf of Cádiz: implications of increased palaeo-productivity. Earth Planet. Sci. Lett. 298, 405–416. doi: 10.1016/j.epsl.2010.08.017
Wienberg, C., and Titschack, J. (2017). “Framework-forming scleractinian cold- water corals through space and time: A late quaternary north Atlantic perspective,” in Marine Animal Forests: The Ecology of Benthic Biodiversity Hotspots, eds S. Rossi, L. Bramanti, A. Gori, and C. Orejas Saco del Valle, (Cham: Springer). doi: 10.1007/978-3-319-21012-4_16
Keywords: cold-water corals, Desmophyllum pertusum, tidal dynamics, food availability, coral growth, hydrodynamics, ecological interactions
Citation: Juva K, Flögel S, Karstensen J, Linke P and Dullo W-C (2020) Tidal Dynamics Control on Cold-Water Coral Growth: A High-Resolution Multivariable Study on Eastern Atlantic Cold-Water Coral Sites. Front. Mar. Sci. 7:132. doi: 10.3389/fmars.2020.00132
Received: 21 August 2019; Accepted: 18 February 2020;
Published: 19 March 2020.
Edited by:
Cristina Gambi, Marche Polytechnic University, ItalyReviewed by:
Marina Carreiro-Silva, Institute of Marine Research, NorwayLorenzo Angeletti, Institute of Marine Science, (CNR), Italy
Copyright © 2020 Juva, Flögel, Karstensen, Linke and Dullo. This is an open-access article distributed under the terms of the Creative Commons Attribution License (CC BY). The use, distribution or reproduction in other forums is permitted, provided the original author(s) and the copyright owner(s) are credited and that the original publication in this journal is cited, in accordance with accepted academic practice. No use, distribution or reproduction is permitted which does not comply with these terms.
*Correspondence: Katriina Juva, a2p1dmFAZ2VvbWFyLmRl