 Putu Liza Kusuma Mustika
 Muhammad Ichsan
 Hollie Booth
- 1College of Business, Law and Governance, James Cook University, Townsville, QLD, Australia
- 2Cetacean Sirenian Indonesia, Jakarta, Indonesia
- 3Wildlife Conservation Society Marine Program, Bogor, Indonesia
- 4EDGE of Existence Programme, The Zoological Society of London, London, United Kingdom
- 5Department of Zoology, The Interdisciplinary Centre for Conservation Science (ICCS), University of Oxford, Oxford, United Kingdom
As a hotspot of species diversity and fishing pressure, Indonesia is a global priority for the conservation of sharks, rays and their cartilaginous relatives (herein “sharks”). The high value marine tourism industry in Indonesia can create economic incentives for protecting and sustainably managing marine ecosystems and species, including sharks. This study estimates the economic value of shark and ray tourism in Indonesia and explores tourist preferences and local community perceptions of the tourism industry to understand the current and potential future role of this industry in shark and ray conservation. We identified 24 shark tourism hotspots across 14 provinces, with primary data collected from 365 tourists and 84 local community members over six case study sites. We use Purchasing Power Parity (PPP) and travel efforts to extrapolate expenditures to other tourism sites. We estimate that at least 188,931 dedicated or partially dedicated shark tourists visit Indonesia each year. The median annual expenditures of these shark tourists is estimated at USD 22 million (for 2017), accounting for at least 7% of the total USD 1 billion marine tourism revenue in Indonesia in 2017 and 1.45× the value of annual shark exports in the country (inflation-adjusted to 2017 values). If sharks were absent from the surveyed sites, Indonesia’s tourism industry could lose ∼25% of these dive tourist expenditures. Despite this considerable value, our study indicates a mismatch between the absolute economic value of shark and ray tourism and its role in providing an incentive for conservation. Results from interviews with local communities in or near shark and ray tourism sites indicate that shark fishers are not well placed to receive direct economic benefits from shark and ray tourism. Since overfishing is the primary threat to shark populations, failure to engage with and appropriately incentivize these stakeholders will be detrimental to the success of Indonesia’s shark conservation efforts. If shark populations continue to decline due to insufficient conservation actions, the tourism industry could suffer economic losses from shark and ray tourism of more than USD 121 million per annum by 2027, as well as detrimental impacts on species, marine ecosystems, fisheries and people.
Introduction
Sharks, rays and their cartilaginous relatives (class Chondrichthyes, herein “sharks”) are one of the most threatened species groups in the world (Dulvy et al., 2014). This elevated extinction risk is primarily the result of high levels of fishing mortality in both targeted and by-catch fisheries, coupled with conservative life history traits, which makes many shark species vulnerable to overfishing (Worm et al., 2013; Dulvy et al., 2014). Growing international demand for a range of shark-derived consumer products, notably shark fins, place escalating direct pressure on populations and species. It is estimated that more than 100 million sharks are killed in fisheries each year. This is considered unsustainable for most species and populations, and likely explains declines in global capture production over the past decade (Worm et al., 2013; Davidson et al., 2016).
Acknowledging the escalating pressures on sharks, several international policy measures have been enacted to drive improvements in species protection and stock management. These measures include regulations on fishing and international trade of several species under the Convention on International Trade in Endangered Species of Wild Fauna and Flora (CITES), the Convention on Migratory Species (CMS) and various Regional Fisheries Management Organizations (RFMOs). However, in order to bring about much-needed reductions in shark fishing mortality, these international policies need to translate into management action at national and local levels, particularly management actions that influence fisher behavior, and directly reduce targeting and/or retention of sharks in fisheries (Booth et al., 2019).
Creating systems and incentives for implementing shark conservation at the local level is challenging, in part because commercial exploitation and trade of sharks generates considerable economic value and employment opportunities in major shark fishing nations, such as Indonesia. For example, the annual export value of shark products from Indonesia is reportedly around USD 10 million (Dent and Clarke, 2015), while the landed value of sharks is estimated to be USD 68 million per year (Cisneros-Montemayor et al., 2013). These values also do not fully capture the flow-on economic benefits of employment in capture fisheries and processing, which may be significant. Furthermore, high volumes of sharks are caught incidentally or as valuable secondary catch in small-scale, mixed-species tropical fisheries, which contribute to food security in poor and developing nations (Dulvy et al., 2017). Currently, instruments and incentives to drive adoption of sustainable fishing and by-catch mitigation strategies are lacking (e.g., Milner-Gulland et al., 2018). Innovative approaches must be developed to create change in the fishing industry, across small-scale and commercial sectors, and targeted and by-catch fisheries, in order to achieve conservation outcomes for sharks.
Sustainable tourism is often promoted as a win-win solution to the world’s environmental and socio-economic challenges, thus tourism valuations are often used to convince policy makers to prioritize conservation of ecosystems and wildlife (Balmford and Whitten, 2003; O’Malley et al., 2013; Spalding et al., 2017; Tamayo et al., 2018). By estimating the economic value of non-consumptive wildlife-watching or photographic tourism, we can draw comparisons of this value to those of consumptive use (Vianna et al., 2018).
With a rapidly growing global market for diving and marine-based tourism, shark and ray tourism can generate considerable economic value and has been estimated to engage at least 500,000 people annually (Topelko and Dearden, 2005; Cisneros-Montemayor et al., 2013; O’Malley et al., 2013). In some cases, estimated tourism values are significantly greater than the values associated with harvesting wild populations (O’Malley et al., 2013). If appropriate financial and management institutions are in place, this tourism value can generate funding to directly support conservation action, such as the management and enforcement of marine protected area regulations (Vianna et al., 2018). It can also provide auxiliary income to destination countries and communities through tax revenue and expenditure on accommodation, food and transport (Vianna et al., 2012). Such valuations and comparisons are often used to persuade decision-makers to prioritize conservation. However, the degree to which tourism incomes are channeled into conservation of threatened taxa can be highly context dependent (Buckley et al., 2012; Steven et al., 2013).
As a hotspot of both species diversity and fishing pressure, Indonesia is a global priority for shark conservation (Bräutigam et al., 2015). Indonesia is also a major global destination for marine-based tourism. It boasts an annual market of at least 200 million international and domestic tourists per year, and an estimated 18 million of these are associated with marine and/or reef-based trips (Spalding et al., 2017), which brings in a total annual revenue of at least USD 1 billion per year (Fauzi, 2017). With more than 20 well-established diving destinations throughout the country, shark tourism has the potential to generate considerable economic value in Indonesia, and contribute to GDP growth and the achievement of sustainable development goals (SGDs). Indeed, previous studies on shark and ray tourism expenditures have estimated values between USD 4 million (2011 mean value (Cisneros-Montemayor et al., 2013) and USD 10.6 million (2012 total expenditure median value for manta ray tourism; O’Malley et al., 2013) per year for Indonesia. However, the degree to which this value is directed into creating conservation outcomes for sharks, and the mechanisms by which it does or could take place (e.g., through funding management or creating incentives for mitigating shark fishing mortality), are unclear.
Acknowledging these issues and needs, this study expands upon previous economic valuations of shark and ray tourism in Indonesia (i.e., Cisneros-Montemayor et al., 2013; O’Malley et al., 2013). We apply a more comprehensive method by collecting primary data collection on tourist expenditures, as well as using a novel method to extrapolate across sites. In doing do, we aim to develop a broad national overview of the status of shark tourism, and its estimated economic value in Indonesia. We also go further than previous studies by building an understanding of the perspectives of different groups involved in shark tourism (tourism operators, tourists, and shark fishers), and possible mechanisms by which shark tourism either does or could contribute to achieving conservation outcomes.
Materials and Methods
We adopted a mixed-methods approach to data collection and analysis, using both quantitative and qualitative methods. This approach includes a preliminary literature review to gather broad national-level data, combined with targeted field-based primary data collection in several case study sites to gather more detailed qualitative and quantitative data.
Literature Review
Scoping
We conducted a preliminary assessment of the size and distribution of the shark tourism sector in Indonesia based on available data. We identified all known and potential sites for shark tourism based on (a) a review of published literature, (b) internet searches using key words e.g., “shark diving Indonesia,” “shark trips Indonesia,” “shark operations Indonesia,” “shark photography Indonesia,” “shark encounters Indonesia,” and (c) expert opinion and anecdotal information. We define shark and ray tourism sites as locations where recreational activities (such as scuba diving, snorkeling and boat trips) are undertaken to view sharks in their natural habitat without the intention to harm them. We only included sites with established commercial operations for said recreational activities, and where sharks are explicitly marketed as an attraction (e.g., on websites, brochures, blogs). These methods are consistent with other tourism valuation studies for sharks (Anderson et al., 2011; Gallagher and Hammerschlag, 2011; O’Malley et al., 2013).
This preliminary scoping identified 24 shark tourism sites (Figure 1), which varied across a wide range of inter-related characteristics, such as: geographic location, accessibility/travel effort, focal species as tourist attraction, available tourism activities (e.g., scuba diving, snorkeling, boat-based watching), seasonality and level of development of site/province.
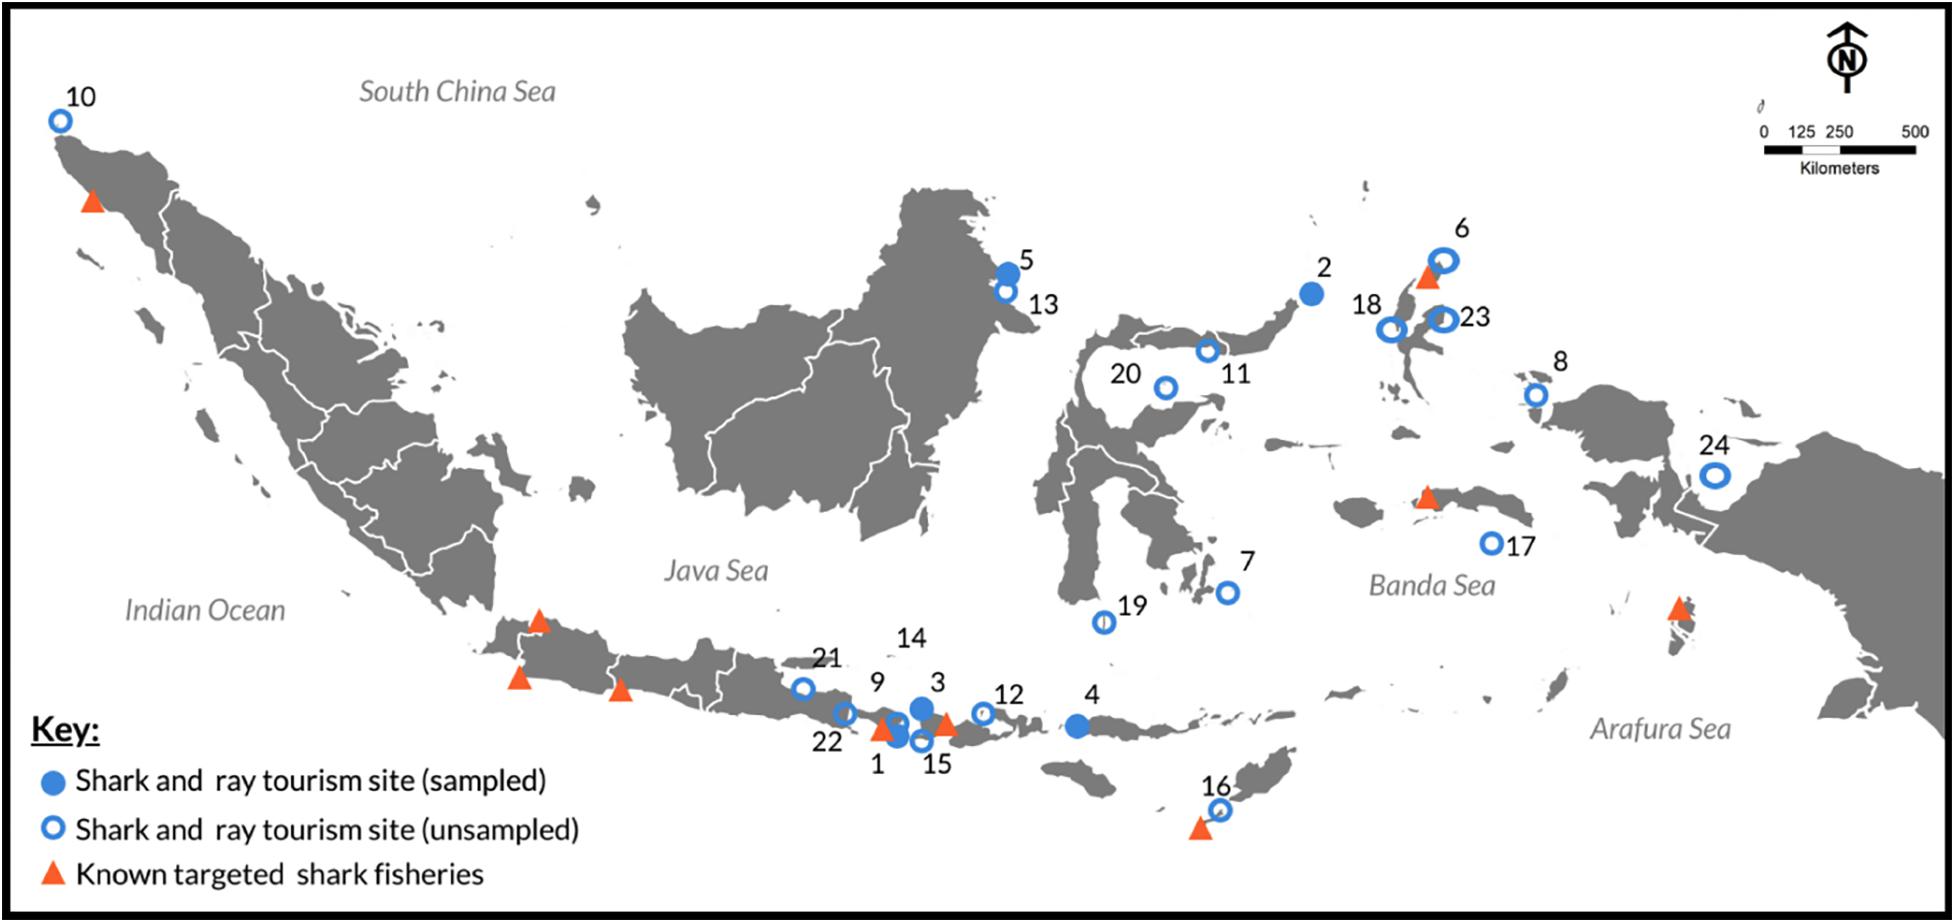
Figure 1. Shark and ray tourism sites included in this study (numbers correspond to site names in Table 4A) alongside known targeted shark fisheries based on published literature (Blaber et al., 2009; Fahmi and Dharmadi, 2015; Jaiteh et al., 2017).
Dive Operator Online Survey
We conducted a national-level online survey of dive operators via Survey Monkey (Supplementary Information) to obtain data on tour operations (including types of activities, prices, numbers of trips, and seasonality), business profiles and projections, the perceived importance of sharks for tourism, and the benefits of tourism operations for local people and the economy. We circulated the survey via email using contact details obtained during the scoping phase and by referral. During June-August 2017, we emailed 169 dive centers where 33 of them responded to the survey (19.5% response rate). Of these respondents, only 14 operators specified their area of operation. These 14 companies operate across four provinces: Bali (n = 7), West Nusa Tenggara (n = 2), East Nusa Tenggara (n = 2) and North Sulawesi (n = 3). We obtained province-specific estimations of shark tourism from these 14 sites.
Case Study Selection
A case study approach was adopted for primary data collection, combined with a meta-analytical benefit-transfer method for interpolating values to non-surveyed sites and extrapolating values to the national-level (Richardson et al., 2015). Benefit transfer is defined as “the transfer of original value estimates from an existing “study site” or multiple study sites to an unstudied “policy site” with similar characteristics that is being evaluated” (Richardson et al., 2015, p. 52). This method was deemed necessary because conducting a nation-wide survey of all tourism sites was unfeasible, yet local context is critical to understanding value of ecotourism and the role of a given site in achieving conservation outcomes (Balmford and Whitten, 2003).
To select case studies for primary data collection, the identified sites were grouped according to different case types, based on characteristics that might influence their role and relative value in the tourism industry, such as accessibility/travel effort from major airports in Indonesia, focal species for tourism attraction, and size of tourism industry. Practicality and seasonality were also taken in to consideration for selecting the final research sites. Out of the 24 sites (Figure 1), six sites were selected for primary data collection (Table 1). Values from these six sites were later transferred to other non-sampled sites to arrive at a national estimate of the economic benefits of shark and ray tourism.
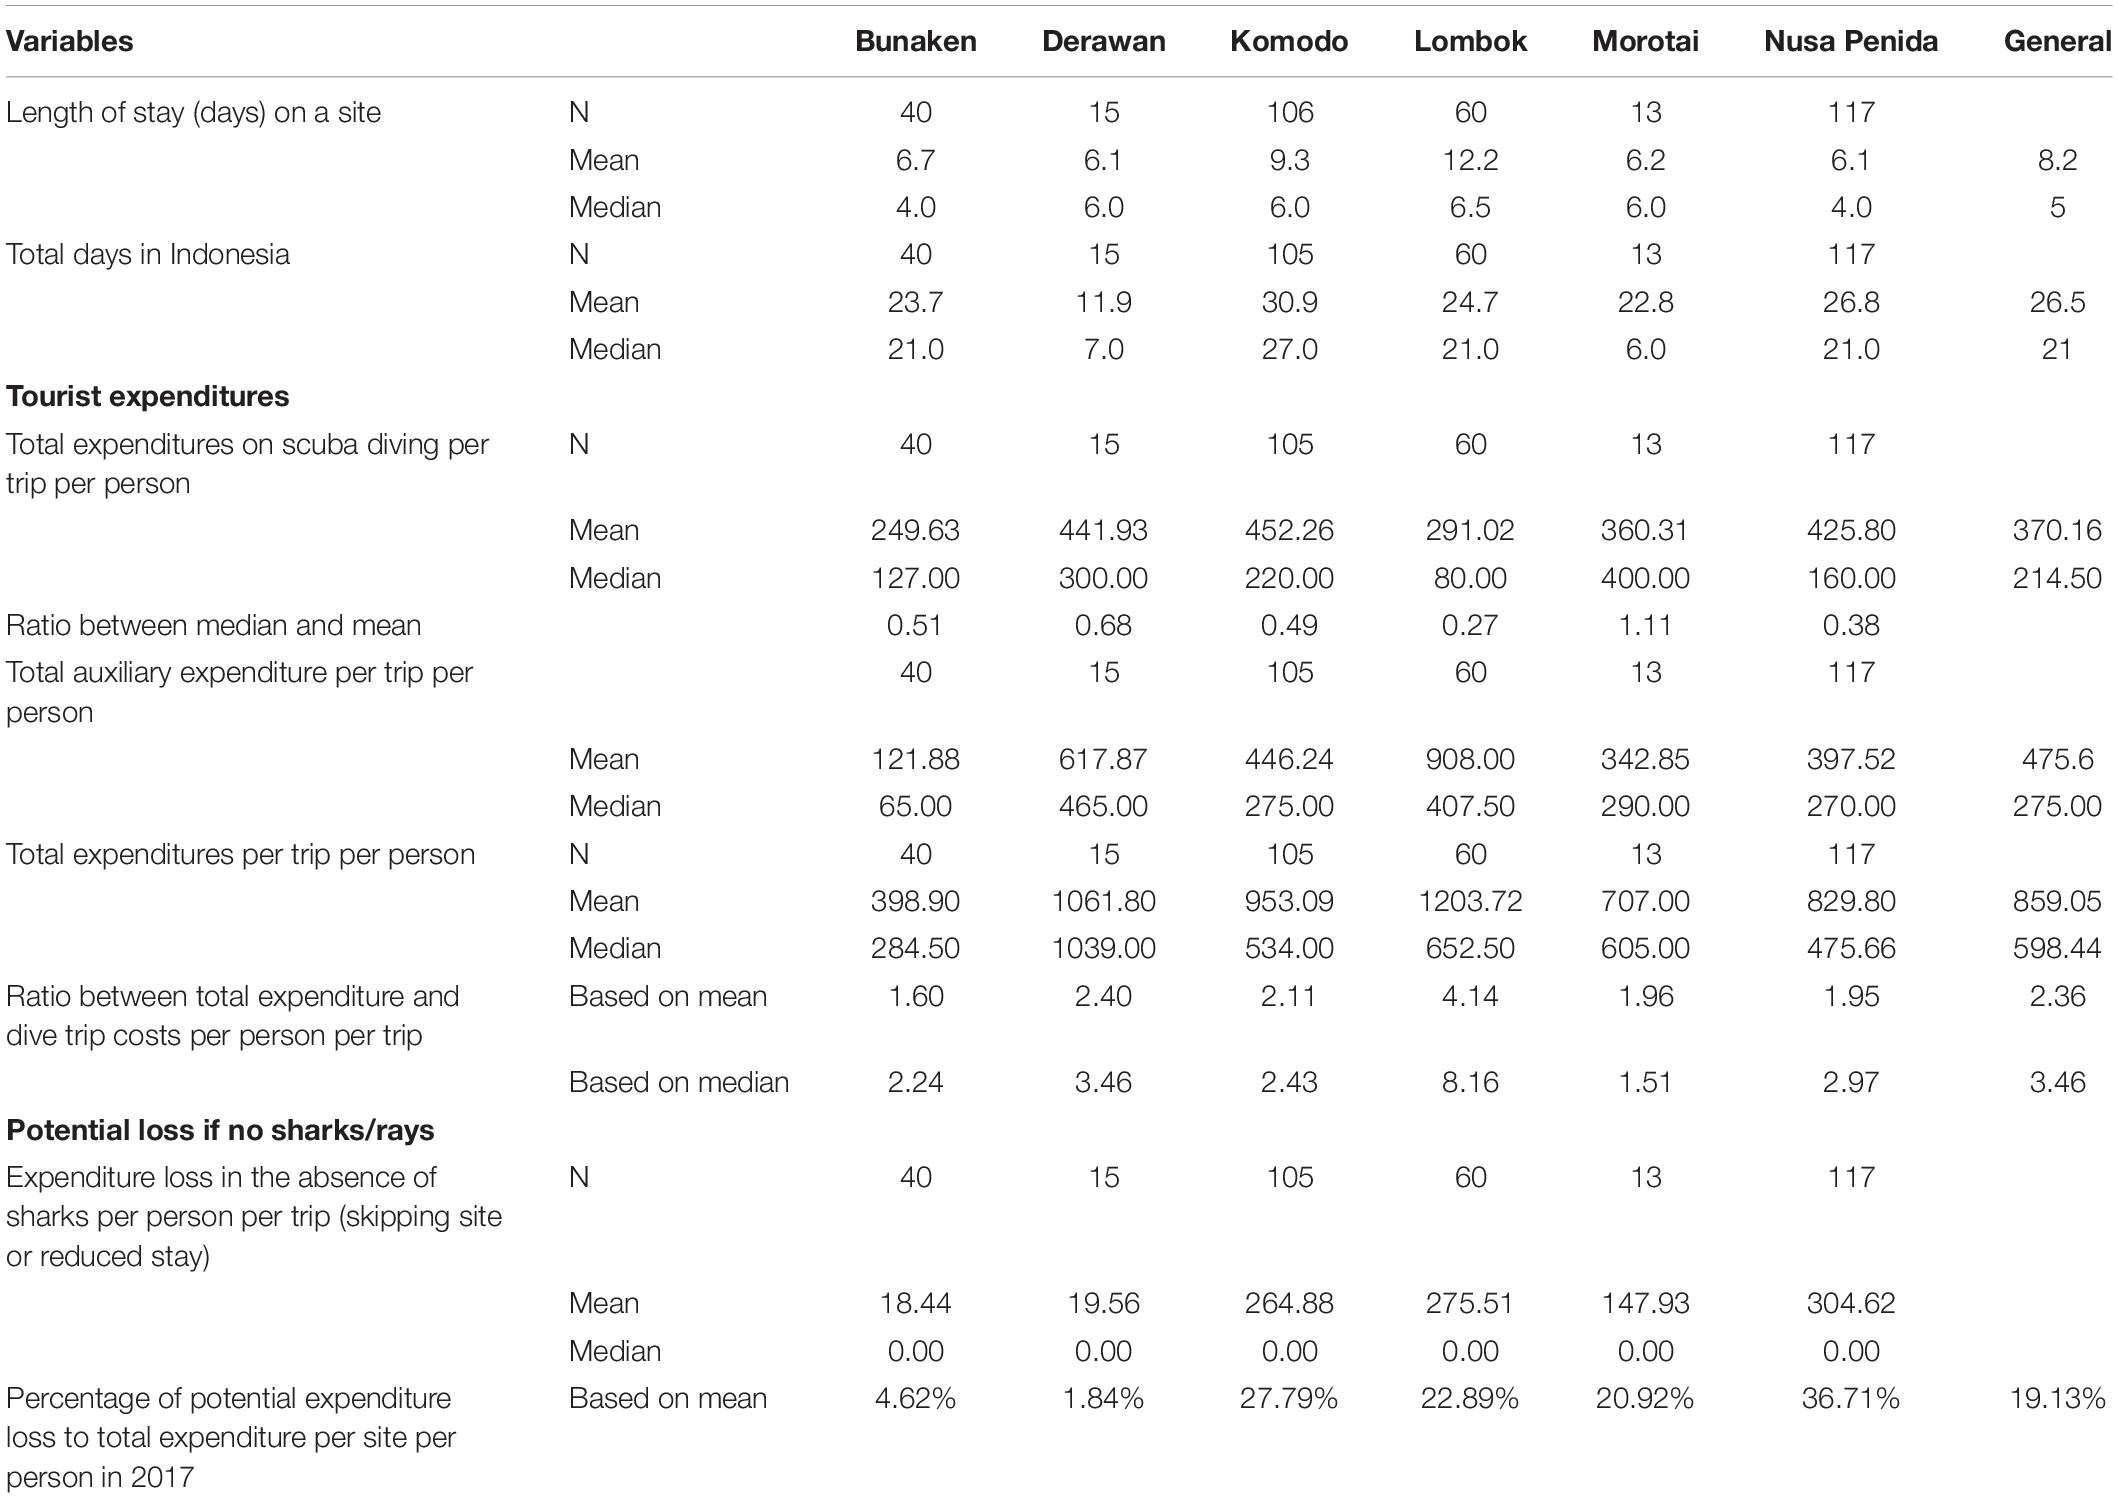
Table 1. Visitor expenditures across six sampled sites (USD, 2017).
Site-Based Data Collection
Tourist Questionnaires Design and Distribution
A total of 24 shark tourism sites were identified in the scoping phase (Figure 1). A site in its infancy in terms of tourism development (Saleh Bay, West Nusa Tenggara) was excluded from our list. We surveyed tourists in six case study sites using interviewer-assisted questionnaires (Supplementary Information), i.e., Nusa Penida (Bali), Labuan Bajo (Flores, East Nusa Tenggara), Morotai (North Maluku), Bunaken (North Sulawesi), Gili Matra (Lombok), and Derawan (East Kalimantan). We specifically targeted tourists who had already been on a shark or ray tourism activity during their stay (herein “shark tourists”). The tourist questionnaires were divided into demographic questions, economic questions and tourist experience questions. Questions focused in particular on direct tourist expenditures (Stoeckl et al., 2010; Mustika et al., 2012), the perceived importance of sharks for their trip, and their overall trip experience and satisfaction.
Dive-related expenditures are classified as “primary direct expenditures” (after Mustika et al., 2012), of which values were obtained from the tourists themselves (in terms of cost per day per person and how many days they dived). We also asked each tourist how much their expenditures were per person per day on food and drinks, accommodation, communication (internet, phone, phone credit, SIM card), souvenirs, local transportation (vehicle rental, taxi, etc.) and other expenditures (which they had to specify). If the tourists came to the site with a package tour, we asked them to specify how much they paid for the total package. We identify these items as “auxiliary direct expenditures” (after Mustika et al., 2012), or “auxiliary expenditures” for brevity.
An important concept in this study is the hypothetical loss of income a site might suffer in the absence of sharks. This hypothetical loss is measured by expenditures attributable to sharks and/or rays sharks and/or rays spent by tourists who came to a location mainly due to see sharks and/or rays (based on Stoeckl et al., 2010; D’Lima et al., 2016; Mustika et al., 2018). To estimate the attributable expenditures, we asked tourists to state the hypothetical number of days they would have spent in a site if it wasn’t possible to see sharks. Tourists who stated that they would not come to the site in the absence of sharks/rays are classified as “dedicated shark tourists.” Tourists who stated that they would reduce their trip length in the absence of sharks/rays are classified “partially dedicated shark tourists.” The expenditures from dedicated and partially dedicated shark tourists make up the expenditures that are attributable to sharks.
We asked each tourist how important the chance of seeing sharks/rays was in their decision to come to the site (Likert scale of five points from -2 to 2). With regards to tourist experience, we gathered data on overall satisfaction levels with sharks and/or ray tourism activities (Likert-like scale of 1–10) and their likelihood of re-joining the trip in the future and recommending the trip to a friend (Likert scale of five points from -2 to 2), as these are established indicators of customer satisfaction and value (Mustika et al., 2013). We also asked tourists to rank their favorite marine animals to encounter from a range of options (i.e., whale shark, reef shark, manta ray, devil ray and sting ray), and gauged perceptions of crowding through questions relating to the number of other tourists in the area during the shark/ray tourism activity.
Respondents were approached on the street, or in hotels and dive shops, with questionnaires available in both English and Bahasa Indonesia. Data was collected by a team of six trained enumerators, fluent in both English and Bahasa Indonesia. The enumerators were accompanied by a field coordinator, who assisted with approaching tour operators and facilitated interactions with tourists. Between May and July 2017, 365 tourist questionnaires were completed across the six case study locations, i.e., Nusa Penida (Bali, n = 121), Labuan Bajo (Flores, East Nusa Tenggara, n = 111), Morotai (North Maluku, n = 13), Bunaken (North Sulawesi, n = 40), Gili Matra (Lombok, n = 65) and Derawan (East Kalimantan, n = 15).
Fisher Questionnaires
We used interviewer-assisted questionnaires to survey local fishers living in/nearby the shark tourism sites to understand their livelihood options, fishing practices, and role in/perceptions of the tourism industry. Questions asked related to demographic information, financial dependency (e.g., household size and the presence of other bread-winners), the involvement of their household in the tourism industry, their willingness or desire to be involved in the tourism industry, their fishing activities, and the contribution of shark and/or ray fisheries to their income.
During May-July 2017 a total of 84 fishers questionnaires were completed across six locations: Nusa Penida (Bali, n = 18), Labuan Bajo (Flores, East Nusa Tenggara, n = 22), Morotai (North Maluku, n = 11), Bunaken (North Sulawesi, n = 15), Gili Matra (Lombok, n = 4) and Derawan (East Kalimantan, n = 6). Each fisher survey was conducted in villages adjacent to the tourist site. Surveys were conducted in Bahasa Indonesia by a team of six trained Indonesian enumerators.
Analysis
The Economic Benefits
We combined field- and desk-based data to estimate current and future annual economic value of shark and ray tourism in Indonesia through the following steps:
1) estimating total annual shark visitor expenditures based on tourist dive expenditures and auxiliary expenditures (meals, accommodation, local transportation, souvenirs, and communication) for the six sampled sites;
2) estimating the proportion of tourist expenditures directly attributable to the presence of sharks based on hypothetical tourism days lost if sharks were absent for the six sampled sites;
3) extrapolating the tourist expenditures from sampled sites to the national level using a benefit transfer approach (Richardson et al., 2015) to assign proxy values from the six sampled sites to the eighteen unsampled sites;
4) extrapolating future economic values based on tourism growth projections and percentage of attributable expenditures.
We estimated the number of shark tourists based on data from sampled operators. We use the national-level mean and median numbers of shark tourists for provinces that have no sampled-operators. The numbers are from sampled sites with the same travel effort characteristics to the unsampled sites. For instance, for an unsampled site with medium travel effort, we used the number of tourists from a sampled site with medium travel effort.
Each site’s annual total tourist expenditures are composed of the primary (dive-related) expenditures and the auxiliary direct expenditures multiplied by the number of days per trip per tourist, and the estimated number of tourist per site per annum. We estimated total annual tourist expenditures per case study site based on the number of dive operators per site, the estimated number of visitors per operator per year, and estimated tourist expenditures per person per trip (Tables 2, 3). We did not include airfares in the calculation of tourist expenditures.
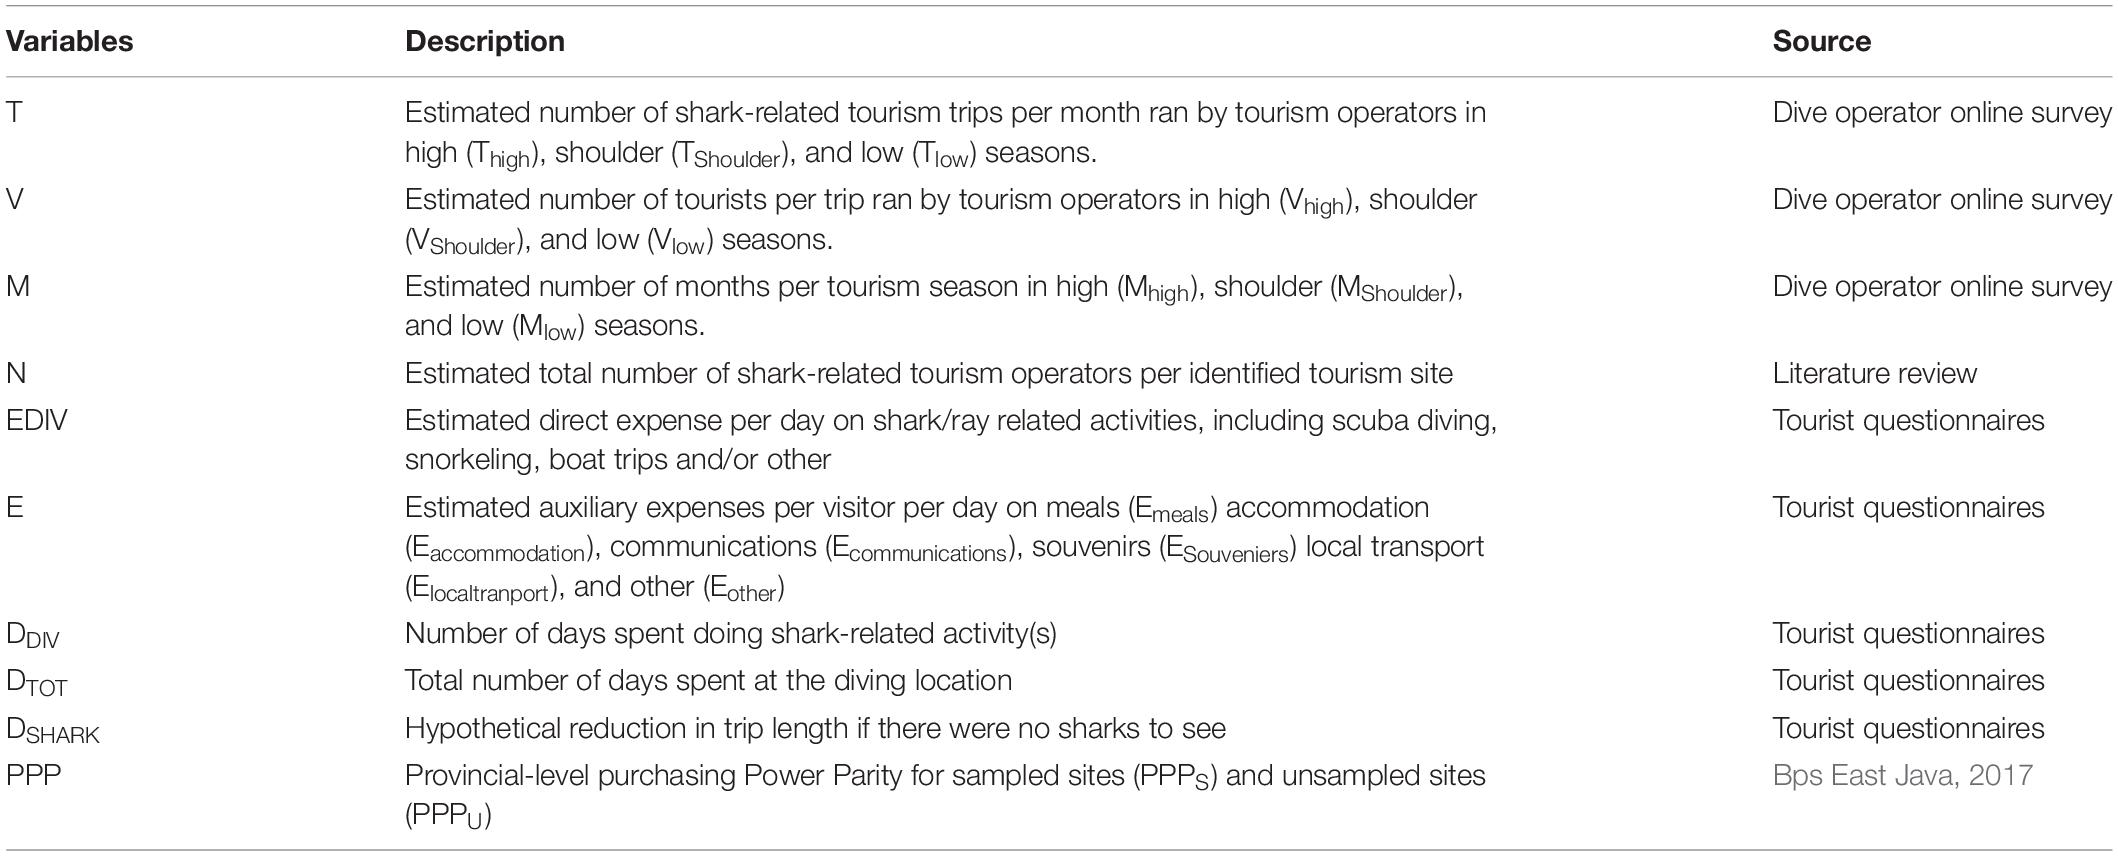
Table 2. Description of constants and parameters used to estimate revenue generated by shark and ray tourism in Indonesia.
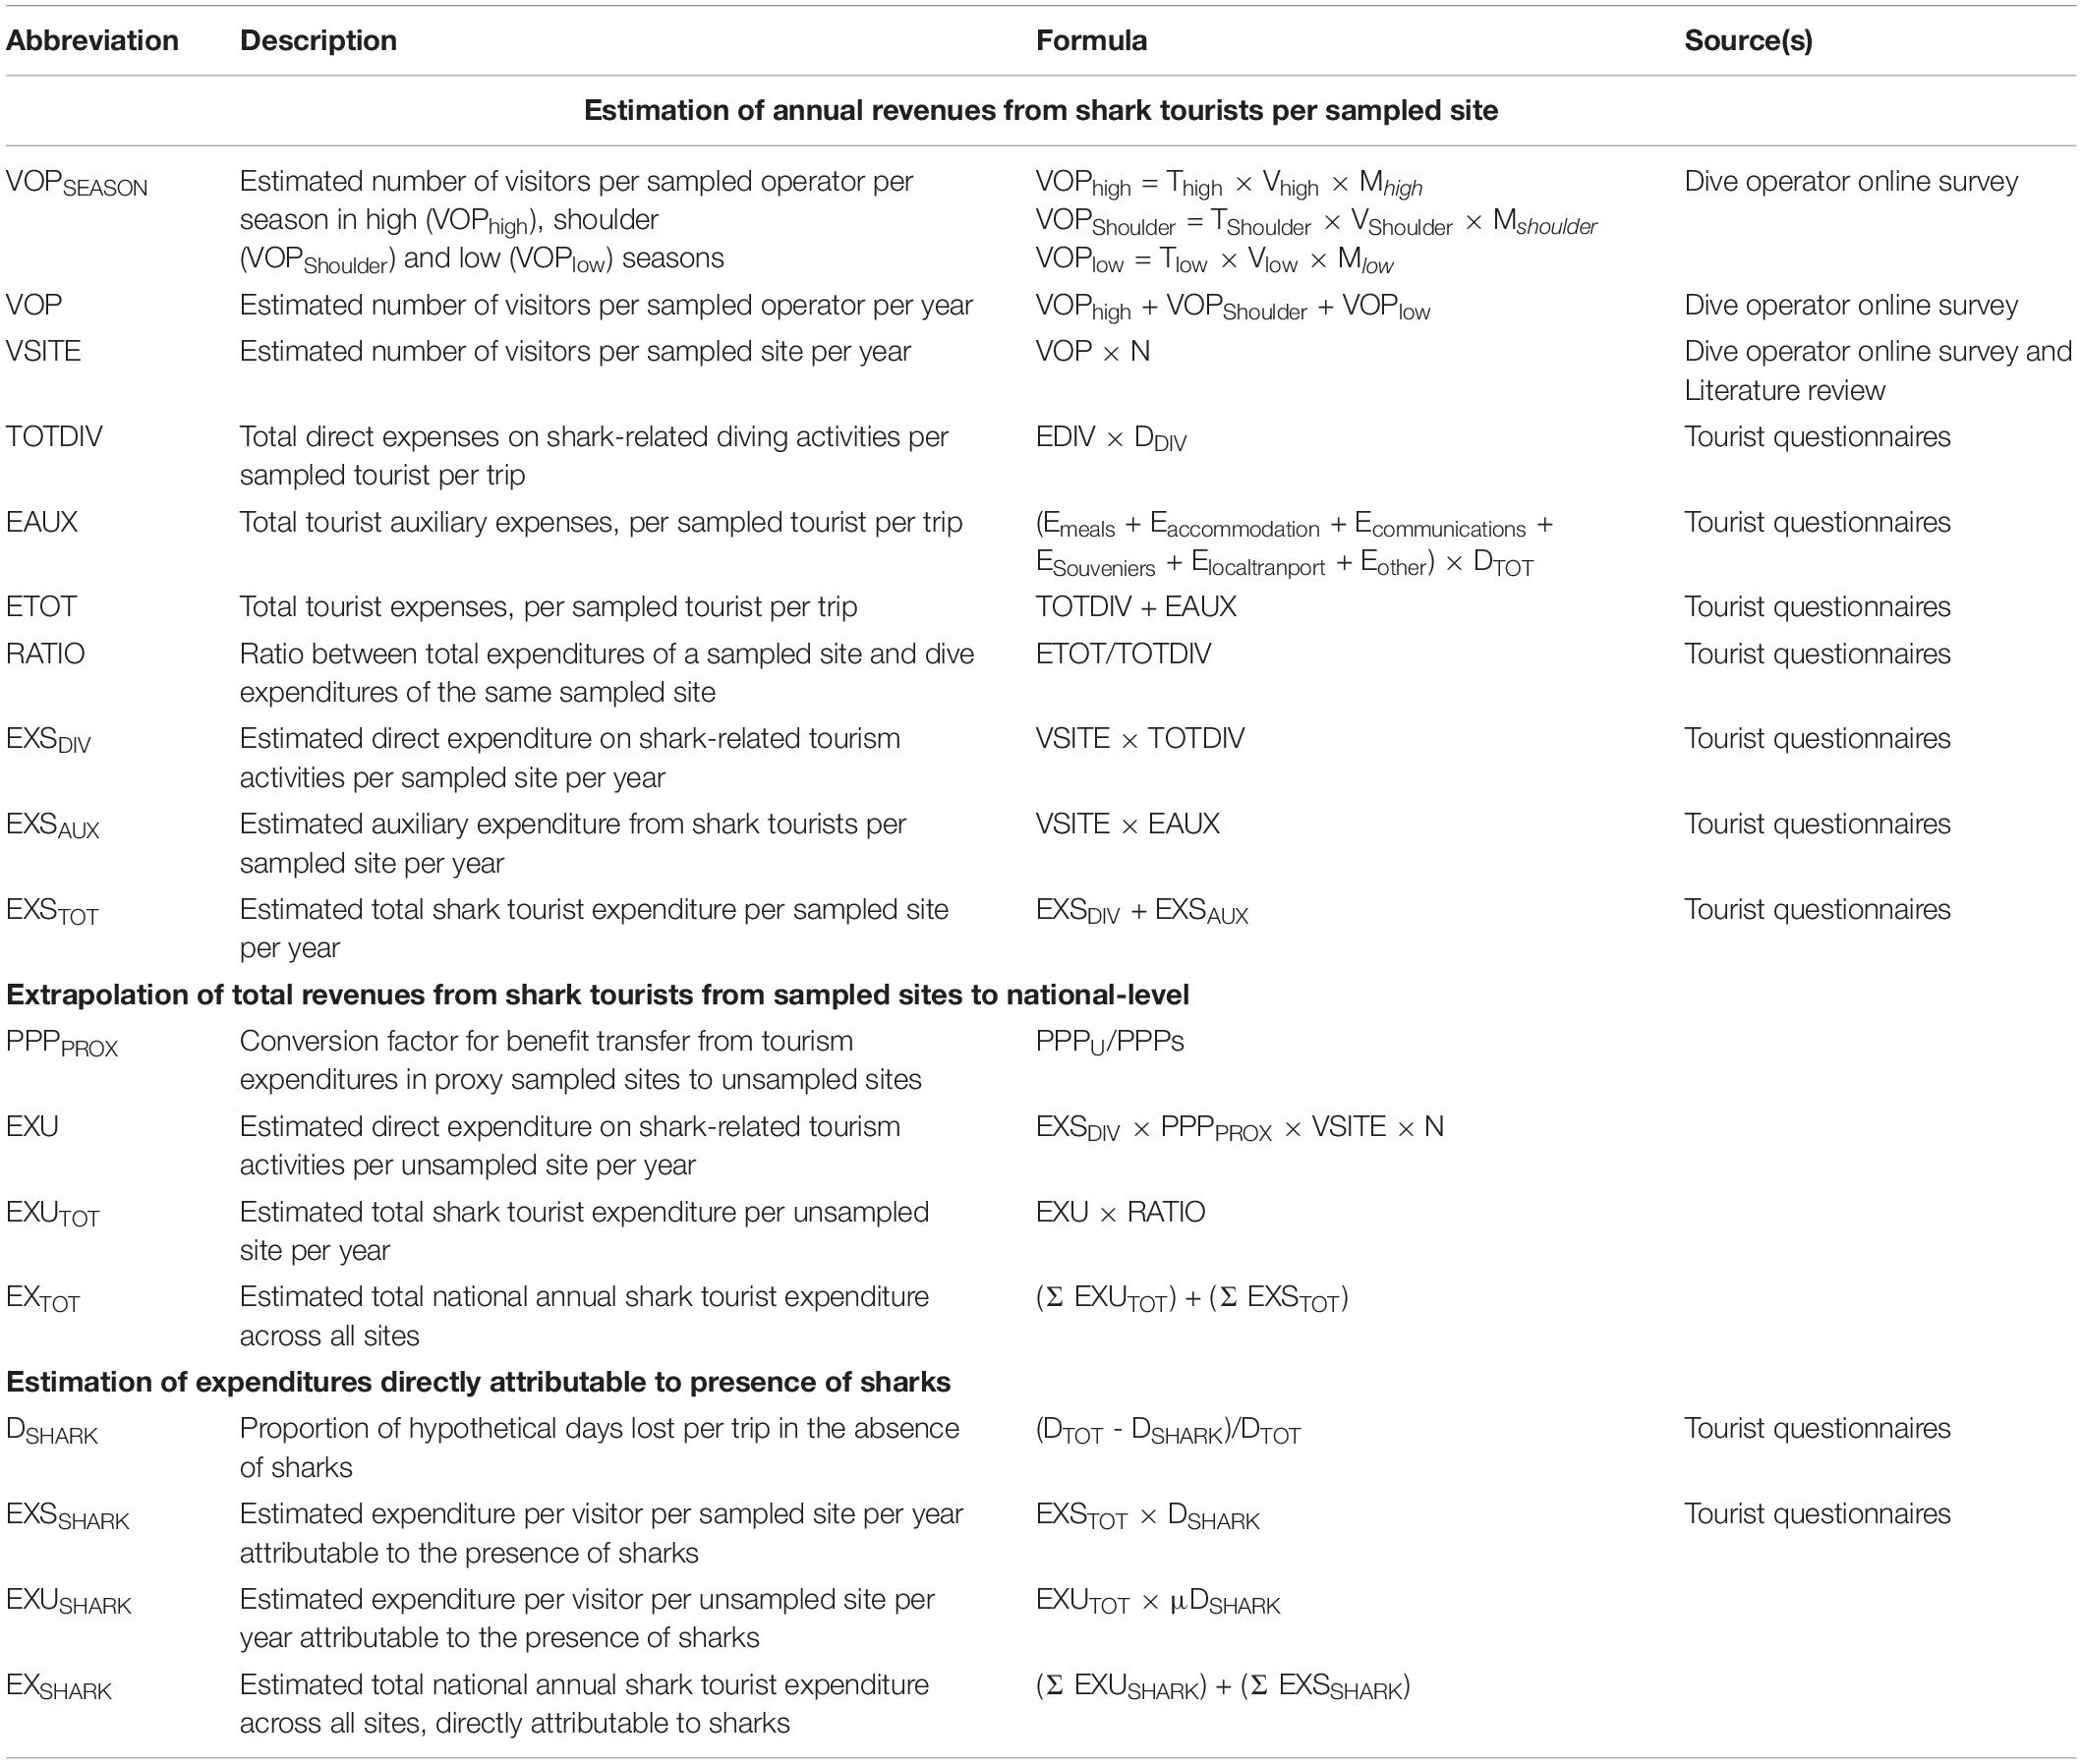
Table 3. Formula used to calculate the economic value of revenues from shark and ray tourism in Indonesia.
Spatial and temporal scales are important considerations in choosing variables used in benefit transfer (Richardson et al., 2015). Particularly for a vast country like Indonesia, spatial variability needs to be taken into account when extrapolating the expenditures of sampled sites to the national level. To that end, we used two spatial variables as indicators for identifying suitable proxy values: travel effort as an indicator for assigning a proxy for number of visitors, and Purchasing Power Parity (PPP) as an indicator for assigning a proxy for unit expenditure.
The travel efforts were divided into three categories based on the site’s access to international airports (Table 4A):
1) Low travel efforts (three sites with direct access to international airports, such as Bali).
2) Medium travel efforts (eight sites within one domestic flight connection from an international airport or reachable within 1 day of travel from an international airport).
3) High travel efforts (13 sites that need more than one domestic flight connection from an international airport or reachable more than 1 day of travel from an international airport).
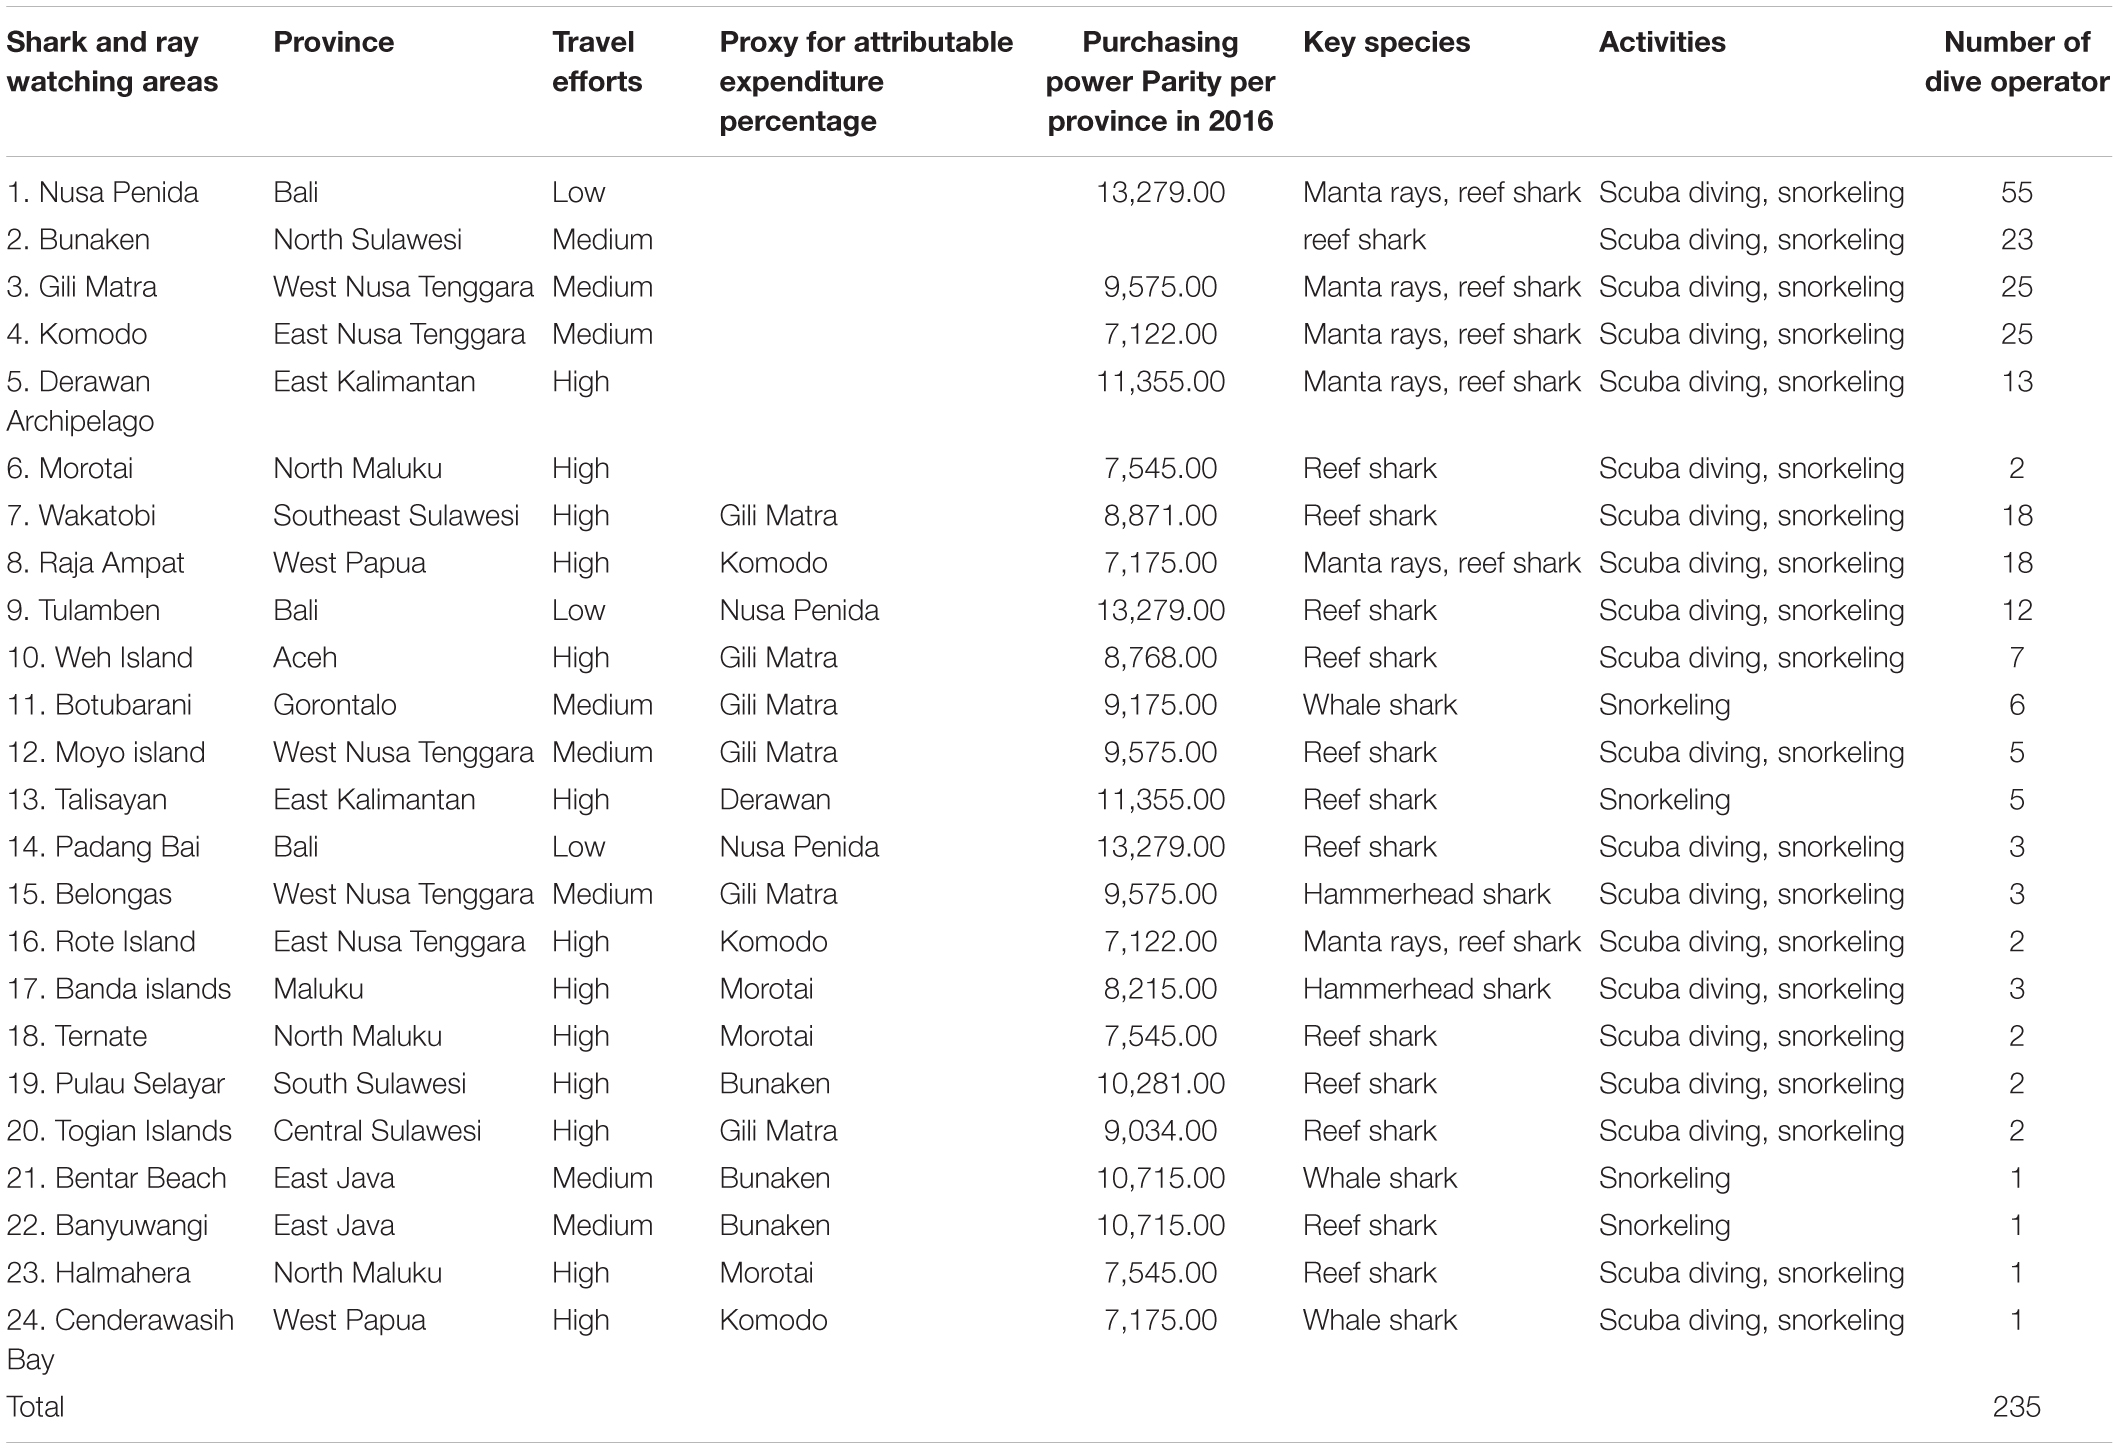
Table 4A. Estimated annual shark and ray expenditures (USD) for 235 dive operators in Indonesia.
We considered three variables to be selected as an indicator or a proxy of expenditure per tourist from the sampled sites to the unsampled sites. Since we sought to assign sites with comparable costs per person, we considered Consumer Price Index (CPI), PPP or the local minimum wages as the proxy. CPI is “a measure that tracks changes in the cost of a basket of goods and services purchased” by a typical household (Karjan et al., 2020, p. 287). CPI captures temporal changes in the cost of goods and service and, in general, changes in the average cost of living. PPP is a theory that “purchasing power in different countries should be the same when stated in a common currency,” but it almost never holds exactly (Karjan et al., 2020, p. 473). Substantially different prices are often observed between countries (a dollar in India purchases more goods than a dollar in Australia) and also within a country (a dollar in Bali might purchase very little compared to a dollar in a village in Central Java, though both are in Indonesia). Since PPP also applies to the within-country setting, Indonesia has a PPP index for every province in the country.
We chose PPP as the most suitable indicator, since CPI is a temporal comparison that represents inflation (Karjan et al., 2020), while minimum wage is influenced by political decisions. We used PPP per province from 2016 (Bps East Java, 2017) to identify the most suitable sampled sites as proxies for expenditure in non-sampled sites. For each non-sampled site, we identified a PPP among the six sampled sites that is closest to the unsampled site’s PPP. We then used the mean and median dive expenditures (EDIV) from the matched sampled site as proxies for the non-sampled sites. We included the ratio between the PPP of the unsampled site and the PPP of the sampled site as a correction factor for the expenditures of unsampled sites (PPPS, PPPU, and PPPPROX, Tables 2, 3).
The auxiliary expenditures of sampled sites were calculated based on data on actual expenditure of tourists visiting those sites (EAUX in Table 3). For non-sampled sites, auxiliary expenditures from sampled sites were not used because of the risk of over-estimating the total expenditures. In particular, Gili Matra (West Nusa Tenggara) has a very high auxiliary expenditure (Table 1). Because Gili Matra is a proxy for expenditures for six non-sampled locations (Wakatobi, Weh Island, Botubarani, Moyo, Belongas, and Togian Island – see also Table 4A “Proxy” and “Purchasing Power Parity” columns), using the real auxiliary expenditures of Gili Matra for the six locations will likely to inflate the estimated total expenditures. Thus, we use the ratio of total expenditures of sampled sites and dive expenditures of sampled sites (RATIO in Table 3) to arrive at the total expenditures of unsampled sites (EXUTOT in Table 3).
We then summed the total tourist expenditures across all sites (EXSTOT for sampled sites and EXUTOT proxies for unsampled) to estimate annual tourist expenditure per year for the whole of Indonesia (EXTOT) based on number of visitors per operator per year (from dive operator online survey) and number of operators per site (from desk-based research) (Tables 2, 3). As a proxy for potential income loss, we used the ratio between hypothetical number of days lost in the absence of sharks/rays in that site and the actual trip length at the same site (DSHARK in Table 3) to generate hypothetical expenditure loss (called “attributable expenditures,” EXSHARK in Table 3) from the shark tourism industry. To make it easier for readers, we only report the attributable expenditures in the Result, although we still report the non-attributable dive and total expenditures in Tables 4B,C. We did not use the importance of sharks in site selection to determine attributable expenditures because we considered numbers (hypothetical days of stay without sharks/rays) as the more reliable variable, but we used this variable for tourist satisfaction analysis (see section Determinants of Tourist Satisfaction and Motivation to Visit.).
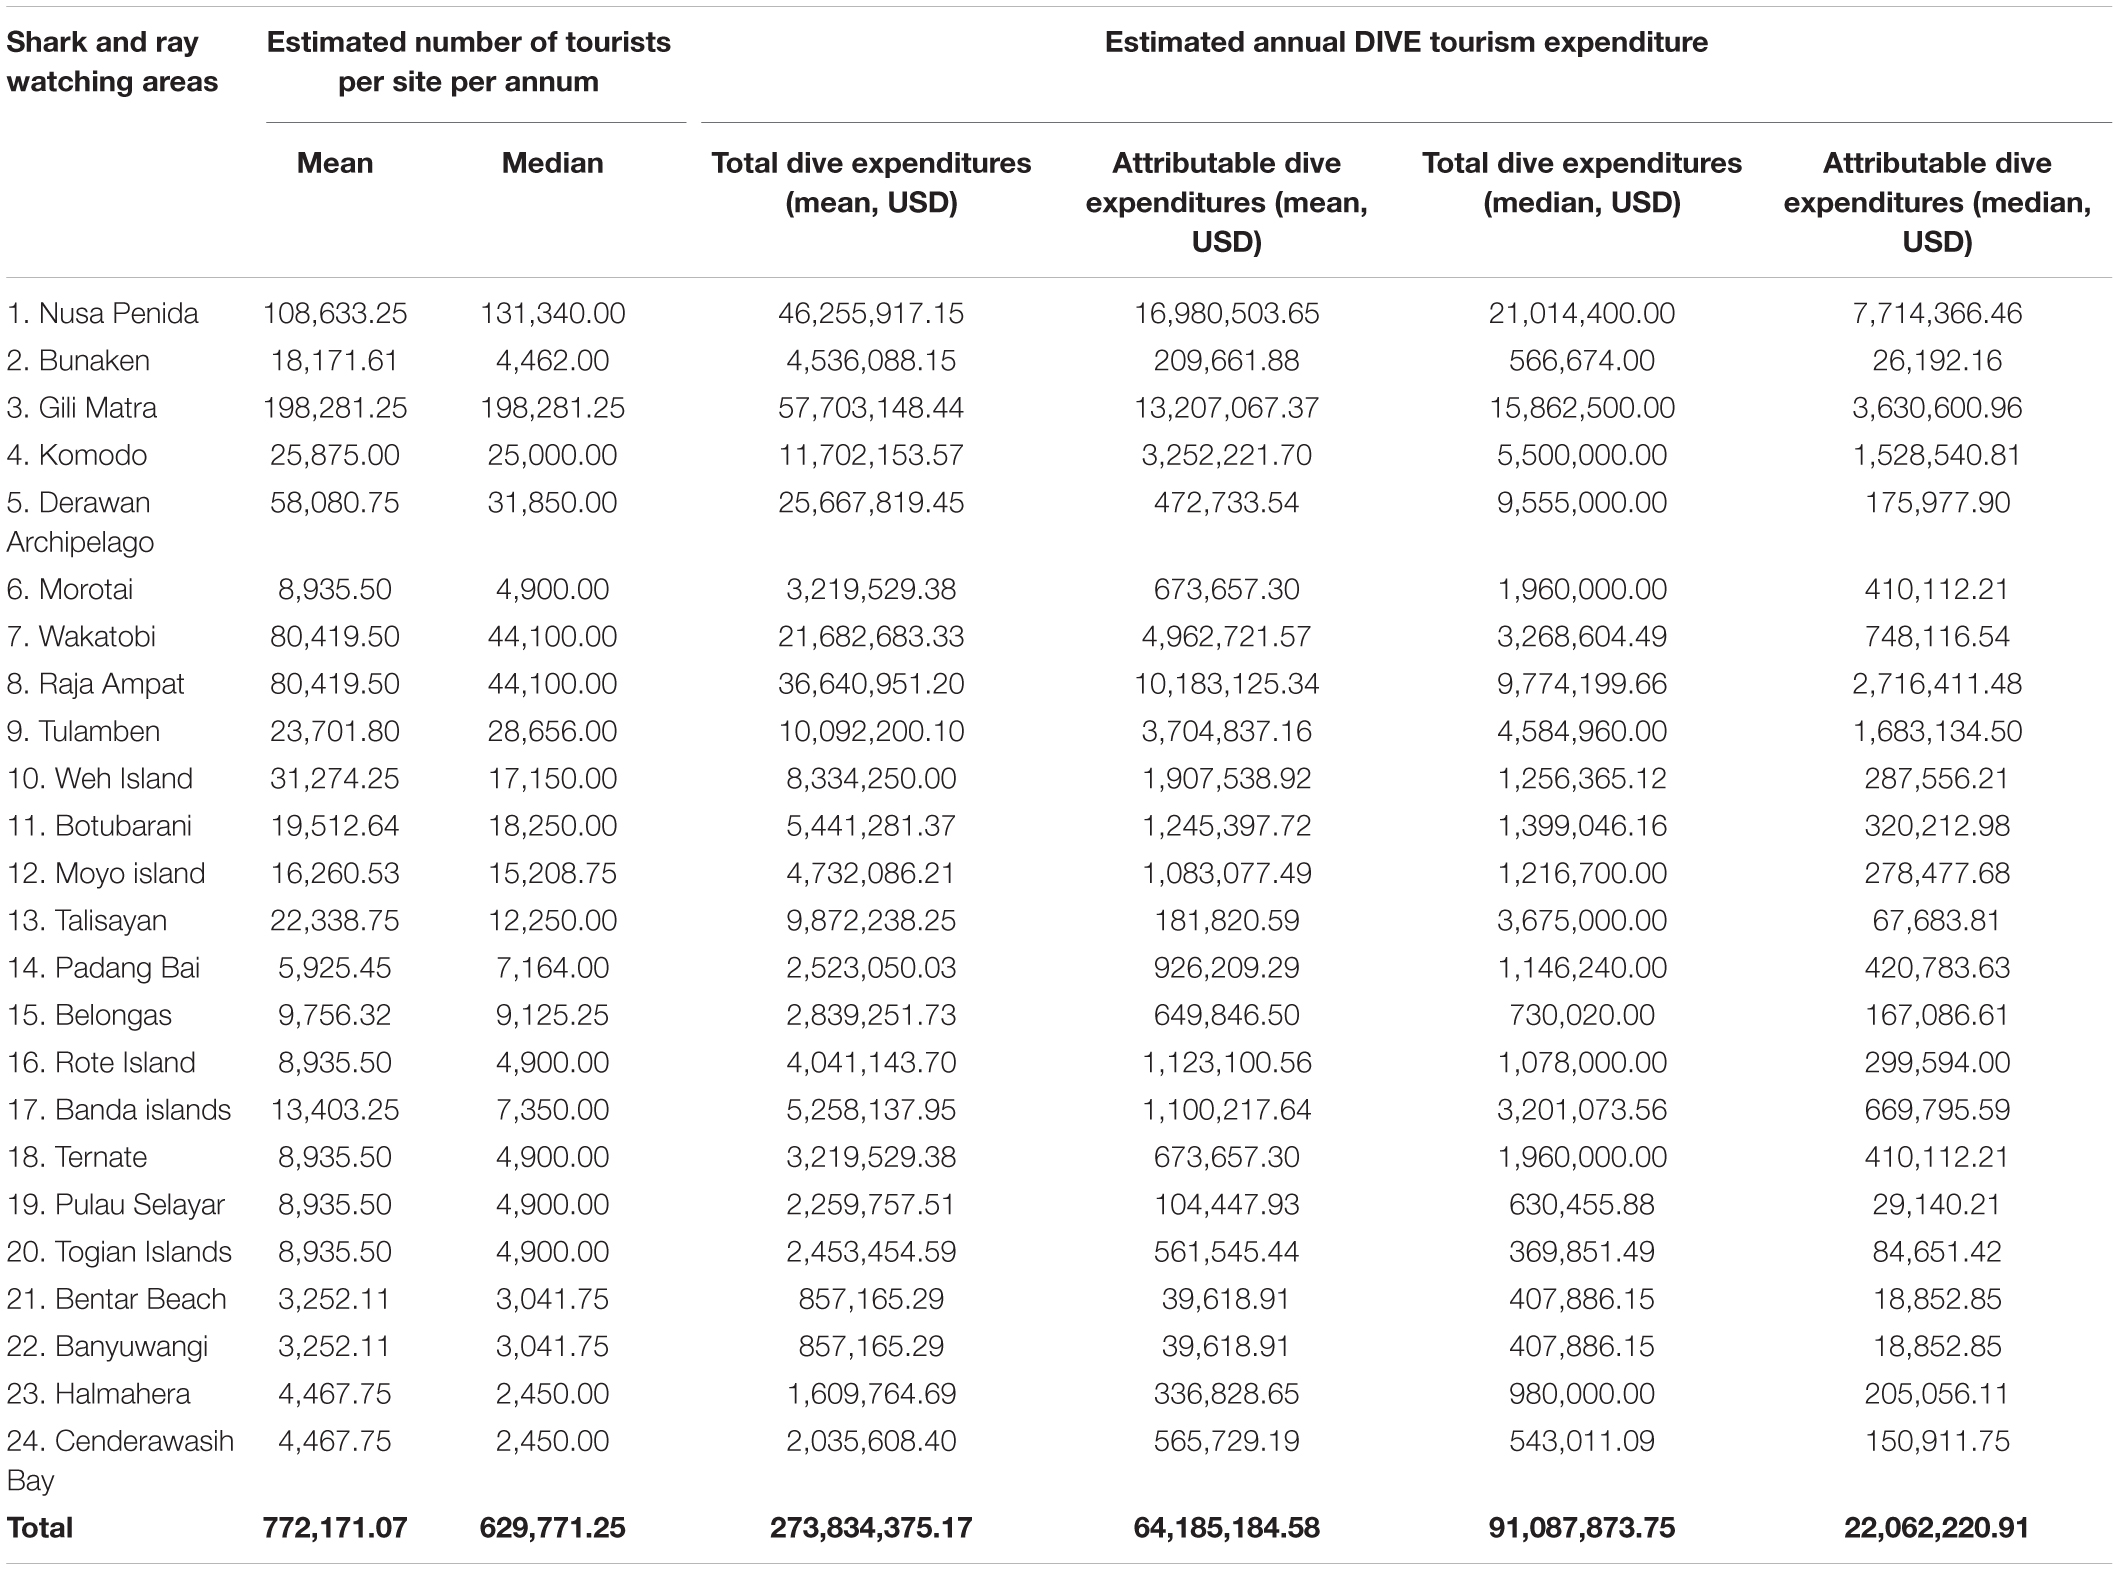
Table 4B. Estimated annual shark and ray expenditures (USD) for 235 dive operators in Indonesia.
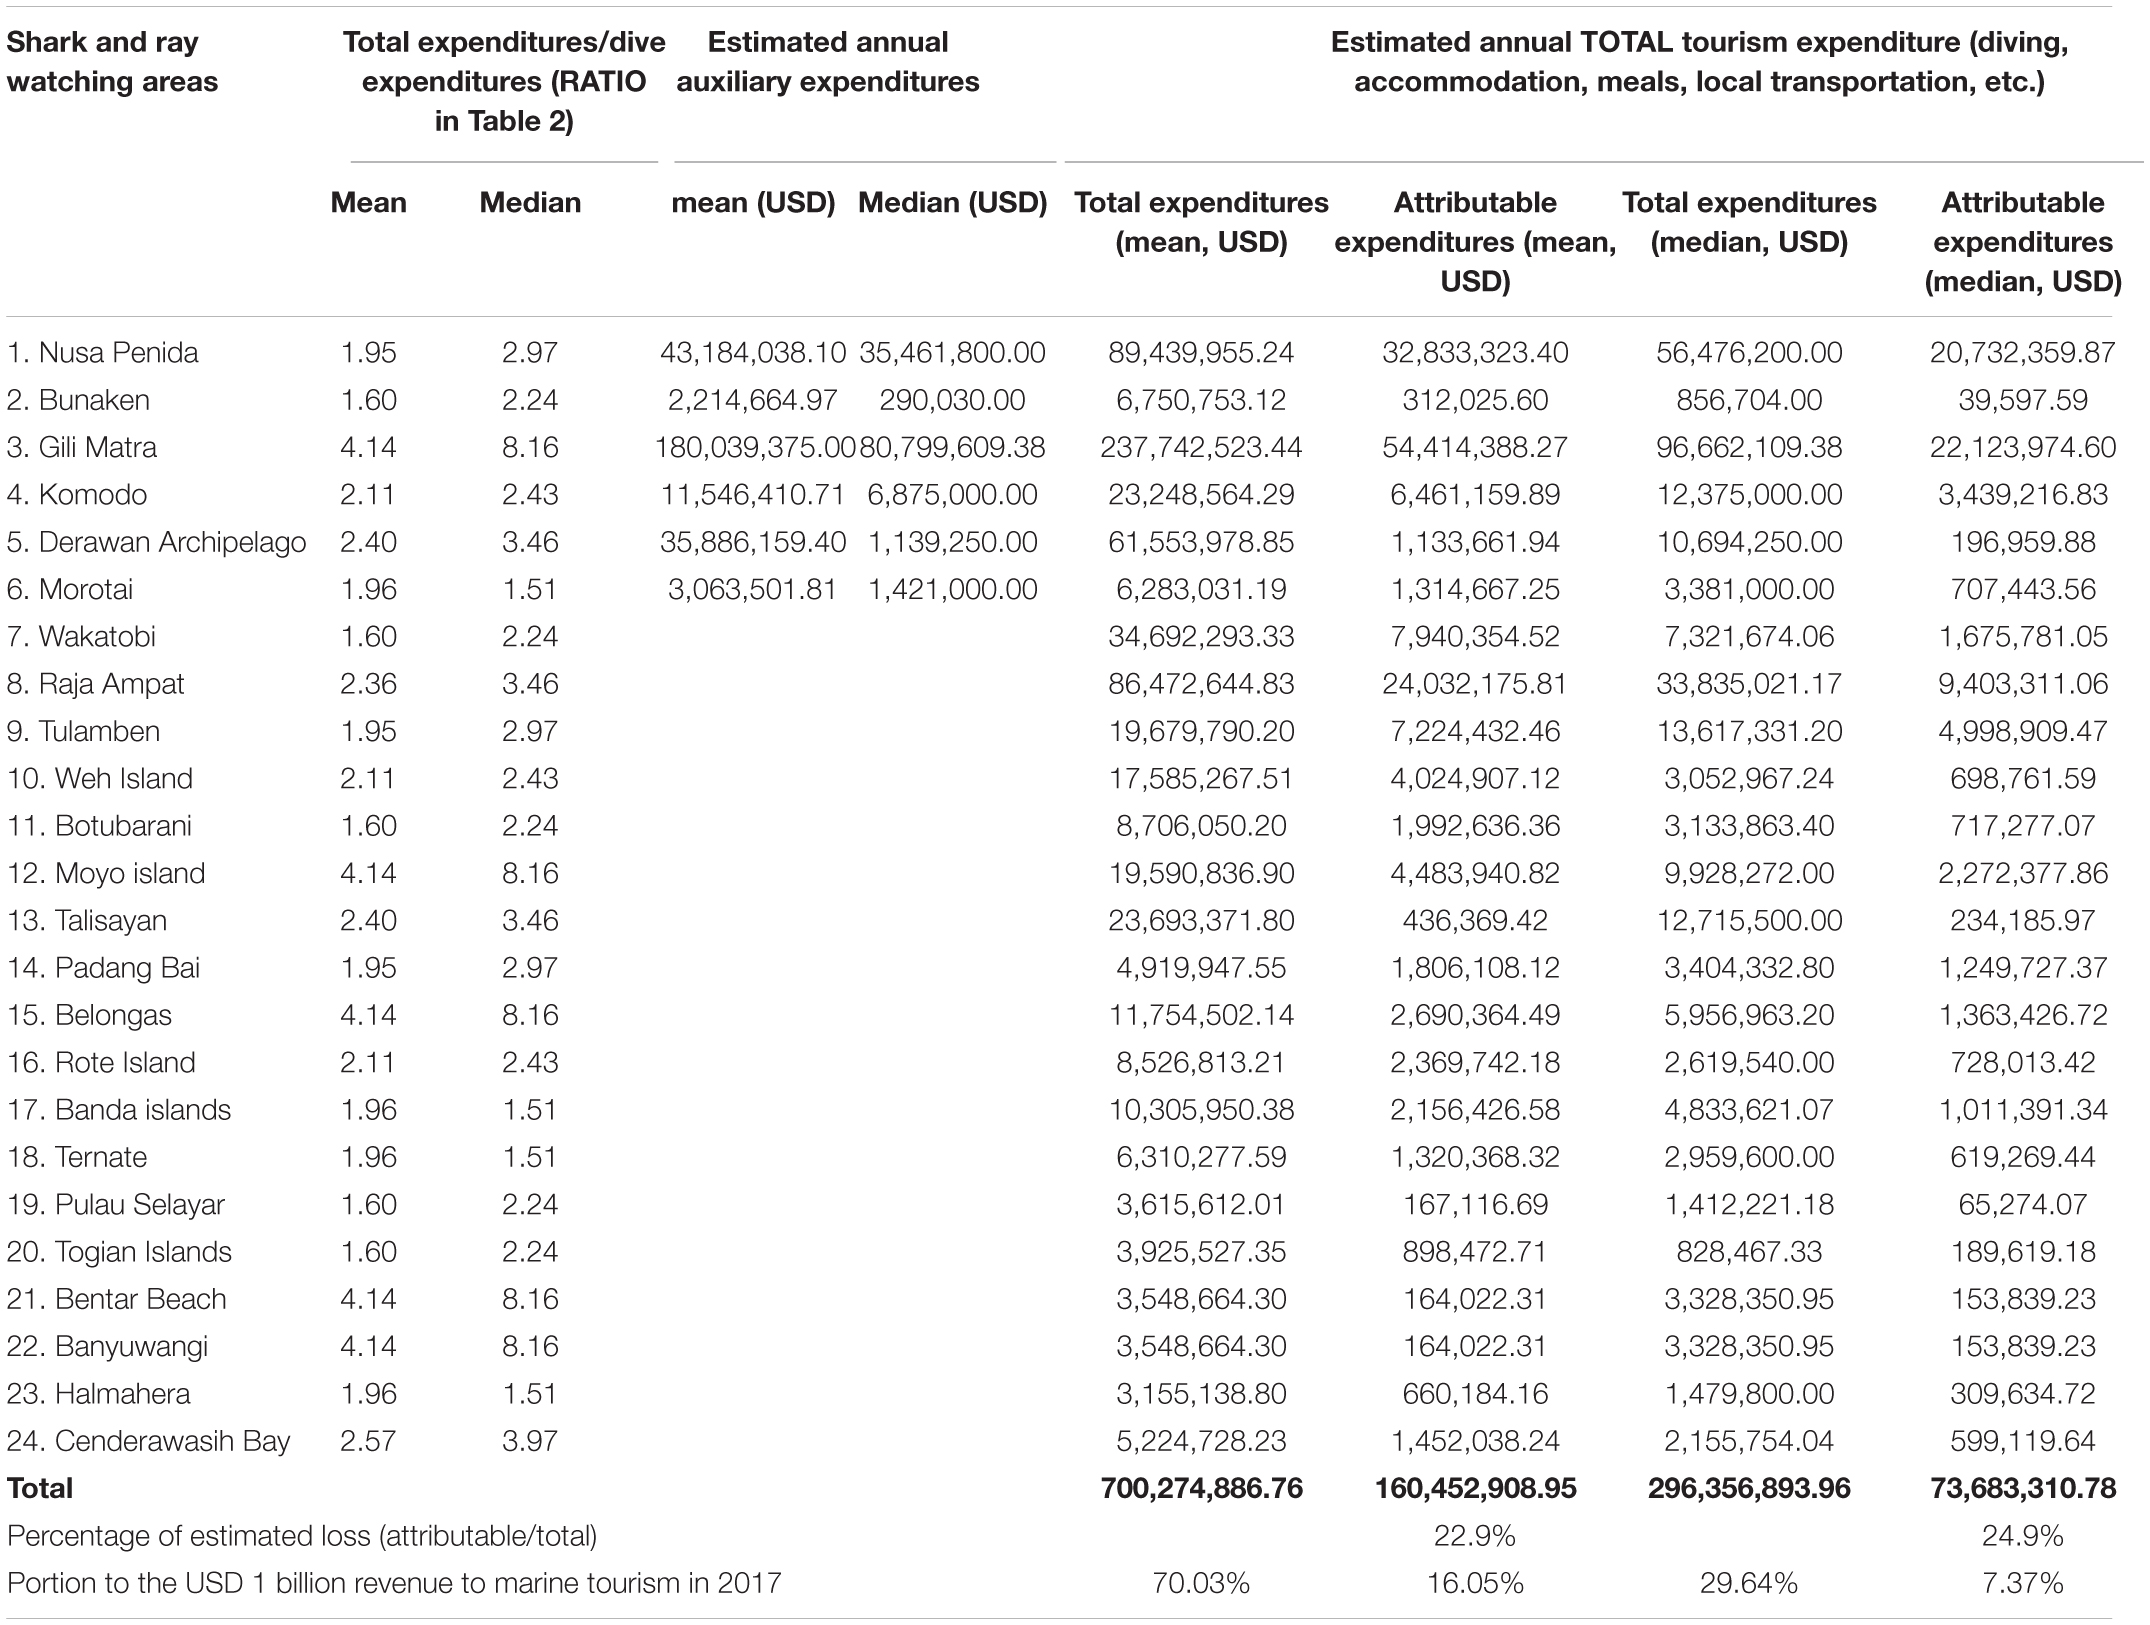
Table 4C. Estimated annual shark and ray expenditures (USD) for 235 dive operators in Indonesia.
To estimate future tourism value, we assumed a constant tourism growth rate in Indonesia of 5.1% per annum over the next ten years based on the tourism growth rate in the ASEAN region for 2016 (Indonesia Travel, 2017). This is a conservative estimate, since national tourism growth for Indonesia alone in January to September 2017 was estimated at 17.5% (Indonesia Travel, 2017).
SPSS ver 25 was used to calculate tourist expenditures per person per trip from the six sampled sites. Microsoft Excel for Mac ver 15.27 was used to estimate annual tourist expenditures for all recorded operators in the 24 locations in Indonesia.
Fisher Perceptions
Very few interviewees from local communities were identified as shark fishers or being engaged in/receiving benefits from the tourism industry. As a result, there were too few samples for robust analytical statistics. Instead, we used descriptive statistics to interpret the results for understanding the role of shark tourism for communities.
Determinants of Tourist Satisfaction and Motivation to Visit
We used SPSS ver. 25 to analyze the tourist satisfaction level and whether sharks or rays was a significant factor that influenced a tourist’s decision to visit a particular location. All predictors were tested individually before using multiple regressions as a model selection framework. Collinearity diagnostics (Field, 2013; IBM SPSS, 2020) were done to predictors before conducting the analyses (details of analyses in Results).
Results
Tourist Profiles
The 365 survey respondents were dominated by male respondents (53.4%) (One-sample t-test p < 0.001, df = 361). Almost 84% respondents came from Western countries, with France making up the majority (n = 45). Non-Western respondents were predominantly from Asia (Table 5). More than 80% of the 365 respondents were first-time visitors of the site where they were interviewed.
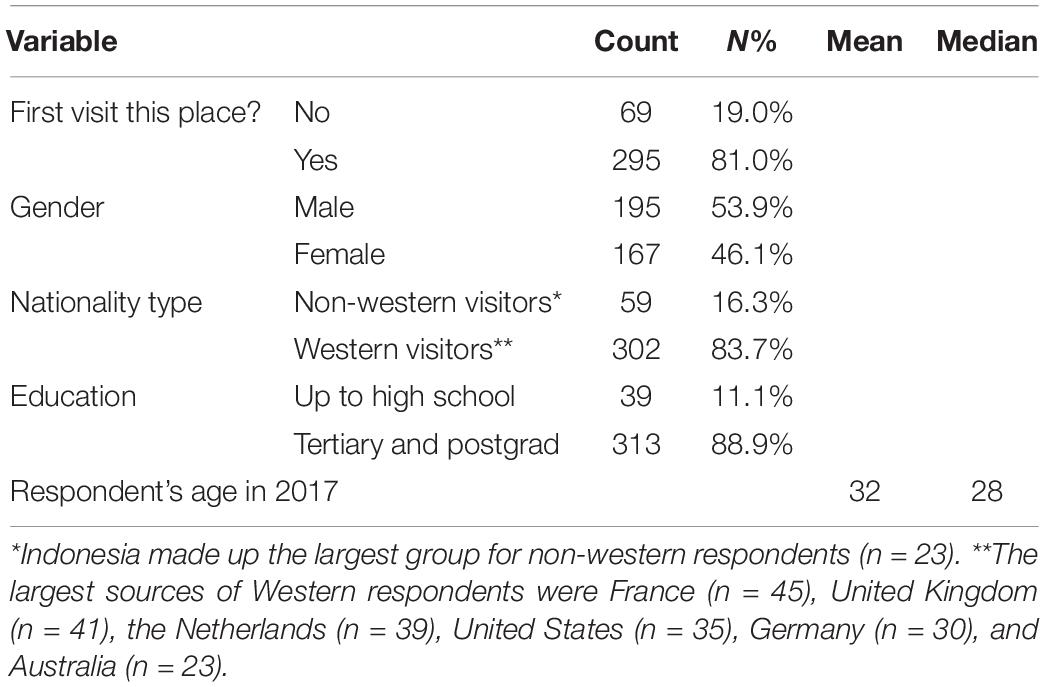
Table 5. Basic demography of survey respondents (total tourists n = 365).
Estimating the Economic Value of Shark and Ray Tourism
Current Values
We identified 24 shark and ray tourism sites spread across 14 provinces in Indonesia (Figure 1 and Table 4). These sites range from popular, well-established tourist destinations with 70 dive operators per site (i.e., Nusa Penida, Tulamben, and Padang Bali in Bali) and more than 198,200 shark tourists per year (i.e., Gili Matra in West Nusa Tenggara) to more remote locations with just one or two operators and between 2,400 and 3,000 tourists per year (e.g., Banyuwangi in East Java and Cendrawasih Bay in West Papua, Figure 1 and Table 4). The tourism sites are predominantly concentrated in central and eastern Indonesia (Figure 1).
We have 45 dedicated shark tourists (12.5% of n = 361) and 63 partially dedicated shark tourists (17.5% of n = 361) in our dataset. Regardless of whether they were dedicated tourists or not, we estimated that around 772,171 shark tourists visited Indonesia in 2017 (median number; mean around 629,771 tourists in 2017, Table 4B). As such, the median number of dedicated and partially dedicated shark tourists were 188,931 tourists per annum (mean 231,650 tourists per annum). These tourists contribute to the attributable expenditures for the shark tourism industry.
The median total expenditures per person per trip to a given site averaged across all sites was USD 598.44 (mean USD 859.05) (Table 1). Of these total expenditures, shark, and ray tourism activity expenditures (including scuba diving, snorkeling and boating) make up at least 35% of all per person per trip expenditures (median USD 214.5, mean USD 370.16 per person per trip; Table 1). The median auxiliary expenditures per person per trip (meals, hotels, communication, souvenir and local transport) was USD 275 (mean USD 475.6) (Table 1).
Spending patterns across the six sampled locations were heterogeneous (Independent samples Kruskal–Wallis Test for total expenditure p < 0.001 at CI 95%, df = 5; Independent samples Median Test for total expenditure p = 0.001 at CI 95%; df = 5). The highest median scuba dive expenditures per person per trip was spent in Morotai (USD 400) (mean USD 360.31, Table 1). The highest median auxiliary expenditure per person per trip was spent in Derawan (USD 465) (mean 617.87, Table 1). The highest median total direct expenditures per person per trip was also in Derawan Archipelago (USD 1,039) (mean USD 1,061.8, Table 1).
We estimate that the median attributable shark and ray dive expenditures in 2017 was at least USD 22 million (mean USD 64.1 million, Table 4B). We estimate that the median total attributable expenditures in 2017 was USD 73.6 million (mean USD 296.3 million, Table 4C). This number contributed at least 7.37% (median value) of the total USD 1 billion marine tourism revenue in Indonesia in 2017 (Table 4C). These attributable expenditures also contribute to up to 24.9% of the total expenditures generated from shark/ray tourists (median value, Table 4C). This is the value that Indonesia’s dive industry as a whole could hypothetically lose in the absence of sharks.
Estimated Future Values
Based on conservative 5.1% projected tourism growth rates, and assuming shark populations in key tourism sites are maintained at current levels or healthier, the median attributable dive expenditures of shark and ray tourists by 2027 are projected to be USD 36.28 million (mean USD 105.55 million, see also Figure 2). By 2027, the median total attributable expenditures of shark and ray tourists are projected to be 121.17 million (mean 263.86 million, Figure 2). This is the potential loss of income to Indonesia (non-inflation-adjusted) should shark and ray populations decline, leading to the loss of sharks from Indonesian waters/popular tourism sites.
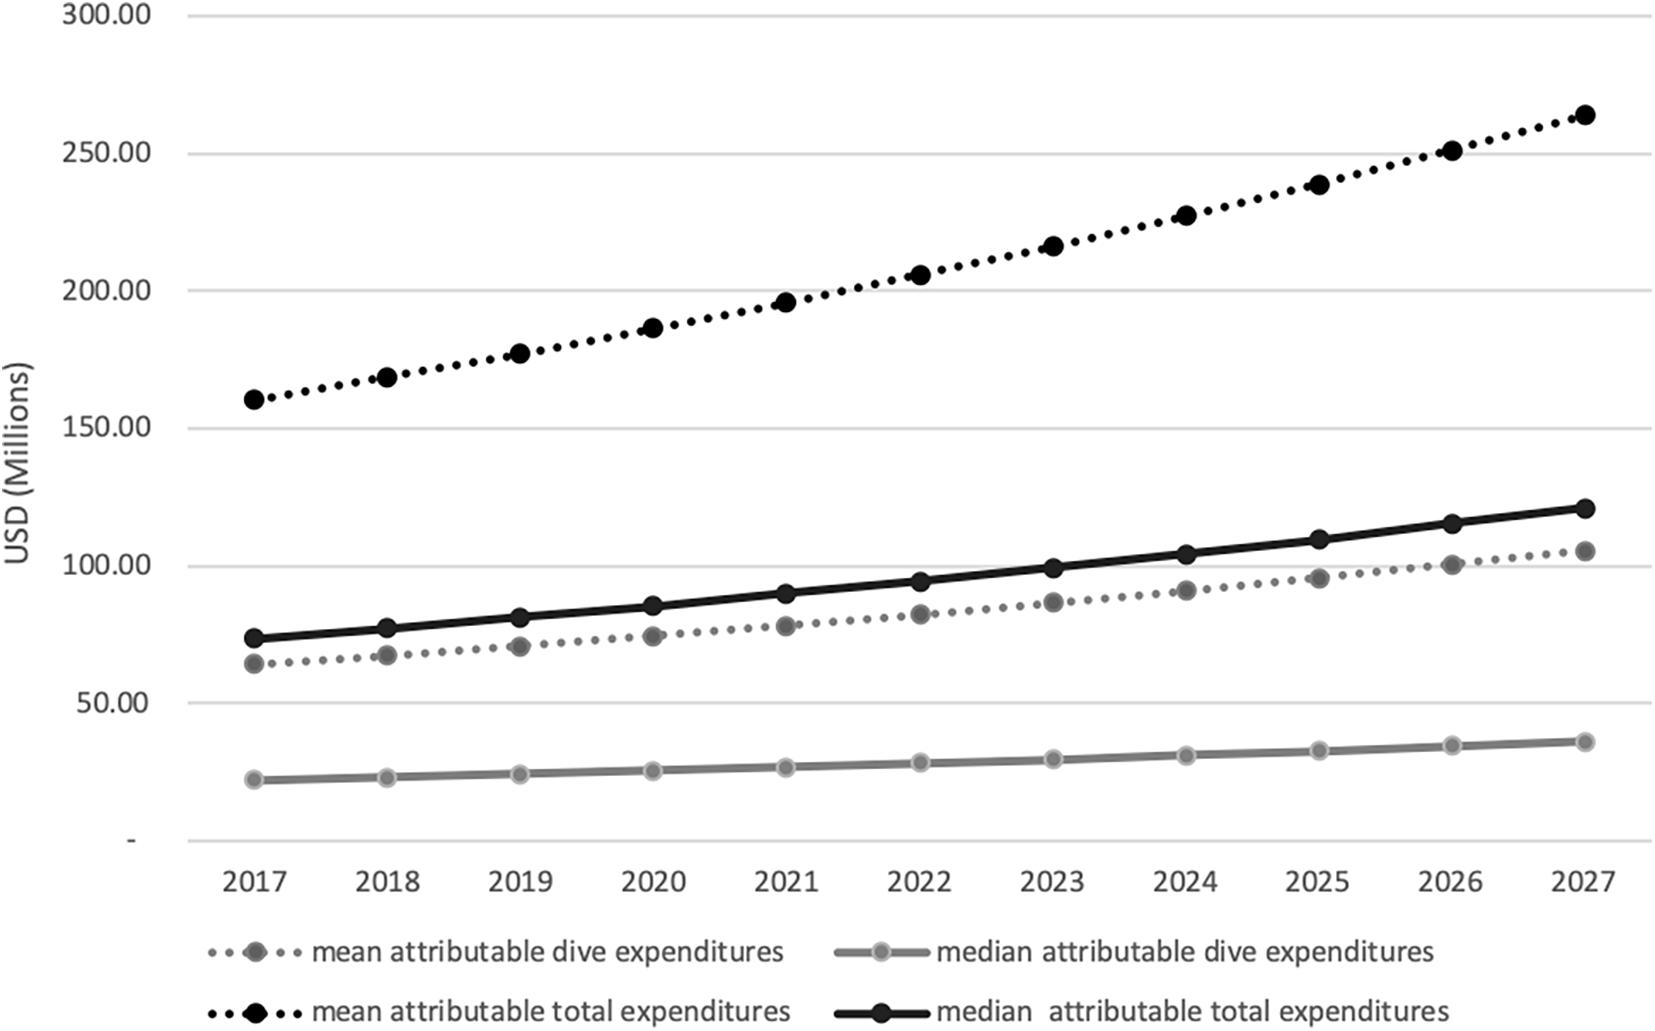
Figure 2. The potential revenues 2017–2027 derived from dive and total expenditures attributable to sharks (median in solid lines, mean in dotted lines; dive in gray, total in black).
Factors Influencing the Effectiveness of Tourism as a Conservation Strategy
Tourist Satisfaction and Experience
A total of 79.2% respondents scored between 8 and 10 on the satisfaction scale (Figure 3). Two benchmarks are available for tourism satisfaction: Hanan and Karp (1989) and Pearce (2006). Hanan and Karp (1989) considered customer satisfaction as high if at least 85% respondents score between 8 and 10 (on the scale of 1–10), medium if between 70 and 80% respondents score 8–10 (the scale left out 80–85%), and low if lower than 60% respondents score 8–10 (the scale left out 60–70%). Pearce (2006) recommended low satisfaction for mean of <7.1, medium satisfaction between 7.1 and 7.8 and high satisfaction for mean of >7.8. Since our satisfaction data is ordinal and not normally distributed (Figure 3, also both Kolmogorov–Smirnov and Shapiro–Wilk p-values are 0.000), we refrain from using mean to analyze our satisfaction data. Thus, using Hanan and Karp (1989), the overall satisfaction levels with shark and ray tourism in Indonesia can be considered moderate. However, if considering the Pearce (2006) benchmark, bearing in mind that our satisfaction is not normally distributed, the satisfaction level of our respondents can be seen as moderate, edging toward high.
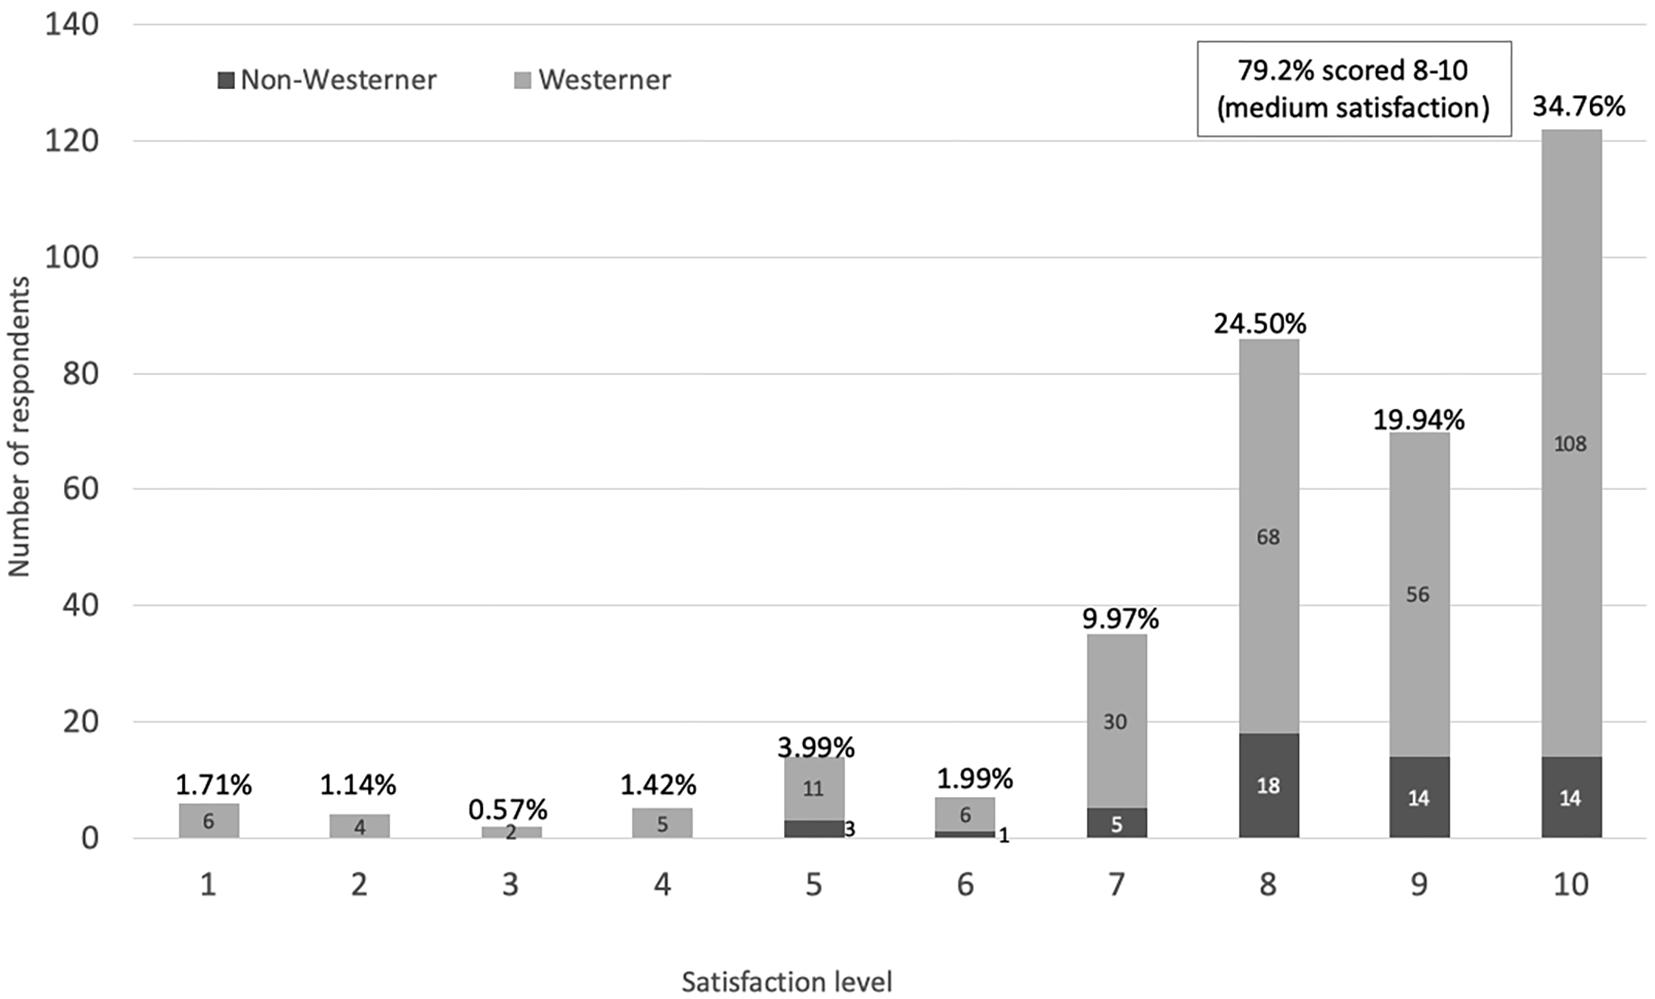
Figure 3. Satisfaction level of tourist respondents (79.2% respondents scored 8–10, n = 351). Overall medium satisfaction (Hanan and Karp, 1989), edging toward high if also considering Pearce (2006) benchmark. Percentage covers both Westerners and non-Westerners.
Up to 95.6% (43 out of 45) of dedicated shark tourists and 93.7% (59 out of 63) of partially dedicated shark tourists considered sharks/rays as an important factor in their decisions to visit a site. Since dedicated and partially dedicated shark tourists contributed to up to 24.9% of the shark tourist expenditures, we checked several demographic variables as potential predictors to whether sharks/rays were an important factor to visit the site using a series of individual Chi Square Independent tests. The variables are gender (nominal, dummy), whether it was a first visit (nominal, dummy), location (nominal), whether the tourist came from a western country (nominal, dummy) and education level (nominal, dummy). Using Logistic Regression, we analyzed the determinants of respondents’ satisfaction levels against age (interval). Location was the only variable with a significant association (Pearson Chi Square p = 0.000, Cramer’s V-value = 0.321, medium association). Nusa Penida, Komodo, and Lombok have significantly more tourists who stated that sharks/rays were important in their decision to come. Bunaken is the reversed, but effect is also significant (significantly fewer tourists stated that sharks/rays were important in their decision to come to Bunaken).
Using a series of individual Chi Square Independent tests, we analyzed the determinants of respondents’ satisfaction levels against 18 predictors (i.e., location (nominal), whether shark or ray was an important factor to visit the area (nominal, dummy), gender (nominal, dummy), whether it was their first visit to the area (nominal, dummy), the tourist’s perception about the number of boats around him/her (categorical, ordinal), whether the tourists were overseas visitors (nominal, dummy), whether the respondent was a westerner or not (nominal, dummy), whether respondents saw reef sharks, manta rays, devil rays, sting rays or whale sharks (nominal, all dummy variables), what rank of importance the respondents gave these animals (ordinal, dummy), and education level (ordinal, dummy). Using Logistic Regression, we analyzed the determinants of respondents’ satisfaction levels against two interval predictors (age and the length of stay expressed in the number of nights). We found six predictors with significant effects (whether the tourists saw reef sharks, manta rays, devil rays or sting rays, location and whether shark or ray was an important factor to visit the area, all p < 0.005).
We ran collinearity diagnostic on the six significant individually significant predictors. We detected no collinearity: no Eigenvalue was above 15 (the highest was 3.790), no VIF was greater than 10 (the highest was 1.749), mean VIF was not substantially greater than 1 (mean = 1.41), and no Condition Index was close to zero (the lowest was 1.000). We then re-run the analysis with Logistic Regression just for the six significant predictors.
Our best model identified two significant predictors (Model p = 0.000, Model Chi Square = 83.296, Block Chi Square = 34.076, Nagelkerke Rsqr = 0.352): (1) whether respondents saw reef sharks [p < 0.001, B = 1.287, SE = 0.340, Exp(B) = 3.621]; and (2) whether respondents saw manta rays [p < 0.001, B = 2.289, SE = 0.428, Exp(B) = 9.863]. The satisfaction of a tourist who saw a reef shark was likely to increase 3.6× compared to when s/he did not see reef shark. The satisfaction of a tourist who saw a manta ray was likely to increase 9.8× compared to when s/he did not see manta. Our finding is consistent with tourist responses on favorite animals to encounter, with whale sharks (n = 205, 63%), manta rays (n = 93; 28%) ranking most highly, followed by the reef sharks (n = 21; 6%) (Figure 4) (noting that whale sharks were very rarely seen in the sites we sampled, therefore it did not play in to the satisfaction determinants).
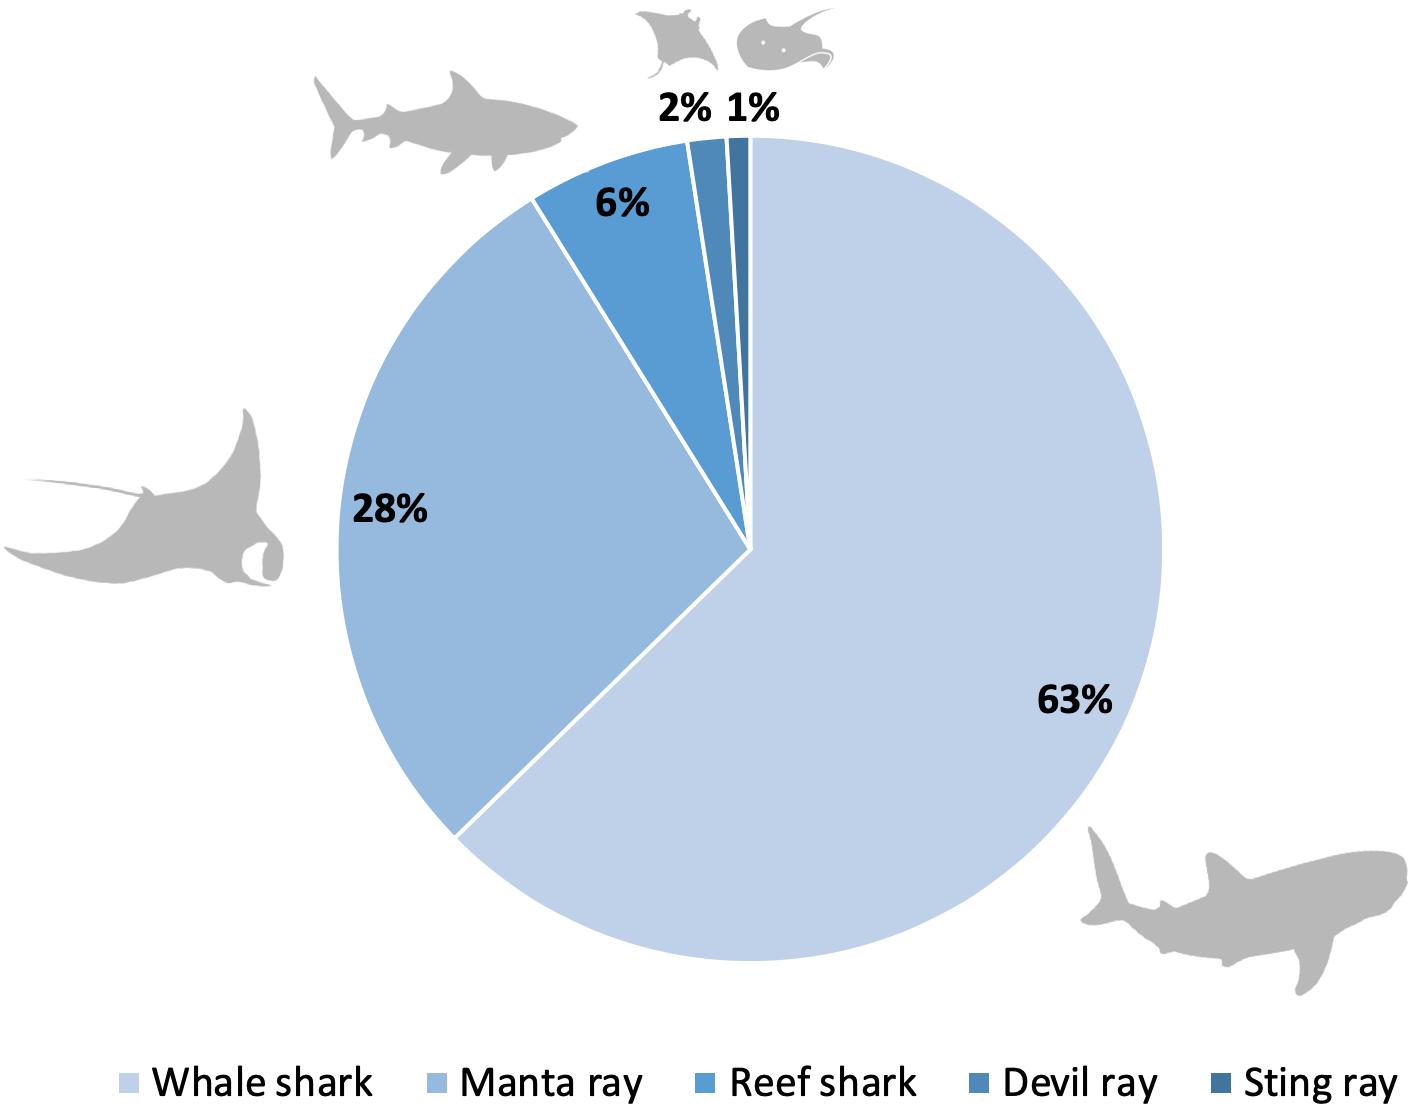
Figure 4. Tourist preferences for which marine animals they would most like to see while diving (n = 327).
To explore differences between Western and non-Western shark tourists, we re-ran Logistic Regression for satisfaction analyses separately, also preceded by collinearity diagnostic. We found that Western tourists behaved similar to pooled results, with the same significant predictors (best model p = 0.000, Model Chi Square = 77.877, Block Chi Square = 65.785, Nagelkerke Rsqr = 0.378). The two significant predictors are: (1) whether respondents saw reef sharks [p = 0.002, B = 1.091, SE = 0.354, Exp(B) = 2.977]; and (2) whether respondents saw manta rays [p < 0.001, B = 2.650, SE = 0.365, Exp(B) = 14.158]. The satisfaction of a Western tourist who saw a reef shark was likely to increase ∼3× compared to when s/he did not see reef shark. The satisfaction of a Western tourist who saw a manta ray was likely to increase ∼14× compared to when s/he did not see manta.
When we analyzed the satisfaction determinants for non-Western shark tourists with Logistic Regression, we found a different pattern. With best model p = 0.000, Model Chi Square = 13.518, Block Chi Square = 13.518, Nagelkerke Rsqr = 0.369, the only significant predictor was the importance of sharks or rays in the tourists’ decision to come to a place [p = 0.001, B = 3.045, SE = 0.880, Exp(B) = 21.000]. If a non-Western tourist felt that sharks or rays were important in their decision to come to a place, their satisfaction is likely to increase 21× compared to if s/he didn’t think sharks or rays were important. Whether these tourists actually saw a shark or a ray was not significantly associated with their satisfaction level.
Examination of perceptions of crowding revealed that 42% of respondents considered the number of boats or tourists among them as “too many” or “far too many,” while about half considered the crowding “just about right” (Figure 5). We found a significant difference between crowding preferences of Western and non-Western tourists, with non-Western tourists more likely to consider that the number of boats/tourists around them was too few (Pearson chi square p = 0.003, Likelihood Ratio p = 0.013, value = 12.76, df = 4, n = 352). Unexpectedly, crowding (expressed in the tourist’s perception about the number of boats around him/her) was not a significant predictor in satisfaction level.
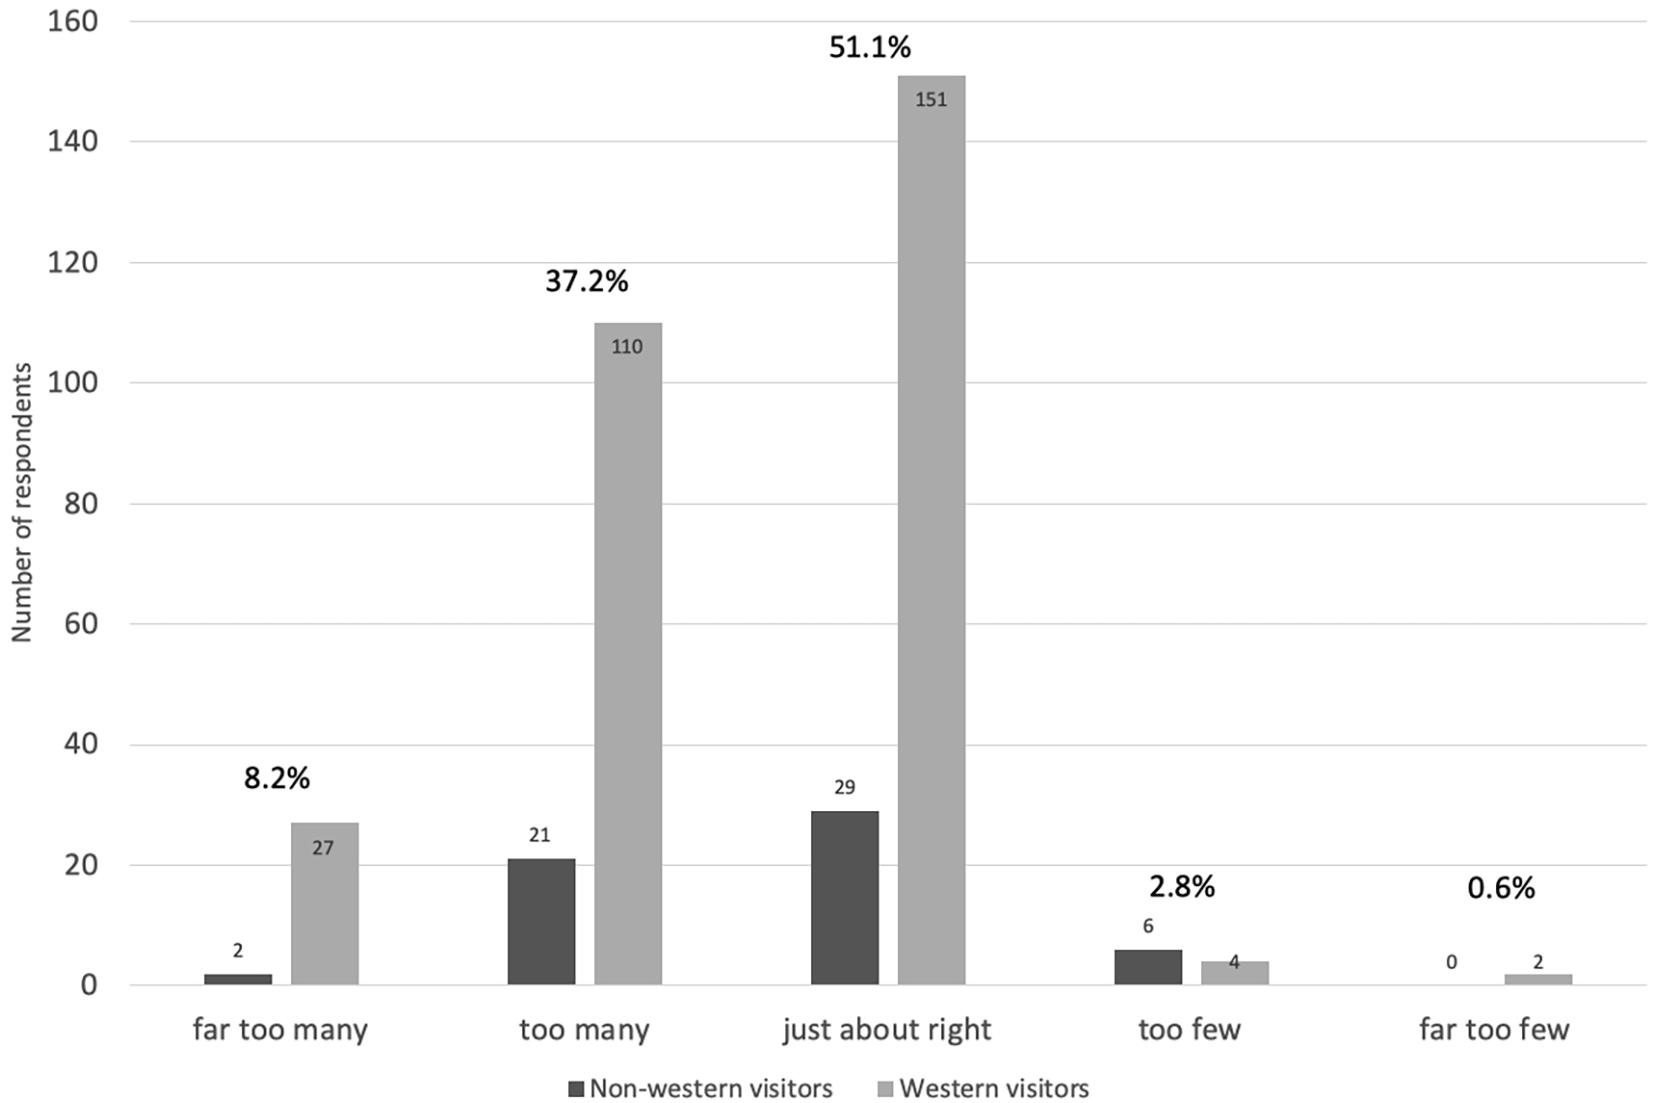
Figure 5. The perception of crowding amongst tourist respondents (n = 352) based on answered to the question “You considered the number of boats around you to be…” (Pearson chi square p = 0.003 between Westerners and Non-Westerners). Percentage covers both Westerners and non-Westerners.
Our examination also revealed that tourists who ranked at least 8 out of 10 in the satisfaction level would be more likely to re-join the trip in the future (Pearson Chi Square p = 0.000, df = 1). The same type of tourists would also be more likely to recommend the trip to others (Pearson Chi Square p = 0.004, df = 1). Entailed in these analyses is the importance of the higher likelihood to see reef sharks or manta rays in tourist re-joining or recommending the trips, for the ability to see sharks or manta rays were significant to higher satisfaction.
Community Perspectives
Of all community respondents interviewed in/around the case study tourism sites, 75% reported capture fisheries as their main source of household income, while others were involved in fish trading or processing. Of these, only 8 out of 84 interviewed fishers (9.5%) reported sharks as a key target species, and only 1 respondent reported that shark fishing was a significant contributor to their livelihood.
Just 32% of interviewees (N = 27) either had worked or were currently working in the tourism sector at the time of the survey, and none of these identified as shark fishers present or past. Similarly, only 3 of the 11 dive operators who filled in the online questionnaires reported employing former shark fishers, although 67% of community respondents who didn’t work in the tourism sector reported that they aspired to (n = 76). Most tourism-related occupations for fisher community were lower-skill (i.e., requiring less re-training of individuals), focused on boat operations for taking tourists snorkeling and sightseeing. 17% of the fishing households (N = 14) reported other family members working in the tourism sector, also as lower-skilled workers such as cleaners. For the households engaged in tourism, tourism livelihoods contributed around half of the total household income.
Discussion
Our analysis estimated the median total annual dive expenditure of shark and ray tourists in Indonesia in 2017 at USD USD 22 million (mean USD 63.9 million), generated by more than 188,900 shark and ray tourists per year, making up at least 7.37% (median value) of the total USD 1 billion marine tourism revenue in Indonesia in 2017 (based on estimates from Fauzi, 2017). The median total attributable expenditures in 2017 was estimated to be USD 73.6 million (mean USD 296.3 million), contributing to up to 24.9% of the total expenditures generated by general tourists who visited sites with sharks or rays. This value makes the shark tourism industry in Indonesia 1.45× the values of shark landing in the country, for the latter’s value would be around USD 50.65 million per annum if inflation-adjusted to 2017 values (based on Cisneros-Montemayor et al., 2013).
By 2027, provided shark and ray populations remain at current or healthier levels, the median total expenditures of shark and ray tourists are projected to be at least USD 487.3 million. However, if shark and ray populations decline, the estimated economic loses from reduced shark tourism could be at least USD 121.1 million, or 24.8% of the potential revenues. These estimations are not broken down based on the tourist demography, e.g., between Western and Asian tourists, hence it may change depending on the behaviors and demography of tourists by 2027.
These results build on previous studies by O’Malley et al. (2013) and Cisneros-Montemayor et al. (2013) to provide a strong economic argument for maintaining healthy shark and ray populations in Indonesia. It should be acknowledged that this is a highly conservative estimate due to several assumptions and biases in our data collection and analyses, including: data collection bias toward more budget and mid-range tourists, since we couldn’t sample tourists in high-end resorts at the time of data collection; exclusion of live-aboard shark and ray tourists, which is also a high-end market; exclusion of whale shark tourism, since these trips were out of season during our field data collection; the use of conservative tourism growth projections for the next 10 years; and the assumption that shark and ray populations will remain at current levels, as opposed to potential up-side increases in tourism value if populations grow and expand due to improved protection and management. Therefore, the true current and potential future values are likely to be higher.
Results from tourist questionnaires indicate several patterns in tourist preferences, which have important management implications for maintaining and growing Indonesia’s marine tourism revenue in the long-term. Firstly, the possibility of seeing sharks or rays was an important deciding factor of tourists to come to Nusa Penida, Komodo, and Lombok. Non-Western tourists who considered sharks or rays as an important deciding factor in visiting a site are much more likely to be satisfied with their trips. For Western tourists, actually seeing reef sharks and manta rays leads to significantly higher trip satisfaction for tourists. In general, tourists who are more satisfied with their trips are more likely to re-join trips and recommend trips to friends. The higher satisfaction levels and likelihood of returns and recommending the trips to others may play an important role in promoting the sustainable practices of the industry for the foreseeable future.
It also means that the presence of this charismatic megafauna presents a potential boon in some areas relative to others. Since word of mouth recommendations can be important for customer retention and growth in the tourism industry (Murphy et al., 2007; Phillips et al., 2013), healthy shark and ray populations not only lead more satisfied guests, but can also create a larger tourist base and higher value for the industry in the future. Reported hypothetical reductions trip length, and therefore expenditure, in the absence of shark and ray populations, highlights the need to adequately protect and manage shark and ray populations overall, particularly species of tourism interest.
In terms of tourist experience, our boat-crowding analysis indicates that non-Westerners were less-sensitive to crowding compared to Western visitors. This finding is in line with the findings of other studies that also indicated that Western visitors were more sensitive to crowding than Asian visitors (Yagi and Pearce, 2007; Mustika et al., 2013). This is important in the context of recent increases in Asian tourists (particularly from the People’s Republic of China) to Indonesia, since these visitors might prefer closer and more crowded encounters with the wildlife, which may be in opposition to sustainability and best-practice guidelines (Lawrence et al., 2016). On the other hand, Western tourists may value a more “wilderness”-type experience, with high expectations of wildlife interactions, and may be willing to pay more for unique and “pristine” wildlife tourism activities. For these tourists, high-cost low-volume pricing strategies may be an effective way to maintain long-term value, whereby guests pay extra money for unique and exclusive wildlife experiences. Although crowding was not a significant determinant in overall satisfaction, the finding that many tourists felt there were too many other boats of people around them highlights potential negative consequences of tourism growth, and the necessity for managing volumes of guests in/around dive sites. Overcrowding in popular shark tourism hotspots may lead to a decline in value, and in particular a loss of higher-budget, longer-staying or more wilderness-oriented tourists.
Further, increasing tourism can also lead to direct and indirect negative impacts on the marine environment and shark populations (e.g., infrastructure development leading to habitat destruction and degradation, pollution, higher resource extraction/environmental footprint (food and water), boat strikes and disruption of animal behavior due to human presence in important habitat/aggregation sites (Hall, 2001; Sunlu, 2003; Wong, 2004). Such issues may lead to significant environmental and economic costs in the long-term. For example, the recent 6-month closure of Boracay in The Philippines, due to waste management and environmental problems caused by rapid, unmanaged growth in tourism, has led to the loss of 19,000 jobs and an estimated USD 1 billion to the economy (Alexander, 2018; Selby and Sepehr, 2018). Similarly, crowding, over-development, noise and litter threatened tourist satisfaction on Sipadan island in Malaysia (Musa, 2002), with the eventual closure of all resorts on the atoll and the development of a strict permitting system. In this case, a high-cost low-volume strategy was deemed to be the most effective for securing the environmental and economic values of the site. Conversely, should sites and shark populations be well managed, it may lead to the recovery of sharks in sites with low or locally-extinct populations. If tourist interests in sharks are maintained or increased, the recovery of these animals might lead to the growth and expansion of tourism potential. Such was the case with Misool in Raja Ampat (Jaiteh et al., 2016), where spatial closures led to a recovery in local shark populations. The resort is now able to charge more than USD 4,500 per person per week through a low-cost high-volume strategy due to the exceptional diving conditions.
While these analyses are a useful communication tool for demonstrating the economic value of natural resources, they can be oversimplified. They may fail to take in to account the context-specificity of tourism (i.e., tourism cannot be developed anywhere and everywhere), and the spatial and demographic disparities between the accrued costs and benefits of conservation (Balmford and Whitten, 2003). For example, local communities usually bear the majority of the opportunity costs of conservation due to restrictions on resource access (Balmford and Whitten, 2003), but locals may face high barriers to entry for benefiting from the tourism industry to due limited skills and access to capital, or geographic disparities in the development of tourism markets and related infrastructure.
Thus, despite the considerable economic value of sharks to the tourism sector, it remains questionable whether tourism in turn is providing conservation benefits for sharks and their relatives, outside of a small number of coastal, charismatic species in well-funded or highly-visited protected areas. While there are existing case study examples showing that no take zones developed as tourist attractions can lead to higher shark abundance in those specific areas (Jaiteh et al., 2016), there remains little evidence that the tourism value generated in these areas incentivizes local communities, and specifically shark fishers, to protect or sustainably manage marine resources. Results from interviews with local communities in/near shark and ray tourism sites indicate that fishers, and in particular shark fishers, receive limited benefits from tourism in the form of job opportunities and income, despite aspirations by many to engage in the tourism sector. There are likely two key reasons for this. Firstly, fishers who live in or nearby tourism hotspots may face high barriers to entry in to the tourism job market due to limited skills and resources, which is demonstrated in this study by results showing that of the limited number of local people engaged in the tourism industry, most were low-paid, low-skilled workers. Secondly, the primary users/exploiters of sharks (i.e., shark fishers) are spatially separated from the areas where shark and ray tourism is taking place. For example, known shark fishing and trade hotspots in Indonesia include Cilacap (Central Java), Muara Baru (Jakarta) and Tanjung Luar (Lombok, West Nusa Tenggara), Aceh, South Halmahera, and Sibolga (Blaber et al., 2009; Dharmadi et al., 2017; Booth et al., 2018; Ichsan et al., 2019a, b; also see Figure 1), which are outside of the key tourism hotspots identified in this study. This is supported by the finding that only one fisher in the surveyed local communities identified as a shark fisher, and dive operators reported employing only three former shark fishers. In addition, most shark fisheries in Indonesia target large, pelagic species, which fetch higher value in domestic and international markets, particularly for their fins (Jaiteh et al., 2017; Yulianto et al., 2018). The off-shore fishing grounds for these species are far from typical tourism hotspots, and the target species have a high consumptive use value as a fisheries commodity, but relatively limited tourism value/interest, in comparison to popular reef-based species such as manta rays and reef sharks. These spatial and species separations further limit shark fishers’ opportunities to benefit from the tourism sector as a form of alternative livelihood, or as an economic incentive not to fish. What is more, the shark tourism sector may result in negative socioeconomic consequences for local fisher communities, due to resource restrictions created by no take zones (Jaiteh et al., 2016). It will be important to better understand and manage these trade-offs in the future, to ensure the long-term sustainable management of natural resources across all user groups, the fair and ethical treatment of local communities, and the achievement of multiple objectives under SDGs, CITES and the Convention on Biological Diversity (CBD).
Overall, this study provides the first comprehensive national-level assessment of shark and ray tourism in Indonesia, and its estimated economic value, as well as a critical assessment of how this valuable industry is contributing to the delivery of conservation outcomes. Our results show that the value of shark and ray tourism in Indonesia is large and growing, and has the potential to provide considerable economic incentives for protecting and sustainability managing key sites and species. We also show that the use of PPP and travel effort can be considered for similar studies on direct expenditure valuation in the future.
However, there are two major management implications for the role the tourism industry plays in delivering conservation outcomes: (1) the industry must be well-managed in order to maintain and grow this value in the long-term, e.g., through minimizing overcrowding at sites, and mitigating the negative environmental footprint of the tourism industry on the marine environment and shark and ray populations; (2) the economic benefits created by this tourism value are site-, species-, and people-specific. Because we cannot assume that the tourist expenditures are mostly going to the local businesses, input-output analysis needs to be conducted in the future to determine the local financial leakage from shark tourism. A tourism industry of which revenues mostly circulate locally is more likely to improve the local supports for conservation.
The nature of the tourism industry is biased toward supporting conservation of coastal reef-associated species, through a marine protected area/no take zone approach, and less beneficial for addressing broader fisheries management issues. Disparities between the people, places and target species that benefit from the non-use values of shark tourism and those that benefit from the consumptive-use values of shark fishing and trade hinder the creation of local incentives for reducing fishing mortality through tourism. What is more, these disparities may even be creating negative socioeconomic impacts for local people, as opposed to improved income and livelihood opportunities. Since it is well-known that fishing mortality represents the greatest threat to shark and ray species globally, and local incentives and engagement is key to conservation success (Oldekop et al., 2010; Waylen et al., 2010; Brooks et al., 2012), there is both a practical and ethical impetus be better acknowledged and manage these nuances and trades-offs in the future, particularly if the tourism sector intends to play a role in delivering positive outcomes for conservation and people.
Going forward, we may require the establishment of systems for optimally and equitably re-distributing tourism value, for example through taxation and/or payments for ecosystems services (PES) schemes, in order to provide compensation and/or incentives for to fishers and local communities to reduce their impact on shark populations. Lessons from PES schemes in several other countries, including Guatemala, Cambodia, and Tanzania, suggest that PES schemes can be effective at promoting sustainable management of ecosystems, and support rural development, provided they are established and managed appropriately (Ingram et al., 2014). Skill migrations can be quite challenging, particularly from fishing to a more structured occupation like tourism. Thus, vocational training workshops are needed to diversify skills of fishers (particularly shark and ray fishers) so that they are more ready to work in the tourism industry. These training workshops can range from how to properly guide tourists, improving English conversation skills, and hospitality skills, such as extending the services to providing food and beverages on-site for tourists.
In summary, there is a critical need to reduce shark and ray fishing mortality in Indonesia, in order to stabilize populations, save species and support ecosystems. This need can be achieved through improved spatial protection and fisheries management measures. However, while such regulations and resource restrictions may maintain and boost the marine tourism sector, they will inevitably lead to short-to-medium term economic losses in the fisheries sector. More needs to be done to understand and manage these complex trade-offs amongst places, people, species and industries, in order to maintain the long-term values of both marine tourism and fisheries sectors for the benefit of people, biodiversity and ecosystems in Indonesia.
Data Availability Statement
The datasets generated for this study are available on request to the corresponding author.
Ethics Statement
This work, led by the Wildlife Conservation Society (WCS) Indonesia Program, was conducted under a Memorandum of Understanding (MoU) and Technical Cooperation Agreement (TCA) between the Wildlife Conservation Society (WCS) and the Ministry of Environment and Forestry (MoEF) and Ministry Marine Affairs and Fisheries (MMAF) of the Republic of Indonesia, respectively. Lead author PM was employed as a short-term technical consultant by WCS to support this work.
Author Contributions
PM and HB designed the research, interpreted the data and wrote the document. PM analyzed the data. MI led the data collection.
Funding
Funding to conduct the study was received from the Walton Family Foundation (grant number 2016-1801) and the MacArthur Family Foundation (grant number 16-1603-1150717).
Conflict of Interest
The authors declare that the research was conducted in the absence of any commercial or financial relationships that could be construed as a potential conflict of interest.
Acknowledgments
We would like to thank the Walton Family Foundation, who supporting this research through a grant to the Wildlife Conservation Society – Indonesia Program, and the MacArthur Family Foundation for supporting the publication fees. We would also like to thank Lucy Emerton for her review and input to the early methodological design; the volunteers who assisted with data collection; the dive operators, tourists and fishers who provided us with valuable data; and the government offices and local leaders who gave us permission to collect data at their jurisdictions and sites. We are also very grateful to the two reviewers, whose constructive feedbacks have greatly improved this manuscript.
Supplementary Material
The Supplementary Material for this article can be found online at: https://www.frontiersin.org/articles/10.3389/fmars.2020.00261/full#supplementary-material
References
Alexander, B. (2018). Closure of Boracay Island [Online]. Available online at: https://www.conservationguide.org/news/closure-of-boracay-island (accessed July 15, 2019).
Anderson, R. C., Adam, M. S., Kitchen-Wheeler, A. M., and Stevens, G. (2011). Extent and economic value of manta ray watching in Maldives. Tour. Mar. Environ. 7, 15–27. doi: 10.3727/154427310x12826772784793
Balmford, A., and Whitten, T. (2003). Who should pay for tropical conservation, and how could the costs be met? Oryx 37, 238–250. doi: 10.1017/s0030605303000413
Blaber, S., Dichmont, C., White, W., Buckworth, R., Sadiyah, L., Iskandar, B., et al. (2009). Elasmobranchs in southern Indonesian fisheries: the fisheries, the status of the stocks and management options. Rev. Fish Biol. Fish. 19, 367–391. doi: 10.1007/s11160-009-9110-9
Booth, H., Muttaqin, E., Simeon, B., Ichsan, M., Siregar, U., Yulianto, I., et al. (2018). Shark and Ray Conservation and Management in Indonesia: Status and Strategic Priorities 2018-2023. Bogor: Wildlife Conservation Society.
Booth, H., Squires, D., and Milner-Gulland, E. J. (2019). The neglected complexities of shark fisheries, and priorities for holistic risk-based management. Ocean Coast. Manag. 182:104994. doi: 10.1016/j.ocecoaman.2019.104994
Bps East Java (2017). Provinsi Jawa Tengah Dalam Angka 2017 (The Province of East Java in figures 2017). Surabaya: BPS East Java (Jawa Tengah).
Bräutigam, A., Callow, M., Campbell, I., Camhi, M., Cornish, A., Dulvy, N., et al. (2015). Global Priorities for Conserving Sharks and Rays: A 2015–2025 Strategy. London: GSRI.
Brooks, J. S., Waylen, K. A., and Mulder, M. B. (2012). How national context, project design, and local community characteristics influence success in community-based conservation projects. Proc. Natl. Acad. Sci. U.S.A. 109, 21265–21270. doi: 10.1073/pnas.1207141110
Buckley, R. C., Castley, J. G., de Vasconcellos Pegas, F., Mossaz, A. C., and Steven, R. (2012). A population accounting approach to assess tourism contributions to conservation of IUCN-redlisted mammal species. PLoS One 7:e44134. doi: 10.1371/journal.pone.0044134
Cisneros-Montemayor, A. M., Barnes-Mauthe, M., Al-Abdulrazzak, D., Navarro-Holm, E., and Sumaila, U. R. (2013). Global economic value of shark ecotourism: implications for conservation. Oryx 47, 381–388. doi: 10.1017/s0030605312001718
Davidson, L. N., Krawchuk, M. A., and Dulvy, N. K. (2016). Why have global shark and ray landings declined: improved management or overfishing? Fish Fish. 17, 438–458. doi: 10.1111/faf.12119
Dharmadi, D., Mahiswara, M., and Kasim, K. (2017). Catch composition and some biological aspects of sharks in Western Sumatera Waters of Indonesia. Indonesian Fish. Res. J. 22, 99–108.
D’Lima, C., Welters, R., Hamann, M., and Marsh, H. (2016). Using regional geographic scale substitution to value coastal wildlife tourism: implications for stakeholders, conservation and management. Ocean Coast. Manag. 128, 52–60. doi: 10.1016/j.ocecoaman.2016.04.019
Dulvy, N. K., Fowler, S. L., Musick, J. A., Cavanagh, R. D., Kyne, P. M., Harrison, L. R., et al. (2014). Extinction risk and conservation of the world’s sharks and rays. eLife 3:e00590.
Dulvy, N. K., Simpfendorfer, C. A., Davidson, L. N., Fordham, S. V., Bräutigam, A., Sant, G., et al. (2017). Challenges and priorities in shark and ray conservation. Curr. Biol. 27, R565–R572. doi: 10.1016/j.cub.2017.04.038
Fahmi, and Dharmadi (2015). Pelagic shark fisheries of Indonesia’s Eastern Indian Ocean Fisheries Management Region. Afr. J. Mar. Sci. 37, 259–265. doi: 10.2989/1814232X.2015.1044908
Fauzi, A. (2017). Kemenpar Gandeng KKP Naikkan Pendapatan Devisa Wisata Bahari (Ministry of Tourism Asks the Help of Ministry of Marine Affairs and Fisheries to Increase Marine Tourism Revenue) [Online]. Jakarta: Kompas.
Gallagher, A. J., and Hammerschlag, N. (2011). Global shark currency: the distribution, frequency, and economic value of shark ecotourism. Curr. Issues Tour. 14, 797–812. doi: 10.1080/13683500.2011.585227
Hall, C. M. (2001). Trends in ocean and coastal tourism: the end of the last frontier? Ocean Coast. Manag. 44, 601–618. doi: 10.1016/s0964-5691(01)00071-0
IBM SPSS (2020). Collinearity Diagnostic. Available online at: https://www.ibm.com/support/knowledgecenter/SSLVMB_25.0.0/statistics_casestudies_project_ddita/spss/tutorials/reg_cars_collin_01.html (accessed January 20, 2020).
Ichsan, M., Muttaqin, E. M., Simeon, B. M., Afero, F., and Mukminin, A. (2019a). Sharks and Rays Fisheries Profile in Aceh Province, Aceh and Bogor, Aceh Marine and Fisheries Agency. New York, NY: Wildlife Conservation Society.
Ichsan, M., Simeon, B. M., Muttaqin, E. M., and Ula, S. (2019b). Shark Fisheries and Trade in Maluku Utara. Banda Aceh: ICFAES Unsyiah.
Indonesia Travel (2017). In 2017 Indonesia Targets 15 Million Tourists, or a Phenomenal 25 Percent Growth [Online]. Available online at: http://www.indonesia.travel/gb/en/news-events/news/in-2017-indonesia-targets-15-million-tourists-or-a-phenomenal-25-percent-growth (accessed November 21, 2017).
Ingram, J. C., Wilkie, D., Clements, T., Mcnab, R. B., Nelson, F., Baur, E. H., et al. (2014). Evidence of payments for ecosystem services as a mechanism for supporting biodiversity conservation and rural livelihoods. Ecosyst. Serv. 7, 10–21. doi: 10.1016/j.ecoser.2013.12.003
Jaiteh, V. F., Lindfield, S. J., Mangubhai, S., Warren, C., Fitzpatrick, B., and Loneragan, N. R. (2016). Higher abundance of marine predators and changes in fishers’ behavior following spatial protection within the world’s biggest shark fishery. Front. Mar. Sci. 3:43. doi: 10.3389/fmars.2016.00043
Jaiteh, V. F., Loneragan, N. R., and Warren, C. (2017). The end of shark finning? Impacts of declining catches and fin demand on coastal community livelihoods. Mar. Policy 82, 224–233. doi: 10.1016/j.marpol.2017.03.027
Karjan, D., Bajada, C., Melatos, M., and Morduch, J. (2020). Principles of Economics, 2nd Edn. New York, NY: McGraw Hill.
Lawrence, A. J., Budziak, A., Campbell, I., Cornish, A., Ender, I., Jeffries, B., et al. (2016). Responsible Shark & Ray Tourism: A Guide to Best Practice. Gland: WWF.
Milner-Gulland, E. J., Garcia, S., Arlidge, W., Bull, J., Charles, A., Dagorn, L., et al. (2018). Translating the terrestrial mitigation hierarchy to marine megafauna by-catch. Fish Fish. 19, 547–561. doi: 10.1111/faf.12273
Murphy, L., Mascardo, G., and Benckendorff, P. (2007). Exploring word-of-mouth influences on travel decisions: friends and relatives vs. other travellers. Int. J. Consumer Stud. 31, 517–527. doi: 10.1111/j.1470-6431.2007.00608.x
Musa, G. (2002). Sipadan: a SCUBA-diving paradise: an analysis of tourism impact, diver satisfaction and tourism management. Tour. Geogr. 4, 195–209. doi: 10.1080/14616680210124927
Mustika, P. L. K., Birtles, A., Everingham, Y., and Marsh, H. (2013). The human dimensions of wildlife tourism in a developing country: watching spinner dolphins at Lovina, Bali, Indonesia. J. Sustain. Tour. 21, 229–251. doi: 10.1080/09669582.2012.692881
Mustika, P. L. K., Birtles, A., Welters, R., and Marsh, H. (2012). The economic influence of community-based dolphin watching on a local economy in a developing country: implications for conservation. Ecol. Econ. 79, 11–20. doi: 10.1016/j.ecolecon.2012.04.018
Mustika, P. L. K., Welters, R., and Setiasih, N. (2018). “Tourist satisfaction and expenditures in a reef-adjoining dolphin watching industry in Lovina, Bali Indonesia,” in Coral Reefs: Tourism, Conservation and Management, eds A. Pabel and B. Prideaux (New York: Routledge).
Oldekop, J. A., Bebbington, A. J., Brockington, D., and Preziosi, R. F. (2010). Understanding the lessons and limitations of conservation and development. Conserv. Biol. 24, 461–469. doi: 10.1111/j.1523-1739.2010.01456.x
O’Malley, M. P., Lee-Brooks, K., and Medd, H. B. (2013). The global economic impact of manta ray watching tourism. PLoS One 8:e65051. doi: 10.1371/journal.pone.0065051
Pearce, P. L. (2006). “The value of a benchmarking approach for assessing service quality satisfaction in environmental tourism,” in Managing Tourism and Hospitality Services: Theory and International Applications, eds B. Prideaux, G. Moscardo, and E. Laws (London: CABI), 282–299. doi: 10.1079/9781845930127.0282
Phillips, W. J., Wolfe, K., Hodur, N., and Leistritz, F. L. (2013). Tourist word of mouth and revisit intentions to rural tourism destinations: a case of North Dakota, USA. Int. J. Tour. Res. 15, 93–104. doi: 10.1002/jtr.879
Richardson, L., Loomis, J., Kroeger, T., and Casey, F. (2015). The role of benefit transfer in ecosystem service valuation. Ecol. Econ. 115, 51–58. doi: 10.1016/j.ecolecon.2014.02.018
Selby, D., and Sepehr, J. (2018). The Philippines Is Shutting Down This Resort Island Because of Water Pollution. Available online at: https://www.globalcitizen.org/en/content/philippines-boracay-environment-waste-water-pollut/ (accessed 15 July 2019).
Spalding, M., Burke, L., Wood, S. A., Ashpole, J., Hutchison, J., and Zu Ermgassen, P. (2017). Mapping the global value and distribution of coral reef tourism. Mar. Policy 82, 104–113. doi: 10.1016/j.marpol.2017.05.014
Steven, R., Castley, J. G., and Buckley, R. (2013). Tourism revenue as a conservation tool for threatened birds in protected areas. PLoS One 8:e62598. doi: 10.1371/journal.pone.0062598
Stoeckl, N., Birtles, A., Farr, M., Mangott, A., Curnock, M., and Valentine, P. (2010). Live-aboard dive boats in the Great Barrier Reef: regional economic impact and the relative values of their target marine species. Tour. Econ. 16, 995–1018. doi: 10.5367/te.2010.0005
Sunlu, U. (2003). “Environmental impacts of tourism,” in Proceedings of the Conference on the Relationships between Global Trades and Local Resources in the Mediterranean Region, (Nairobi: UNEP), 263–270.
Tamayo, N. C. A., Anticamara, J. A., and Acosta-Michlik, L. (2018). National estimates of values of Philippine Reefs’ ecosystem services. Ecol. Econ. 146, 633–644. doi: 10.1016/j.ecolecon.2017.12.005
Topelko, K. N., and Dearden, P. (2005). The shark watching industry and its potential contribution to shark conservation. J. Ecotour. 4, 108–128. doi: 10.1080/14724040409480343
Vianna, G. M., Meekan, M. G., Rogers, A. A., Kragt, M. E., Alin, J. M., and Zimmerhackel, J. S. (2018). Shark-diving tourism as a financing mechanism for shark conservation strategies in Malaysia. Mar. Policy 94, 220–226. doi: 10.1016/j.marpol.2018.05.008
Vianna, G. M. S., Meekan, M. G., Pannell, D. J., Marsh, S. P., and Meeuwig, J. J. (2012). Socio-economic value and community benefits from shark-diving tourism in Palau: a sustainable use of reef shark populations. Biol. Conserv. 145, 267–277. doi: 10.1016/j.biocon.2011.11.022
Waylen, K. A., Fischer, A., Mcgowan, P. J., Thirgood, S. J., and Milner-Gulland, E. (2010). Effect of local cultural context on the success of community-based conservation interventions. Conserv. Biol. 24, 1119–1129. doi: 10.1111/j.1523-1739.2010.01446.x
Wong, P. (2004). “Environmental impacts of tourism,” in A Companion to Tourism, eds A. A. Lew, C. M. Hall, and A. M. Williams (Hoboken, NJ: Wiley).
Worm, B., Davis, B., Kettemer, L., Ward-Paige, C. A., Chapman, D., Heithaus, M. R., et al. (2013). Global catches, exploitation rates, and rebuilding options for sharks. Mar. Policy 40, 194–204. doi: 10.1016/j.marpol.2012.12.034
Yagi, C., and Pearce, P. L. (2007). The influence of appearance and the number of people viewed on tourists’ preferences for seeing other tourists. J. Sustain. Tour. 15, 28–43. doi: 10.2167/jost528.0
Keywords: shark, tourism, economic impact, ray, shark fisheries
Citation: Mustika PLK, Ichsan M and Booth H (2020) The Economic Value of Shark and Ray Tourism in Indonesia and Its Role in Delivering Conservation Outcomes. Front. Mar. Sci. 7:261. doi: 10.3389/fmars.2020.00261
Received: 07 August 2019; Accepted: 01 April 2020;
Published: 28 April 2020.
Edited by:
Asha de Vos, The Sri Lankan Blue Whale Project and Oceanswell, Sri LankaReviewed by:
Gabriel Vianna, University of Western Australia, AustraliaChristopher Mull, University of Tasmania, Australia
Copyright © 2020 Mustika, Ichsan and Booth. This is an open-access article distributed under the terms of the Creative Commons Attribution License (CC BY). The use, distribution or reproduction in other forums is permitted, provided the original author(s) and the copyright owner(s) are credited and that the original publication in this journal is cited, in accordance with accepted academic practice. No use, distribution or reproduction is permitted which does not comply with these terms.
*Correspondence: Putu Liza Kusuma Mustika, cHV0dWxpemFAZ21haWwuY29t