 Eric J. Raes1,2,3*
 Jodie van de Kamp1
 Levente Bodrossy1
 Allison A. Fong1
 Jessica Riekenberg4
 Bronwyn H. Holmes1
 Dirk V. Erler4Bradley D. Eyre4
 Sarah-Sophie Weil1
 A. M. Waite3,5,6
- 1CSIRO Oceans and Atmosphere, Hobart, TAS, Australia
- 2Alfred Wegener Institute, Helmholtz Center for Polar and Marine Research, Bremerhaven, Germany
- 3The Oceans Institute, The University of Western Australia, Crawley, WA, Australia
- 4Centre for Coastal Biogeochemistry, School of Environment, Science and Engineering, Southern Cross University, Lismore, NSW, Australia
- 5FB2 Biology/Chemistry, Universität Bremen, Bremen, Germany
- 6Ocean Frontier Institute and Department of Oceanography, Dalhousie University, Halifax, NS, Canada
Nitrogen (N) is an essential element for life and controls the magnitude of primary productivity in the ocean. In order to describe the microorganisms that catalyze N transformations in surface waters in the South Pacific Ocean, we collected high-resolution biotic and abiotic data along a 7000 km transect, from the Antarctic ice edge to the equator. The transect, conducted between late Austral autumn and early winter 2016, covered major oceanographic features such as the polar front (PF), the subtropical front (STF) and the Pacific equatorial divergence (PED). We measured N2 fixation and nitrification rates and quantified the relative abundances of diazotrophs and nitrifiers in a region where few to no rate measurements are available. Even though N2 fixation rates are usually below detection limits in cold environments, we were able to measure this N pathway at 7/10 stations in the cold and nutrient rich waters near the PF. This result highlights that N2 fixation rates continue to be measured outside the well-known subtropical regions. The majority of the mid to high N2 fixation rates (>∼20 nmol L–1 d–1), however, still occurred in the expected tropical and subtropical regions. High throughput sequence analyses of the dinitrogenase reductase gene (nifH) revealed that the nifH Cluster I dominated the diazotroph diversity throughout the transect. nifH gene richness did not show a latitudinal trend, nor was it significantly correlated with N2 fixation rates. Nitrification rates above the mixed layer in the Southern Ocean ranged between 56 and 1440 nmol L–1 d–1. Our data showed a decoupling between carbon and N assimilation (NO3– and NH4+ assimilation rates) in winter in the South Pacific Ocean. Phytoplankton community structure showed clear changes across the PF, the STF and the PED, defining clear biomes. Overall, these findings provide a better understanding of the ecosystem functionality in the South Pacific Ocean across key oceanographic biomes.
Introduction
Nitrogen (N), in all its oxidation states, is a key element for life on Earth. In marine ecosystems, N controls the magnitude of primary production, with microorganisms performing essential roles in the assimilatory and dissimilatory pathways of the N-cycle (Albright et al., 2018). These microorganisms form the base of the marine food web, and include archaea; hetero-, mixo-, and phototrophic bacteria; and phototrophic micro-eukaryotes (Falkowski, 1997).
N2 fixation and nitrification are two globally important, yet relatively poorly resolved new and regenerated N input processes. Quantifying the input of new N from N2 fixation, and the nitrogen budget in general, remains important and will aid in our understanding how the ocean’s productivity will be impacted by environmental change (Wang et al., 2019). Repeated N2 fixation rate measurements have been conducted in the eastern and western sides of the Pacific Ocean in the northern hemisphere, including in specific oceanographic features such as eddies in the North Pacific [see e.g., Mague et al. (1974); Montoya et al. (2004), Fong et al. (2008); Raimbault and Garcia (2008), Church et al. (2009); Chen et al. (2018) and references within Shiozaki et al. (2010)]. In the south eastern [e.g., Bonnet et al. (2013)] and western Pacific Ocean N2 fixation has been quantified (Shiozaki et al., 2010; Knapp et al., 2018). Halm et al. (2012) sampled the southern subtropical gyre, and rates have been measured in the equatorial region [e.g., Bonnet et al. (2009)], and Shiozaki et al. (2010) provided a comparison between the western and central Pacific basins. Of greater interest to this study are the results of Fong et al. (2008); Bonnet et al. (2009), and Chen et al. (2018) which showed that mesoscale physical variability can play a significant role in modifying the abundances of diazotrophs, and that distinct spatial niches and diel patterns can be observed for Trichodesmium sp. and unicellular diazotrophs. Heterotrophic Gammaproteobacteria have been found to be widespread throughout the oligotrophic subtropical Pacific gyre and have been shown to occupy an ecological niche that overlaps with the unicellular cyanobacterial lineages A and B [UCYN-A and UCYN-B; Halm et al. (2012) and Chen et al. (2018)]. The exact ecological roles of heterotrophic Gammaproteobacteria and their contribution to N2 fixation rates, however, remain elusive (Turk-Kubo et al., 2014; Benavides et al., 2018). Bonnet et al. (2017) and Chen et al. (2018) clearly showed that the abiotic factors (and currents) which reflect iron bioavailability have a significant control on the diazotroph biogeography. Yet, as the Pacific Ocean is the largest Ocean basin on Earth, the spatial and temporal controls of the input of new N from N2 fixation remain poorly quantified (Shiozaki et al., 2017).
Basin wide measurements enable the quantification of changes across boundaries, as sampling region extends from one ecological province to the other. Oceanographic fronts have been shown to act as boundaries in the ocean, capable of separating and structuring microbial communities and ecosystem functions (Baltar et al., 2016; Raes et al., 2018a). Shiozaki et al. (2017), provided the first basin wide N2 fixation rate measurements, conducted from the equatorial Pacific to the Bering Sea (68°N) along the 170° W meridian. The authors concluded that, although N2 fixation was widespread (up to the Bering Sea) the biogeochemical controls on the numbers and activity of the different diazotrophs required further investigation. In our study we report on the distribution and activity of diazotrophs from the ice edge at 66°S until the equator along the 170°W meridional, thus complementing the basin scale transect that was visited by Shiozaki et al. (2017). Our aim was to narrow down the biotic and abiotic controls on N2 fixation rates in the southern part of the Pacific Ocean.
Global data on nitrification rates above the mixed layer are sparse (Yool et al., 2007; Beman et al., 2011) and will contribute to high uncertainties when estimating the f-ratio (Dugdale and Goering, 1967; Eppley and Peterson, 1979). Neglecting or underestimating nitrification rates results in an overestimation of the f-ratio (Eppley and Peterson, 1979), and can thereby impact modeling estimates of global oceanic production. In oligotrophic systems low primary productivity rates have been associated with high nitrification activity (Clark et al., 2008). As the low nutrient ocean gyres are expanding (Polovina et al., 2008) quantifying nitrification rates merits investigation and will consequently improve our estimates of biological productivity in these oligotrophic regions (Dugdale and Goering, 1967). For completion we note that a second consequence of sparse nitrification rates are an underestimation of the levels of a potent greenhouse gas, nitrous oxide (N2O), which is a by-product of the formation of hydroxylamine from ammonium (NH4+) during nitrification (Naqvi et al., 2000; Santoro et al., 2011).
Our goal for this study was to capture a snapshot of the biogeography and controls on N cycling rates and C assimilation of marine prokaryotes and eukaryotes from the ice edge (66°S) until the equator (0°S) along the 170°W meridional in the surface waters of the South Pacific Ocean. A focus of our work was to quantify N cycling rates and assess the diversity of diazotrophs and nitrifiers across ocean boundaries. Our overarching aim was to use the P15S latitudinal GO-SHIP transect as a natural laboratory to characterize trends in N2 fixation and nitrification rates, quantify carbon assimilation rates, and relate changes in the δ15N of the particulate organic matter (POM) to the turnover of biological communities and abiotic factors along the transect.
Materials and Methods
Study Region and Water Sampling
The study region, a 7000 km transect located along the longitudinal P15S GO-SHIP line at 170°W, was surveyed at every half degree onboard the R.V. Investigator from 23 April to 29 June (late Austral autumn/early winter) 2016. The P15S GO-SHIP line is a decadally repeated transect that runs from the ice edge (66°S) to the equator (0°S; Figure 1)1. The expedition traversed four oceanographic provinces (Longhurst, 2010): (1) the Sub-Antarctic between 66°S and 52°S, including the Polar Front (PF; at 60°S); (2) the Subtropical front (STF) between 52°S and 40°S; (3) the South Pacific Subtropical Gyre (SPSG) between 40°S and 10°S, and (4) the Pacific Equatorial Divergence Province (PED), between 10°S and 0°S.
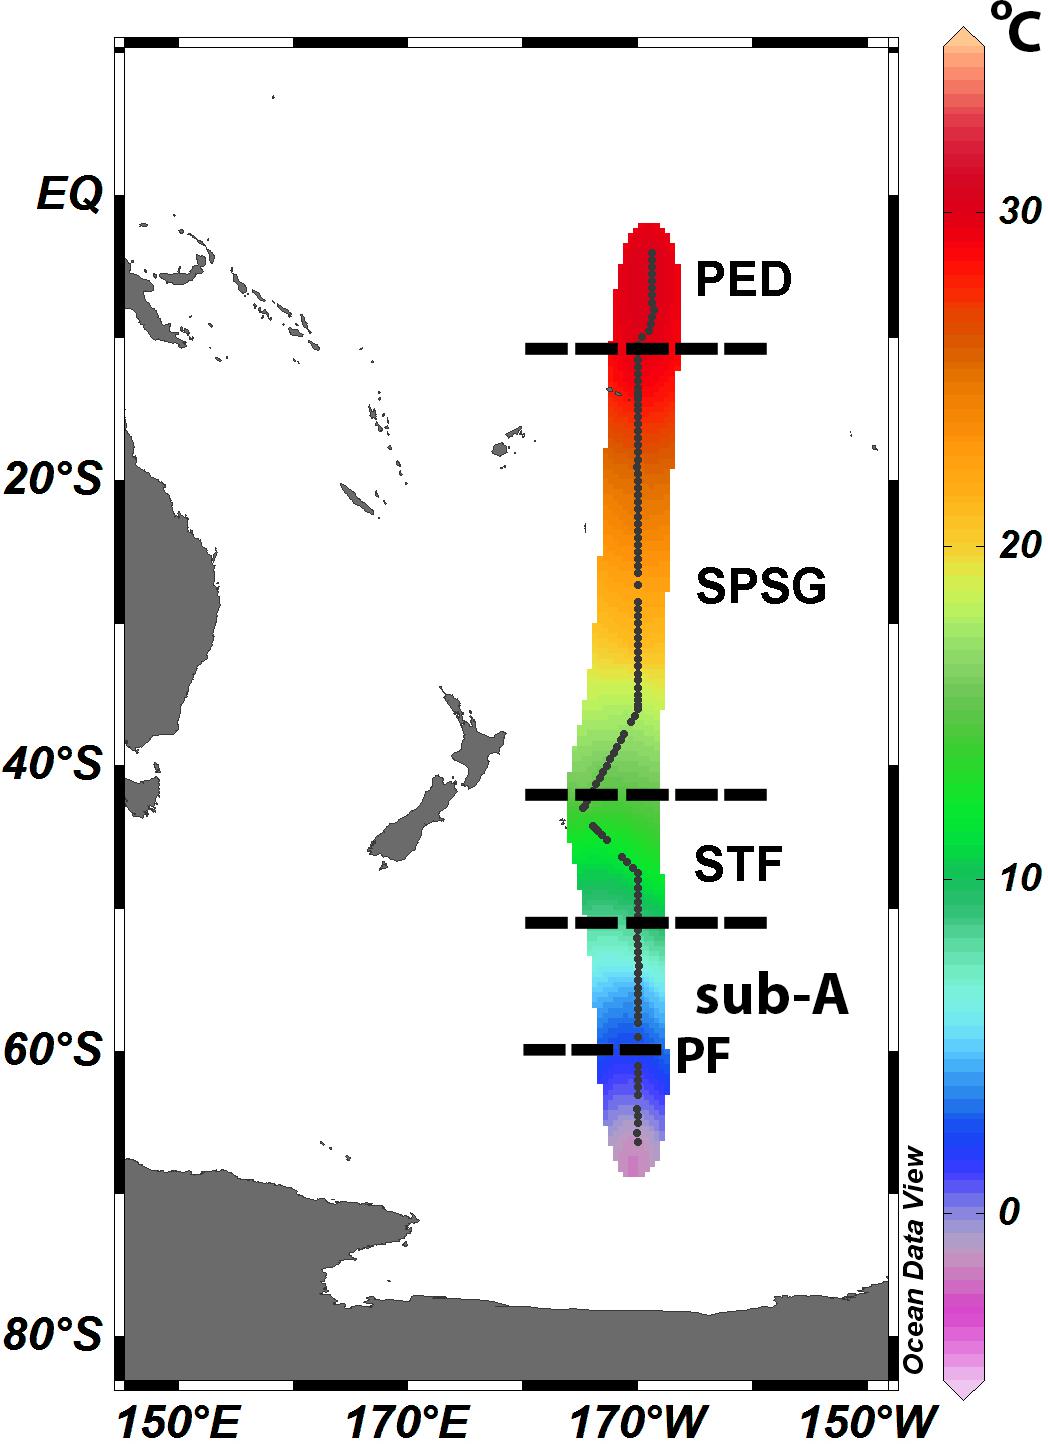
Figure 1. Water masses along the P15S GO-SHIP transect. Dashed lines delineate the four oceanographic provinces according to Longhurst (2010): (1) the Sub-Antarctic (Sub-A) between 66°S and 52°S, including the Polar Front (PF; at 60°S), (2) the Subtropical front (STF) between 52°S and 40°S, (3) the South Pacific Subtropical Gyre Province (SPSG) between 40°S and 10°S, and (4) the Pacific Equatorial Divergence Province (PED), respectively, between 10°S and 0°S. Black dots represent CTD station locations. Sea surface temperature (°C) overlaid in color.
Hydrographic data were collected from 36 depth horizons at 140 stations, using a Seabird (SBE25 plus) conductivity-temperature-depth (CTD) profiler mounted on a 36 Niskin bottle rosette sampler. Full depth profiles for temperature, conductivity, and dissolved oxygen were collected at each station and sampling depth. Seawater samples were collected from the Niskin bottles at all depths for nutrient analysis; and from the surface (SFC) and the base of the mixed layer depth (MLD) for measuring nitrification rates and for DNA analyses (described below). For detailed information on the sensors mounted on the rosette and data availability please refer to the Supplementary Material.
Seawater samples were collected from the underway flow-through system (intake at 6 m) for N2 fixation rate measurements, for NO3– and NH4+ assimilation rates, for C assimilation rates (primary productivity), for the particulate organic C and N (POC/N) and for pigment analyses (all described below). The seawater intake on the R.V. Investigator designated underway flow-through system is located on the vessel’s drop keel, which are stored out of the water when not in use. Consequently, the intake and first parts of the plumbing dry out between sampling events, which resets any biological growth at this part of the structure. Furthermore, all tubing and pipework in the underway flow-through system are flushed and consecutively flooded with fresh water at the end of each voyage. Nevertheless, we acknowledge the caveat of potential biological growth in the underway flow-through system. Another artifact associated with underway in-line sampling (for N2 fixation) could be cell damage, especially in the case of Trichodesmium filaments. We note that we did not encounter any visual Trichodesmium blooms, nor did we see any trichomes or colonies on the GF/F filters. The underway flow-through system is made from Teflon which should reduce the contamination of iron supply.
Nutrient Analysis of Seawater
Dissolved inorganic concentrations of silicate, (Si) phosphate, (PO43–), nitrate, (NO3–), nitrite, (NO2–), and ammonium (NH4+) were assayed at sea on a Bran + Luebbe AA3 HR segmented flow analyzer (detection limits, respectively, 0.2, 0.01, 0.01, 0.015, and 0.015 μmol L–1) by the CSIRO Hydrochemistry group, following standard spectrophotometric methods (Armstrong et al., 1967; Kérouel and Aminot, 1997; Aminot et al., 2009; Hansen and Koroleff, 2009; Hydes et al., 2010). Please refer to the Supplementary Material for detailed methodology. Dissolved oxygen (O2) concentrations were determined by titration following Winkler (1888).
N2 Fixation Measurements
In total, 122 seawater samples were collected for N2 fixation rate measurements. N2 fixation rate measurements were performed using the modified bubble injection method (Montoya et al., 1996; Mohr et al., 2010; Klawonn et al., 2015), using 98% 15N2 gas [Cambridge Isotope Laboratories, Inc., lot #NLM-363-1-LB, as recommended by Dabundo et al. (2014)]. Ten mL of 98% 15N2 gas) at atmospheric pressure were added to each 4.5 L incubation bottle, which were then gently rocked for 15 min on an orbital shaker at 100 rpm to enhance the dissolution of the 15N2-gas bubble. This ensured consistent agitation and reduced variability of the final 15N-atom% enrichment (Klawonn et al., 2015). After shaking, the gas bubble was removed and the bottles were kept for 24 h under natural light in on-deck incubators. N2 fixation measurements were terminated by filtering contents of each bottle (<10 kPa) onto a 25 mm pre-combusted (at 500°C for 24 h) Whatman® GF/F filter (nominal pore size 0.7 μm). A 12 mL subsample was collected after 24 h from each bottle and preserved in an Exetainer® vial with 100 μL saturated HgCl solution for 15–15N analysis. Unfortunately, samples for final 15–15N analyses were damaged, therefore values specific to this study cannot be reported. We have, however, as the dissolution of N2 gas is a physical process, used the final 15–15N enrichment values from a voyage which we conducted in 2017 along a latitudinal gradient in the Indian Ocean spanning temperatures from 3 to 28°C and salinities ranging from 33.6 to 35.5 PSU (OSIO MD206 campaign)2. Please refer to the Supplementary Material for detailed information.
Prior to incubation, four liters of water were filtered onto pre-combusted (at 500°C for 24 h) 25 mm Whatman® GF/F filters for particulate organic N (PON). The PON samples, which were used as the initial t0 values, were analyzed at the Isotopic Laboratory at University of California, Davis. The minimum quantifiable N2 fixation rate was calculated as described in Montoya et al. (1996) and Gradoville et al. (2017) and varied between 0.054 and 0.472 nmol L–1 d–1 in the sub-Antarctic region (please refer to Supplementary Table 1). We note that we sacrificed higher replication for N2 fixation rate measurements at the majority of stations in order to cover a greater spatial resolution (every 0.5°). In addition, we refer the reader to Supplementary Figures 2A,B which shows 15N incorporation into the PON during N2 fixation rate measurements.
NO3–, NH4+ and Carbon Assimilation Rate Measurements
Incubation experiments to measure NO3–, NH4+, and carbon (C) assimilation rates (from hereafter primary productivity) were also collected from the clean underway flow through system. Clear, 1 L polycarbonate bottles were used to incubate seawater for 24 h in order to measure NO3–, NH4+, and primary productivity. Experiments were initiated by adding known concentrations of 99% K15NO3 and 99% 15NH4Cl to the bottles according to Knap et al. (1996). Replicates for the incubations and, thus, assimilation rate measurements, of NO3– and NH4+ were sacrificed at each station in favor of a greater spatial resolution. On the other hand, all bottles with 15N-labeled tracers (15NO3–, 15NH4+, and 15N2 from the NO3– and NH4+ assimilation and N2 fixation incubations, respectively) were spiked with a NaH13CO3 solution (final conc. 20 μmol L–1), resulting in triplicate measurements for primary productivity. Natural abundance samples for particulate organic C (POC) and PON were used as initial (t0) values in the calculation of the N and primary productivity rates. Please refer to the Supplementary Material for the detailed methodology. Primary productivity and nitrogen assimilation data from this study are available at https://doi.pangaea.de/10.1594/PANGAEA.884052 (Raes et al., 2017) and https://doi.pangaea.de/10.1594/PANGAEA.885169 (Raes et al., 2018b).
Nitrification Measurements
Total nitrification rates (NH4+ oxidation to NO3–) were measured during 24 h incubations of seawater sampled from the surface and at the base of the MLD. In order to do so, clear polycarbonate bottles (0.5 L) were amended with 15NH4+ at a concentration of 50 nmol L–1, resulting in trace additions between 6 to 25% of 15NH4+). Neutral density screens were placed around the bottles during the incubation in order to mimic light intensities at the respective depths. After 24 h 50 mL of water was filtered through a Whatman® nylon membrane filter (47 mm diameter, 0.22 μm pore size) and samples were stored at −80°C.
Prior to incubation, samples for the natural abundance of δ 15N-NO3– (t0 measurements) in each depth layer were obtained by filtering 50 mL of water through a Whatman® nylon membrane filter (47 mm diameter, 0.22 μm pore size). Technical duplicates of the δ15N-NO3– were measured using the denitrifier method (Sigman et al., 2001; McIlvin and Casciotti, 2011) on a custom gas bench (Thermo Fisher Gasbench II) coupled to a Thermo Fisher Delta V Plus at the Centre for Coastal Biogeochemistry of Southern Cross University, Bilinga, QLD, Australia. The rate of total nitrification (NH4+ oxidation) was calculated following Peng et al. (2015). We were unable to measure total nitrification rates in oligotrophic waters where environmental NO3– concentrations were <0.05 μmol L–1 due to the detection limit of the denitrifier method. See Supplementary Material for detailed methodology.
DNA Collection, nifH PCR Amplification, Amplicon Sequencing and Downstream Analysis
For each depth layer two L of seawater were filtered through SterivexTM GP filters (Millipore®, Burlington, MA, United States. Cat. # SVGPL10RC; 0.2 μm pore size) with a peristaltic pump. DNA was extracted with the PowerWater Sterivex DNA Isolation Kit (Mo Bio Laboratories, United States) using a modified protocol which includes a phenol:chloroform:isoamyl alcohol extraction. DNA was then eluted in 80 μl TE buffer (Appleyard et al., 2013; see Supplementary Material for detailed information on the DNA extraction protocol).
The nifH gene which is used as a functional marker of diazotroph diversity was PCR amplified (∼359-bp) from environmental DNA extracts using a nested PCR protocol (Zehr and McReynolds, 1989; Zehr and Turner, 2001). Two sets of degenerate primers were used to target the region: for the 1st PCR reaction the nifH3 reverse primer (5′-ATRTTRTTNGCNGCRTA-3′) and the nifH4 forward primer (5′-TTYTAYGGNAARGGNGG-3′) were used. The 2nd PCR reaction was done with the nifH1 forward primer (5′-TGYGAYCCNAARGCNGA-3′) and the nifH2 reverse primer (5′-ADNGCCATCATYTCNCC-3′). Illumina adapters were incorporated with the 2nd stage PCR. PCR cycling conditions were similar to Messer et al. (2016) and detailed information is outlined in the Supplementary Material. The PCR products were purified using AMPureTM magnetic beads (Agencourt, Beckman Coulter Life Science, United States) according to the manufacturer’s instructions. Purified amplicons were then sent to the Ramaciotti Centre for Genomics (UNSW Sydney, Australia) for high throughput sequencing. The 140 nifH amplicon samples were multiplexed on one sequencing run. Nextera XT barcode incorporation, purification, library generation and sequencing using the Illumina MiSeq platform (Illumina, Inc., San Diego, United States), with 250 bp paired reads, were performed according to the manufacturer’s directions.
We used the DADA2 (version 1.4.0) pipeline implemented in R-3.6.1 to process raw sequences into amplicon sequence variants (ASVs) (Callahan et al., 2016). The parameters for the DADA2 pipeline were: truncLen = c(240,200), maxN = 0, maxEE = c(2,5), truncQ = 2, m.phix = TRUE, trimLeft = 5). The first 5 bps were removed from the forward and reverse reads. The forward reads were trimmed to 240 bps and the reverse reads to 200 bps. The forward and reverse reads were then truncated beyond the first instance of quality scores below 3 (“truncQ = 2”). The maximum expected error during denoising (“maxEE”) was 2 and 5 for forward and reverse reads. Denoised reads were then merged and chimeric contigs discarded using the functions “mergePairs” and “removeBimeraDenovo.” Non-target-length sequences, which could potentially be introduced as a result of non-specific priming, were removed from the sequence table. Only sequences with a length between 250 and 400 bp were kept. Samples with less than 1000 reads were removed and the nifH sequence table was subsampled to a minimum depth of 1316 sequences per sample. Taxonomic ranks were assigned to the inferred ASVs using the nifH gene reference database collated by the Zehr research group3 using the DADA2 function “assignTaxonomy.”
We determined the nitrifying community from archaeal and bacterial 16S rRNA gene amplicon sequences. The bacterial V1-V3 region of the 16S rRNA gene [primers 27F–519R; (Lane et al., 1985; Lane, 1991) and archaeal 16S rRNA gene amplicons (primers A2F–519R; (Lane et al., 1985; DeLong, 1992)] were sequenced at the Ramaciotti Centre for Genomics (UNSW Sydney, Australia). 16S rRNA gene amplicons were sequenced using an Illumina MiSeq system producing 300 bp reads per end. We used the open reference OTU picking pipeline in USEARCH 64 bit v8.0.1517 (Edgar, 2010) to quality control and cluster the sequences, and a rarefying function to normalize sequencing depth across the samples. OTU tables were subsampled to a constant sampling depth of 13400 and 26000 sequences per sample for archaea and bacteria. Detailed methodology on the bioinformatics are outlined in the Supplementary Material and in Bissett et al. (2016).
Pigment Analysis
Four L of seawater were filtered through Whatman® GF/F filters (25 mm, pore size 0.7 μm) using vacuum filtration (<10 kPa). High Performance Liquid Chromatography (HPLC) was used to determine 23 different photosynthetic pigments present in the samples. HPLC of the collected samples were performed according to the methodology employed at the CSIRO laboratories in Hobart, Australia [see Hooker et al. (2012)]. The HPLC data were analyzed using diagnostic pigments of dominant phytoplankton functional guilds as well as size classes according to Hirata et al. (2008). We note that diagnostic pigment analysis has its ambiguities (e.g., fucoxanthin is a precursor for 19′-butanoyloxyfucoxanthin and 19′-hexanoyloxyfucoxanthin) but we believe our data analyses are valid. For detailed information please refer to Supplementary Material and the validation of these analyses by Uitz et al. (2006); Ras et al. (2008), Aiken et al. (2009). All pigment data are available at https://doi.pangaea.de/10.1594/PANGAEA.884052.
Richness and Statistics
nifH gene richness was calculated as the number of ASVs observed per sample [as per Fuhrman et al. (2008)]. Correlations between rate data, phytoplankton biomass and abiotic parameters were calculated using the Spearman coefficient rs as a measure of rank correlation, as it assesses monotonic relationships, not purely linear relationships. Multiple error rate correction for the correlation analysis was performed using the Holm’ method (Holm, 1979). Alpha and beta diversity were plotted using the Phyloseq version 1.28.0 package (McMurdie and Holmes, 2013) in R-3.6.1 (R Core Team, 2013). Negative exponential smoothing curves with a first polynomial order were used to visualize trends and were produced using the Sigmaplot® v.14.0 software package. Polynomial regression analysis was done using the Sigmaplot® v.14.0 software package. The influence of predictor variables on N2 fixation rates, DIN assimilation rates and primary productivity were assessed using boosted regression trees (BRT; Elith et al. (2008), please refer to the Supplementary Material for more information). BRT was implemented in the R-3.6.1 software environment using the gbm.step function, a gaussian error structure, 10 fold cross-validation, and the following settings which resulted in models with >1200 trees in all cases; learning.rate = 0.001, tree.complexit = 10, bag.fraction = 0.5 (Elith et al., 2008). The cross-validation correlation (cv ± standard error) is a technique to evaluate how predictive the model is, and it is comparable to an r2 value (for more information please refer to the Supplementary Material).
Results
Hydrographic Conditions Above the MLD
Prominent oceanographic features encountered along the P15S GO-SHIP transect were the PF (∼60°S), the STF (∼45°S), and the PED (∼5°S; Figure 2). The most prominent feature was the STF which divides the less saline, colder, and nutrient rich sub-Antarctic waters from the warmer and saltier subtropical waters (Figure 2). This pattern can be visualized in Figure 2, which shows strong latitudinal changes in temperature (from 11.80 to 15.62°C, Figure 2A) and salinity (from 34.6 to 35.2, Figure 2B) across the STF. The 26 and 27 kg m–3 pycnoclines are observed at increasingly shallower depths closer to the Equator, and their shallower location at 150 m depth at ∼5°S is a clear signal of equatorial upwelling (Figures 2A,C,D,F). Overall, along the transect, temperatures increased gradually from –2°C in the Southern Ocean to 30°C toward the equator (Figure 2A). Dissolved oxygen levels decreased from 350 μmol kg–1 in surface waters at 66°S to 180 μmol kg–1 at the equator (Figure 2C), with the lowest concentrations in the upper 500 m being found near the PED (Figure 2C).
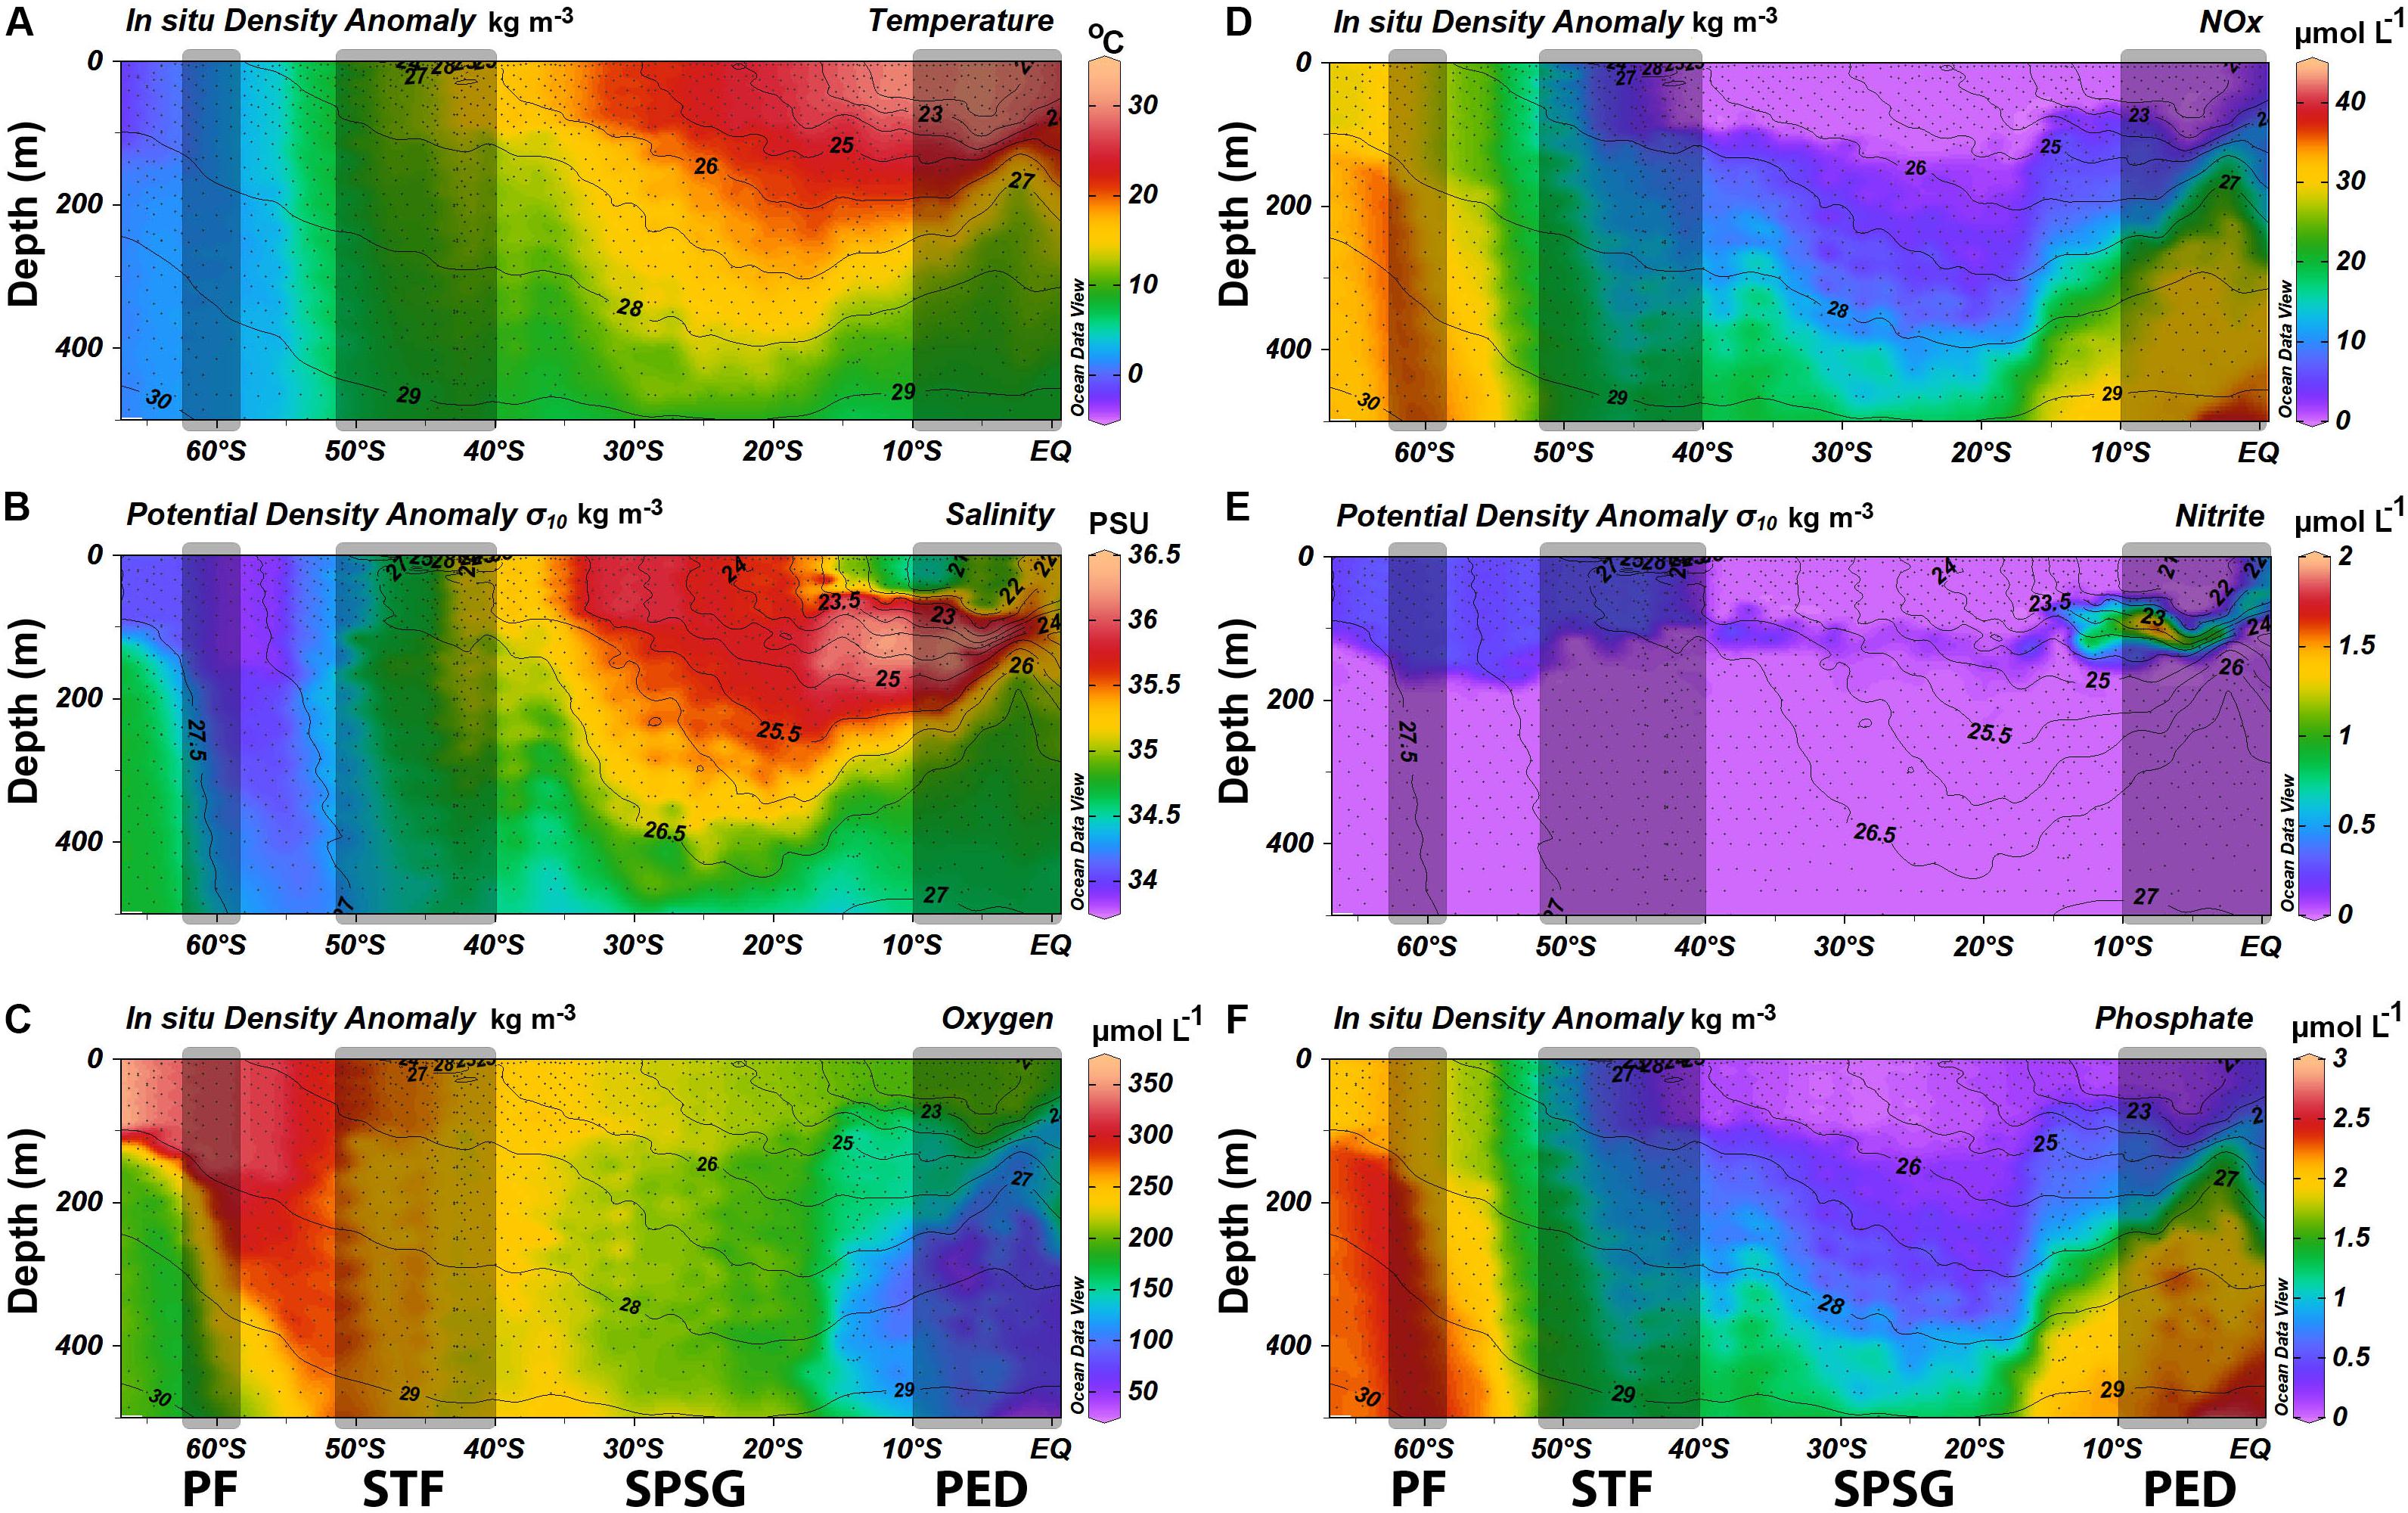
Figure 2. Physical and chemical plots with in situ density anomalies [kg.m–3; plots (A,C,D,F)] and potential density anomalies [kg.m–3; plots (B,E)] overlaid as contour lines along the P15S GO-SHIP transect (A) Temperature (°C) profile from the surface to 500 m, (B) Salinity (PSU) from the surface to 500 m depth, (C) Dissolved oxygen (μmol L–1) concentrations from the surface to 500 m depth, (D) Concentrations NO3– μmol L–1) from the surface to 500 m depth, (E) NO2– concentrations (μmol L–1) from the surface to 500 m depth, and (F) PO43– concentrations (μmol L–1) from the surface to 500 m depth. Black dots denote sampling depths of 140 CTD stations. Gray rectangles denote oceanographic fronts (PF, Polar front; STF, Subtropical Front; Eq, Equatorial upwelling zone).
Chemical Conditions
Changes in dissolved inorganic nutrient concentrations above the MLD were closely linked to the major oceanographic features. NO3– concentrations generally declined from south to north, with clear changes north of the PF and north of the STF, to then increase near the PED (Figure 2D). They plummeted from values as high as 30 μmol L–1 in the Southern Ocean to between 8 and <1 μmol L–1 in the southern and northern boundaries of the STF, respectively, to <0.05 μmol L–1 north of the STF, and then increased to 2 μmol L–1 near the PED (Figure 2D). NO2– concentrations peaked at 0.3 μmol L–1 south of the STF and decreased north until ∼ 40°S, within the SPSG values were slightly elevated below the MLD than above it (Figure 2E). NO2– concentrations in the PED reached 1 μmol L–1, and a NO2– maximum was recorded at approximately 9°S at 100 m depth, suggesting recycling of organic matter (see section “Discussion”). NO2– concentrations were up to 2 μmol L–1 above the MLD in the PED. PO43– concentrations decreased from 2.2 to 0.15 μmol L–1 from the sub-Antarctic toward the STF, further declining to <0.01 μmol L–1 north of the STF (Figure 2F). Ammonium showed a similar pattern as that of NO2–, with high surface concentrations (0.8 μmol L–1) in the Southern Ocean which declined below the detection limit north of the STF to increase again (0.2 μmol L–1) near the equator (Supplementary Figure 1). Silicate concentrations decreased rapidly from 75 to 0.1 μmol L–1 as the STF was crossed northward, and remained low in tropical waters. NO3–: PO43– ratios averaged 14.24 ± 0.25 in the sub-Antarctic Zone, 9.76 ± 2.32 in the STF, 0.431 ± 0.874 in the oligotrophic SPSG, and 5.6 ± 1.4 in the PED.
N2 Fixation and Diazotrophs
The minimum quantifiable N2 fixation rates [MQRs, for description on how to calculate it please refer to Montoya et al. (1996) and Gradoville et al. (2017)] for the sub-Antarctic averaged 0.166 ± 0.138 nmol L–1 d–1 (Supplementary Table 1). The N2 fixation rates were greater than the MQR in 7/10 of the sub-Antarctic stations (Figures 3A,B; station-specific MQRs are presented in Supplementary Table 1). North of 50°S, crossing the STF northward, N2 fixation rates increased steadily from 1 to 10.5 nmol L–1 d–1 at 50 and 40°S, respectively (Figures 3A,B; the MQR was never greater than 1 nmol L–1 d–1 across the transect line). N2 fixation rates ranged between 7.3 and 134 nmol L–1 d–1 in the SPSG (Figure 3A) and between 11 and 37.5 nmol L–1 d–1 north of 10°S, near the PED (Figures 3A,C).
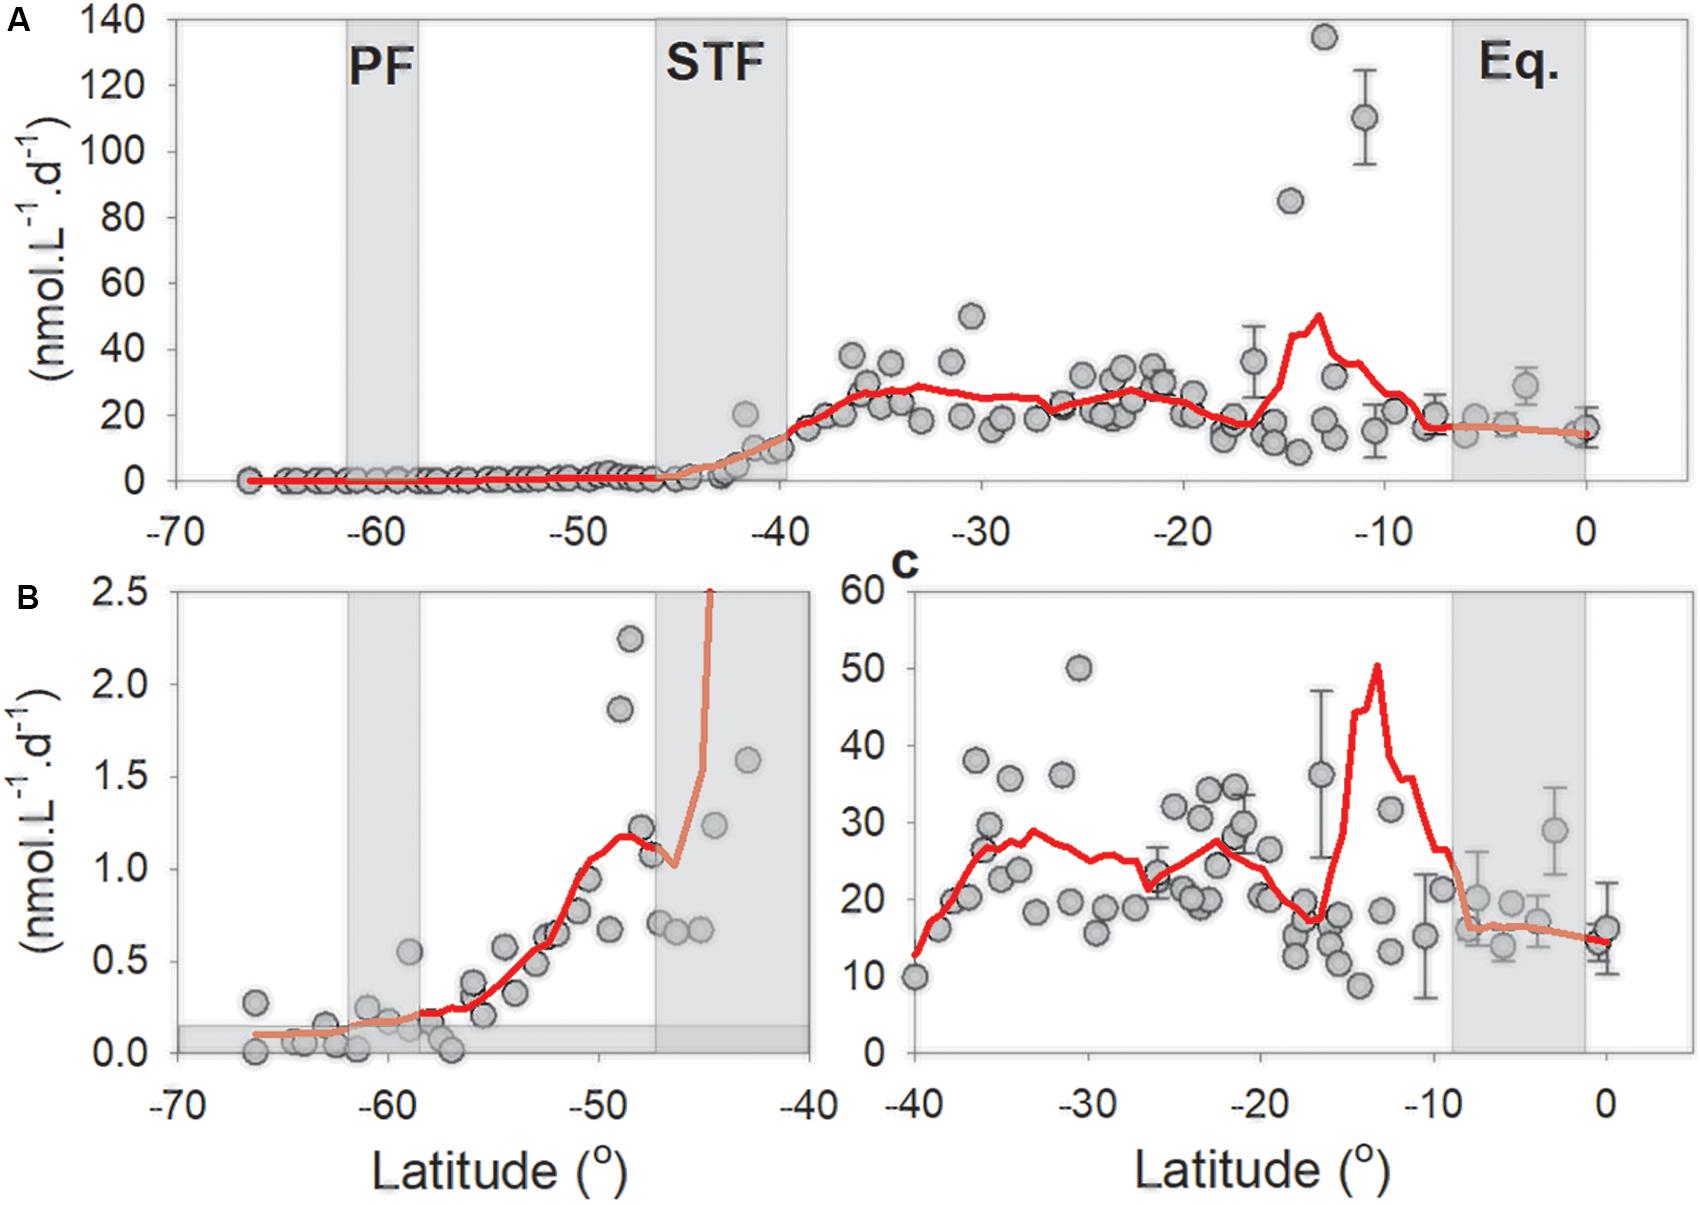
Figure 3. (A) N2 fixation rates along the P15S GO-SHIP transect from the ice edge up to the equator. Red line is a negative exponential smoothing curve with a first polynomial order. (B) Higher resolution plot of N2 fixation rates between 66° and 40°; note Y-axis is now from zero to 2.5 nmol L–1 d–1. Horizontal filled gray bar denotes the average minimum quantifiable N2 fixation rates (calculated according to Montoya et al. (1996); Supplementary Table 1 provides the MQR at a one-degree resolution). (C) High resolution plot of N2 fixation rates between 40° and 0°; note Y-axis is now from zero to 60 nmol L–1 d–1. Gray rectangles denote oceanographic fronts (PF, Polar front; STF, Subtropical Front; Eq, Equatorial upwelling zone). Standard deviations are presented at the stations were we had duplicate and or triplicate measurements.
The nifH gene was amplified and sequenced to assess the diversity of the diazotrophic community. nifH gene richness did not show a latitudinal trend (Figure 4A), nor was it significantly correlated with N2 fixation rates (r2 = 0.009, p = 0.7; Supplementary Figure 5). Overall, diazotroph diversity along the transect was dominated by Cluster I, which is the conventional Molybdenum-containing group of nifH sequences and encompasses proteobacteria and cyanobacteria. In the sub-Antarctic province, the community consisted predominantly of non-cyanobacterial diazotrophs such as undefined alphaproteobacteria, actinobacteria, subdivisions of the delta and epsilonproteobacteria, and unclassified diazotrophic bacteria, though relatively high abundances of cyanobacterial Oscillatoriophycideae were recorded in some stations south of 60°S. An increase in the relative abundance of epsilonproteobacteria was recorded near the STF, but the nifH diversity in the area was dominated by sequences belonging to the Gammaproteobacteria. nifH diversity within the SPSG was dominated by the Oscillatoriophycideae between 34.5 and 19.5°S (Figures 4B,C), and by Trichodesmium, Candidatus Atelocyanobacterium, and Gammaproteobacteria north of 19.5°S (Figure 5). Relative abundances of Gammaproteobacteria and unclassified proteobacteria increased near the PED. Cyanobacterial diazotrophs were recorded along the entire transect. A non-metric multi-dimensional scaling (nMDS) revealed significant differences between the diazotrophic communities of the sub-Antarctic and PED (ANOSIM, R value = 0.692, p < 0.001; Supplementary Figure 7).
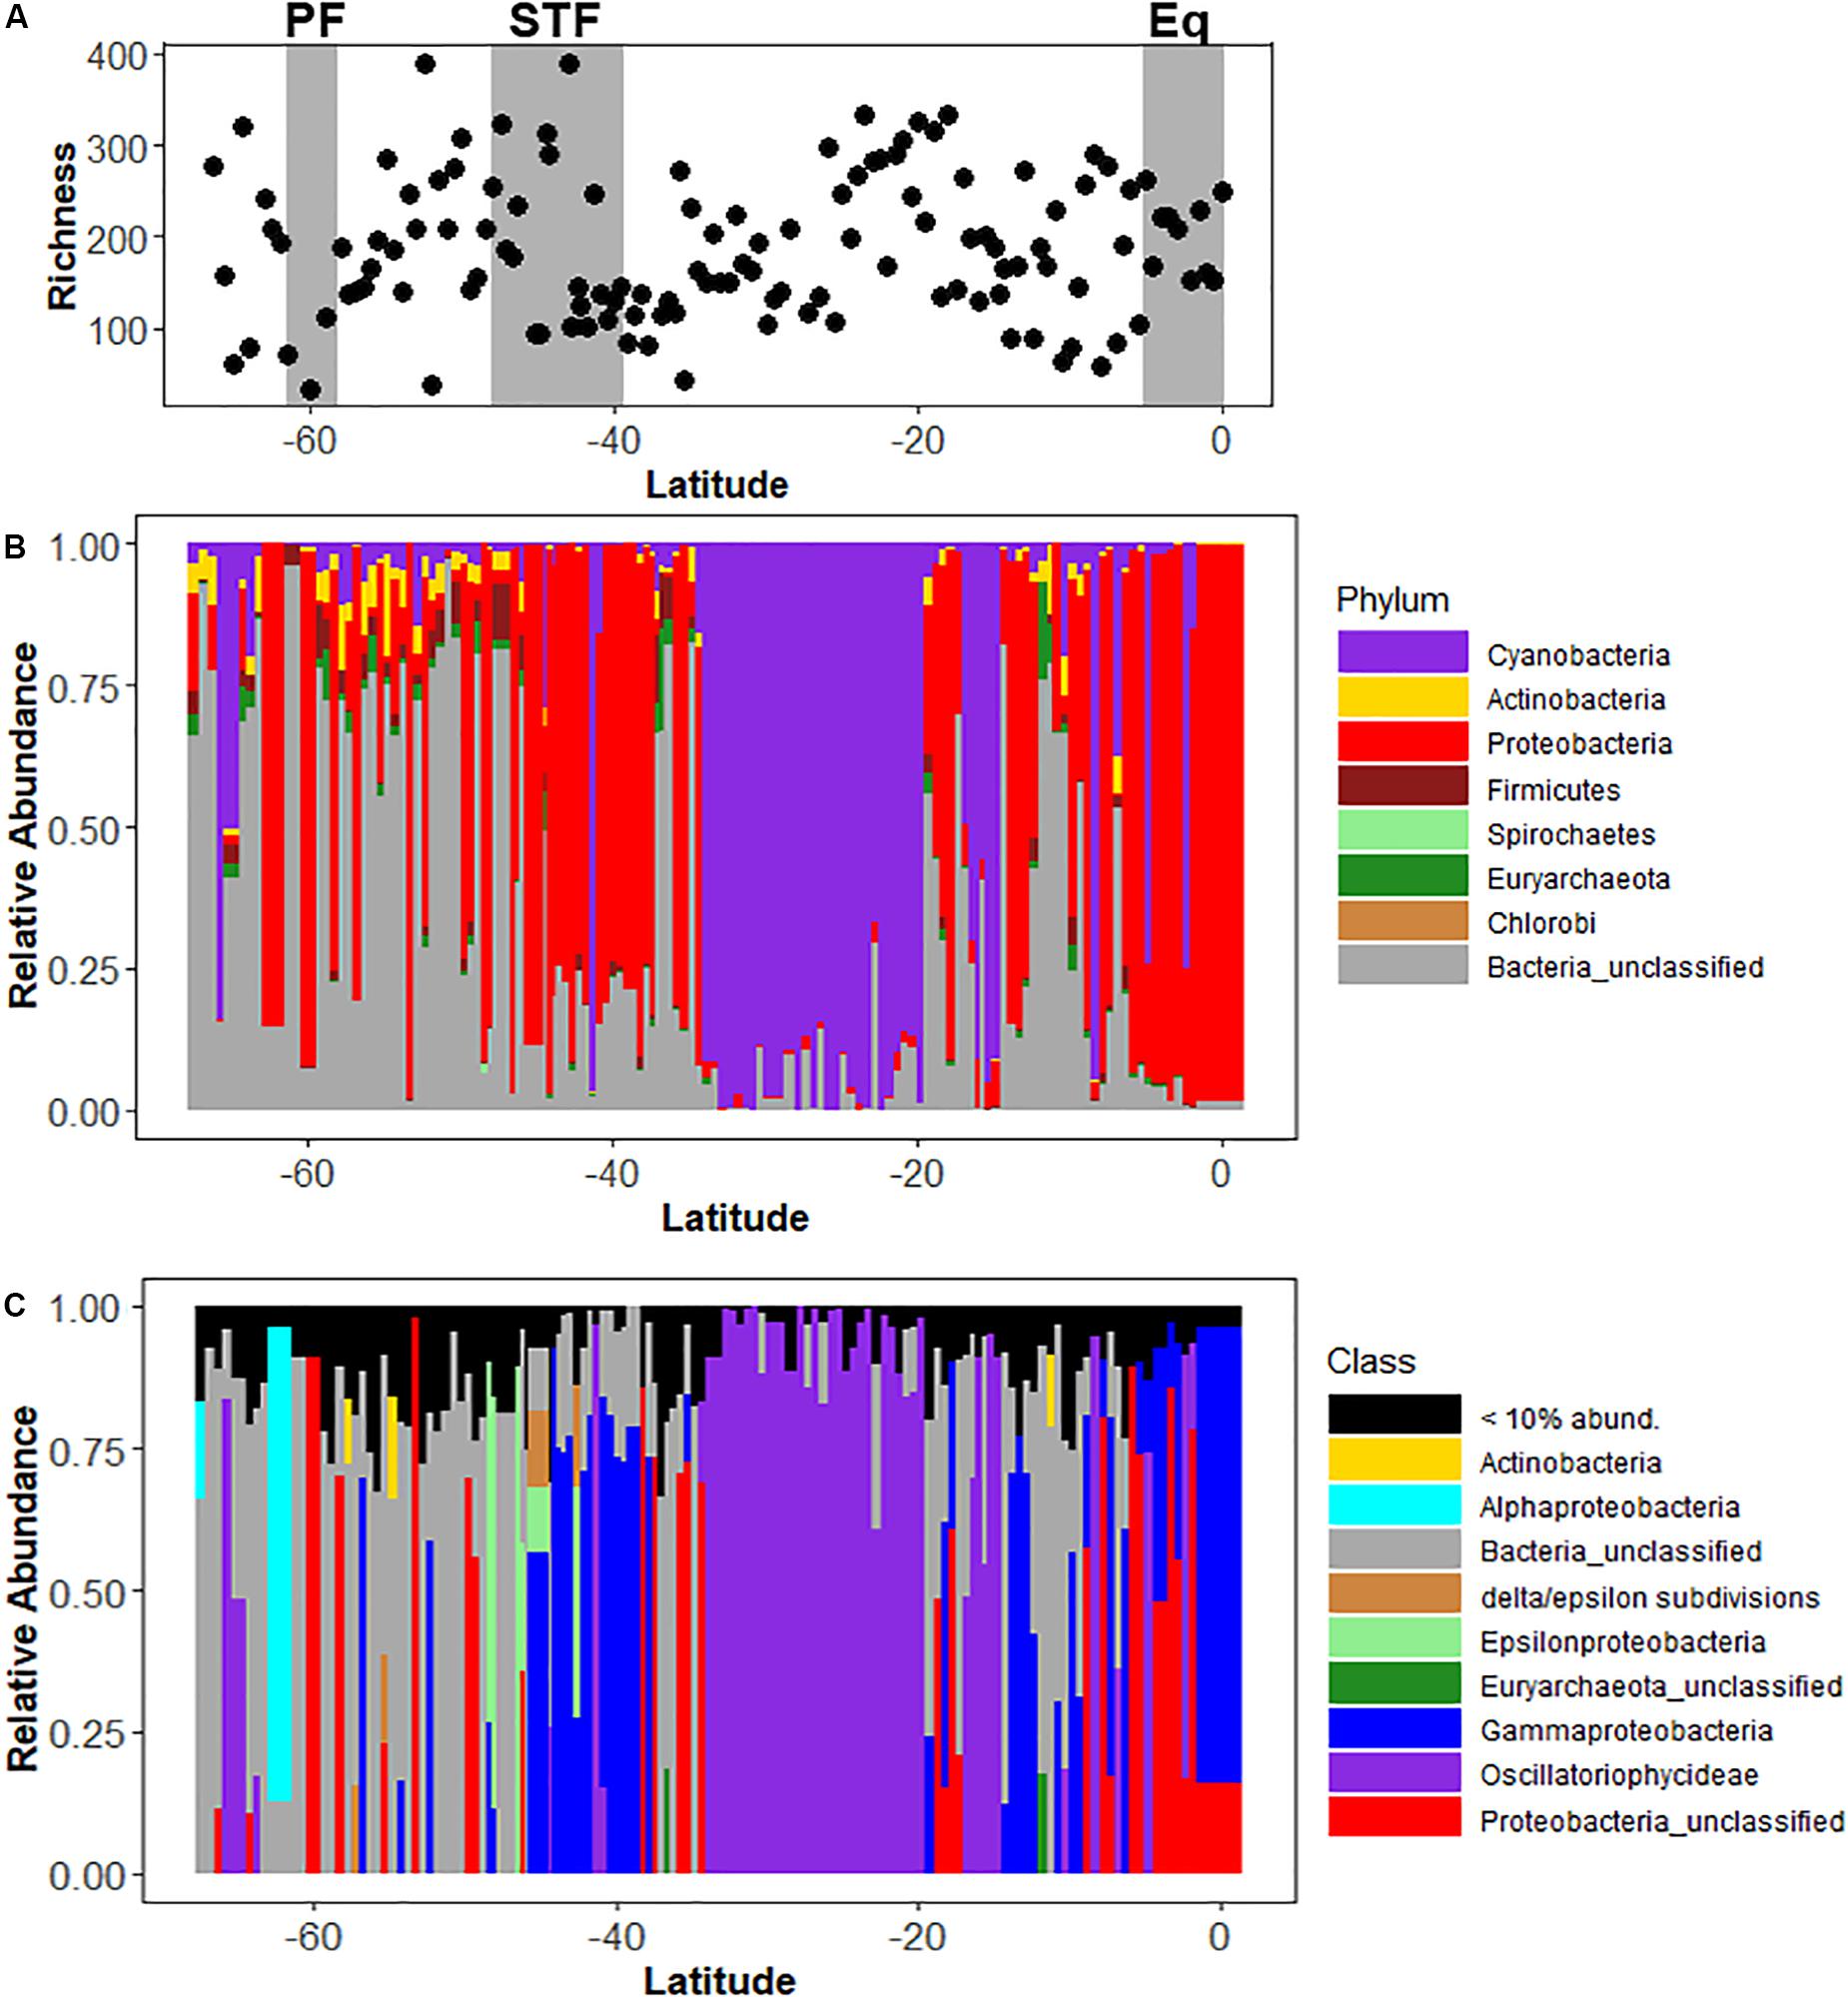
Figure 4. Panel (A) shows the nifH richness along a latitudinal transect in the South Pacific Ocean (B) shows the relative abundance of diazothrophs at a Phylum level and (C) the relative abundance of diazothrophs at a Class level from the sub-Antarctic to the equator in the South Pacific Ocean. Gray rectangles denote oceanographic fronts (PF, Polar front; STF, Subtropical Front; Eq, Equatorial upwelling zone).
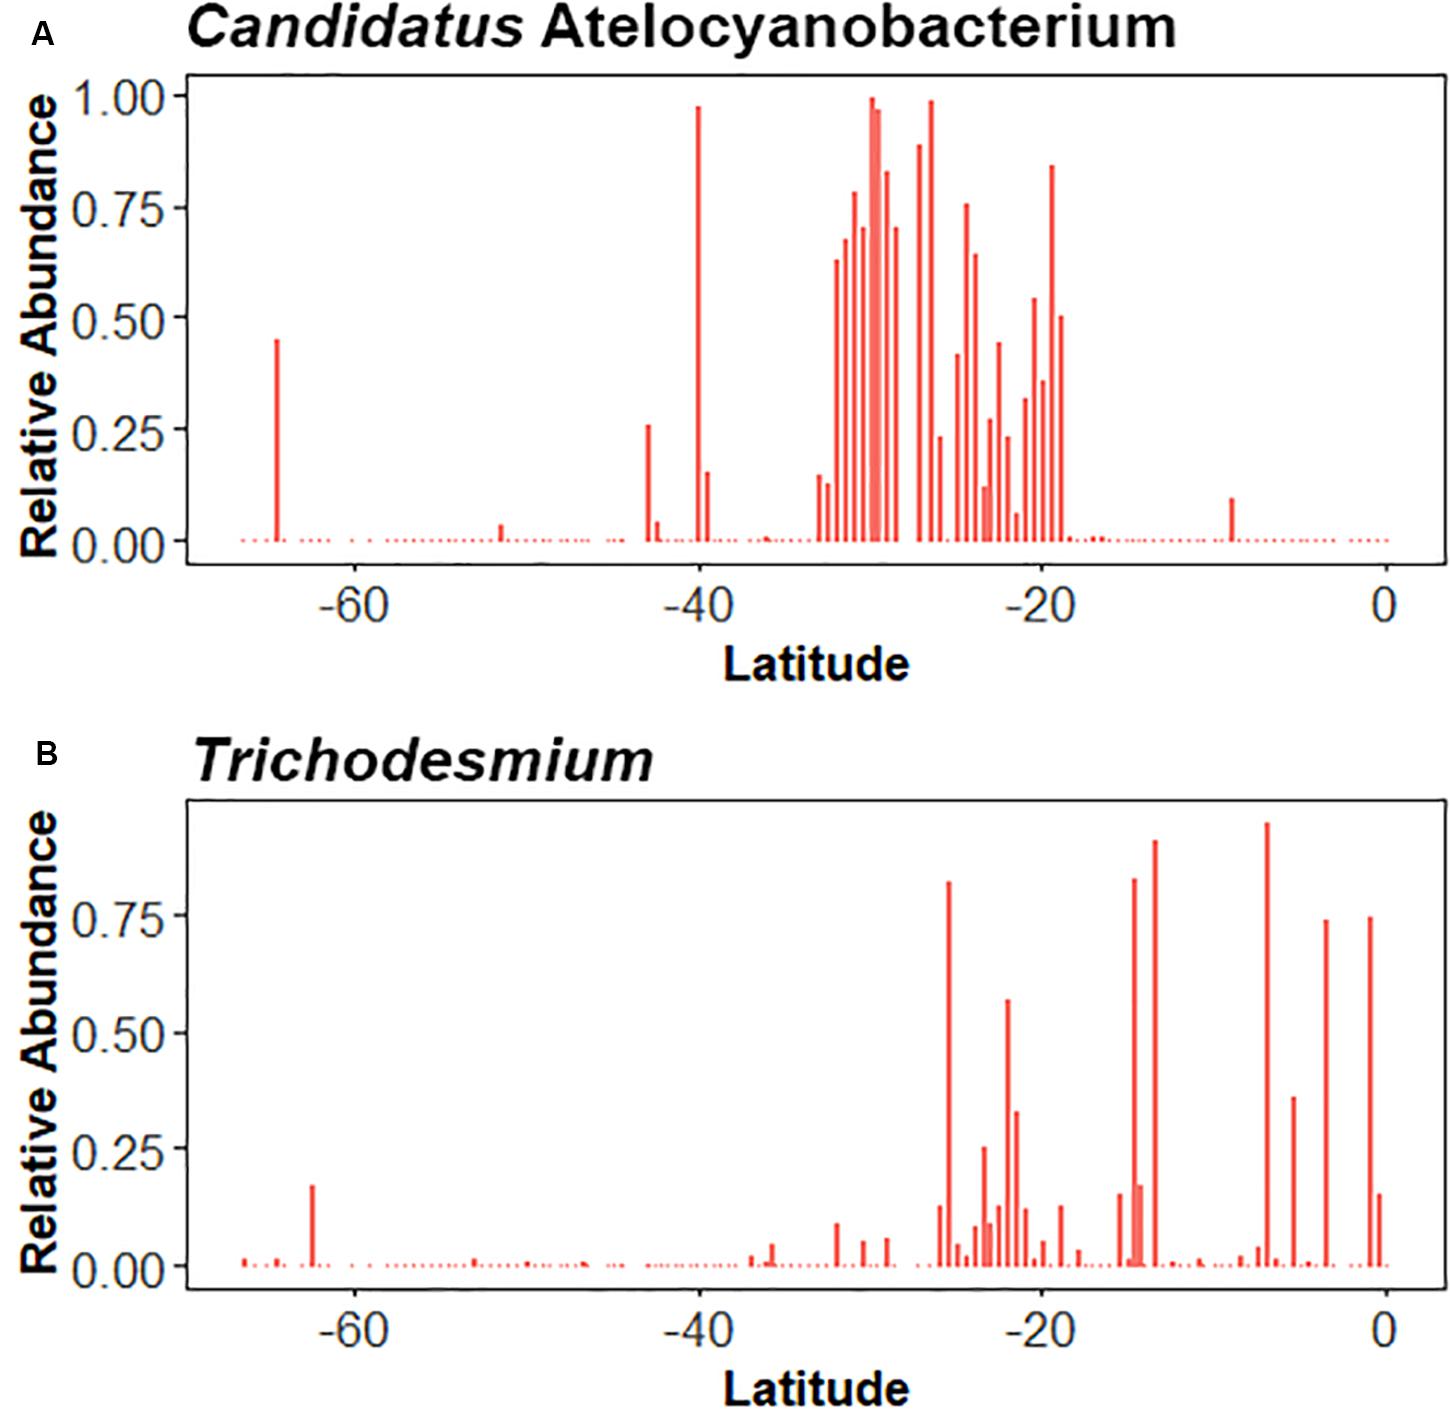
Figure 5. Relative abundances for Candidatus Atelocyanobacterium (A) and Trichodesmium (B) along a latitudinal transect in the South Pacific Ocean.
Nitrification and Nitrifiers
Total nitrification rates (NH4+ oxidation and NO2– oxidation) above the MLD in the sub-Antarctic reached up to 1440 nmol L–1 d–1 (production of ∼1.4 μmol NO3– L–1 d–1; Figure 6), with statistically similar values between samples taken at the surface and at the base of the MLD [Mann-Whitney, p = 0.510, n = 16, effect size (U value) = 110]. We were unable to quantify nitrification rates for most stations in the SPSG as NO3– concentrations were below the detection limit (<1 μmol L–1) for our nitrification measurements. North of 10°S, as NO3– concentrations started to increase, nitrification rates reached up to 141 nmol L–1 d–1.
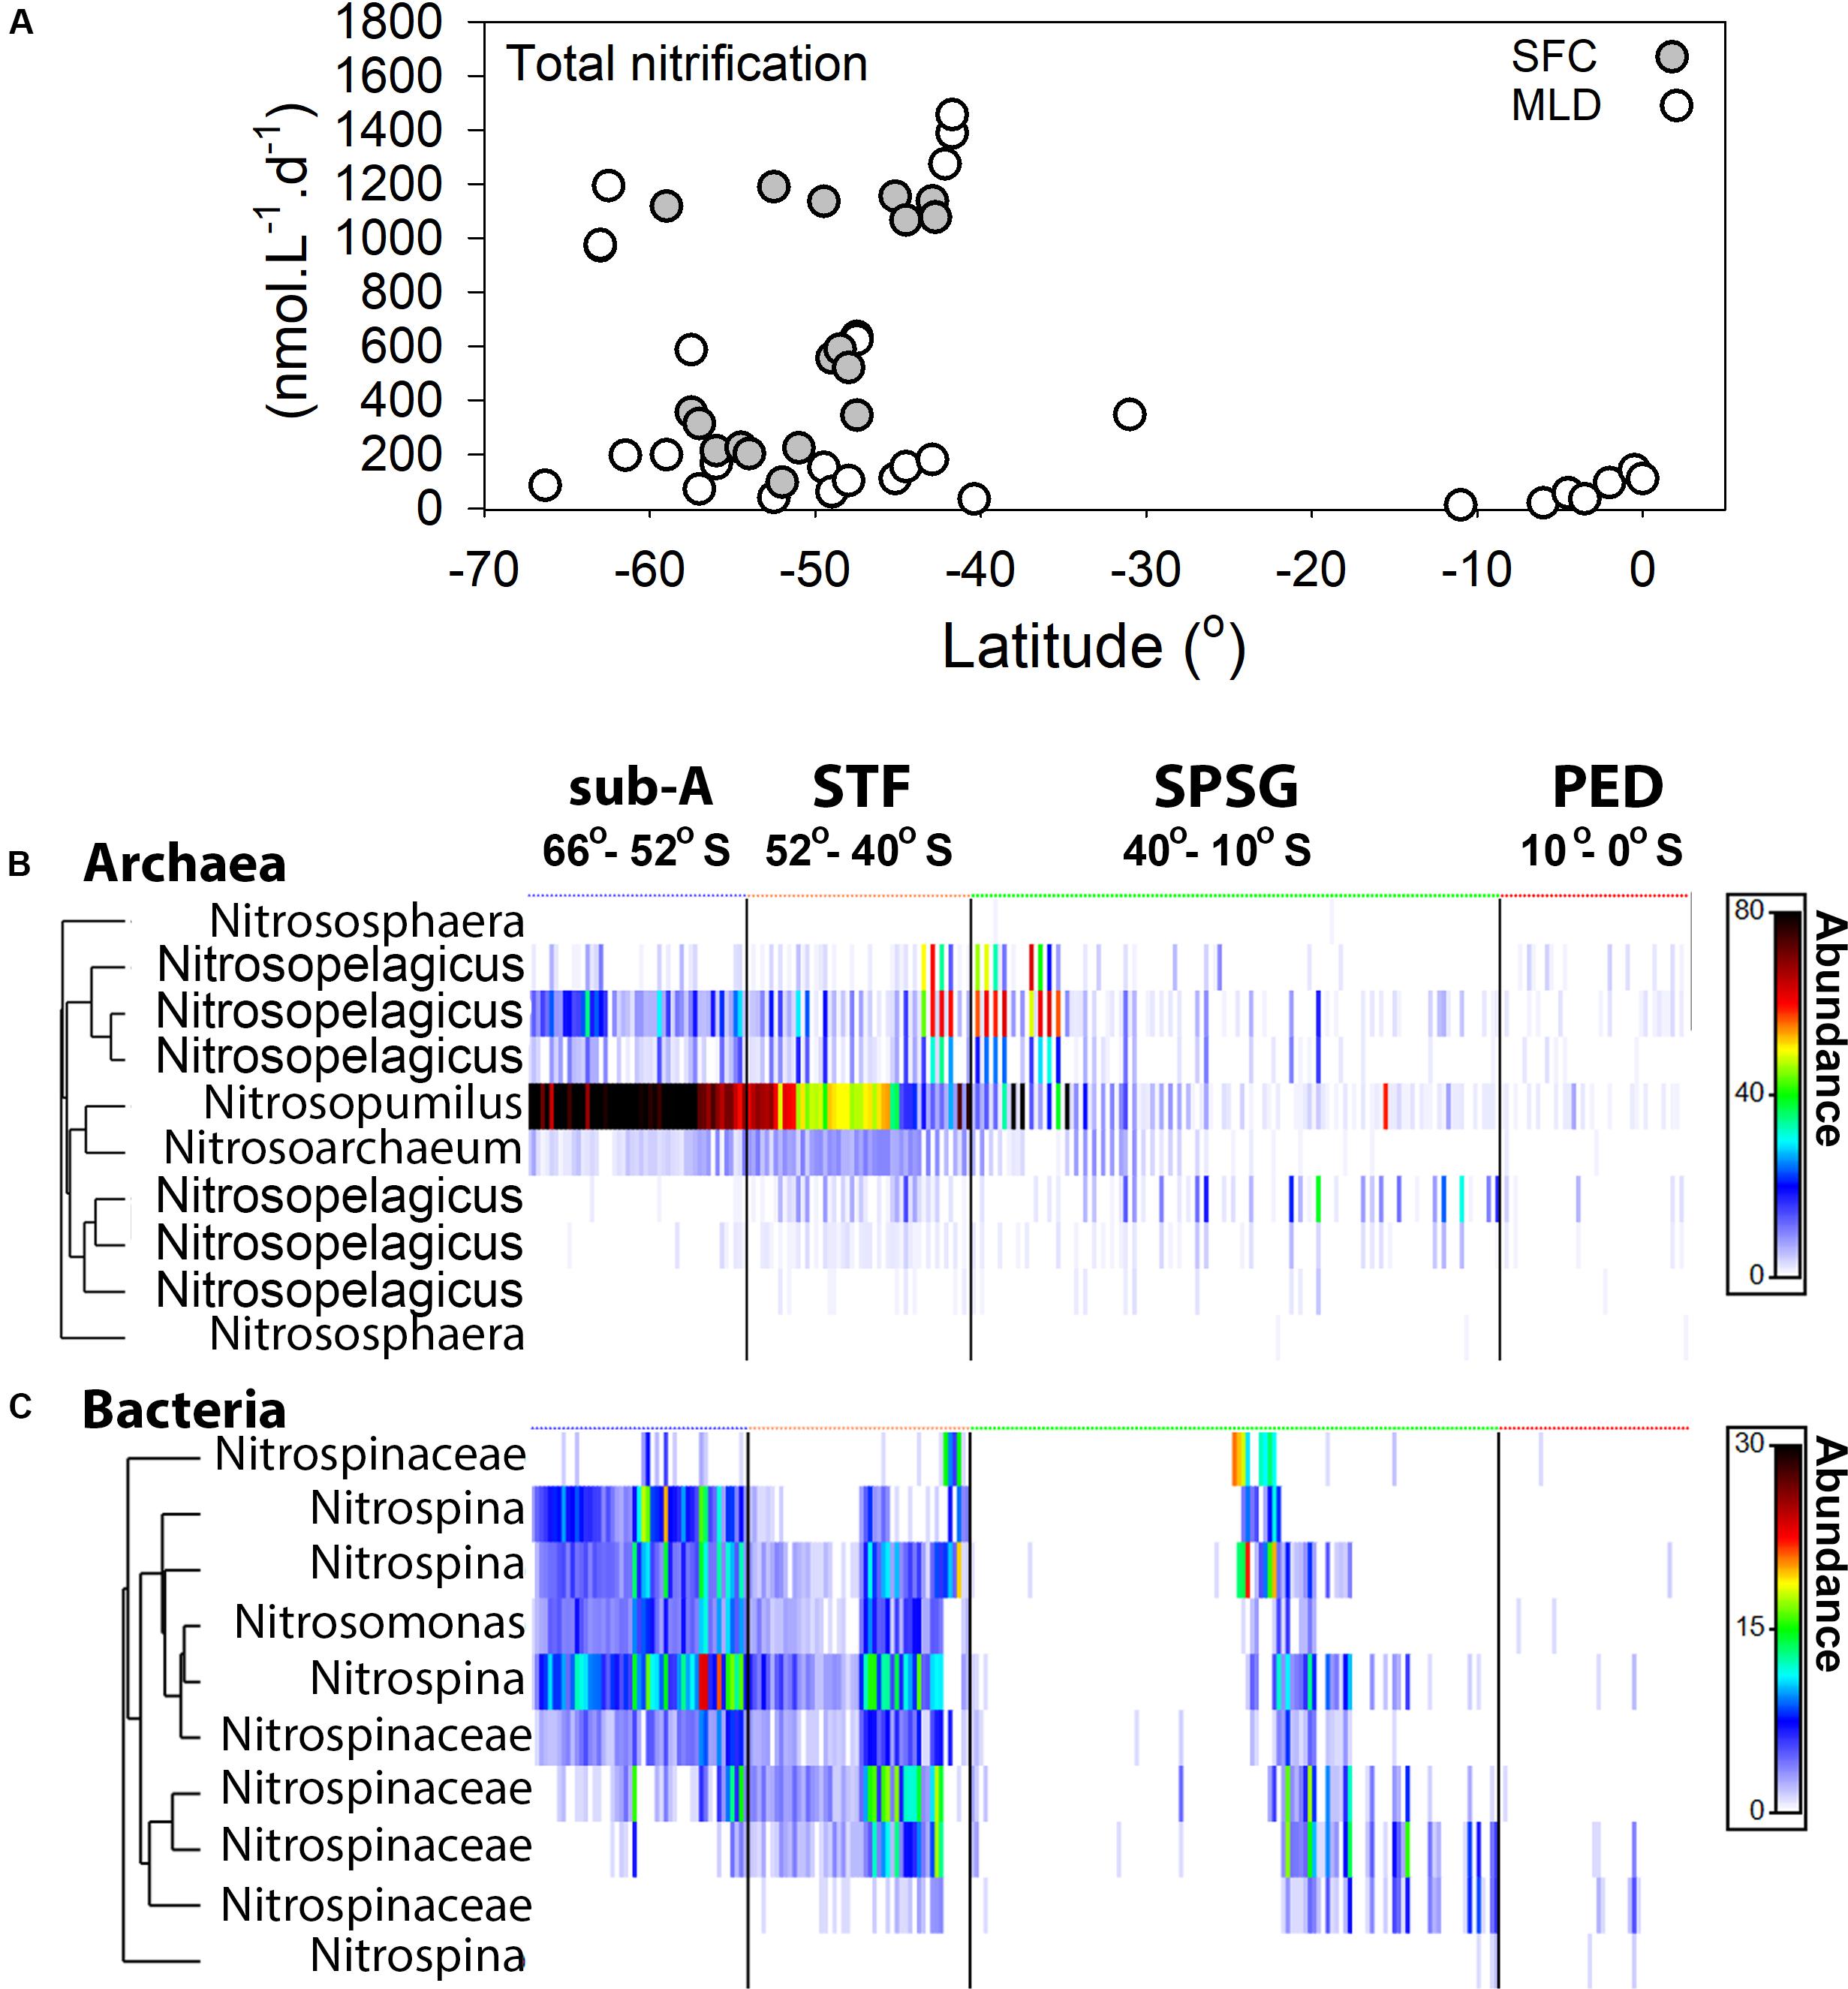
Figure 6. Total nitrification rates in nmol L–1 d–1 in the South Pacific Ocean (A). Filled gray circles are surface samples (SFC; 6 m), open circles are from the base of the mixed layer depth (MLD). Panel (B) shows a heat map of the archaeal nitrifying community and (C) a heat map of the bacterial nitrifying community. Most abundant OTUs are displayed and OTU sequence reads for both archaea and bacteria are square root transformed. Color bar shows the square root transformed sequence abundances. Dendrogram is not a phylogentic tree, but illustrates the clustering of strongly correlated OTUs. Blue, orange, green and red symbols above the heatmaps denote CTD stations in their respecitive oceanographic provinces; the sub-Antarctic; the STF; the SPSG and the PED. Due to detection limit of the denitrifier method we were unable to measure rates when environmental NO3– concentrations were <1 μmol L–1. Note, the Nitrospinaceae in the dendrogram refer to Nitrospinaceae that were not conclusively linked to the Nitrospina genus because of a relatively low sequence similarity.
16S rRNA amplicon sequencing data indicated that, in the sub-Antarctic and south of the STF, the genera Nitrospina and Nitrosomonas had the highest relative abundances within the Bacteria (Domain), whereas the genera Nitrosopelagicus, Nitrosoarchaeum, and Nitrosopumilus had the highest abundance within the Archaea (Kingdom). The highest relative abundances for all genera within the Bacteria and Archaea in the SPSG were recorded at the base of the MLD. Although all genera were also present in the PED, their relative abundance decreased north of the STF toward the equator (Figures 6B,C, and Supplementary Figure 9). Overall our data showed that the high relative abundances of nitrifying organisms (both Archaea and Bacteria) coincided with nitrification rates south of the STF.
NO3–, NH4+, and C Assimilation
NO3– assimilation rates in the sub-Antarctic increased steadily northward to the STF from 163.2 up to 2544 nmol L–1 d–1, despite decreasing NO3– concentrations above the MLD between 66°S (31 μmol L–1) and 45°S (8 μmol L–1). Assimilation rates were low in the SPSG north of the STF, ranging between 31.2 and 318 nmol L–1 d–1 but increased rapidly in the PED to a maximum rate of 5688 nmol L–1 d–1 (Figure 7A). NH4+ assimilation rates increased from 170.4 to 1131.6 nmol L–1 d–1 between 66 and 44.5°S, respectively. Assimilation rates then declined to 88.8 nmol L–1 d–1 north of the STF and increased to 1607.6 nmol L–1 d–1 at 15°S and then decreased to 331.2 nmol L–1 d–1 toward the PED (Figure 7B). Primary productivity rates increased south to north from 127.2 nmol L–1 d–1 from the most southern station to 1589.4 nmol L–1 d–1 in the STF. We note that rates peaked at 48° and 40°S (725.1 to 1589.4 nmol L–1 d–1, respectively). Within the PED, productivity increased from 5°S toward the PED up to 343.9 nmol L–1 d–1 (Figure 7C).
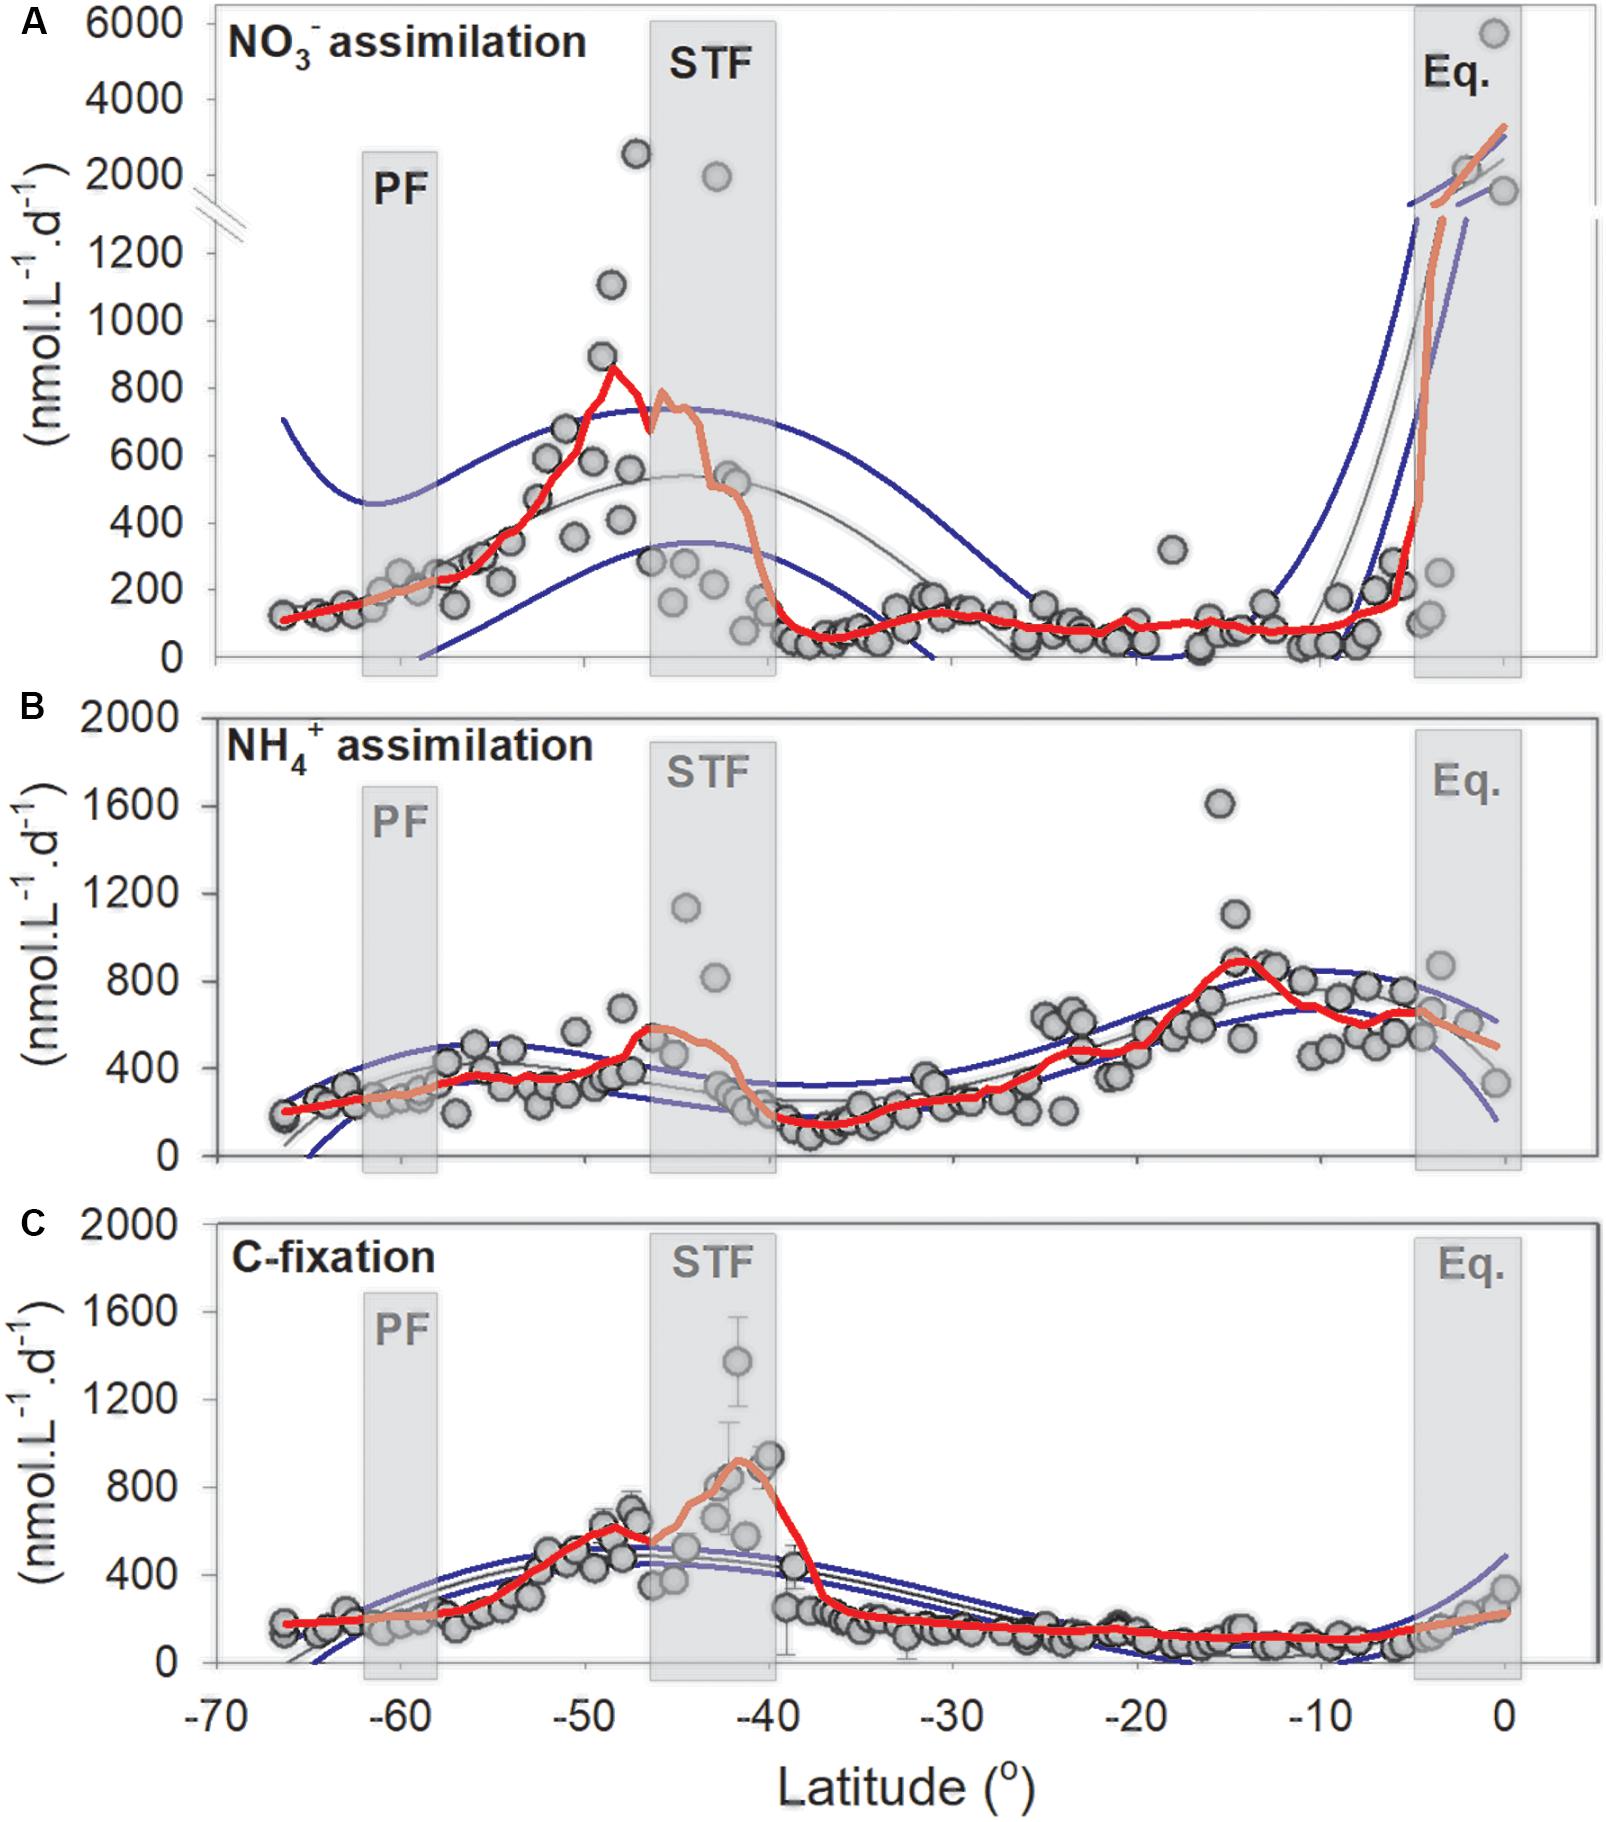
Figure 7. Nitrogen assimilation and primary productivity in the South Pacific Ocean. (A) NO3– and (B) NH4+ assimilation rates and (C) Primary productivity rates (in nmol L–1 d–1) with standard deviation (n = 3). Red lines are negative exponential smoothing curves with a first polynomial order. Thin black lines are fourth order polynomials and thin blue lines 95% confident intervals. Gray rectangles denote oceanographic fronts (PF, Polar front; STF, Subtropical Front; Eq, Equatorial upwelling zone).
The effect of enhanced N assimilation rates was tested in three different stations in the SPSG with incubation trace additions exceeding 10% of ambient nutrient concentrations. Although trace additions exceeding 10% did not significantly affect 15NO3 assimilation rates (p > 0.1 for all three stations; see Supplementary Figure 3), they resulted in lower 15NH4+ assimilation rates (p < 0.05 for all three stations; see Supplementary Figure 3). It should be noted that the transect was conducted in early winter and that, at the time, NH4+ assimilation rates were greater than the primary productivity rates.
Photosynthetic Pigments and Particulate Organic Matter
Clear changes in phytoplankton groups and size classes were recorded when crossing the PF, the STF, and the PED (Figures 8A,B). High concentrations of the pigment fucoxanthin, which is a proxy for diatoms, were recorded south of the STF whereas zeaxanthin and divinyl-chlorophyll a (a proxy for cyanobacteria) dominated in the SPSG. The southernmost sub-Antarctic (between 65°S and 57°S) phytoplankton community was dominated by diatoms, followed by haptophytes and pelagophytes. Picoeukaryotes dominated the community between the northernmost sub-Antarctic and the STF (56° and 42°S), followed by green algae and, to a lesser degree, by prymnesiophytes, dinoflagellates, and prokaryotes. A community composition shift toward cyanophytes was detected around 40°S, with a dominance by Prochlorochoccus and Synechococcus spp. in the SPSG (Supplementary Figure 4). In the northernmost PED (north of 5°S) we recorded a small presence of dinoflagellates, as well as an increase in pelagophytes, haptophytes, and green algae and a decrease in the proportion of cyanophytes (Figures 8A,B).
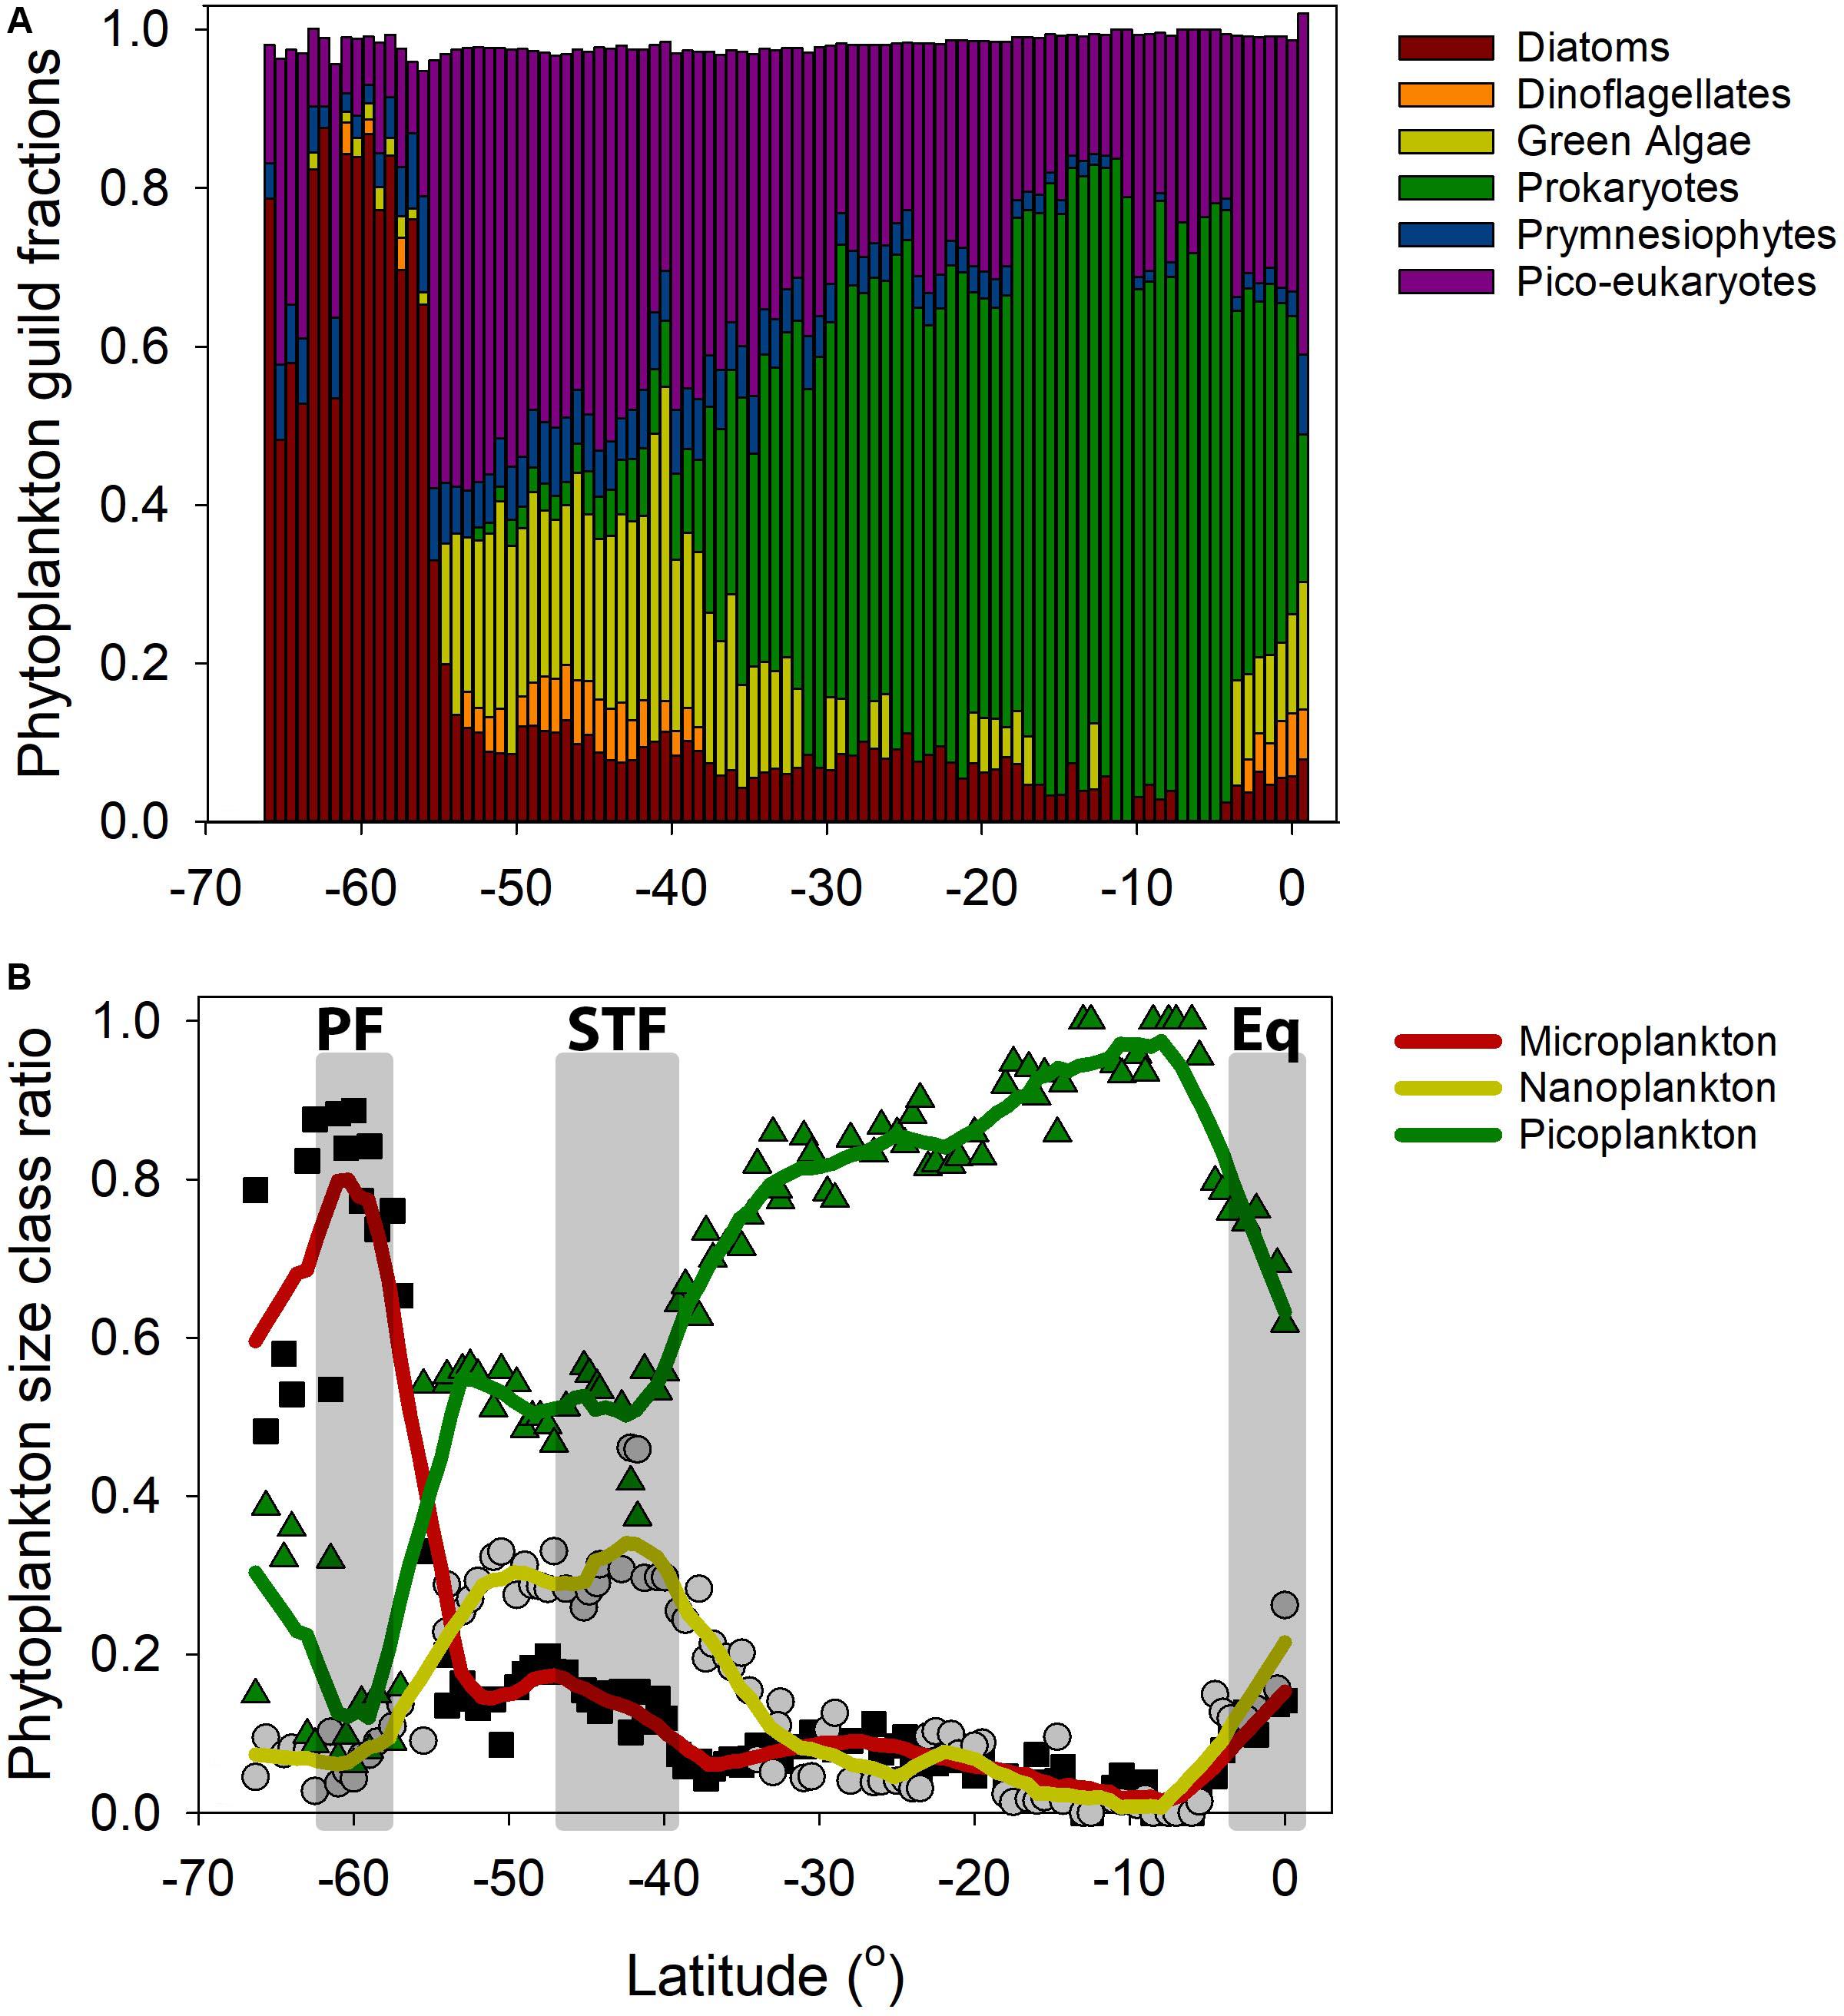
Figure 8. Cumulative phytoplankton guild fractions based on Hirata et al. (2011), in the surface waters of the South Pacific Ocean. Filled black squares, filled gray circles, and green triangles picoplankton. Thick red, mustard, and green lines are first order polynomial smoothing lines. (A) Note (1) the abrupt decline of diatoms at 55°S, (2) the relative higher number of dinoflagellates near the STF and equatorial upwelling zone, and (3) the ubiquitous occurrence of both prymnesiophytes and pico-eukaryotes. (B) Phytoplankton size class distribution calculated according to Hirata et al. (2011) along the P15S GO-SHIP transect. The calculated size classes were microplankton (20 – 200 μm), nanoplankton (2 – 20 μm) and picoplankton (0.2 – 2 μm) (Sieburth et al., 1978).
The δ15N of the PON (or δPO15N) averaged 1.33 ± 0.94‰ (±SD, n = 21), in the sub-Antarctic, but as we crossed the STF northward, the δPO15N increased significantly (Student’s T-test p < 0.0001) to 8.49‰ (4.16 ± 1.99‰ average ± SD, n = 18, Figure 9A). The δPO15N decreased within the southernmost SPSG (until ∼ 24°S) to 0.49‰, but it increased in its northernmost part to a maximum of 15.89‰ at 10°S (9.56 ± 2.08‰ average, n = 28, Figure 9A). The δPO15N decreased within the PED to 7.3‰ at the equator (Figure 9A).
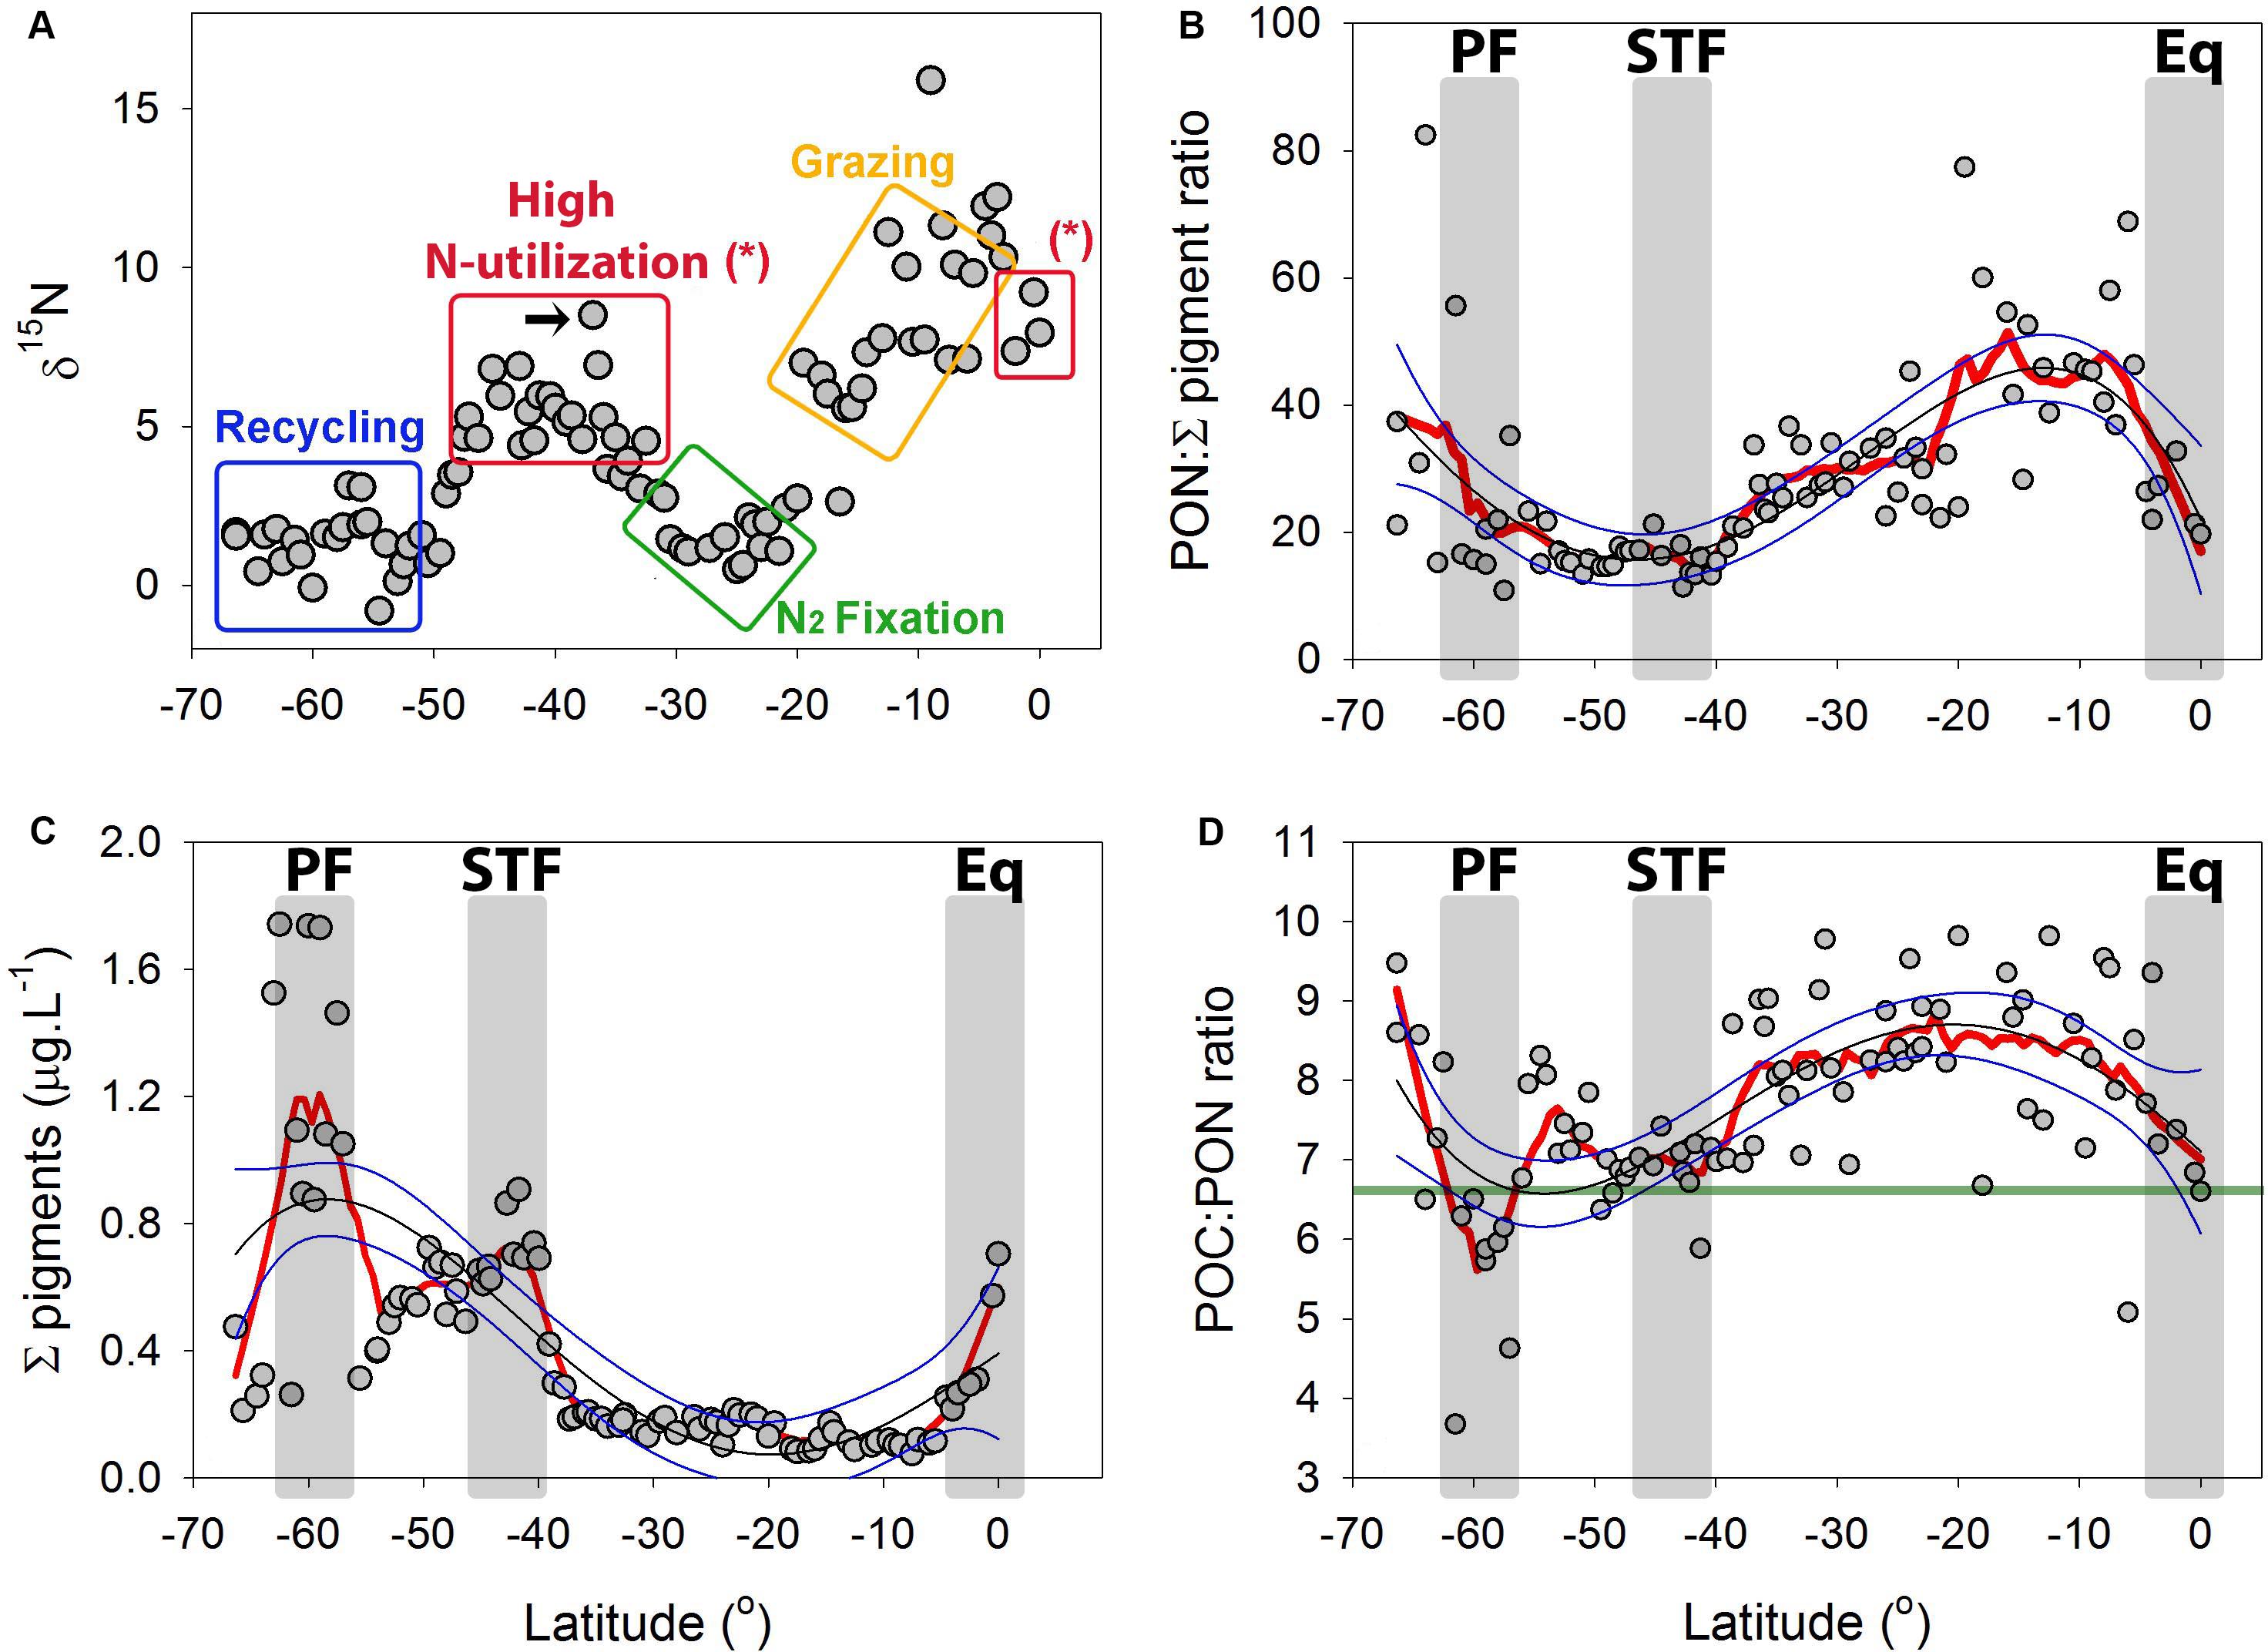
Figure 9. (A) Natural abundance δ15N from the particulate organic matter (PON) along the P15S GO-SHIP transect in the South Pacific Ocean. Colored rectangles suggest potential biochemical pathways which may drive the variation in the δ15N of the POM (see a proxy for N-cycling pathways using the δ15N of PON in the “Discussion”). The black arrow highlights the likely role how isotopic fractionation during NO3– assimilation generated the high δ15N feature at the STF. (B) Sum of all extracted pigments (μg L–1) along the latitudinal P15S transect. (C) PON: Σ pigment ratio along the P15S GO-SHIP transect and (D) POC:PON ratios with green line showing the expected Redfield ratio of 6.6. Red lines are negative exponential smoothing curves with a first polynomial order. Thin black lines are fourth order polynomials and thin blue lines 95% confident intervals. Gray rectangles denote oceanographic fronts (PF, Polar front; STF, Subtropical Front; Eq, Equatorial upwelling zone).
The PON:Σ pigment ratio can be used as an indicator for heterotrophy (Harmelin-Vivien et al., 2008), with low PON:Σ pigment ratio reflecting a high abundance of autotrophs relative to the PON, thus a low relative biomass of heterotrophic microorganisms, and vice versa). A northward declining trend was observed for the PON:Σ pigment ratio in the sub-Antarctic, with values thereafter remaining stable in the STF (Figure 9C). The PON:Σ pigment ratio then showed an overall northward increasing trend in the SPSG, followed by a northward decreasing trend in the PED (Figure 9C). The values recorded for POC:Σ pigment ratio showed similar patterns to those of PON:Σ pigment ratio along the transect (Supplementary Figure 11). The POC:PON ratios were generally greater than the Redfield ratio (Figure 9D).
Correlations and Drivers
Fourteen predictor parameters were investigated in order to explain variations in N2 fixation, DIN assimilation rates, and primary productivity using BRT models and Spearman rank correlations. Spearman rank correlations indicated significantly positive relationships between the predictor parameters latitude, temperature, and picoplankton, and the measured rates of NH4+ assimilation and N2 fixation (Figure 10). Significantly negative relationships were found between both NH4+ assimilation and N2 fixation rates and a suite of biotic (primary productivity, micro- and nanoplankton fractions) and abiotic factors (MLD and DIN concentrations a.o.; Figure 10). No significant correlations were found between N2 fixation and DIN assimilation rates. NO3– assimilation rates and primary productivity showed significant and positive correlations with one another and with NO2– concentrations and the nanoplankton fraction, with primary productivity also being significantly and positively correlated with the dissolved oxygen concentrations and total chl a (Figure 10).
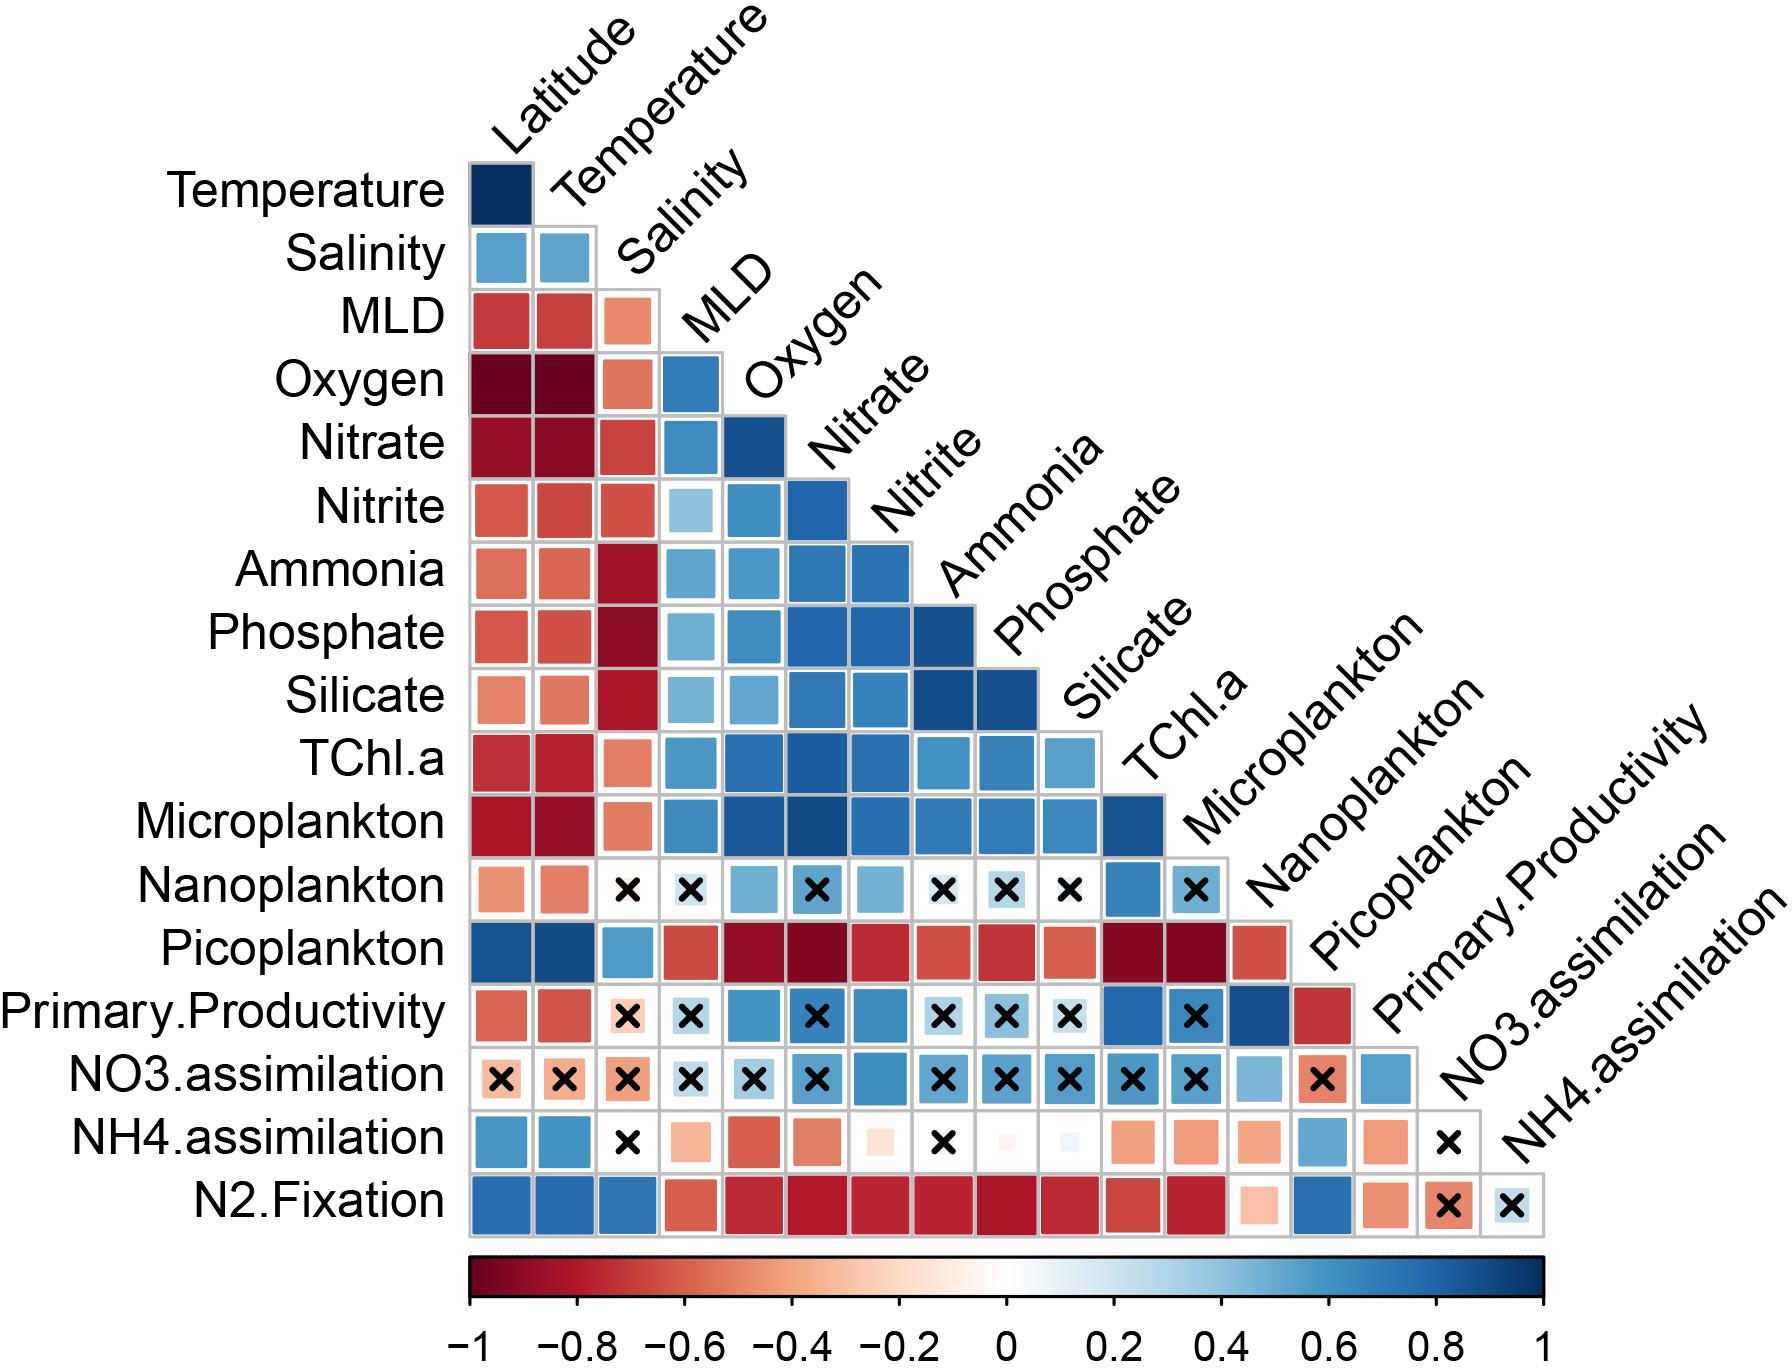
Figure 10. Spearman correlation coefficients (rs) plot including NO3– and NH4+ assimilation rates, primary productivity, and N2 fixation rates in the surface waters of the South Pacific Ocean (n = 85). Correlations with an adjusted p-value > 0.05 are indicated by black crosses. Mixed layer depth (MLD), Total chlorophyll a (TChl.a). Positive correlations are displayed in blue and negative correlations in red. Color intensity and the size of the squares are proportional to the correlation coefficients. Primary productivity values used in the correlation plot are averages from three replicates.
Boosted regression Tree model outputs revealed that latitude, silicate and total chl a were the main predictor variables for N2 fixation rates (cv = 0.744 ± 0.06; Supplementary Table 3), whereas total chl a, NO2–, and the nanoplankton fraction were the main predictors for NO3– assimilation rates (cv = 0.694 ± 0.075; Supplementary Table 3). Latitude, dissolved oxygen concentration and the ratio of picoplankton were the main predictors for NH4+ assimilation rates (cv = 0.797 ± 0.036; Supplementary Table 3), whereas nanoplankton and total chl a were strong predictors for primary productivity along the transect (cv = 0.854 ± 0.041; Supplementary Table 3).
Discussion
Our data provide insights into the spatial extent of N2 fixation activity and diazotrophic community composition where few to no measurements are currently available, and expand the data set from Shiozaki et al. (2017) southward along the 170°W line into the southern Pacific Ocean. Additionally, we identified nitrification activity within a region for which sparse rate measurements have been recorded and presented the relative abundances of putative nitrifiers. Lastly, we demonstrated that both N2 fixation and nitrification are active N transformation processes for which sharp gradients can be observed across oceanographic features in the South Pacific.
A Proxy for N-Cycling Pathways Using the δ15N of PON
The δ15N of PON (δPO15N) can be used as a tracer for the sources of N and for dominant N-cycling pathways (Phillips and Gregg, 2003). We suggest that the relatively low δPO15N levels recorded in the sub-Antarctic waters are driven by low NO3– utilization by phytoplankton due to iron and light co-limitation at high latitudes (Boyd et al., 2000), the kinetically favorable uptake of light NO3– and light N compounds (Sigman et al., 1999) and the recycling of organic matter (i.e., an input of low δ15N via NH4+, as indicated by the blue rectangle in Figure 9A). The high PON:Σ pigment ratio in the sub-Antarctic suggests that this is a heterotrophic system in the early winter months, as seen in other systems with a high PON:Σ pigment ratio (Harmelin-Vivien et al., 2008). Furthermore, we suggest that the increase of δPO15N to ∼6 ‰ near the STF is driven by classic across-pycnocline mixing and by the uptake of NO3– (as indicated in Figure 7A and by the red rectangle in Figure 9A; Liu and Kaplan (1989). The decrease in the PON:Σ pigment ratio observed in the STF also suggests a shift toward a more autotrophic system in this area, and supports the notion of NO3–-driven productivity. In addition, we measured an increase in the nanoplankton biomass at the STF, which showed a strong and significant correlation with primary productivity (Figure 10; p < 0.05). The BRT model outputs support these suggestions and showed that the nanoplankton fraction alone could explain up to 62% of the primary productivity rates. We suggest that the decrease in the δPO15N, north of the STF, can be explained by an increase in N2 fixation rates [Figures 3, 9; indicated by the green rectangle; Montoya et al. (2004) and Loick et al. (2007)]. The low δPO15N in the SPSG (∼30–25°S) can also be attributed to other processes such as nitrification, food chains supported mostly by a microbial loop and viral lysis which all release low δ15N compounds which will later be incorporated by organisms (Holmes et al., 2002). The increase in the δPO15N between 25° and 5°S (as indicated by the yellow rectangle in Figure 9A) may be explained by a longer picoplankton-based food web (Wada and Hattori, 1976), as a greater number of intermediate trophic levels results in more fractionation steps and, thereby, lead to an increase in δPO15N (refer to Raes et al. (2014) for this pattern in other oligotrophic systems). In addition, we note that the increasing trend in the δPO15N coincided with a shallowing of the NOx-cline from about ∼200–250 m at 20°S to ∼100 m at 10°S (Figure 2D). These data could suggest that an increase in NOx-driven productivity with a higher δ15N signature relative to N2 fixation toward the equator could also have contributed to an increase in the δPO15N between 25° and 5°S. Model results from Somes et al. (2013) also predicted higher δPO15N values around 20°S in this region, which were suggested to occur due to lateral advection of high δ15N originating from the eastern tropical South Pacific (ETSP) oxygen deficient zone. We point out that the shallowing of the NOx-cline at approximately 10°S at 100 m depth coincided with a NO2– maximum. We speculate that the south Pacific gyre acts as a conveyor belt (anti-clockwise) for organic particles. The wind driven South Equatorial Current (SEC) transports thermocline waters westward across the entire South Pacific Ocean. The Southwest Pacific Ocean circulation is complex, but it is clear that the SEC when reaching the western Pacific separates into numerous jets and boundary currents that redistribute the waters from the northern branch of the South Pacific subtropical gyre to the equator and high latitudes (Ganachaud et al., 2014). We hypothesize that between 12°and 2°S and at approximately 100 m depth (density ∼23–24 kg.m-3) particles accumulate in the SEC and are advected westward with the current [see also Somes et al. (2013)]. In the western Pacific the organic particles are then redistributed to the equator where they are subsequently remineralized via ammonification and nitrification, leaving a signal of high NO2–. Finally, equatorial currents and counter currents, which induce shear-driven mixing and, thus, introduce nutrients to the photic zone (Talley, 2011), resulted in an injection of NO3– across the MLD in our study (Figures 2C–F), and is likely the reason why we observed an increase in the abundance of the microplankton at the equator (Figures 2, 8, 9B; Holmes et al., 2002).
C and N Decoupling
Throughout the transect, NH4+ assimilation rates were greater than C assimilation rates, a pattern which contradicts general stoichiometric predictions based on a Redfield ratio of 106 (C) to 16 (N) (Dugdale and Goering, 1967). The lower C assimilation rates measured in the Southern Ocean can be explained by the time of the year when this study took place – the transect was studied in early winter, during the darker winter months, when primary production is greatly reduced. Manganelli et al. (2009) noted that during the winter months, when light availability is greatly reduced, Bacteria and Archaea are the major producers of biogenic particles via heterotrophic production and chemoautotrophic CO2 fixation in the Southern Ocean. From these results we then suggest that the higher NH4+ assimilation rates could possibly be explained by Bacteria and Archaea preferentially taking up organic C as a substrate during the incubations rather than the inorganic 13C which was supplied. Resulting in overall lower inorganic C assimilation rates compared to NH4+ assimilation rates.
Additional evidence for the decoupling of C and N uptake rates and for the low autotrophic productivity rates measured in the Southern Ocean is a lower Rayleigh fractionation than that previously published for the region in summer. The relationship between NO3– assimilation and the δ15N of NO3– has been shown in several studies to conform to Rayleigh fractionation kinetics (see Sigman et al. (1999) and references within). If the conditions of Rayleigh fractionation are met, upper ocean NO3– samples should fall along a straight line that describes the δ15NO3–/ln ([NO3–]) relationship. The slope of this line (ε) provides an estimate of the isotope effect of NO3– uptake. Sigman et al. (1999) showed that, in the Southern Ocean, ε ranged between 4 and 6‰. When we calculated ε for our samples, we obtained values of 3.61‰ for the Southern Ocean and 2.7‰ within the STF (Supplementary Figure 10). The lower ε values [when compared to those from Sigman et al. (1999)] found in this study are suggested to be due to lower autotrophic productivity in early winter. It is worth noting that Montoya and McCarthy (1995) and Needoba and Harrison (2004) reported that the fractionation factor for NO3– uptake can vary across taxa, with generally lower ε values for flagellates than for diatoms. This suggests that the differences in the ε values from our data in comparison to those published by Sigman et al. (1999) could, in addition to the seasonality, be due to phytoplankton community composition. On the other hand, we note that our data could also infer that the low Rayleigh fractionation kinetics could be due to relatively high heterotrophic production relative to total production in early winter, and not necessarily due to low total autotrophic production and/or different phytoplankton community composition. There remains a lot of uncertainty how fraction occurs in many of these N-cycling processes hence at this stage we can only speculate.
In the tropics NH4+ concentrations were below the detection limit. The addition of the 15N tracer therefore ended up being an appreciable fraction of the ambient NH4+ concentrations which meant that potential assimilation rates were measured. These potential assimilation rates could then give rise to the mismatch between NH4+ assimilation and primary productivity rates. The higher NH4+ assimilation rates can possibly be explained by an active microbial loop in the region, which would result in a high turnover rate of NH4+. This explanation is in agreement with the findings from Clark et al. (2008), who showed that low primary production rates can be associated with rapid N cycling activity in the oligotrophic regions of the central Atlantic. These authors showed that nitrification (with NH4+ as the end product) could completely replace the DIN pool within 1 day, with reported turnover rates as low as 5 h.
N2 Fixation in the South Pacific Ocean
Several theories about N2 fixation in the ocean have been proposed and disproven in the last decade. This process was postulated to occur primarily in sub-tropical regions with relatively low DIN concentrations [<1 μmol L–1, Breitbarth et al. (2007)], but a wide range of diazotrophic bacterial nifH sequences have been obtained from polar regions (Díez et al., 2012), including melt ponds and sea ice (Fernández-Méndez et al., 2016). Recent studies have also reported cyanobacterial N2 fixation (via a UCYN-A and a haptophyte symbiosis) in the Western Arctic and Bering Seas, concluding that N2 fixation is not constrained to sub-tropical waters (Shiozaki et al., 2017; Sipler et al., 2017; Harding et al., 2018). The assimilation of N2 has a high energetic cost due to the breaking of triple N bonds. It was postulated that N2 fixation rates would decrease when other N-compounds, which are more easily assimilated in terms of energetic costs, would be available (Falkowski, 1997). A number of studies have, however, quantified N2 fixation rates in nutrient rich environments such as coastal upwelling regions (Sohm et al., 2011) and temperate coastal zones (Bentzon-Tilia et al., 2014). Weber and Deutsch (2014) also showed that on an ocean basin scale, iron (Fe) limitation exerts a stronger control on N2 fixation rates than DIN concentrations. We detected low N2 fixation rates at 7/10 stations south of 52°S (see Supplementary Table 1) and our results (high NO3–, NO2–, and NH4+ concentrations and high NO3–:PO43– ratios in the sub-Antarctic) support the notion that N2 fixation does not occur exclusively in warm and oligotrophic regions. Although our N2 fixation rates are a small fraction of the total N assimilated in the Southern Ocean (<1%) when compared to the total NO3– and NH4+ assimilation rates, they do highlight the broad latitudinal scale of N2 fixation. This is the case especially when our data are considered together with that of Shiozaki et al. (2017) to reveal the bipolar scale (from 59°S to 68°N) of N2 fixation processes along the 170°W meridional.
In this data set we present the first N2 fixation rate measurements in the Pacific sector of the Southern Ocean, south of 50°S. In the Southern Ocean of the Indian Ocean sector González et al. (2014) measured N2 fixation rates up to 20.1 nmol L–1 d–1 at low temperatures (<4°C) and high NO3– concentrations (>30 μmol L–1) near the Kerguelen Islands. Although these N2 fixation rate data are collected from a region high in dissolved Fe, the authors mentioned that the role of Fe in the N2 fixation processes was indirect. Fe directly stimulated primary production and indirectly, through the release of dissolved organic matter, the N2 fixation rates. The ubiquitous presence of N2 fixation in the surface oceans, further complicates the potential to model N2 fixation rates on a basin scale.
In our data set we note that although the predictive strength of the BRT model for N2 fixation was strong (cv value of 0.74), its outputs showed no clear predictor variables for N2 fixation. The BRT relationships were strongly dominated by indirect (e.g., non-associated) parameters such as latitude, Si, and total chl a concentration, which explained 18, 13.7, and 11.9% of the changes in N2 fixation, respectively. Latitude itself is a proxy for a suite of physical and biogeochemical parameters (e.g., day length, temperature, nutrient and dissolved oxygen concentrations, a.o.), which highlights the complexities associated with modeling N2 fixation rates based on biogeochemical parameters. Silicate has no known influence on the process of N2 fixation and is present in low concentrations in environments which are N-limited and, thus, prone to N2 fixation. Similarly, total chl a is available in high concentrations in areas which are nutrient-rich and, thus, not as prone to N2 fixation. Although regionally high chl a concentrations have been related to high N2 fixation rates and Trichodesmium abundance around New Caledonia (Shiozaki et al., 2014), chl a and Si are most likely a correlation artifact rather than true predictors of N2 fixation across large scale ocean boundaries. We believe that our results will prove extremely useful to modelers working on N2 fixation in the South Pacific Ocean, as in this study we reported and described clear changes in N2 fixation rates across oceanographic boundaries.
We observed an increase in N2 fixation rates north of the STF, when NO3– concentrations fell to <1 μmol L–1. Overall, N2 fixation rates averaged ∼15 nmol L–1 d–1 in the SPSG, but high values (up to 130 nmol L–1 d–1) were also recorded. N2 fixation rates measured in this study north of 25°S are in agreement with those presented by Bonnet et al. (2017) for the western tropical South Pacific and the equatorial Pacific, and by Caffin et al. (2018) for a longitudinal transect between 18 and 19°S along the 160–170°W meridian line. A number of studies have, however, measured significantly lower N2 fixation rates in similar oceanographic conditions. Shiozaki et al. (2017), for example, reported N2 fixation rates of up to 0.360 nmol L–1 d–1 in the North Pacific Equatorial Counter Current Province and of up to 3.05 nmol L–1 d–1 in the North Pacific Tropical Gyre Province. Halm et al. (2012) and Law et al. (2012) measured N2 fixation rates in the southwest Pacific (between 20–45°S and 150°E-150°W and 170°W-120°W) which reached 6 nmol L–1 d–1 in the austral summer but bordered the detection limit (<1 nmol L–1 d–1) during austral winter. Bonnet et al. (2009) recorded N2 fixation rates along the equator (from 145°W to 160°W) which ranged from <1 nmol L–1 d–1 to 610 nmol L–1 d–1. This extreme range of values highlights how variable N2 fixation can be along the tropical and equatorial Pacific.
The diazotrophic community is responsible for a significant fraction of the primary productivity and C export in oligotrophic oceans (Karl et al., 1997). We derived potential C assimilation rates from our N2 fixation rates by multiplying the latter by the in situ molar POC:PON values (rather than the average Redfield 6.6). Within our study area we estimated that N2 fixation might have supported the assimilation of up to 2.5 nmol C L–1 d–1 in the sub-Antarctic, and up to 85 nmol C L–1 d–1 north of the STF. These derivations imply that N2 fixation is responsible for at least one third of the C that is assimilated in the SPSG. The ratio of N2 fixation rates: C fixation sharply increased north of the STF, N2 was assimilated in excess to C-fixation at the stations where we measured our highest N2 fixation rates (Supplementary Figure 6). Overall, these results reinforce that N2 fixation contributes largely to oceanic new production in oligotrophic regions.
The majority of the nifH sequences in surface waters along our transect in the South Pacific belonged to Cluster 1, which covers aerobic and facultative anaerobic organisms that belong to the Proteobacteria (including Alphaproteobacteria, Betaproteobacteria, and Gammaproteobacteria), Cyanobacteria, Firmicutes and Actinobacteria (Zehr and McReynolds, 1989). Changes in the relative abundances of Trichodesmium and UCYN-A along the transect showed strong evidence that these organisms have different biogeographies, with UCYN-A dominant at mid-latitudes and Trichodesmium more prominent at lower latitudes (Figure 5). The presence of Trichodesmium DNA well below 30° S, does not, however, mean that Trichodesmium is actively fixing N2. Trichodesmium has also been detected in subarctic regions of the Atlantic Ocean (Lipschultz and Owens, 1996), likely a reflection of its northward transport by the Gulf stream and the application of methodological improvements rather than an expanding range. The relative increase in Gammaproteobacterial nifH sequences near the STF and PED (Figure 4), zones in which we noted an increase in primary productivity, was an interesting finding. The ubiquitous distribution of heterotrophic diazotrophs, such as alpha- and Gammaproteobacteria, could suggest that their contribution to the input of new N via N2 fixation is important on a basin-wide scale rather than just in the tropics. Turk-Kubo et al. (2014), on the other hand, concluded that Gammaproteobacteria did not significantly contribute to N2 fixation rates in the eastern south Pacific. The ecological significance of the heterotrophic diazotroph groups thus remains elusive, and merits further investigation (Benavides et al., 2018). Recent research, reviewed by Zehr et al. (2017) has identified an association between the haptophyte Braarudosphaera and the endosymbiont Candidatus Atelocyanobacterium. Our data from the SPSG support the host-endosymbiont connection, as the highest number of Candidatus Atelocyanobacterium sequences were recorded altogether with Braarudosphaera sequences (Supplementary Figure 8). Shiozaki et al. (2017), who sampled the 170° W meridian in the northern hemisphere, concluded that, although they found clear differences in the diazotrophic composition between the tropical gyre and the cold northern region, the local biogeochemical constraints on the diazotrophic community required further detailed studies. The distribution of diazotrophs along our transect was influenced by multiple factors including temperature, nutrient concentrations, and frontal zones; but we agree with Shiozaki et al. (2017) in that the local controls that drive differences in diazotrophic community composition within water masses remain elusive.
Nitrification in the Pacific Sector of the Southern Ocean
Nitrification can provide a source of NO3–, yet rates are poorly resolved globally and often ignored as a source of regenerated N in the photic zone because the process is assumed to be inhibited by light (Peng et al., 2016). Culture studies and in situ rate measurements, however, demonstrated that photoinhibition of nitrifying organisms is only partial (Qin et al., 2014). The average rates we found in the Southern Ocean (480 nmol L–1 d–1 and a production of ∼0.5 μmol NO3– L–1 d–1) were higher than those measured around the same time of the year in the Indian sector of the Southern Ocean, where cumulative rates averaged between 100 and 200 μmol m2 d–1 [integrated over 100 m nitrification rates between 10 and 20 nmol L–1 d–1 with a production of ∼0.01-0.2 μmol NO3– L–1 d–1; (Bianchi et al., 1997)].
Overall, nitrification appears to be a very active bacterial process in the oceanic N cycle (Dore and Karl, 1996; Yool et al., 2007; Clark et al., 2008) and in the Pacific sector of the Southern Ocean in winter as seen in this data set. Our total nitrification rates could be an underestimation because the rates do not account for 15NO2– or 15NO3– that may have been assimilated by microbes. However, one could argue that this would be minimal given that there was a large pool of NH4+ available [which microbes should prefer as an N source (Peng et al., 2015, 2016)]. Ambient NH4+ concentrations in the water column ranged between 0.2 and 0.8 μmol L–1. As a result, the labeled 15NH4+ additions in the nitrification experiments ranged between 6 and 25% of the total NH4+ pool. Trace additions above 10% are likely to stimulate uptake, biasing rate measurements. NH4+ regeneration on the other hand would dilute the 15N-labeled NH4+ pool, and lead to underestimation of total nitrification rates. Additional rate measurements are needed to set our high rates in a temporal context, as Ward (2005) already showed that temporal differences could be as large as 40 fold for nitrification rates. Our data suggests that the early winter months favor a heterotrophic system in the sub-Antarctic region. We speculate that the organic matter, produced in the autumn months is recycled and that the Archaea and Bacteria subsequently nitrify the available NH4+.
Conclusion
Our study region was a natural laboratory for resolving how hydrographic and biogeochemical boundaries influence the relative abundance and richness of microorganisms involved in the different pathways within the marine N cycle. We report herein that, as we moved along the transect and across major oceanographic boundaries, changes were observed for N2 fixation and nitrification rates, microbial community composition, δPO15N, photosynthetic pigment concentration, and carbon assimilation rates. We were able to relate our δPO15N measurements to major N-cycling pathways across ocean boundaries, but further studies need to investigate how the isotopic fractionation of the δPO15N and the δ15N of NO3– can provide insights into the relative magnitudes of these different N-cycling processes.
Data Availability Statement
The datasets generated for this study can be found in the PANGEA repository which are presented in the section “Materials and Methods.” All physical and chemical data are available at the Clivar & Carbon Hydrographic Data Office (CCHDO; https://cchdo.ucsd.edu/under GO-SHIP program; voyage P15S; expocode: 096U20160426). Genomic data are available under BioProject: PRJNA385736, https://www.ncbi.nlm.nih.gov/bioproject/385736.
Author Contributions
ER developed the experimental design, executed the experiment, analyzed the data, and wrote the manuscript. JK, BH, and LB analyzed the nifH, bacterial, and archaeal sequence data. S-SW analyzed the HPLC data. JR, BE, and DE analyzed and QC’ed the nitrification rates. AF and AW contributed to the data analysis and interpretation. All co-authors helped with the editing of the manuscript.
Funding
This work was supported by CSIRO and the Australian Climate Change Science Program. This research was made feasible because Dr. Bernadette Sloyan and Dr. Susan Wijffels supported our project at the P15 GO-SHIP transect voyage number IN2016_V03. We would like to acknowledge the contribution of the Marine Microbes consortium in the generation of data used in this publication. The Marine Microbes project was supported by funding from Bioplatforms Australia and the Integrated Marine Observing System (IMOS) through the Australian Government National Collaborative Research Infrastructure Strategy (NCRIS) in partnership with the Australian research community. Investigator supporting grants came from AW through AWI and UWA. Work at CSIRO was supported by an OCE Science Leader Fellowship (R-04202) to LB and by the Environmental Genomics grant from CSIRO Oceans and Atmosphere (R-02412).
Conflict of Interest
The authors declare that the research was conducted in the absence of any commercial or financial relationships that could be construed as a potential conflict of interest.
Acknowledgments
We thank the officers and crew of the R/V Investigator during cruise IN2016_V03 for their technical assistance while at sea, and Swan L. S. Sow, Dr. Bernhard Tschitschko, Nicole Gail Hellessey, and Gabriela Paniagua Cabarrus for their sampling efforts at sea. Lastly, we also thank the constructive feedback and suggestions from two reviewers and the valuable edits and comments during proofreading from Dr. R. M. Franco-Santos.
Supplementary Material
The Supplementary Material for this article can be found online at: https://www.frontiersin.org/articles/10.3389/fmars.2020.00389/full#supplementary-material
Footnotes
- ^ http://www.go-ship.org/
- ^ http://dx.doi.org/10.17600/17002400
- ^ http://pmc.ucsc.edu/w̃wwzehr/research/database/
References
Aiken, J., Pradhan, Y., Barlow, R., Lavender, S., Poulton, A., Holligan, P., et al. (2009). Phytoplankton pigments and functional types in the Atlantic Ocean: a decadal assessment, 1995–2005. Deep Sea Res. II Top. Stud. Oceanogr. 56, 899–917.
Albright, M. B., Timalsina, B., Martiny, J. B., and Dunbar, J. (2018). Comparative genomics of nitrogen cycling pathways in bacteria and Archaea. Microb. Ecol. 77, 597–606.
Aminot, A., Kérouel, R., and Coverly, S. C. (2009). “Nutrients in seawater using segmented flow analysis,” in Practical Guidelines for the Analysis of Seawater, ed. O. Wurl, (Boca Raton, FL: CRC Press), 143–178.
Appleyard, S. A., Abell, G., and Watson, R. (2013). Tackling Microbial Related Issues in Cultured Shellfish Via Integrated Molecular and Water Chemistry Approaches. Clayton: CSIRO Marine and Atmospheric Research.
Armstrong, F., Stearns, C., and Strickland, J. (1967). The measurement of upwelling and subsequent biological process by means of the Technicon Autoanalyzer® and associated equipment. Deep Sea Res. Oceanogr. Abst. 14, 381–389.
Baltar, F., Currie, K., Stuck, E., Roosa, S., and Morales, S. E. (2016). Oceanic fronts: transition zones for bacterioplankton community composition. Environ. Microbiol. Rep. 8, 132–138. doi: 10.1111/1758-2229.12362
Beman, J. M., Chow, C.-E., King, A. L., Feng, Y., Fuhrman, J. A., Andersson, A., et al. (2011). Global declines in oceanic nitrification rates as a consequence of ocean acidification. Proc. Natl. Acad. Sci. U.S.A. 108, 208–213. doi: 10.1073/pnas.1011053108
Benavides, M., Martias, C., Elifantz, H., Berman-Frank, I., Dupouy, C., and Bonnet, S. (2018). Dissolved organic matter influences N2 fixation in the New Caledonian lagoon (Western Tropical South Pacific). Front. Mar. Sci. 5:89. doi: 10.3389/fmars.2018.00089
Bentzon-Tilia, M., Traving, S. J., Mantikci, M., Knudsen-Leerbeck, H., Hansen, J. L. S., Markager, S., et al. (2014). Significant N2 fixation by heterotrophs, photoheterotrophs and heterocystous cyanobacteria in two temperate estuaries. ISME J. 9:273. doi: 10.1038/ismej.2014.119
Bianchi, M., Feliatra, F., Tréguer, P., Vincendeau, M.-A., and Morvan, J. (1997). Nitrification rates, ammonium and nitrate distribution in upper layers of the water column and in sediments of the Indian sector of the Southern Ocean. Deep Sea Res. II Top. Stud. Oceanogr. 44, 1017–1032.
Bissett, A., Fitzgerald, A., Meintjes, T., Mele, P. M., Reith, F., Dennis, P. G., et al. (2016). Introducing BASE: the Biomes of Australian soil environments soil microbial diversity database. GigaScience 5:1.
Bonnet, S., Biegala, I. C., Dutrieux, P., Slemons, L. O., and Capone, D. G. (2009). Nitrogen fixation in the western equatorial Pacific: rates, diazotrophic cyanobacterial size class distribution, and biogeochemical significance. Glob. Biogeochem. Cycles 23:GB3012. doi: 10.1029/2008gb003439
Bonnet, S., Caffin, M., Berthelot, H., and Moutin, T. (2017). Hot spot of N2 fixation in the western tropical South Pacific pleads for a spatial decoupling between N2 fixation and denitrification. Proc. Natl. Acad. Sci. U.S.A. 114, E2800–E2801.
Bonnet, S., Dekaezemacker, J., Turk-Kubo, K. A., Moutin, T., Hamersley, R. M., Grosso, O., et al. (2013). Aphotic N2 fixation in the eastern tropical South Pacific Ocean. PLoS One 8:e81265. doi: 10.1371/journal.pone.0081265
Boyd, P. W., Watson, A. J., Law, C. S., Abraham, E. R., Trull, T., Murdoch, R., et al. (2000). A mesoscale phytoplankton bloom in the polar Southern Ocean stimulated by iron fertilization. Nature 407, 695–702.
Breitbarth, E., Oschlies, A., and LaRoche, J. (2007). Physiological constraints on the global distribution of Trichodesmium effect of temperature on diazotrophy. Biogeosciences 4, 53–61.
Caffin, M., Berthelot, H., Cornet-Barthaux, V., Barani, A., and Bonnet, S. (2018). Transfer of diazotroph-derived nitrogen to the planktonic food web across gradients of N2 fixation activity and diversity in the western tropical South Pacific Ocean. Biogeosciences 15, 3795–3810. doi: 10.5194/bg-15-3795-2018
Callahan, B. J., McMurdie, P. J., Rosen, M. J., Han, A. W., Johnson, A. J. A., and Holmes, S. P. (2016). DADA2: high-resolution sample inference from Illumina amplicon data. Nat. Methods 13:581. doi: 10.1038/nmeth.3869
Chen, M., Lu, Y., Jiao, N., Tian, J., Kao, S.-J., and Zhang, Y. (2018). Biogeographic drivers of diazotrophs in the western Pacific Ocean. Limnol. Oceanogr. 64, 1403–1421. doi: 10.1002/lno.11123
Church, M. J., Mahaffey, C., Letelier, R. M., Lukas, R., Zehr, J. P., and Karl, D. M. (2009). Physical forcing of nitrogen fixation and diazotroph community structure in the North Pacific subtropical gyre. Glob. Biogeochem. Cycles 23:GB003418 doi: 10.1029/2008gb003418
Clark, D. R., Rees, A. P., and Joint, I. (2008). Ammonium regeneration and nitrification rates in the oligotrophic Atlantic Ocean: implications for new production estimates. Limnol. Oceanogr. 53, 52–62.
Dabundo, R., Lehmann, M. F., Treibergs, L., Tobias, C. R., Altabet, M. A., Moisander, P. H., et al. (2014). The contamination of commercial 15N2 gas stocks with 15N–labeled nitrate and ammonium and consequences for nitrogen fixation measurements. PLoS One 9:e110335. doi: 10.1371/journal.pone.0110335
DeLong, E. F. (1992). Archaea in coastal marine environments. Proc. Natl. Acad. Sci. U.S.A. 89, 5685–5689.
Díez, B., Bergman, B., Pedrós-Alió, C., Antó, M., and Snoeijs, P. (2012). High cyanobacterial nifH gene diversity in Arctic seawater and sea ice brine. Environ. Microbiol. Rep. 4, 360–366.
Dore, J. E., and Karl, D. M. (1996). Nitrification in the euphotic zone as a source for nitrite, nitrate, and nitrous oxide at Station ALOHA. Limnol. Oceanogr. 41, 1619–1628.
Dugdale, R., and Goering, J. (1967). Uptake of new and regenerated forms of nitrogen in primary productivity 1. Limnol. Oceanogr. 12, 196–206.
Edgar, R. C. (2010). Search and clustering orders of magnitude faster than BLAST. Bioinformatics 26, 2460–2461. doi: 10.1093/bioinformatics/btq461
Elith, J., Leathwick, J. R., and Hastie, T. (2008). A working guide to boosted regression trees. J. Anim. Ecol. 77, 802–813.
Eppley, R. W., and Peterson, B. J. (1979). Particulate organic matter flux and planktonic new production in the deep ocean. Nature 282:677.
Falkowski, P. G. (1997). Evolution of the nitrogen cycle and its influence on the biological sequestration of CO2 in the ocean. Nature 387:272.
Fernández-Méndez, M., Turk-Kubo, K. A., Buttigieg, P. L., Rapp, J. Z., Krumpen, T., Zehr, J. P., et al. (2016). Diazotroph Diversity in the Sea Ice, Melt Ponds, and Surface Waters of the Eurasian Basin of the Central Arctic Ocean. Front. Microbiol. 7:1884. doi: 10.3389/fmicb.2016.01884
Fong, A. A., Karl, D. M., Lukas, R., Letelier, R. M., Zehr, J. P., and Church, M. J. (2008). Nitrogen fixation in an anticyclonic eddy in the oligotrophic North Pacific Ocean. ISME J. 2:663. doi: 10.1038/ismej.2008.22
Fuhrman, J. A., Steele, J. A., Hewson, I., Schwalbach, M. S., Brown, M. V., Green, J. L., et al. (2008). A latitudinal diversity gradient in planktonic marine bacteria. Proc. Nat. Acad. Sci. U.S.A. 105, 7774–7778.
Ganachaud, A., Cravatte, S., Melet, A., Schiller, A., Holbrook, N., Sloyan, B., et al. (2014). The Southwest Pacific Ocean circulation and climate experiment (SPICE). J. Geophys. Res. 119, 7660–7686. doi: 10.1002/2013JC009678
González, M., Molina, V., Florez-Leiva, L., Oriol, L., Cavagna, A., Dehairs, F., et al. (2014). Nitrogen fixation in the Southern Ocean: a case of study of the Fe-fertilized Kerguelen region (KEOPS II cruise). Biogeosci. Discuss. 11, 17151–17185.
Gradoville, M. R., Bombar, D., Crump, B. C., Letelier, R. M., Zehr, J. P., and White, A. E. (2017). Diversity and activity of nitrogen-fixing communities across ocean basins. Limnol. Oceanogr. 62, 1895–1909.
Halm, H., Lam, P., Ferdelman, T. G., Lavik, G., Dittmar, T., LaRoche, J., et al. (2012). Heterotrophic organisms dominate nitrogen fixation in the South Pacific Gyre. ISME J. 6, 1238–1249.
Hansen, H. P., and Koroleff, F. (2009). “Determination of nutrients,” in Methods of Seawater Analysis, 3rd Edn, eds K. Grasshoff, K. Kremling, and M. Ehrhardt, (Weinheim: Wiley-VCH), 159–228.
Harding, K., Turk-Kubo, K. A., Sipler, R. E., Mills, M. M., Bronk, D. A., and Zehr, J. P. (2018). Symbiotic unicellular cyanobacteria fix nitrogen in the Arctic Ocean. Proc. Natl. Acad. Sci. U.S.A. 115, 13371–13375. doi: 10.1073/pnas.1813658115
Harmelin-Vivien, M., Loizeau, V., Mellon, C., Beker, B., Arlhac, D., Bodiguel, X., et al. (2008). Comparison of C and N stable isotope ratios between surface particulate organic matter and microphytoplankton in the Gulf of Lions (NW Mediterranean). Continent. Shelf Res. 28, 1911–1919. doi: 10.1016/j.csr.2008.03.002
Hirata, T., Aiken, J., Hardman-Mountford, N., Smyth, T., and Barlow, R. (2008). An absorption model to determine phytoplankton size classes from satellite ocean colour. Remote Sens. Environ. 112, 3153–3159.
Hirata, T., Hardman-Mountford, N., Brewin, R., Aiken, J., Barlow, R., Suzuki, K., et al. (2011). Synoptic relationships between surface Chlorophyll-a and diagnostic pigments specific to phytoplankton functional types. Biogeosciences 8, 311.
Holmes, E., Lavik, G., Fischer, G., Segl, M., Ruhland, G., and Wefer, G. (2002). Seasonal variability of δ15N in sinking particles in the Benguela upwelling region. Deep Sea Res. I Oceanogr. Res. Pap. 49, 377–394.
Hooker, S. B., Clementson, L., Thomas, C. S., Schlüter, L., Allerup, M., Ras, J., et al. (2012). The Fifth SeaWiFS HPLC Analysis Round-Robin Experiment (SeaHARRE-5). NASA Tech. Memo. 2012-217503. Washington, DC: NASA, 44–50.
Hydes, D., Aoyama, M., Aminot, A., Bakker, K., Becker, S., Coverly, S., et al. (2010). “Determination of Dissolved Nutrients (N, P, SI) in Seawater with high precision and inter-comparability using gas-segmented continuous flow analysers,” in The GO-SHIP Repeat Hydrography Manual: A Collection of Expert Reports and Guidelines, eds E.M. Hood, C.L. Sabine, and B.M. Sloyan, (Paris: UNESCO).
Karl, D., Letelier, R., Tupas, L., Dore, J., Christian, J., and Hebel, D. (1997). The role of nitrogen fixation in biogeochemical cycling in the subtropical North Pacific Ocean. Nature 388:533.
Kérouel, R., and Aminot, A. (1997). Fluorometric determination of ammonia in sea and estuarine waters by direct segmented flow analysis. Mar. Chem. 57, 265–275.
Klawonn, I., Lavik, G., Böning, P., Marchant, H., Dekaezemacker, J., Mohr, W., et al. (2015). Simple approach for the preparation of 15-15N2-enriched water for nitrogen fixation assessments: evaluation, application and recommendations. Front. Microbiol. 6:769. doi: 10.3389/fmicb.2015.00769
Knap, A., Michaels, A., Close, A., Ducklow, H., and Dickson, A. (1996). Protocols for the Joint Global Ocean Flux Study (JGOFS) Core Measurements. JGOFS Report 19. Paris: UNESCO-IOC.
Knapp, A. N., McCabe, K. M., Grosso, O., Leblond, N., Moutin, T., and Bonnet, S. (2018). Distribution and rates of nitrogen fixation in the western tropical South Pacific Ocean constrained by nitrogen isotope budgets. Biogeosciences 15;2619.
Lane, D. (1991). “16S/23S rRNA sequencing,” in Nucleic Acid Techniques in Bacterial Systematics, eds E. Stackebrandt, and M. Goodfellow, (New York, NY: John Wiley & Sons).
Lane, D. J., Pace, B., Olsen, G. J., Stahl, D. A., Sogin, M. L., and Pace, N. R. (1985). Rapid determination of 16S ribosomal RNA sequences for phylogenetic analyses. Proc. Natl. Acad. Sci. U.S.A. 82, 6955–6959.
Law, C. S., Breitbarth, E., Hoffmann, L. J., McGraw, C. M., Langlois, R. J., LaRoche, J., et al. (2012). No stimulation of nitrogen fixation by non-filamentous diazotrophs under elevated CO 2 in the South Pacific. Glob. Chang. Biol. 18, 3004–3014.
Lipschultz, F., and Owens, N. J. (1996). An assessment of nitrogen fixation as a source of nitrogen to the North Atlantic Ocean. Biogeochemistry 35, 261–274.
Liu, K. K., and Kaplan, I. R. (1989). The eastern tropical Pacific as a source of 15N-enriched nitrate in seawater off southern California. Limnol. Oceanogr. 34, 820–830.
Loick, N., Dippner, J., Doan, H. N., Liskow, I., and Voss, M. (2007). Pelagic nitrogen dynamics in the Vietnamese upwelling area according to stable nitrogen and carbon isotope data. Deep Sea Res. I Oceanogr. Res. Pap. 54, 596–607.
Mague, T. H., Weare, N. M., and Holm-Hansen, O. (1974). Nitrogen fixation in the North Pacific Ocean. Mar. Biol. 24, 109–119. doi: 10.1007/bf00389344
Manganelli, M., Malfatti, F., Samo, T. J., Mitchell, B. G., Wang, H., and Azam, F. (2009). Major role of microbes in carbon fluxes during austral winter in the southern drake passage. PLoS One 4:e6941. doi: 10.1371/journal.pone.0006941
McIlvin, M. R., and Casciotti, K. L. (2011). Technical updates to the bacterial method for nitrate isotopic analyses. Anal. Chem. 83, 1850–1856. doi: 10.1021/ac1028984
McMurdie, P. J., and Holmes, S. (2013). phyloseq: an R package for reproducible interactive analysis and graphics of microbiome census data. PLoS One 8:e61217. doi: 10.1371/journal.pone.0061217
Messer, L. F., Mahaffey, C., Robinson, C. M., Jeffries, T. C., Baker, K. G., Isaksson, J. B., et al. (2016). High levels of heterogeneity in diazotroph diversity and activity within a putative hotspot for marine nitrogen fixation. ISME J. 10:1499. doi: 10.1038/ismej.2015.205
Mohr, W., Grosskopf, T., Wallace, D. W., and LaRoche, J. (2010). Methodological underestimation of oceanic nitrogen fixation rates. PLoS One 5:e12583. doi: 10.1371/journal.pone.0012583
Montoya, J. P., Holl, C. M., Zehr, J. P., Hansen, A., Villareal, T. A., and Capone, D. G. (2004). High rates of N2 fixation by unicellular diazotrophs in the oligotrophic Pacific Ocean. Nature 430:1027. doi: 10.1038/nature02824
Montoya, J. P., and McCarthy, J. J. (1995). Isotopic fractionation during nitrate uptake by phytoplankton grown in continuous culture. J. Plankton Res. 17, 439–464.
Montoya, J. P., Voss, M., Kahler, P., and Capone, D. G. (1996). A simple, high-precision, high-sensitivity tracer assay for N2 fixation. Appl. Environ. Microbiol. 62, 986–993.
Naqvi, S., Jayakumar, D., Narvekar, P., and Nalk, H. (2000). Increased marine production of N2O due to intensifying anoxia on the Indian continental shelf. Nature 408:346.
Needoba, J. A., and Harrison, P. J. (2004). Influence of low light and a light: dark cycle on NO3– uptake, intracellular NO3–, and nitrogen isotope fractionation by marine phytoplankton. J. Phycol. 40, 505–516.
Peng, X., Fuchsman, C. A., Jayakumar, A., Oleynik, S., Martens-Habbena, W., Devol, A. H., et al. (2015). Ammonia and nitrite oxidation in the Eastern Tropical North Pacific. Glob. Biogeochem. Cycles 29, 2034–2049.
Peng, X., Fuchsman, C. A., Jayakumar, A., Warner, M. J., Devol, A. H., and Ward, B. B. (2016). Revisiting nitrification in the Eastern Tropical S outh P acific: a focus on controls. J. Geophys. Res. Oceans 121, 1667–1684.
Phillips, D. L., and Gregg, J. W. (2003). Source partitioning using stable isotopes: coping with too many sources. Oecologia 136, 261–269.
Polovina, J. J., Howell, E. A., and Abecassis, M. (2008). Ocean’s least productive waters are expanding. Geophys. Res. Lett. 35:L03618.
Qin, W., Amin, S. A., Martens-Habbena, W., Walker, C. B., Urakawa, H., Devol, A. H., et al. (2014). Marine ammonia-oxidizing archaeal isolates display obligate mixotrophy and wide ecotypic variation. Proc. Natl. Acad. Sci. U.S.A. 111, 12504–12509. doi: 10.1073/pnas.1324115111
R Core Team, (2013). R: A Language and Environment for Statistical Computing. Vienna: R Foundation for Statistical Computing.
Raes, E. J., Bodrossy, L., van de Kamp, J., Bissett, A., Ostrowski, M., Brown, M. V., et al. (2018a). Oceanographic boundaries constrain microbial diversity gradients in the South Pacific Ocean. Proc. Natl. Acad. Sci. U.S.A. 115, E8266–E8275. doi: 10.1073/pnas.1719335115
Raes, E. J., Clementson, L., Bodrossy, L., Strutton, P., and Waite, A. M. (2017). Pigment and Primary Productivity on the P15S GO-SHIP Transect: From the Ice Edge to the Equator Along 170°W. Available online at: https://doi.org/10.1594/PANGAEA.884052
Raes, E. J., Van De Kamp, J., Bodrossy, L., Fong, A. A., Riekenberg, J., Eyre, B. D., et al. (2018b). New and Regenerated Sources of Nitrogen: From the Ice Edge to the Equator in the South Pacific Ocean. Available online at: https://doi.org/10.1594/PANGAEA.885170
Raes, E. J., Waite, A. M., McInnes, A. S., Olsen, H., Nguyen, H. M., Hardman-Mountford, N., et al. (2014). Changes in latitude and dominant diazotrophic community alter N2 fixation. Mar. Ecol. Prog. Ser. 516, 85–102.
Raimbault, P., and Garcia, N. (2008). Evidence for efficient regenerated production and dinitrogen fixation in nitrogen-deficient waters of the South Pacific Ocean: impact on new and export production estimates. Biogeosciences 5, 323–338.
Ras, J., Claustre, H., and Uitz, J. (2008). Spatial variability of phytoplankton pigment distributions in the Subtropical South Pacific Ocean: comparison between in situ and predicted data. Biogeosciences 5, 353–369.
Santoro, A. E., Buchwald, C., McIlvin, M. R., and Casciotti, K. L. (2011). Isotopic signature of N2O produced by marine ammonia-oxidizing archaea. Science 333, 1282–1285.
Shiozaki, T., Bombar, D., Riemann, L., Hashihama, F., Takeda, S., Yamaguchi, T., et al. (2017). Basin scale variability of active diazotrophs and nitrogen fixation in the North Pacific, from the tropics to the subarctic Bering Sea. Glob. Biogeochem. Cycles 31, 996–1009.
Shiozaki, T., Furuya, K., Kodama, T., Kitajima, S., Takeda, S., Takemura, T., et al. (2010). New estimation of N2 fixation in the western and central Pacific Ocean and its marginal seas. Glob. Biogeochem. Cycles 24:GB003620.
Shiozaki, T., Kodama, T., and Furuya, K. (2014). Large-scale impact of the island mass effect through nitrogen fixation in the western South Pacific Ocean. Geophys. Res. Lett. 41, 2907–2913.
Sieburth, J. M., Smetacek, V., and Lenz, J. (1978). Pelagic ecosystem structure: heterotrophic compartments of the plankton and their relationship to plankton size fractions. Limnol. Oceanogr. 23, 1256–1263.
Sigman, D., Altabet, M., McCorkle, D., Francois, R., and Fischer, G. (1999). The δ15N of nitrate in the Southern Ocean: consumption of nitrate in surface waters. Glob. Biogeochem. Cycles 13, 1149–1166.
Sigman, D. M., Casciotti, K. L., Andreani, M., Barford, C., Galanter, M., and Böhlke, J. (2001). A bacterial method for the nitrogen isotopic analysis of nitrate in seawater and freshwater. Anal. Chem. 73, 4145–4153.
Sipler, R. E., Gong, D., Baer, S. E., Sanderson, M. P., Roberts, Q. N., Mulholland, M. R., et al. (2017). Preliminary estimates of the contribution of Arctic nitrogen fixation to the global nitrogen budget. Limnol. Oceanogr. Lett. 2, 159–166.
Sohm, J. A., Hilton, J. A., Noble, A. E., Zehr, J. P., Saito, M. A., and Webb, E. A. (2011). Nitrogen fixation in the South Atlantic Gyre and the Benguela upwelling system. Geophys. Res. Lett. 38:L16608.
Somes, C. J., Oschlies, A., and Schmittner, A. (2013). Isotopic constraints on the pre-industrial oceanic nitrogen budget. Biogeosciences 10, 5889–5910. doi: 10.5194/bg-10-5889-2013
Talley, L. D. (2011). Descriptive Physical Oceanography: An Introduction. Cambridge, MA: Academic press.
Turk-Kubo, K. A., Karamchandani, M., Capone, D. G., and Zehr, J. P. (2014). The paradox of marine heterotrophic nitrogen fixation: abundances of heterotrophic diazotrophs do not account for nitrogen fixation rates in the E astern T ropical S outh P acific. Environ. Microbiol. 16, 3095–3114.
Uitz, J., Claustre, H., Morel, A., and Hooker, S. B. (2006). Vertical distribution of phytoplankton communities in open ocean: an assessment based on surface chlorophyll. J. Geophys. Res. Oceans 111:JC003207.
Wada, E., and Hattori, A. (1976). Natural abundance of 15N in particulate organic matter in the North Pacific Ocean. Geochim. Cosmochim. Acta 40, 249–251.
Wang, W.-L., Moore, J. K., Martiny, A. C., and Primeau, F. W. (2019). Convergent estimates of marine nitrogen fixation. Nature 566, 205–211. doi: 10.1038/s41586-019-0911-2
Ward, B. (2005). Temporal variability in nitrification rates and related biogeochemical factors in Monterey Bay, California, USA. Mar. Ecol. Prog. Ser. 292, 97–109.
Weber, T., and Deutsch, C. (2014). Local versus basin-scale limitation of marine nitrogen fixation. Proc. Natl. Acad. Sci. U.S.A. 111, 8741–8746. doi: 10.1073/pnas.1317193111
Winkler, L. W. (1888). Die bestimmung des im wasser gelösten sauerstoffes. Eur. J. Inorgan. Chem. 21, 2843–2854.
Yool, A., Martin, A. P., Fernández, C., and Clark, D. R. (2007). The significance of nitrification for oceanic new production. Nature 447, 999–1002.
Zehr, J., and Turner, P. (2001). Nitrogen fixation: nitrogenase genes and gene expression. Methods Microbiol. 30, 271–286.
Zehr, J. P., and McReynolds, L. A. (1989). Use of degenerate oligonucleotides for amplification of the nifH gene from the marine cyanobacterium Trichodesmium thiebautii. Appl. Environ. Microbiol. 55, 2522–2526.
Keywords: N2 fixation, nitrification, latitudinal trends, GO-SHIP, nifH marine biogeography, South Pacific Ocean
Citation: Raes EJ, van de Kamp J, Bodrossy L, Fong AA, Riekenberg J, Holmes BH, Erler DV, Eyre BD, Weil S-S and Waite AM (2020) N2 Fixation and New Insights Into Nitrification From the Ice-Edge to the Equator in the South Pacific Ocean. Front. Mar. Sci. 7:389. doi: 10.3389/fmars.2020.00389
Received: 10 October 2019; Accepted: 05 May 2020;
Published: 28 May 2020.
Edited by:
Toshi Nagata, The University of Tokyo, JapanReviewed by:
Mary R. Gradoville, University of California, Santa Cruz, United StatesChristopher Somes, GEOMAR Helmholtz Centre for Ocean Research Kiel, Germany
Copyright © 2020 Raes, van de Kamp, Bodrossy, Fong, Riekenberg, Holmes, Erler, Eyre, Weil and Waite. This is an open-access article distributed under the terms of the Creative Commons Attribution License (CC BY). The use, distribution or reproduction in other forums is permitted, provided the original author(s) and the copyright owner(s) are credited and that the original publication in this journal is cited, in accordance with accepted academic practice. No use, distribution or reproduction is permitted which does not comply with these terms.
*Correspondence: Eric J. Raes, ZXJpYy5yYWVzQGNzaXJvLmF1