 Henrik Svedäng
 Viktor Thunell
 Ale Pålsson1,3
 Sofia A. Wikström
- 1Baltic Sea Centre, Stockholm University, Stockholm, Sweden
- 2Department of Aquatic Resources, Institute of Coastal Research, Swedish University of Agricultural Sciences, Öregrund, Sweden
- 3Depatment of History, Uppsala University, Uppsala, Sweden
- 4NordSIM Laboratory, Swedish Museum of Natural History, Stockholm, Sweden
The productivity of the Eastern Baltic cod (EBC) has been severely reduced over the last 25 years, for reasons that remain unclear. The size distribution of EBC has become increasingly truncated, condition and health status have deteriorated, and sexual maturation has started to occur at increasingly smaller sizes. Despite an increasing trend in recruitment during this period, reduced growth or increased mortality rates after the recruitment phase have resulted in decreasing landing levels and low profitability in the cod fishery, whereas the scientific community has difficulties in disentangling the causes of the decline of EBC. We studied changes in metabolic status in EBC between the capture years of 1995 and 2015, by investigating two aspects of fish metabolism that can be extracted retrospectively from otolith (earstone) morphometry and nitrogen content. Changes in relative otolith size to fish size are related to the metabolic history of the individual fish, and the otolith nitrogen content reveals the level of protein synthesis and feeding rate. Because otoliths accrue continuously on their surface and are biological stable (inert), the chemical content of the otolith trajectory reflects the timeline of the fish. We measured the N/Ca ratio as a proxy for protein content in EBC otolith along distal radius traverses from the core to the edge of the otolith by using secondary ion mass spectrometry (SIMS). Here we show that the otoliths were similar or larger at a given fish size, and the ratio of N/Ca has increased over the studied period. These proxies reveal significant metabolic changes during the same period as the condition, and stock productivity has declined. We discuss potential mechanisms behind the metabolic changes, including elevated temperature and compensatory feeding due to nutrient deficiencies. Such changes in food quality may, in turn, relate to still unrecognized but on-going ecosystem shifts, where climate change could be the ultimate driver.
Introduction
The Baltic Sea is a large, and in geological terms, young (about 9 KY) brackish watershed (Figure 1). The restricted number of animal and plant species, often with unique adaptations (Johannesson et al., 2011), reflects its challenging environment. On an intermediate time-scale, the hydrographic development of the Baltic Sea shows large-scale cyclic variation, influenced by the frequency of inflows of saline water from the North Sea (Mohrholz, 2018). Regime shifts due to such climate-induced alternations in the frequency of saltwater inflows from the Atlantic in combination with eutrophication (Savchuk, 2018), may have long-lasting effects on ecosystem structure and function (Österblom et al., 2007; Möllmann et al., 2015). The inflow of salt leads to a stratification of the water column, which may also promote the development of hypoxic conditions in the deepwater, as a consequence of organic matter originating from the surface waters sedimenting to the deeper parts of the sea (Fonselius, 1972). Eutrophication has raised primary productivity of phytoplankton in the Baltic Sea over the last century, leading to more widespread hypoxia (Carstensen et al., 2014; Andersen et al., 2017).
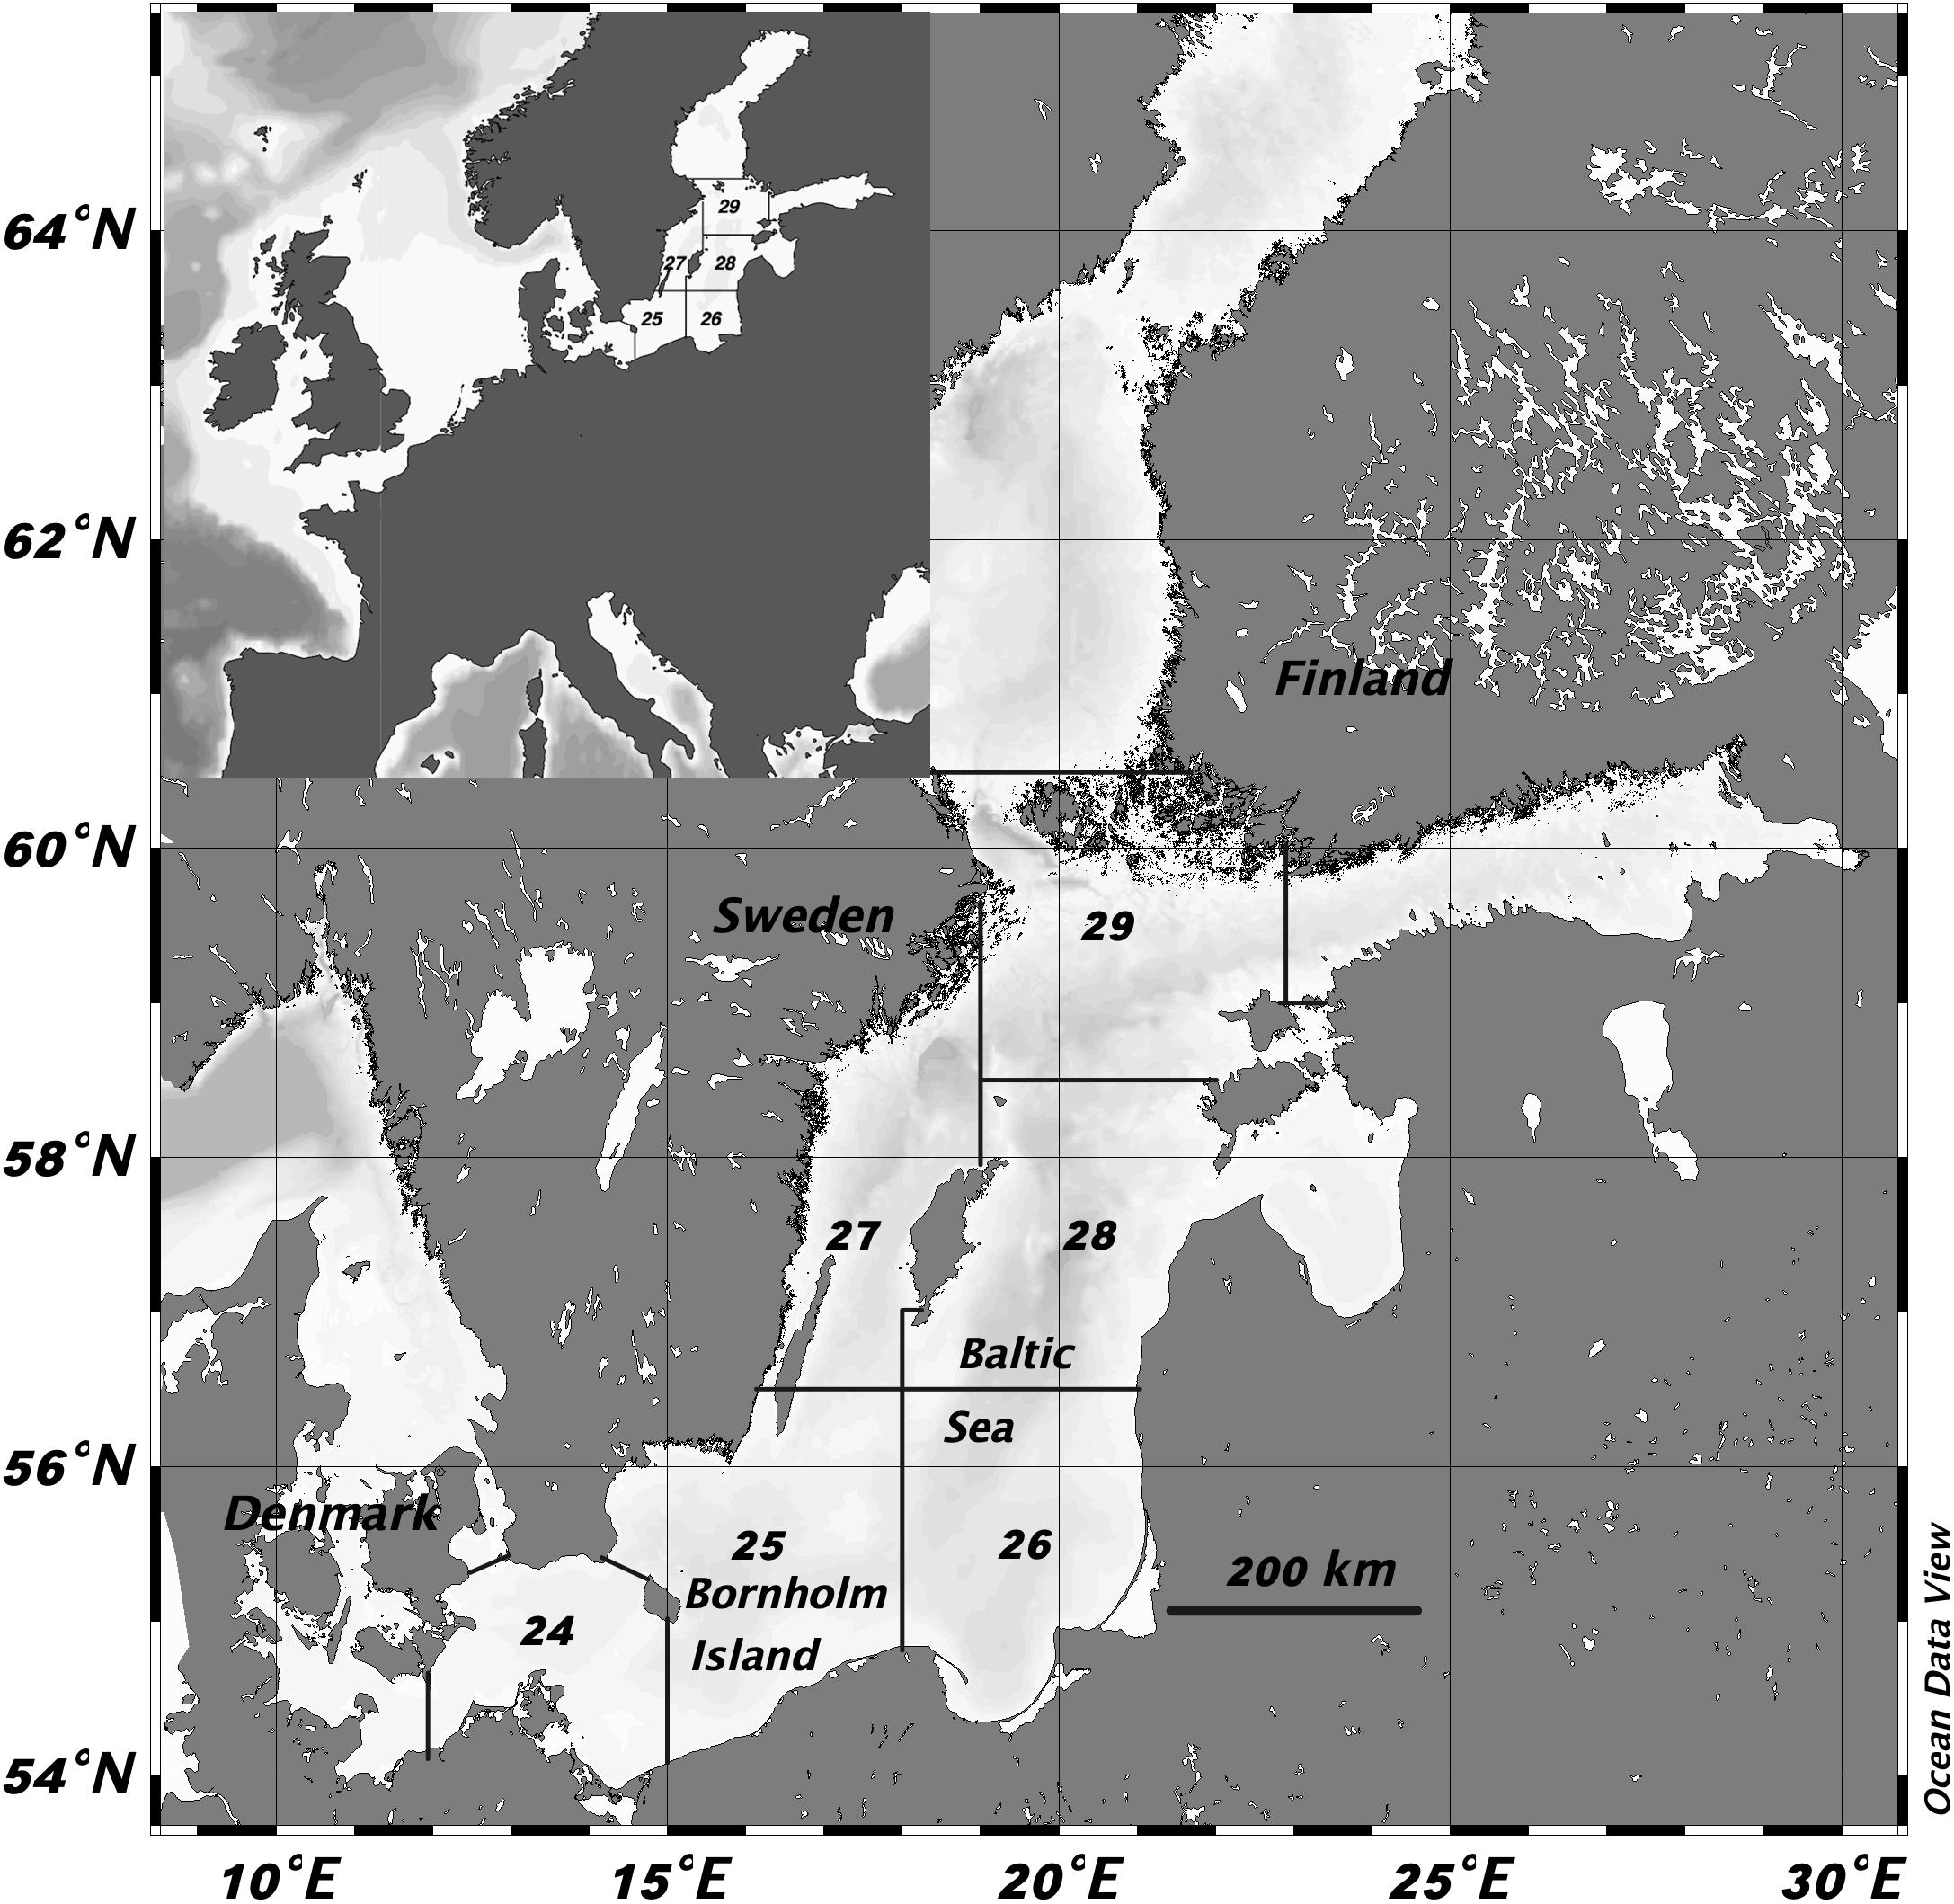
Figure 1. The Baltic Sea is shown with the borders and numbers of the ICES subdivisions (SD) (www.ices.dk). The Baltic cod reproduction takes place around of the Bornholm island. A map over Europe is inserted for orientation purposes.
Eastern Baltic cod (Gadus morhua; EBC) is a former commercially and ecologically important fish stock (e.g., Hammer et al., 2008; Lindegren et al., 2009). EBC shows adaptations necessary for reproducing and thriving in the low-saline Baltic Sea environment (Westin and Nissling, 1991; Berg et al., 2015), and is genetically well-separated from the western Baltic cod stocks (Poćwierz-Kotus et al., 2015). The stock is suggested to have benefited from the eutrophication of the Baltic Sea during the 20th century, as its food base was enlarged (Eero et al., 2011). EBC biomass increased massively from the 1940s to the beginning of the 1980s. This development was followed by shrinkage of recruitment and biomass due to the loss of spawning sites as the Baltic deepwater became increasingly hypoxic (MacKenzie et al., 2000), leading eventually to lower landings (Eero et al., 2007, 2011). The continued high fishing pressure in the 1990s further reduced the biomass at the remaining spawning area around the island of Bornholm (Hammer et al., 2008).
Improved recruitment and lower fishing effort resulted in a remarkable recovery in abundance in the late 2000s (Köster et al., 2017). However, the enhanced recruitment was not, transformed into higher biomass, as landings continued to wane through the 2000s and 2010s. Body condition and hepatosomatic index (HSI) started to decline in the mid-1990s (Eero et al., 2012), while the size distribution of EBC became increasingly truncated (Svedäng and Hornborg, 2017) and the fish mature at progressively smaller sizes (ICES, 2019a). Due to the deteriorated status of EBC, a fishing ban was eventually introduced in 2019.
There is no common understanding on why and how the productivity of EBC has declined (Eero et al., 2015). Several hypotheses have been put forward connecting the decreased productivity to a reduced feeding rate, which could stem from (a) regionally unbalanced fishing (Eero et al., 2012), (b) density-dependent feeding competition due to selective fishing (Svedäng and Hornborg, 2014, 2017), (c) the spread of hypoxic seafloor leading to density-dependent growth and lower condition (Casini et al., 2016), and substantially higher natural mortality (Neuenfeldt et al., 2019), or (d) that spread of hypoxic or low oxygen-saturated water may affect metabolism and thereby reducing the rate of digestion and hence food consumption in EBC (Limburg and Casini, 2018, 2019; Brander, 2020). Other hypotheses instead point at the increase of seal parasites, impairing growth and health status (e.g., Horbowy et al., 2016), or at the occurrence of thiamin deficiency affecting EBC among other Baltic animal populations (Engelhardt et al., 2020).
Reduced individual growth may be one of the proximate causes behind declining landings and truncated size distribution, including decreases in the length class diversity and the mean length in the survey catches between 1995 and 2015 (Eero et al., 2012; Svedäng and Hornborg, 2014, 2017). However, increased opacity and less distinct annuli (similar to the combination of one dark and light growth band observed in cross-section of a tree) have made EBC cod otoliths difficult to read (Hüssy et al., 2016). Age readings are, therefore, considered as unreliable by ICES (2015). Consequently, it is still unknown whether growth has declined or not, or if just condition (e.g., Casini et al., 2016) and health status (Statens veterinärmedicinska anstalt [SVA], 2016) has become weaker. Moreover, recent modeling work by ICES (2019b) suggests that exceptional increases in natural mortality might also result in truncated size distributions, assuming in the modeling that individual growth and survival rates are inversely related to each other. Because high, or normal, growth must be weighed against lower survival rates and vice versa in the modeling, it is unknown to what degree the truncated size distribution is related to reduced growth or higher natural mortality, or at which stage of the life cycle these processes may have been altered (ICES, 2019a; Neuenfeldt et al., 2019). As most of the proposed factors behind lower productivity in EBC suggest metabolic changes, it is crucial to determine when and how such metabolic alterations may have occurred in the stock.
Fisheries biologists take advantage of the morphometric and chemical properties of otoliths (earstones), in particular, the sagitta, which in Gadus morhua is the largest of three pairs located in the inner ear of fish (Campana, 1999). Analysis and interpretation of the chemistry of otoliths can inform us about origin and movements, thermal regimes, and salinities faced by fish over their lifetimes (e.g., Elfman et al., 2015). Further, otolith growth/size and opacity patterns can help us to extract records on experienced fish growth, metabolism, and protein uptake (Campana, 1983; Fablet et al., 2011; Pecquerie et al., 2012).
Otoliths are composed of crystalline calcium carbonate (CaCO3) in aragonite form which is enzymatically precipitated on a protein matrix that controls the shape and growth of the otolith (Söllner et al., 2003). The protein content accounts for 0.45–2.3% of otolith weight (Hüssy et al., 2004). Because otoliths accrue continuously on their surface and are biologically stable (inert), the chemical content of the otolith reflects the timeline as they have grown (Campana, 1999). This accretionary process is a three-dimensional succession of concentric layers of translucent and opaque materials, whose physicochemical properties vary from a daily to a seasonal basis due to endogenous and exogenous factors (Høie et al., 2008 and the references therein). Opaque zones absorb more light than translucent zones. Opaque zones, therefore, appear dark when viewed with transmitted light and bright when viewed with reflected light, and vice versa for translucent zones.
Aragonitic calcium crystals dominate translucent zones, while opaque structures contain a higher amount of protein (Mugiya, 1965; Campana, 1999). Both temperature and metabolism are hypothesized to affect the formation of opaque and translucent zones (Fablet et al., 2011). It has been suggested that the secretion of protein into the endolymphatic sac of the inner ear, and hence the incorporation into the otolith, is proportional to the overall body [global] protein synthesis (Hüssy and Mosegaard, 2004). Rearing experiments on cod have shown that opacity is linked to the feeding level at constant temperature, while at higher temperature the otoliths become more translucent (Høie et al., 2008). In other words, otolith opacity is likely to mirror the level of protein content, but is also affected by changes in thermal regimes where both increases and decreases lead to less opacity. Translucent structures are formed at low feeding conditions or during seasonal changes in temperature regimes, as a result of the associated decrease of the global protein synthesis and incorporation to otolith (Fablet et al., 2011).
While a relationship between otolith size and fish size is often evoked, for instance, in back-calculation practices, otolith growth is, in fact, seldom proportional to body growth (somatic growth) over time (Mosegaard et al., 1988 and the references therein). Slow, or null somatic growth leads to a decoupling between somatic and otolith growth; even if body growth has ceased due to low/high water temperature or starvation, otolith growth may still occur (Mosegaard et al., 1988; Hüssy and Mosegaard, 2004; Høie et al., 2008). This lack of correspondence is because otolith growth is better ascribed to metabolic activity than somatic growth alone (Mosegaard et al., 1988; Hüssy and Mosegaard, 2004; Fablet et al., 2011; Pecquerie et al., 2012). Otolith growth could thus be seen as an integral of fish metabolism, which, in turn, are dependent on food intake and the surrounding water temperature (Hüssy and Mosegaard, 2004; Fablet et al., 2011).
Otoliths thus may become bigger in older fish compared to younger at similar body sizes, as they integrate the total metabolism over a more extended period (Mosegaard et al., 1988; Hüssy and Mosegaard, 2004). It means that slow-growing fish have larger otoliths than fast-growing fish at the same body size, even though fast-growing fish have a higher otolith growth than slow-growing fish due to a higher instantaneous rate of metabolism (Mosegaard et al., 1988; Campana, 1990). On the other hand, at different temperature regimes but at similar somatic growth rates, otoliths may differ in size between fish of the same body size and age, due to the differences in experienced metabolic history (Mosegaard et al., 1988). However, additional factors may be at play as it seems not possible to describe the relationship between otolith growth and total metabolism as a simple proportionality (Grønkjær, 2016, and the references therein).
Nevertheless, the relationship between otolith and fish size may inform us about the experienced growth and metabolic history considering that there is a close correlation between otolith growth and O2-consumption (Wright et al., 2001). Fish of similar body size but different otolith size and age have experienced different growth rates. In contrast, fish of the same size and age but with different otolith size may have experienced different metabolic history due to differences in temperature or another factor.
Here, we aim at retrospectively reconstructing the metabolic status of EBC by estimating otolith size to fish size and otolith protein content, i.e., how fish growth and global protein synthesis in EBC may have changed between the capture years of 1995 and 2015, as the productivity of EBC deteriorated. We thereby assume that the otolith N-content reflects the protein feeding rate (Hüssy and Mosegaard, 2004). We also intend to investigate whether the observed increased opacity in EBC otoliths is due to increased protein content. Thus, instead of using the indirect proxy on otolith protein content by estimating opacity, we chose to measure the ratio between nitrogen (N) and calcium (Ca) as a better and a more direct proxy on otolith protein content.
By obtaining new insights into EBC metabolism and feeding rates over the period between the capture years of 1995 and 2015, we may confront hypotheses that relate the reduced productivity of EBC to lower feeding rates (Eero et al., 2012; Svedäng and Hornborg, 2014, 2017; Casini et al., 2016; Limburg and Casini, 2018, 2019; Karlson et al., 2019; Neuenfeldt et al., 2019; Orio et al., 2019; Brander, 2020). Finally, by finding when a shift in feeding rates has occurred, it is also possible to evaluate if the spread of seal parasites is a potential driver behind changed metabolism in EBC (e.g., Horbowy et al., 2016).
Materials and Methods
The Study Material
This project studied fish metabolism in EBC retrospectively by exploring stored sagittal otoliths, through analyzing the nitrogen (N) content and measuring otolith size relative to fish size. It thereby allowed us to follow both individual growth in relative terms and protein synthesis, which we assumed to be proportional to feeding rate over the studied period (Hüssy and Mosegaard, 2004). We used otoliths from the regular Swedish part of Baltic International Trawl Survey (BITS) in ICES subdivision (SD) 25 in the southern Baltic Sea (Figure 1), saved for age determination purposes (ICES, 2012). Information on date of capture, depth, fish length, weight, gonad developmental status, estimated age was obtained from the Swedish BITS (Supplementary Table S1). Since we wanted to study changes in feeding rates, we tried to avoid unnecessary variance in growth by choosing otoliths from fish that were similar at size-at-age. In total, we selected 100 otoliths from fish divided into 20 otoliths per the following capture years: 1995, 2000, 2005, 2010, and 2015 at the nominal age groups 2–5, i.e., five per age group and capture year (Supplementary Table S2 and Supplementary Figure S1). However, age was only treated as a nominal factor in the analyses, since age readings are no longer considered to be valid for EBC (ICES, 2015). All otoliths were sectioned in the transverse plane by micro-saw. The cut through the core to the edge represents the timeline of the fish; its first part forms during embryonic stage before hatching and the otolith then grows continuously until death. The study is thus investigating the relative otolith N-content retrospectively up to 5 years before capture.
The otolith sections were polished, cast in groups of four into 25 mm epoxy pucks, polished once more, and coated with a 30 nm layer of gold (Au) to prevent charging during the analysis process. The morphometrics of the prepared otoliths were measured (Figure 2). The width of the otolith (OW), i.e., the sum of the dorsal axis from the core to edge (DA), and the ventral axis in the opposite direction (VA) is a consistent way of measuring otolith size (Mosegaard et al., 1988). The ratio between otolith and fish length (OW/FL) was used to normalizing otolith size relative to fish size and thereby to compare otolith growth between individuals and year classes.
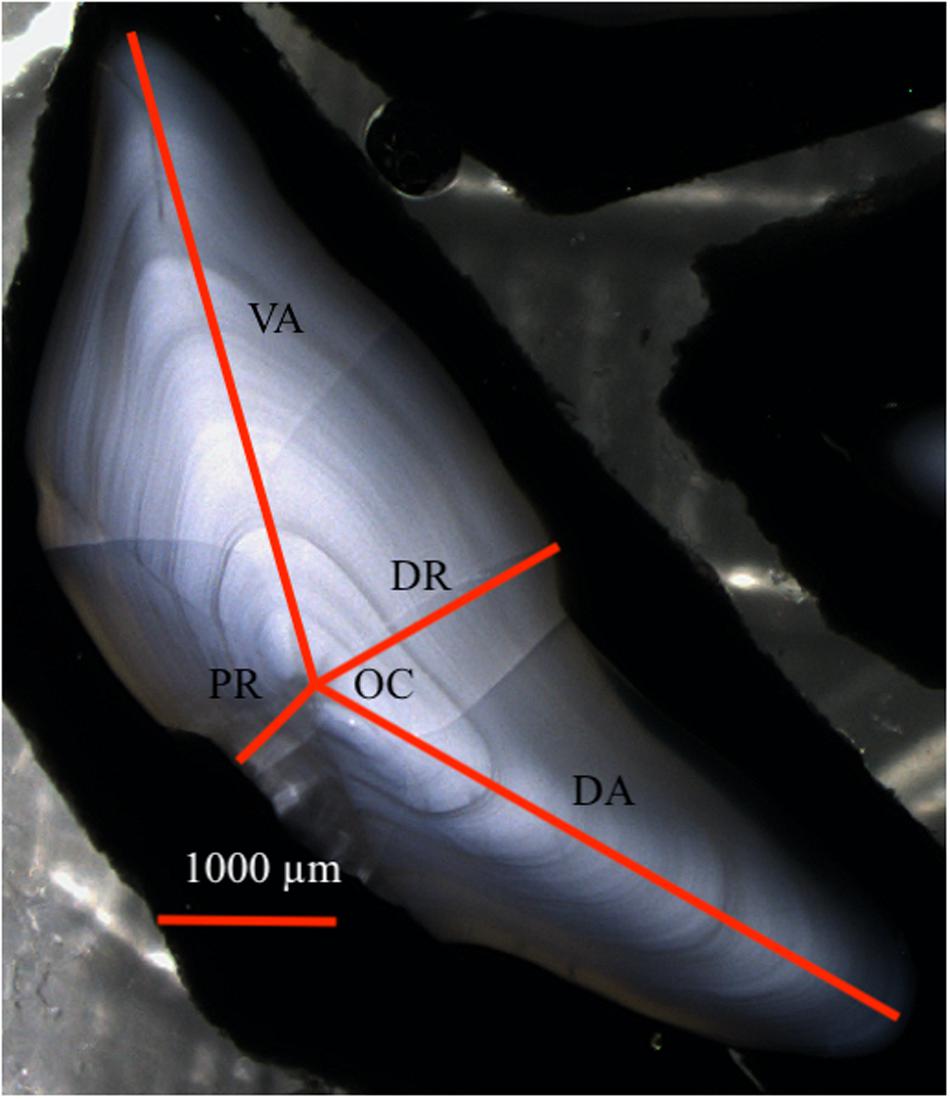
Figure 2. The measured morphometry of the otolith. OC – otolith core, DA – dorsal axis, VA – ventral axis, DR – distal radius, PR – proximal radius.
The Otolith Chemistry Analysis
We carried out the otolith N/Ca analysis at the Vega Centre, the Swedish Museum of Natural History, using a large geometry CAMECA ims1280 secondary ion mass spectrometer (SIMS) at the NordSIMS Laboratory, Stockholm. A critically focused, circa 0.6 nA Cs+ primary beam with 20 kV impact energy was utilized to sputter the otoliths, with a 10 μm raster applied to homogenize the beam density over the analyzed area. A low energy, normal incidence electron flooding gun was used to counteract charge build-up on the sample surface. Secondary ions were admitted to the mass spectrometer using a high-transmission transfer lens configuration and analyzed at a mass resolution (M/ΔM) of 8000. The two ionic species 12C14N– and 40Ca– were measured in a single, low noise ion counting electron multiplier, by peak switching between the two masses, with integration times of 2 and 4 s, respectively. Analyses were performed in automated sequences comprising a 20 μm pre-sputter to remove the gold coating, centering of the secondary ion beam in the field aperture, and optimization of the mass calibration, followed by 12 cycles of data acquisition.
We determined the 12C14N–/40Ca– ratios along a traverse at the distal radius (DR) from the otolith core to the edge of each studied otolith, i.e., perpendicular to the transversal axis and to the opaque and translucent ring structures (Figure 3). The distance was measured in μm, starting at the core while ending at the last spot along the transect. Deviations from DR occurred due to cracks and irregularities in the otolith, which have been accounted for. In total, 55 otolith were analyzed for the 12C14N–/40Ca– ratios (Table 1). The otoliths were selected to obtain an even coverage of all age groups by year of capture within the constraints of casting the otoliths together on the epoxy pucks.
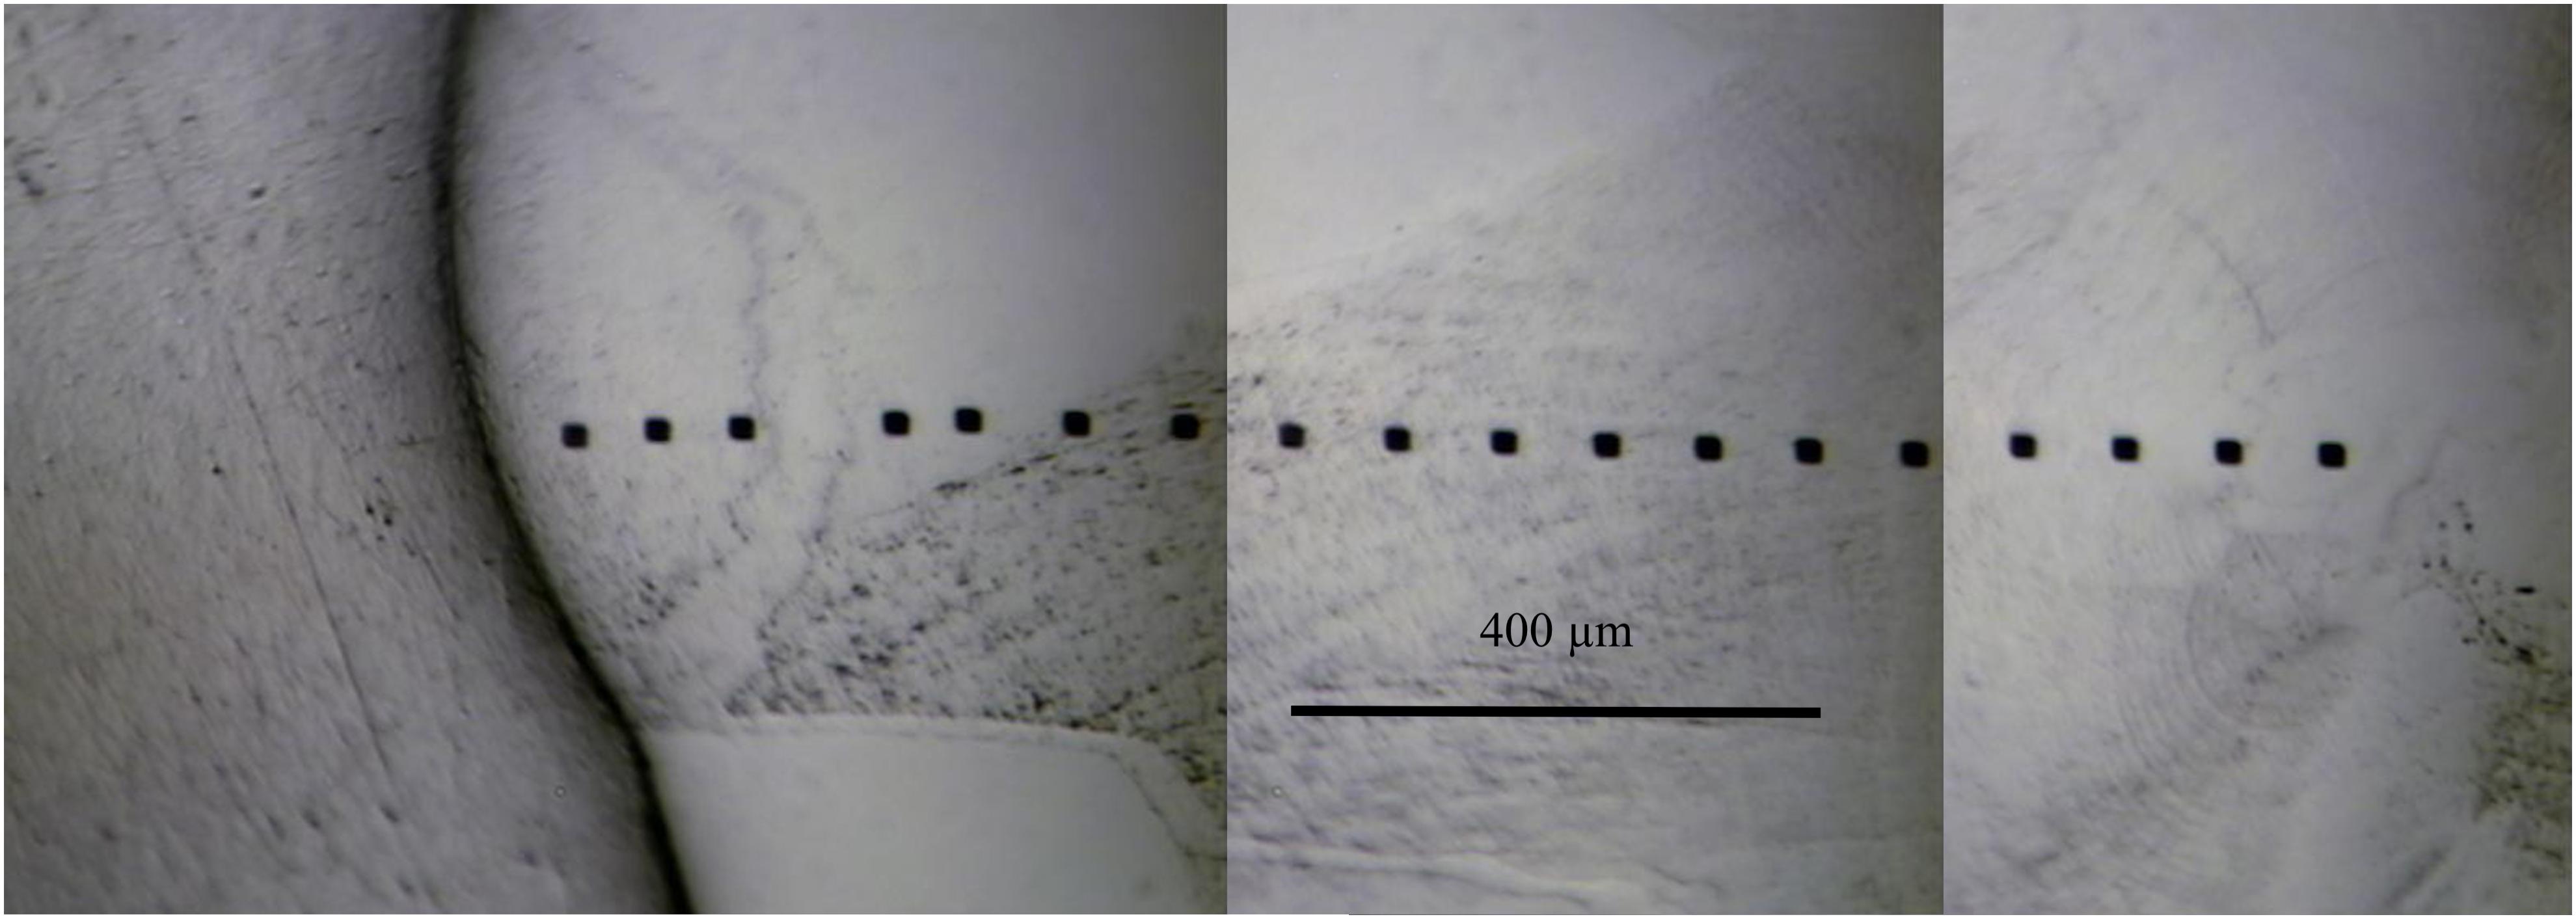
Figure 3. A merged photo of an otolith showing the spots taken on a transverse from the core along the distal radius toward the edge.
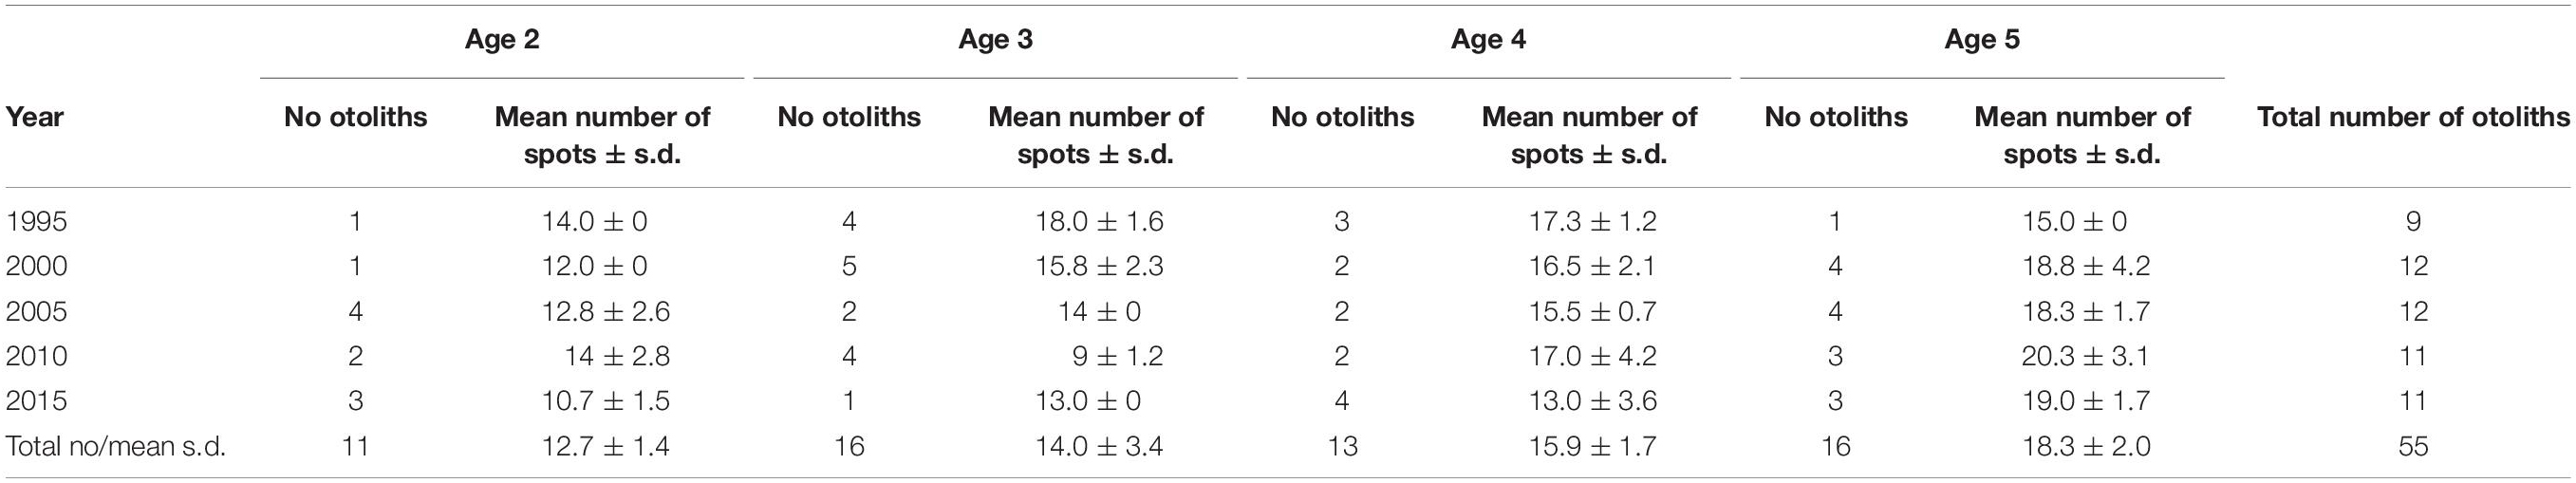
Table 1. Number of otoliths, mean number (± s.d.) of spots per otolith, by the year of capture and nominal age group.
The small-scale of the analyzed area (ca. 10 μm in diameter), allowed us to measure ∼15 spots along each traverse (Table 1). Assuming a relatively constant C and Ca content in the otoliths, given that these are crystallographic matrix elements, the 12C14N–/40Ca– ratio acts as a proxy for relative N concentration. The precision on the measured 12C14N–/40Ca– ratio was generally better than 5% (1s), typically averaging around 1%, which translates directly to the precision in relative N concentration. The absence of a calibrated reference material for determining N concentration in CaCO3, however, precludes converting this ratio to an accurate N concentration in the otolith targets. Still, the relative variations both between analyses along each traverse and between otoliths will be valid. For this reason, we henceforth use the term “N-content,” to discuss our results, either as N-content per spot (NPS) or as mean value per otolith for one or more ontogenic stages (see below).
Ontogenic Stages
Since we wanted to study changes in protein uptake over time, it is important to discount for the effects of ontogenic changes from year effects, because opacity is usually highest at the core and then declines slowly (Pecquerie et al., 2012). The spots measurements were assigned into four different ontogenic stages (egg, larval, juvenile, and adult) according to the distances from the core since DR represents an otolith timeline. The egg stage was defined according to the radius of the sagitta at hatching, i.e., <15 μm (e.g., Geffen, 1995). OW at settling in Baltic cod has been estimated to ∼1000 μm (Fey and Linkowski, 2006). The relative proportion of DR to OW was established, using on the studied otolith material (mean ± s.d.: 22 ± 2.7%; n = 98). The larval stage or pelagic phase until settling was thus defined by the distance from core between 16 and 220 μm. The division between juvenile and adult stages was arbitrarily set at 900 μm (data not shown) since DR of studied cod at ages 2 and 3 fluctuated around this size, which is the age at maturity in EBC (ICES, 2019b), i.e., the size intervals of the juvenile and adult stages were set at 221–899 and ≥900 μm, respectively. Since we assumed that the otolith accretion was similar over time, while the relative otolith size to fish size found to become smaller, this procedure may have exaggerated the juvenile stage for latter years of capture.
We noted that NPS varied strongly for the ontogenetic stages 1 and 2 (egg and larval), displaying high and low values (Table 2). The low values may be due to the transverse cut that had not gone through the structure or that the first spot may have been put outside the nucleus. Because of these methodological issues connected with the ontogenic stages 1 and 2, we excluded them from the mixed linear analysis.
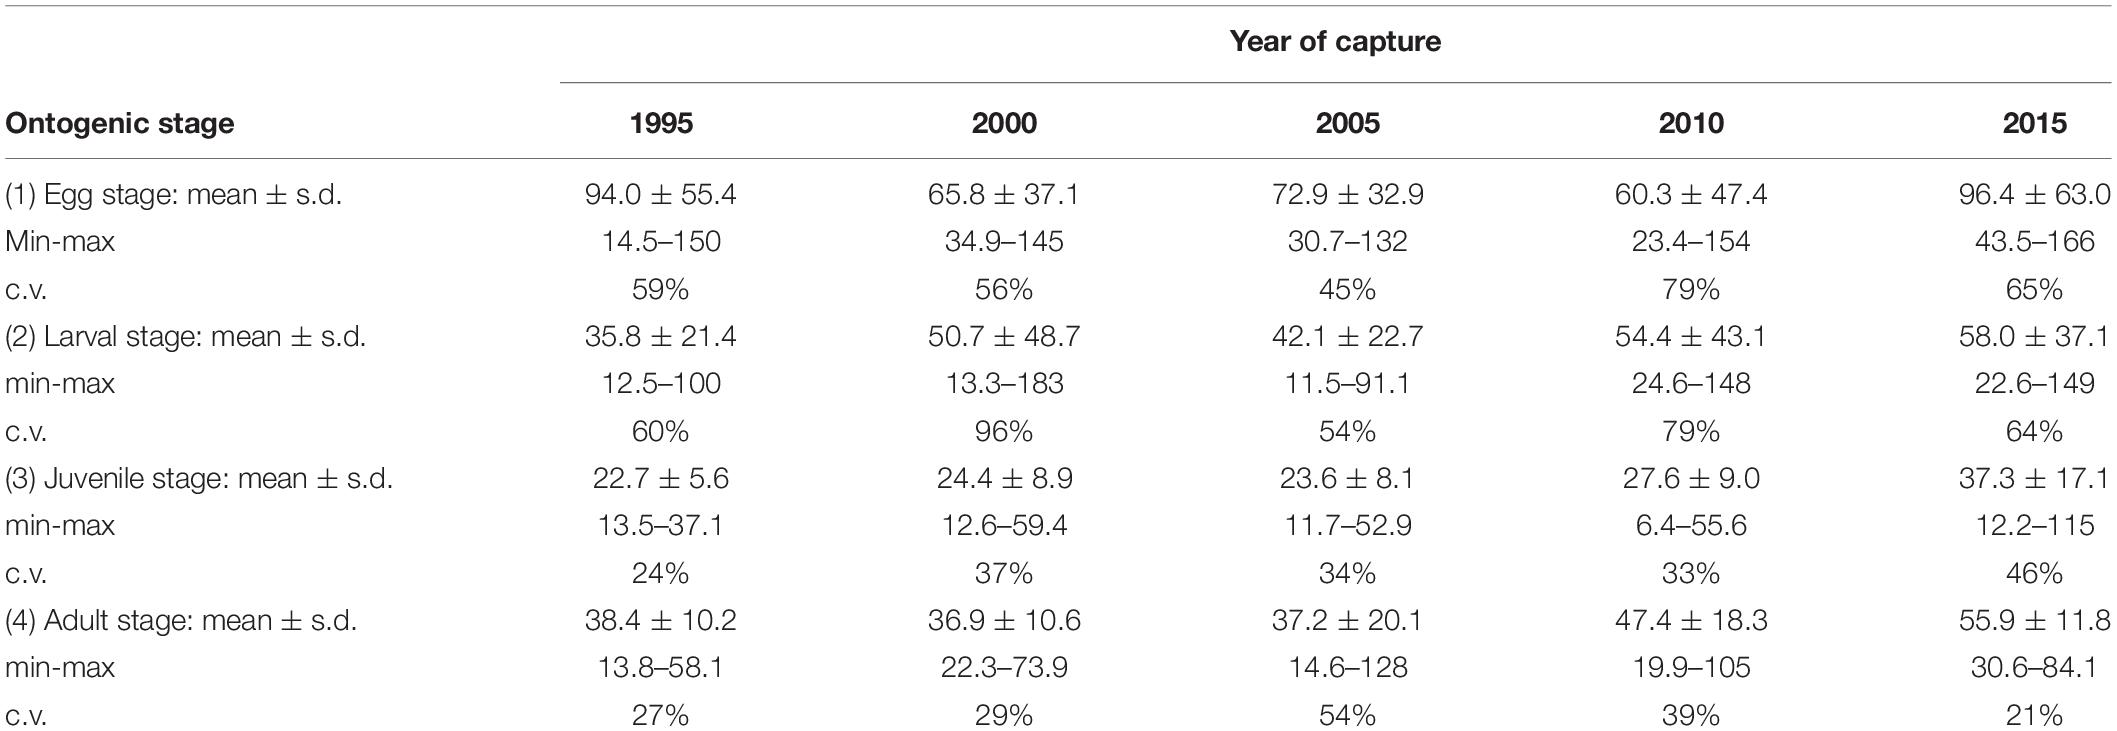
Table 2. The mean (±s.d.), minimum and maximum values, and c.v. of NPS per year of capture and ontogenic stage.
Condition Factor
We estimated changes in fish body condition by analyzing the development in Fulton’s condition factor CF (Ricker, 1975):
where W is the weight of the fish in gram, and L is the length in cm.
Statistical Analysis
To analyze changes in the N-content per spot (NPS) over time, we applied linear mixed models to account for the hierarchical structure in our study. Because the N-content was measured repeatedly on the same otoliths, NPS was nested within otoliths. Since the distances from the otolith core were used to assign individual NPS to an ontogenic stage, the otoliths were also nested within the ontogenic stage. Only two ontogenic stages were included: 3 (juvenile) and 4 (adult). We, therefore, chose to test four models, which assumed either (a) random intercept with fixed mean (i.e., models 1 and 3), (b) intercept varying among the grouping factor 1 (ontogenic stage) and grouping factor 2 (otolith) within grouping factor 1 (i.e., models 2 and 4). NPS were logarithmically transformed to attain better approximation to normality. Also, we included models with and without covariates, including interaction terms. The following formulations were thus tested by using “lme4” package for R (Bates et al., 2015):
1. NPS ∼ Year + (1 | Otolith)
2. NPS ∼ Year + (1 | Ontogenic stage/Otolith)
3. NPS ∼ Year + Ontogenic stage + (1| Otolith)
4. NPS ∼ Year + Ontogenic stage + (1| Ontogenic stage/Otolith)
where Year is the year of capture, which was considered as a fixed factor. Ontogenic stage is life history stage (juvenile or adult) defined by the distance from the otolith core to the spot measured was considered as both covariate (treated as a continuous variable) and grouping factor, and Otolith was the grouping variable representing different otoliths. It should be observed that the “lme4” package for R provides no p-value in ANOVA tests (Bates et al., 2015), but are indicative regarding the relative importance of different sources of variation. To test for differences between individual years while taking the repeated measurements into account, we used the Tukey HSD post hoc test after applying sequential Bonferroni correction, using the “multcomp” package for R (Hothorn et al., 2008). The information criteria AIC and BIC were used to select the best models (Wang and Liu, 2006 and the references therein). It should also be observed that the relatively small sample size in this study may lead to type 2 error, i.e., the power to detect a change is weak, leading to the non-rejection of a false null hypothesis.
For analysis of the otolith N-content in relation to FL and CF, we applied linear regression modeling by using the “stats v3.6.2” package for R1. As a dependent variable, the arithmetic mean value of the post-larval N-content of all spots per otolith was used, i.e., except for the egg and larval stages. These spots were excluded due to the large variability in the estimated relative N-content (Table 2 and Figure 4).
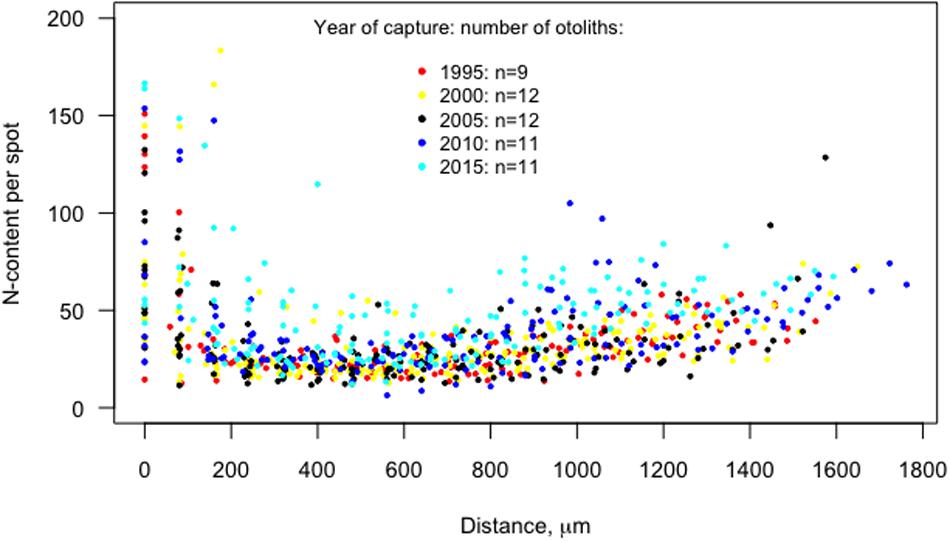
Figure 4. The N-content per spot (NPS), i.e., the ratio of 12C14N–/40Ca–, versus the distance (μm) from the otolith core to the edge of the otoliths, for the capture years 1995–2015. Egg stage (<15 μm), larval stage (16–220 μm), juvenile (221–900 μm), and adult (>900 μm).
To analyze the changes in ratio OW/FL over time, we applied an ANOVA model with fixed effects for Year (model 1) by using the “stats v3.6.2” package for R (see text footnote 1). The response variable was logarithmically transformed, to attain better approximation to normality. To test for differences between individual years, we used the Tukey HSD post hoc test after applying sequential Bonferroni correction.
Results
The Otolith N-Content
The accuracy of our estimations of the 12C14N–/40Ca– ratios was supported by the fact that the Ca-content over the transverse was stable with a mean coefficient of variation (c.v.) per otolith of 2.7% ± 3.0 (Supplementary Table S3 and Supplementary Figure S2), while the N-estimation showed more than 20 times higher variability (mean c.v. = 51% ± 23). The N-content per spot (NPS) varied systematically between ontogenic stages over time (Figure 4 and Table 2). NPS varied strongly for the ontogenetic stages 1 and 2 (egg and larval), displaying the highest recorded NPS (the maximum value of 166 for stage 1 in 2015) but also low values (e.g., the minimum value of 14.5 for stage 1 in 1995, and 11.5 for stage 2 in 2005). Because of methodological issues connected with the ontogenic stages 1 and 2 that may have given rise to this variation, we excluded them from the mixed linear analysis.
For ontogenic stage 3 (juvenile) and, in particular, stage 4 (adult), the mean value of NPS (increasing over the study period from 22.7 to 37.3 for stage 3, and from 38.4 to 55.8 for stage 4) showed an increasing trend since the capture year of 2010, i.e., the increase in N-content started before 2010 (Figure 4 and Table 2). The median of the mean post-larval N-content per cod otolith per year of capture were scattered below 30 before 2010, while increased in 2010 to around 38 (Figure 5). In the following capture year, 2015, the variability in mean post-larval N-content, was also high.
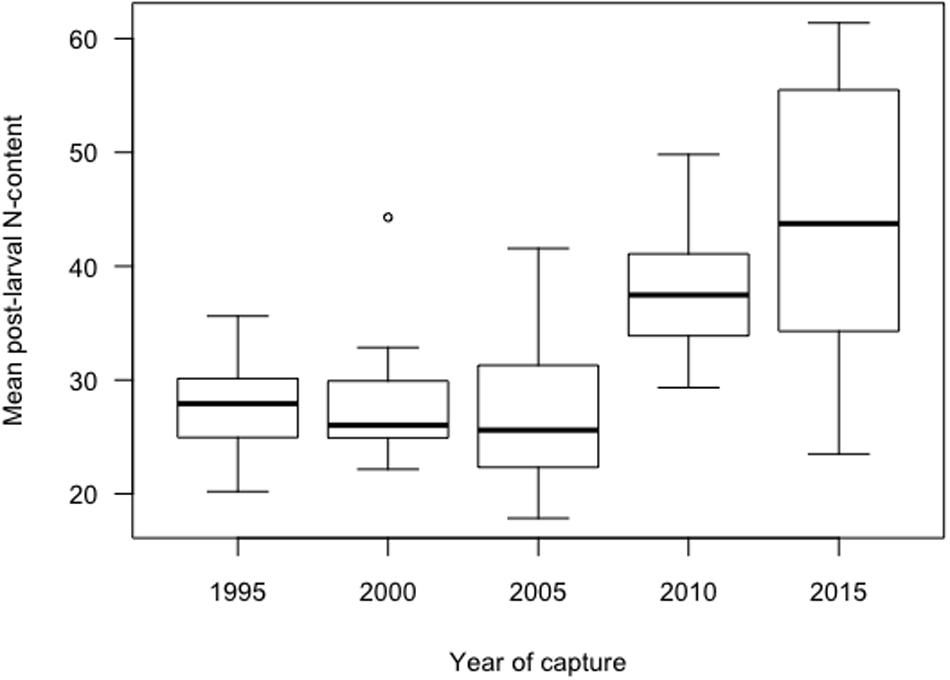
Figure 5. Boxplot of the post-larval mean N-content per otolith for capture years 1995–2015. Boxplots show median, interquartile ranges (box), ranges (vertical lines) and outliers (points). No trend is indicated in post-larval N-content between 1995 and 2005, while rising since 2010.
The comparison between different mixed linear regression models with NPS as the dependent variable showed the best fit for model 4, where the intercepts are assumed to be varying among the grouping factor 1 (Ontogenic stage) and grouping factor 2 (Otolith) within grouping factor 1 (Table 3). This model indicated that the Ontogenic stage as a grouping factor was the dominating source of variation for the random effects, while the fixed effects of Year were significantly more important than Ontogenic stage (Table 4). Pairwise comparisons (Tukey multiple comparisons of means) between years, confirmed that NPS was lowest at the start of the time series in 1995 (mean: 22.7 and 38.4 for stages 3 and 4, respectively) and highest in 2015 (mean: 37.3 and 55.9 for stages 3 and 4, respectively), and that a shift in N-content occurred between the capture years of 2005 and 2010 (from 37.2 to 47.4 for stage 4, Figure 5 and Table 2).
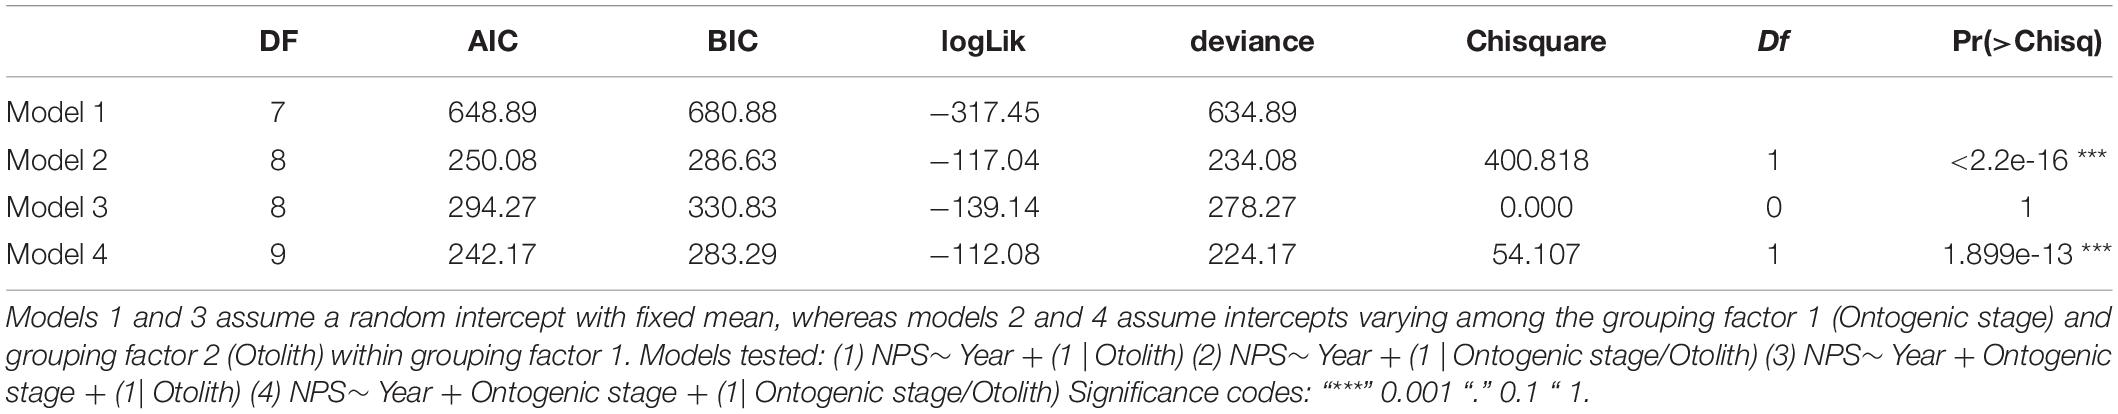
Table 3. The comparison between different mixed linear regression models with post-larval NPS as the dependent variable and Year and Ontogenic stage as fixed factors and Otolith and Ontogenic stage as grouping variables.
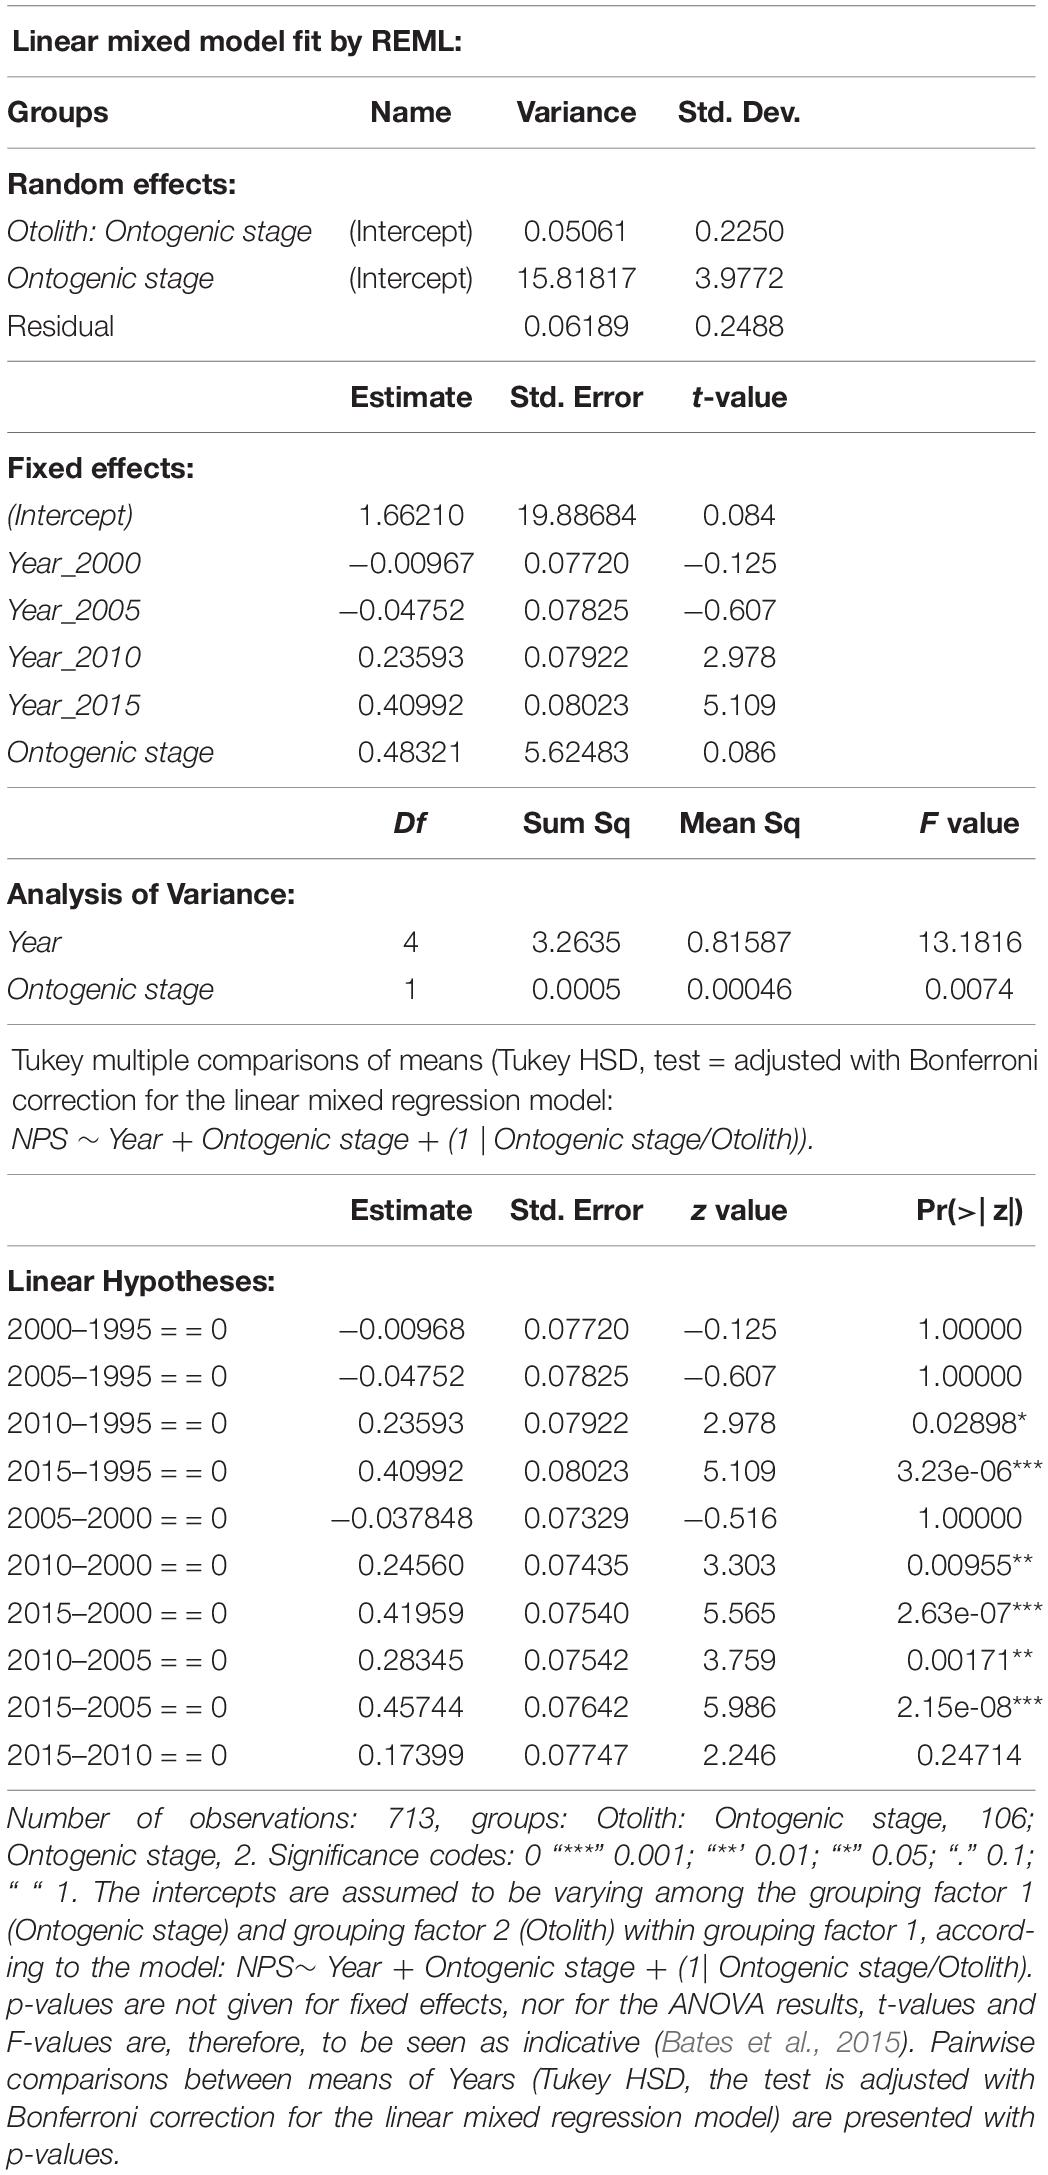
Table 4. Summary of linear mixed regression model for logarithmically transformed post-larval NPS with year of sampling (Year) and Ontogenic stage as fixed factors.
There was no trend in the mean post-larval N-content with increasing fish length for the period 1995–2005, while the mean N-content was positively related to fish length for the capture years 2010–2015 (Figure 6). The mean post-larval N-content showed no correlation with the condition factor for neither the whole time series nor the separate periods of 1995–2005 (mean ± s.d.: 28.4 ± 5.9) and 2010–2015 (mean ± s.d.: 40.2 ± 9.2, Figure 7).
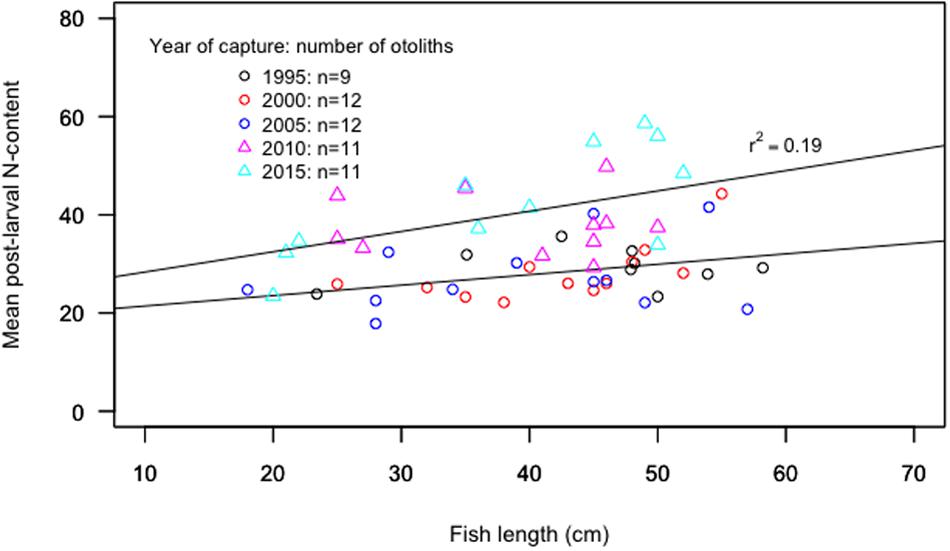
Figure 6. The mean value of the post-larval N-content per otolith in relation to fish length (cm) for all sampled cod. There is a significant increase in mean value of N-content in relation to fish length for the period 2010–2015 (p < 0.05, r2 = 0.19), while not for the previous period 1995–2005.
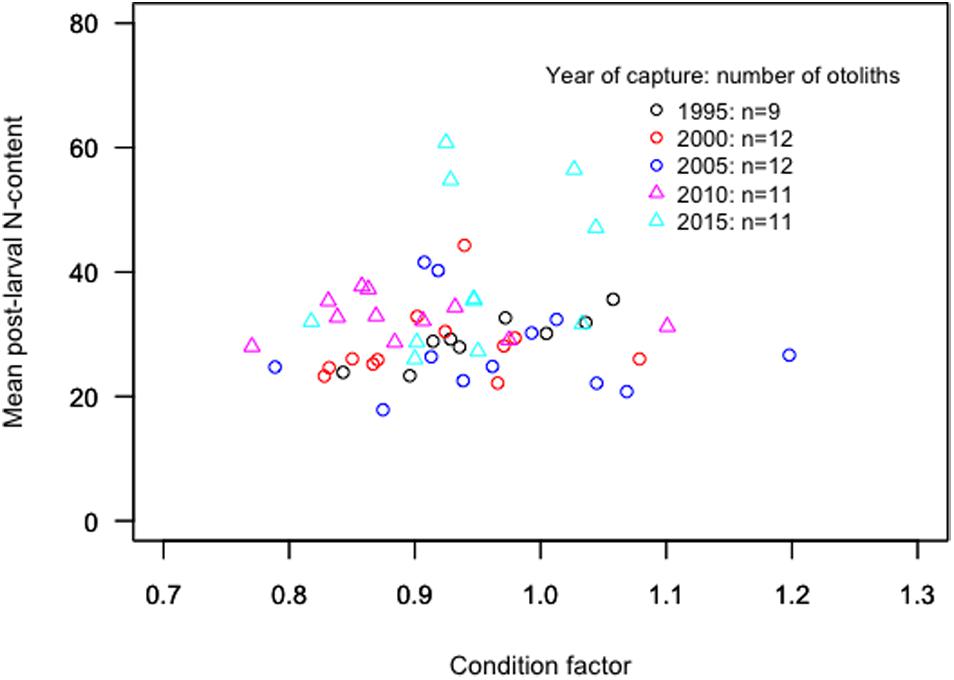
Figure 7. The mean value of the post-larval N-content per otolith in relation to condition factor for all sampled fish.
Morphometrics
The otoliths tended to become bigger over time, i.e., the ratios between otolith width (OW) and fish length (FL) increased marginally between the start and the end of the study period (Table 5, Figure 8). This pattern was more marked in younger age groups. All otoliths exhibited a similar relationship between OW and FL (Figure 9). ANOVA results and pairwise comparisons (Tukey multiple comparisons of means) indicated that OW/FL increased over time, as the ratios were significantly larger in 2010 compared to 1995 (Table 6).
Table 5. The mean (±s.d.), minimum, and maximum values of the ratio between otolith width and fish length (OW/FL) are shown by year of capture.
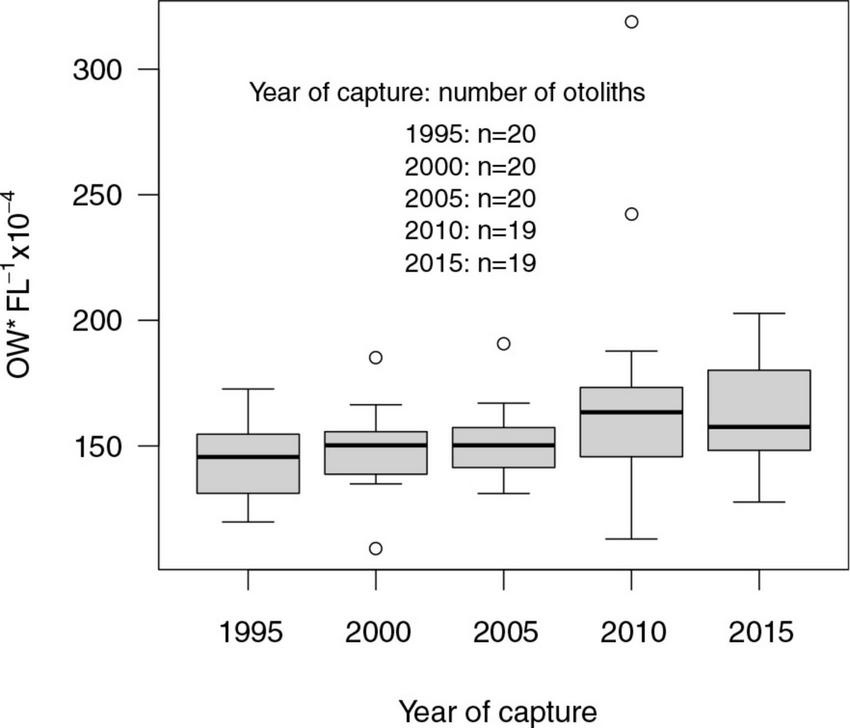
Figure 8. Boxplot of the otolith width (μmeter) in relation to fish length (cm) for all cod included in the study by the year of capture. Boxplots show median, interquartile ranges (box), ranges (vertical lines) and outliers (points). Sample sizes are given in the figure.
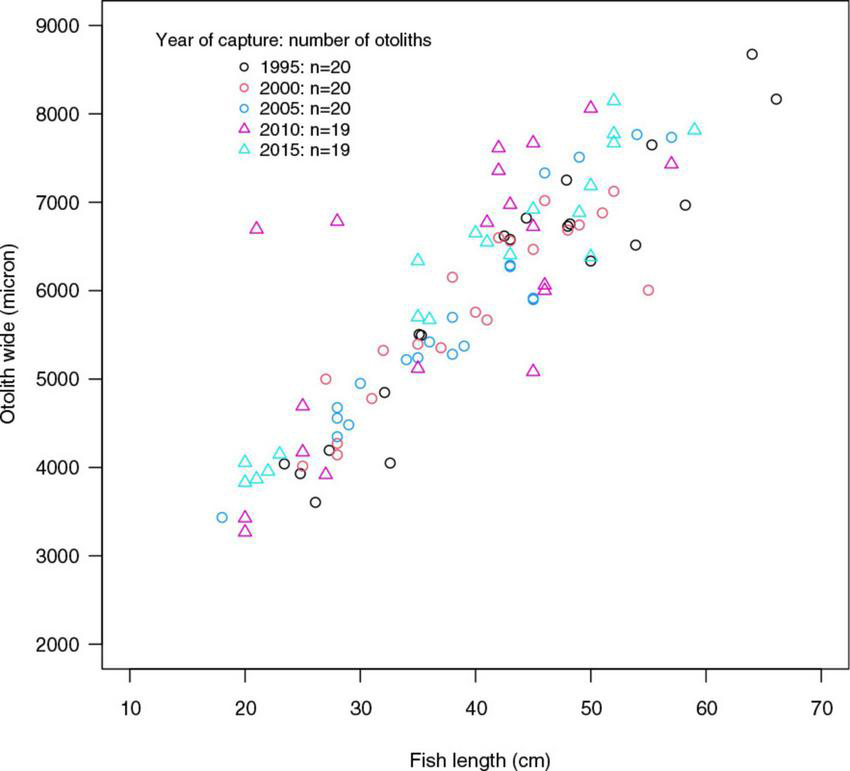
Figure 9. The ratio between otolith width (OW) and fish length (FL) by the year of capture.
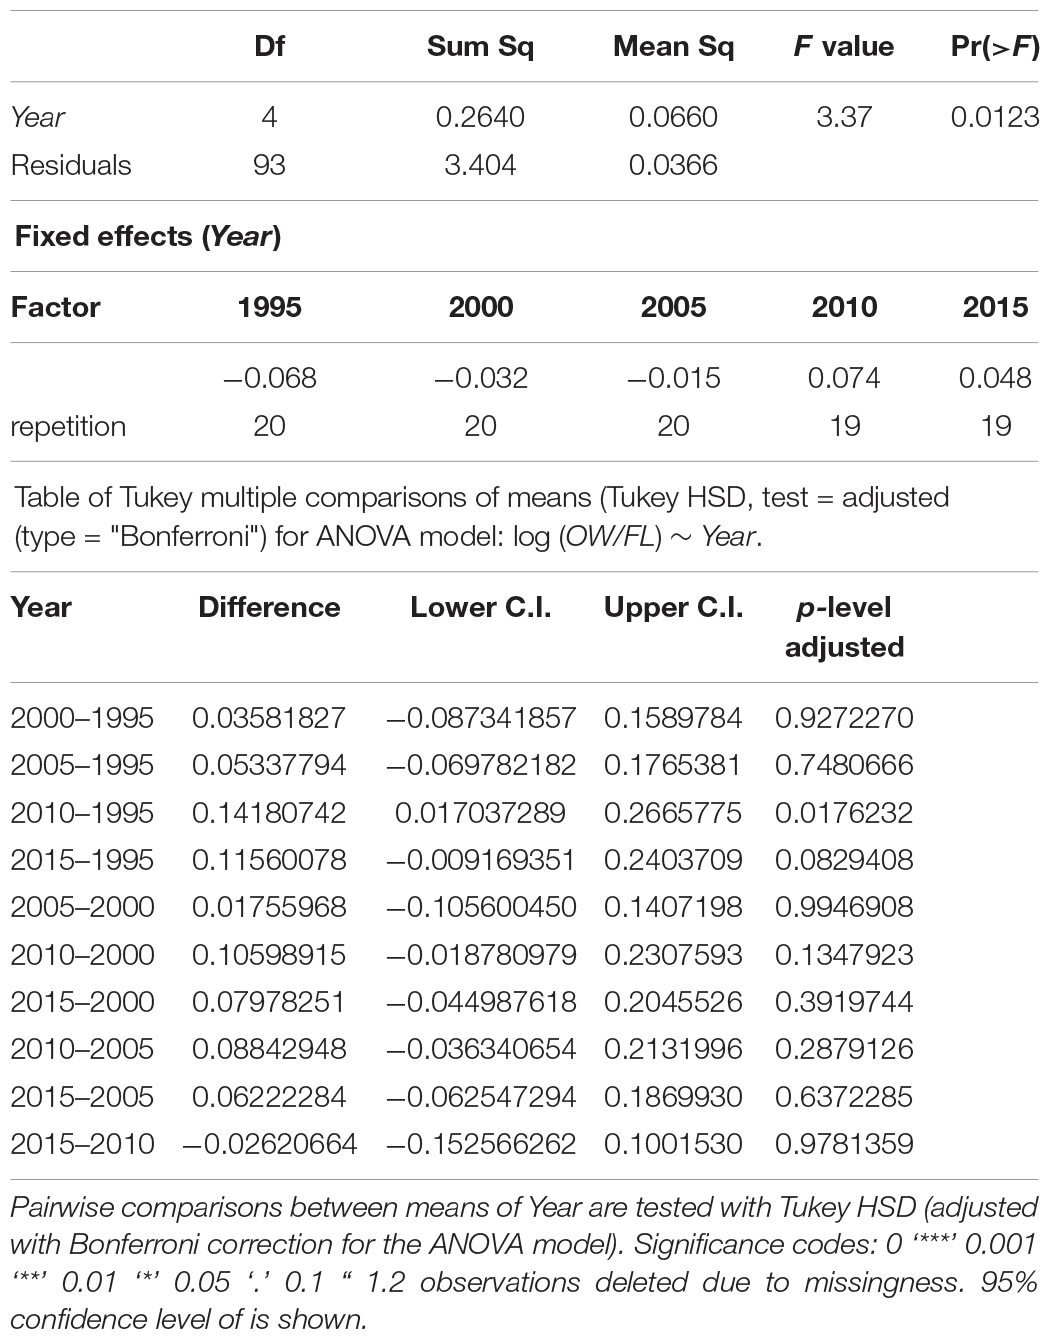
Table 6. Summary of ANOVA results for logarithmically transformed OW/FL-values with year of sampling (Year) as fixed factor.
The two proxies used to study metabolic changes, OW/FL and mean post-larval N-content, were found not to be related (linear regression, p = 0.34, adjusted r2 = 0.02, Supplementary Figure S3).
Discussion
This study on the metabolic status of EBC shows that the N-content per spot (NPS) has increased since the end of the 2000s and that the otolith sizes relative to fish size (OW/FL) became smaller since the mid-2000s. These observations show that significant metabolic changes occurred during the same period as when the productivity of EBC declined dramatically (ICES, 2019a). Given that the otolith N-content is a reliable measure of the otolith protein content (Mugiya, 1965; Campana, 1999), our results suggest a marked increase in protein content between 2005 and 2010. This observation may explain why EBC otoliths have become opaquer and hence less readable around 2010 (Hüssy et al., 2016) since protein-richer otoliths are opaquer than protein-poorer ones (c.f. Fablet et al., 2011, and references therein). Such change in otolith protein content indicates a shift in internal global protein synthesis, which depends on individual feeding rates (Hüssy and Mosegaard, 2004).
We also found for the period between 1995 and 2005 that the NPS was highest at the core, and then, after a sharp decline, slowly increased through ontogeny. This observation is partly similar to what is commonly observed in the development of otolith opacity over the ontogeny (Pecquerie et al., 2012), where opacity is highest at the core and then declines slowly. However, here we found that the pattern in NPS over the life-time of the fish has become much more erratic since the end of the 2000s, which signals metabolic disturbances.
Records on in this study suggests that OW/FL in EBC have been rather constant or increased marginally. However, otoliths could also become smaller due to decreased metabolic rates even though they are expressing identical somatic growth rates (Mosegaard et al., 1988). Experimental studies on Atlantic cod and Atlantic salmon (Salmo salar) suggest that proportionality between otolith size and somatic size may not always be affected by experienced differential energy allocation patterns (Aubin-Horth and Dodson, 2002; Høie et al., 2003).
Since we have not chosen fish in proportion to their frequency in the catch size distribution, it is not possible to tell whether individual growth on a population level has been stable or not. On the other hand, estimates based on accurately aged material comprising ages 1–3 as well as length-frequency analysis, support the view of moderately reduced individual growth in EBC over the last two decades (Hüssy et al., 2018). Also, the continued decline in the length class diversity and the mean length in the survey catches between 1995 and 2015 indicates lower individual growth (Svedäng and Hornborg, 2017) or increased natural mortality for fish above 30 cm (c.f. ICES, 2019a). Therefore, the present observations indicate reduced individual growth rates rather than higher metabolic rates.
Even though most observations support a decreased rather than increased individual growth in EBC, the changes in the maturation pattern indicate the opposite. Over the last 30 years, EBC has started to mature at increasingly smaller sizes; the maturity ogive, i.e., the size at which 50% of the stock attains maturity, has decreased from 40 to 20 cm (ICES, 2019a). Other studies have shown that faster growth, or an increased energetic surplus (Rowe and Thorpe, 1990), may lead to earlier maturation both in the wild and in reared cod (Hüssy et al., 2018). It is hence possible that the observed early maturation in EBC has been induced by growth retardation in size groups around 20 cm, i.e., in size groups whose condition has remained stable (Casini et al., 2016).
Our results give new insights to the decreasing productivity in EBC in the whole southern distribution area in the Baltic Sea, manifesting as lower body condition (Casini et al., 2016), an increasing truncated size distribution (Svedäng and Hornborg, 2017), poor health status (Statens veterinärmedicinska anstalt [SVA], 2016), and dwindling landings (ICES, 2019a). We found that the N-content was higher in the capture years from 2010 than up to 2005 for both the juvenile and adult stages, at the same time as EBC became increasingly unproductive (Eero et al., 2012; Svedäng and Hornborg, 2014; ICES, 2019a). From 2010 the mean post-larval N-content tended to increase with fish size and was higher in the adult compared to the juvenile stage. If the increased N-content is indicative of an increased feeding rate, it is clear that the feeding rate has increased mostly in larger and older fish. Thus, the results do not support the hypothesis that the lower productivity of EBC is related to food limitations (e.g., Eero et al., 2012; Svedäng and Hornborg, 2014, 2017, Casini et al., 2016; Karlson et al., 2019; Neuenfeldt et al., 2019; Orio et al., 2019). Neither does our study corroborate the conjectures of lower metabolic rates due to physiological stress, as a consequence of encounter hypoxic or low oxygen-saturated water (Limburg and Casini, 2018, 2019), reducing the rate of digestion and hence food consumption in EBC on a systemic level (Brander, 2020).
Another possible mechanism behind the change in metabolism is changed in food quality rather than quantity. Analyses of cod stomach data suggest substantial changes in dietary composition of EBC during the time period from 1990 to 2013, including an increased proportion of sprat (Sprattus sprattus) and slightly decreased proportion of herring (Clupea harengus; Kulatska et al., 2019). Because the sprat abundance increased over the period while the herring stock declined, Kulatska et al. suggested that EBC showed a strong preference for herring over sprat. Moreover, according to the “food-quality-limitation hypothesis” (Litzow et al., 2006), a climate-induced shift in prey for pelagic fish may have occurred in the Baltic Sea. Food quality changes are one of the few agents to affect EBC in a systemic way, which is in line with the observed change throughout the area (c.f. Gorokhova, 2019, and the references therein). Such changes in the food chain are most likely related to large-scale ecosystem changes, where primary producers are likely to play a critical role as producers of essential bio-molecules (Sylvander et al., 2013). Variability in phytoplankton production, such as increased cyanobacteria blooms, could hence be a crucial factor (Kahrua et al., 2020). Alternations in phytoplankton production may then affect the transfer of essential biomolecules in the food-chain (Sylvander et al., 2013; Snoeijs and Häubner, 2014; Fridolfsson et al., 2018). The eutrophic status of the Baltic Sea may be a prerequisite for the present intense cyanobacteria blooms (Andersen et al., 2017). However, increased summer temperatures due to climate warming could be the actual driver (Kahrua et al., 2020).
Engelhardt et al. (2020) proposed that the declining condition and health status in EBC are due to thiamin deficiency, as the thiamin content declined with fish size in a recent investigation on EBC. However, to avoid circularity, it remains to be shown whether the thiamin content in EBC deviates from a regular pattern, or whether the lower thiamin content could be due to some other perturbation, i.e., rather the effect than the cause of the EBC impaired condition. It is nonetheless reasonable to suggest that EBC could be suffering from lower food quality than previously encountered, i.e., it is limited by a complex molecule which it cannot produce on its own. The individual fish could then be trying to compensate for such a limiting nutrient by increasing feeding rates (c.f. Soengas, 2014). Higher feeding rates would hence lead to initially higher growth rates if the essential nutrient requirements are fulfilled by enhanced feeding, or higher energetic status, but could eventually also lead to increased natural mortality. The increasingly truncated size distribution would then be due to increased natural mortality (c.f. Neuenfeldt et al., 2019), in size groups above 30 cm, inflicted by malnutrition.
Changes in thermal regime may affect otolith growth even at similar individual [somatic] growth rates (Mosegaard et al., 1988). Otoliths may become relatively larger at both low and high suboptimal temperatures in comparison to more optimal temperatures (Hüssy and Mosegaard, 2004; Fablet et al., 2011). The progressively higher water temperature in the Baltic Sea since the mid-1990s due to climate change (Kniebusch et al., 2019) may have led to a thermal habitat with potential to affect OW/FL. However, metabolic changes may not always result in changed proportionality between otolithic and somatic growth (Aubin-Horth and Dodson, 2002).
In conclusion, since we cannot find that N-content has declined, nor that condition is related to the N-content, this study gives no evidence that lower feeding rates is the prevailing driver behind the decline in EBC productivity, either by food limitation (Eero et al., 2012; Svedäng and Hornborg, 2014, 2017; Casini et al., 2016; Orio et al., 2019) or physiological stress (Limburg and Casini, 2018, 2019; Brander, 2020). Furthermore, because these metabolic changes occurred well before the prevalence of seal parasites became higher (e.g., Horbowy et al., 2016), then these changes in metabolism in the EBC cannot be attributed to higher abundance of gray seals (Halichoerus grypus) in the southern Baltic Sea. Further studies are needed to understand better the driver of the higher feeding rate and how it is connected to the decreased productivity of the EBC. The study raises several questions on N-content and OW/FL relationships in fish stocks where thermal and nutritional regimes have changed, which may be interesting to explore in other fish stocks.
Data Availability Statement
The datasets generated for this study are available on request to the corresponding author.
Ethics Statement
The sampling of fish presented in this study followed the Swedish legislation and the regulations laid down by the Swedish Board of Agriculture. Ethical permit was given by the Gothenburg Animal Ethical Committee (license number 126-2015).
Author Contributions
HS coordinated the study, designed the research, and analyzed the data. HS, VT, and AP prepared the otolith material. MW designed and conducted the otolith chemistry analysis. HS, SW, and MW wrote the manuscript. All authors contributed to the article and approved the submitted version.
Funding
This study was partly financed by the Foundation Thuréus Forskarhem, with support from BalticSea2020 and partly from other sources at Stockholm University, Baltic Sea Centre. The NordSIM laboratory was funded by Swedish Research Council infrastructure grants (2014–06375 and 2017–00671), the University of Iceland and the Swedish Museum of Natural History. This is NordSIM contribution Se/2019/10.
Conflict of Interest
The authors declare that the research was conducted in the absence of any commercial or financial relationships that could be construed as a potential conflict of interest.
Acknowledgments
We thank Marie Leiditz at the Institute of Marine Research at Lysekil (SLU) for the otolith preparations. We are indebted to our three reviewers for their valuable comments.
Supplementary Material
The Supplementary Material for this article can be found online at: https://www.frontiersin.org/articles/10.3389/fmars.2020.00565/full#supplementary-material
Footnotes
References
Andersen, J. H., Carstensen, J., Conley, D. J., Dromph, K., Fleming-Lehtinen, V., Gustafsson, B. G., et al. (2017). Long-term temporal and spatial trends in eutrophication status of the Baltic Sea. Biol. Rev. 92, 135–149. doi: 10.1111/brv.12221
Aubin-Horth, N., and Dodson, J. J. (2002). Impact of differential energy allocation in Atlantic salmon (Salmo salar) precocious males on otolith-somatic size proportionality: a longitudinal approach. Can. J. Fish. Aquat. Sci. 59, 1575–1583. doi: 10.1139/f02-124
Bates, D., Maechler, M., Bolker, B., and Walker, S. (2015). Fitting linear mixed-effects models using lme4. J. Stat. Softw. 67, 1–48. doi: 10.18637/jss.v067.i01
Berg, P. R., Jentoft, S., Star, B., Ring, K. H., Knutsen, H., Lien, S., et al. (2015). Adaptation to low salinity promotes genomic divergence in atlantic cod (Gadus morhua L.). ?Genome Biol. Evol. 7, 1644–1663. doi: 10.1093/gbe/evv093
Brander, K. (2020). Reduced growth in Baltic Sea cod may be due to mild hypoxia. ICES J. Mar. Sci. 2019:fsaa041. doi: 10.1093/icesjms/fsaa041
Campana, S. E. (1983). Feeding periodicity and the production of daily growth increments in otoliths of steelhead trout (Salmo gairdneri) and starry flounder (Platichthys stellatus). Can. J. Zool. 61, 1591–1597. doi: 10.1139/z83-214
Campana, S. E. (1990). How reliable are growth back-calculation based on otoliths? Can. J. Fish. Aquat. Sci. 47, 2219–2227. doi: 10.1139/f90-246
Campana, S. E. (1999). Chemistry and composition of fish otoliths: pathways, mechanisms and applications. Mar Ecol. Prog. Ser. 188, 263–297. doi: 10.3354/meps188263
Carstensen, J., Andersen, J. H., Gustafsson, B. G., and Conley, D. J. (2014). Deoxygenation of the Baltic Sea during the last century. Proc. Natl. Acad. Sci. U.S.A. 111, 5628–5633. doi: 10.1073/pnas.1323156111
Casini, M., Käll, F., Hansson, M., Plikshs, M., Baranova, T., Karlsson, O., et al. (2016). Hypoxic areas, density-dependence and food limitation drive the body condition of a heavily exploited marine fish predator. R. Soc. Open Sci. 3:160416. doi: 10.1098/rsos.160416
Eero, M., Hjelm, J., Behrens, J., Buchmann, K., Cardinale, M., Casini, M., et al. (2015). Eastern Baltic cod in distress: an ecological puzzle hampering scientific guidance for fisheries management. ICES J. Mar. Sci. 72, 2180–2186. doi: 10.1093/icesjms/fsv109
Eero, M., Köster, F. W., Plikshs, M., and Thurow, F. (2007). Eastern Baltic cod (Gadus morhua callarias) stock dynamics: extending the analytical assessment back to the mid-1940s. ICES J. Mar. Sci. 64, 1257–1271. doi: 10.1093/icesjms/fsm114
Eero, M., Mackenzie, B. R., Köster, F. W., and Gislason, H. (2011). Multi-decadal responses of a cod (Gadus morhua) population to human-induced trophic changes, fishing, and climate. Ecol. Appl. 21, 214–226. doi: 10.1890/09-1879.1
Eero, M., Vinther, M., Haslob, H., Huwer, B., Casini, M., Storr-Paulsen, M., et al. (2012). Spatial management of marine resources can enhance the recovery of predators and avoid local depletion of forage fish. Cons. Lett. 5, 486–492. doi: 10.1111/j.1755-263X.2012.00266.x
Elfman, M., Limburg, K. E., Svedäng, H., Wickström, H., Borysiuk, M., Ros, L., et al. (2015). A decade’s worth of otolith pixe analyses. Int. J. 24, 85–100. doi: 10.1142/S0129083514400026
Engelhardt, J., Frisell, O., Gustavsson, H., Hansson, T., Sjöberg, R., Collier, T. K., et al. (2020). Severe thiamine deficiency in eastern Baltic cod (Gadus morhua). PLoS One 15:e0227201. doi: 10.1371/journal.pone.0227201
Fablet, R., Chessel, A., Carbini, S., Benzinou, A., and De Pontual, H. (2009). Reconstructing individual shape histories of fish otoliths: a new image-based tool for otolith growth analysis and modelling. Fish. Res. 96, 148–159. doi: 10.1016/j.fishres.2008.10.011
Fablet, R., Pecquerie, L., de Pontual, H., Høie, H., Millner, R., Mosegaard, H., et al. (2011). Shedding light on fish otolith biomineralization using a bioenergetic approach. PLoS One 6:e27055. doi: 10.1371/journal.pone.0027055
Fey, D. P., and Linkowski, T. B. (2006). Predicting juvenile Baltic cod (Gadus morhua) age from body and otolith size measurements. ICES J. Mar. Sci. 63, 1045–1052. doi: 10.1016/j.icesjms.2006.03.019
Fonselius, S. H. (1972). On biogenic elements and organic matter in the Baltic. Ambio Special Rep. 1, 29–36.
Fridolfsson, E., Lindehoff, E., Legrand, C., and Hylander, S. (2018). Thiamin (vitamin B1) content in phytoplankton and zooplankton in the presence of filamentous cyanobacteria. Limnol. Oceanogr. 63, 2423–2435. doi: 10.1002/lno.10949
Geffen, A. J. (1995). Growth and otolith microstructure of cod (Gadus morhua L.) larvae. J. Plankton Res. 17, 783–800. doi: 10.1093/plankt/17.4.783
Gorokhova, E. (2019). Individual body size as a predictor of lipid storage in Baltic Sea zooplankton. J. Plankton Res. 41, 273–280. doi: 10.1093/plankt/fbz010
Grønkjær, P. (2016). Otoliths as individual indicators: a reappraisal of the link between fish physiology and otolith characteristics. Mar. Freshw. Res. 67, 881–888. doi: 10.1071/MF15155
Hammer, C., von Dorrien, C., Ernst, P., Ernst, P., Gröhsler, T., Köster, F., et al. (2008). “Fish stock development under hydrographic and hydrochemical aspects, the history of Baltic Sea fisheries and its management,” in State and Evolution of the Baltic Sea, 1952-2005: A Detailed 50-Year Survey of Meteorology and Climate, Physics, Chemistry, Biology, and Marine Environment, eds R. Feistel, G. Nausch, and N. Wasmund (Hoboken: John Wiley and Sons), 543–581. doi: 10.1002/9780470283134.ch18
Høie, H., Folkvord, A., Mosegaard, H., Li, L., Clausen, L. A. W., Norberg, B., et al. (2008). Restricted fish feeding reduces cod otolith opacity. J. Appl. Ichthyol. 24, 138–143. doi: 10.1111/J.1439-0426.2007.01014.X
Høie, H., Folkvord, A., and Otterlei, E. (2003). Effect of somatic and otolith growth rate on stable isotopic composition of early juvenile cod (Gadus morhua L) otoliths. J. Exp. Mar. Biol. Ecol. 289, 41–58. doi: 10.1016/S0022-0981(03)00034-0
Horbowy, J., Podolska, M., and Nadolna-Ałtyn, K. (2016). Increasing occurrence of anisakid nematodes in the liver of cod (Gadus morhua) from the Baltic Sea: does infection affect the condition and mortality of fish? Fish. Res. 179, 98–103. doi: 10.1016/j.fishres.2016.02.011
Hothorn, T., Bretz, F., and Westfall, P. (2008). Simultaneous inference in general parametric models. Biom. J. 50, 346–363. doi: 10.1002/bimj.200810425
Hüssy, K., and Mosegaard, H. (2004). Atlantic cod (Gadus morhua) growth and otolith accretion characteristics modelled in a bioenergetics context. Effect of age and temperature on amino acid composition and the content of different protein types of juvenile Atlantic cod (Gadus morhua) otoliths. Can. J. Fish. Aquat. Sci. 61, 1021–1031. doi: 10.1139/f04-038
Hüssy, K., Mosegaard, H., and Jessen, F. (2004). Effect of age and temperature on amino acid composition and the content of different protein types of juvenile Atlantic cod (Gadus morhua) otoliths. Can. J. Fish. Aquat. Sci. 61, 1012–1020. doi: 10.1139/F04-037
Hüssy, K., Eero, M., and Radtke, K. (2018). Faster or slower: has growth of eastern Baltic cod changed? Mar. Biol. Res. 14, 598–609. doi: 10.1080/17451000.2018.1502446
Hüssy, K., Radtke, K., Plikshs, M., Oeberst, R., Baranova, T., Krumme, U., et al. (2016). Challenging ICES age estimation protocols: lessons learned from the eastern Baltic cod stock. ICES J. Mar. Sci. 73, 2138–2149. doi: 10.1093/icesjms/fsw107
ICES (2015). Report of WGBFAS Report 2015. 2.4 Cod in Subdivisions 25-32. Copenhagen: International Council for the Exploration of the Sea.
ICES (2019b). Benchmark Workshop on Baltic Cod Stocks (WKBALTCOD2). ICES Scientific Reports. 1:9. Copenhagen: ICES.
Johannesson, K., Smolarz, K., Grahn, M., and Andre, C. (2011). The future of Baltic Sea populations: local extinction or evolutionary rescue? Ambio 40, 179–190. doi: 10.1007/s13280-010-0129-x
Kahrua, M., Elmgren, R., Kaiser, J., Wasmund, N., and Savchuk, O. (2020). Cyanobacterial blooms in the Baltic Sea: correlations with environmental factors. Harmful Algae 92:101739. doi: 10.1016/j.hal.2019.101739
Karlson, A. M. L., Gorokhova, E., Gårdmark, A., Pekcan-Hekim, Z., Casini, M., Albertsson, J., et al. (2019). Linking consumer physiological status to food-web structure and prey food value in the Baltic Sea. Ambio 49, 391–406. doi: 10.1007/s13280-019-01201-1
Kniebusch, M., Meier, H. E. M., Neumann, T., and Börgel, F. (2019). Temperature variability of the Baltic Sea since 1850 and attribution to atmospheric forcing variables. J. Geophys. Res. 124, 4168–4187. doi: 10.1029/2018jc013948
Köster, F. W., Huwer, B., Hinrichsen, H.-H., Neumann, V., Makarchouk, A., Eero, M., et al. (2017). Eastern Baltic cod recruitment revisited—dynamics and impacting factors. ICES J. Mar. Sci. 74, 3–19. doi: 10.1093/icesjms/fsw172
Kulatska, N., Neuenfeldt, S., Bejer, U., Elvarsson, B. P., Wennhage, H., Stefansson, G., et al. (2019). Understanding ontogenetic and temporal variability of Eastern Baltic cod diet using a multispecies model and stomach data. Fish. Res. 211, 338–349. doi: 10.1016/j.fishres.2018.11.023
Limburg, K. E., and Casini, M. (2018). Effect of marine hypoxia on Baltic Sea cod Gadus morhua: evidence from otolith chemical proxies. Front. Mar. Sci. 5:482. doi: 10.3389/fmars.2018.00482
Limburg, K. E., and Casini, M. (2019). Otolith chemistry indicates recent worsened Baltic cod condition is linked to hypoxia exposure. Biol. Lett. 15:20190352. doi: 10.1098/rsbl.2019.0352
Lindegren, M., Möllmann, C., Nielsen, A., and Stenseth, N. C. (2009). Preventing the collapse of the Baltic cod stock through an ecosystem-based management approach. Proc. Natl Acad. Sci. U.S.A. 106, 722–714. doi: 10.1073/pnas.0906620106
Litzow, M. A., Bailey, K. M., Prahl, F. G., and Heintz, R. (2006). Climate regime shifts and reorganization of fish communities: the essential fatty acid limitation hypothesis. Mar. Ecol. Prog. Ser. 315, 1–11. doi: 10.3354/meps315001
MacKenzie, B. R., Hinrichsen, H.-H., Plikshs, M., Wieland, K., and Zezera, A. S. (2000). Quantifying environmental heterogeneity: estimating the size of habitat for successful cod egg development in the Baltic Sea. Mar. Ecol. Prog. Ser. 193, 143–156. doi: 10.3354/meps193143
Mohrholz, V. (2018). Major Baltic inflow statistics – revised. Front. Mar. Sci. 5:384. doi: 10.3389/fmars.2018.00384
Möllmann, C., Folke, C., Edwards, M., and Conversi, A. (2015). Marine regime shifts around the globe: theory, drivers and impacts. Philos. Trans. R. Soc. B 370:20130260. doi: 10.1098/rstb.2013.0260
Mosegaard, H., Svedäng, H., and Taberman, K. (1988). Uncoupling of somatic and otolithic growth rates in Arctic char (Salvelinus alpinus) as an effect of differences in temperature response. Can. J. Fish. Aquat. Sci. 45, 1514–1524.
Mugiya, Y. (1965). Calcification in fish and shell fish: IV. The differences in nitrogen content between opaque and translucent zones of otoliths in some fish. Bull. Jpn. Soc. Sci. Fish. 31, 896–901. doi: 10.2331/suisan.31.896
Neuenfeldt, S., Bartolino, V., Orio, A., Andersen, K. H., Andersen, N. G., Niiranen, S., et al. (2019). Feeding and growth of Atlantic cod (Gadus morhua L.) in the eastern Baltic Sea under environmental change. ICES J. Mar. Sci. 77:858. doi: 10.1093/icesjms/fsz224
Orio, A., Bergström, U., Florin, A.-B., Lehmann, A., Šics, I., and Casini, M. (2019). Spatial contraction of demersal fish populations in a large marine ecosystem. J. Biogeogr. 46, 633–645. doi: 10.1111/jbi.13510
Österblom, H., Hansson, S., Larsson, U., Wulff, F., Elmgren, R., and Folke, C. (2007). Human-induced trophic cascades and ecological regime shifts in the Baltic Sea. Ecosystems 10, 877–889. doi: 10.1007/s10021-007-9069-0
Pecquerie, L., Fablet, R., de Pontual, H., Bonhommeau, S., Alunno-Bruscia, M., Petitgas, P., et al. (2012). Reconstructing individual food and growth histories from biogenic carbonates. Mar. Ecol. Prog. Ser. 447, 151–164. doi: 10.3354/MEPS09492
Poćwierz-Kotus, A., Kijewska, A., Petereit, C., Bernaś, R., Więcaszek, B., Arnyasi, M., et al. (2015). Genetic differentiation of brackish water populations of cod Gadus morhua in the southern Baltic, inferred from genotyping using SNP-arrays. Mar. Genom. 19, 17–22. doi: 10.1016/j.margen.2014.05.010
Ricker, W. E. (1975). Computation and interpretation of biological statistics of fish populations. Bull. Fish. Res. Bd Can. 191, 1–382.
Righton, D. A., Andersen, K. H., Neat, F., Thorsteinsson, V., Steingrund, P., Svedäng, H., et al. (2010). Thermal niche of Atlantic cod Gadus morhua: limits, tolerance and optima. Mar. Ecol. Prog. Ser. 420, 1–13. doi: 10.3354/meps08889
Rowe, D. K., and Thorpe, J. E. (1990). Differences in growth between maturing and non-maturing male Atlantic salmon, Salmo salar L., parr. J. Fish Biol. 36, 643–658. doi: 10.1111/j.1095-8649.1990.tb04319.x
Savchuk, O. P. (2018). Large-scale nutrient dynamics in the Baltic Sea, 1970–2016. Front. Mar. Sci. 5:95. doi: 10.3389/fmars.2018.00095
Snoeijs, P., and Häubner, N. (2014). Astaxanthin dynamics in Baltic Sea mesozooplankton communities. J. Sea Res. 85, 131–143. doi: 10.1016/j.seares.2013.04.015
Soengas, J. L. (2014). Contribution of glucose- and fatty acid sensing systems to the regulation of food intake in fish. A review. Gen. Comp. Endocrinol. 205, 36–48. doi: 10.1016/j.ygcen.2014.01.015
Söllner, C., Burghammer, M., Busch Nentwich, E., Berger, J., Schwarz, H., Riekel, C., et al. (2003). Control of crystal size and lattice formation by starmaker in otolith biomineralization. Science 302, 282–286. doi: 10.1126/science.1088443
Statens veterinärmedicinska anstalt [SVA] (2016). Kartläggning Av Sårskadad Fisk i Hanöbukten. [Mapping of fish with skin wounds. (in)Hanöbukten] Redovisning av regeringsuppdrag 2014/1349Nm [in Swedish]. Uppsala: Statens veterinärmedicinska anstalt.
Svedäng, H., and Hornborg, S. (2014). Selective fishing induces density-dependent growth. Nat. Comm. 5:4152. doi: 10.1038/ncomms5152
Svedäng, H., and Hornborg, S. (2017). Historic changes in length distributions of three Baltic cod (Gadus morhua) stocks: evidence of growth retardation. Ecol. Evol. 7, 6089–6102. doi: 10.1002/ece3.3173
Sylvander, P., Häubner, N., and Snoeijs, P. (2013). The thiamine content of phytoplankton cells is affected by abiotic stress and growth rate. Microb. Ecol. 65, 566–577. doi: 10.1007/s00248-012-0156-1
Wang, Y., and Liu, Q. (2006). Comparison of Akaike information criterion (AIC) and Bayesian information criterion (BIC) in selection of stock–recruitment relationships. Fish. Res. 77, 220–225. doi: 10.1016/j.fishres.2005.08.011
Westin, L., and Nissling, A. (1991). Effects of salinity on spermatozoa motility, percentage of fertilized eggs and egg development of Baltic cod (Gadus morhua), and implications for cod stock fluctuations in the Baltic. Mar. Biol. 108, 5–9. doi: 10.1007/BF01313465
Keywords: Baltic cod, ecosystem change, food quality, growth, otolith microchemistry, protein uptake
Citation: Svedäng H, Thunell V, Pålsson A, Wikström SA and Whitehouse MJ (2020) Compensatory Feeding in Eastern Baltic Cod (Gadus morhua): Recent Shifts in Otolith Growth and Nitrogen Content Suggest Unprecedented Metabolic Changes. Front. Mar. Sci. 7:565. doi: 10.3389/fmars.2020.00565
Received: 19 March 2020; Accepted: 19 June 2020;
Published: 08 July 2020.
Edited by:
Samad Rahimnejad, University of South Bohemia in České Budějovice, CzechiaReviewed by:
Pedro Morais, University of Algarve, PortugalKarin E. Limburg, SUNY College of Environmental Science and Forestry, United States
Jonna Tomkiewicz, Technical University of Denmark, Denmark
Copyright © 2020 Svedäng, Thunell, Pålsson, Wikström and Whitehouse. This is an open-access article distributed under the terms of the Creative Commons Attribution License (CC BY). The use, distribution or reproduction in other forums is permitted, provided the original author(s) and the copyright owner(s) are credited and that the original publication in this journal is cited, in accordance with accepted academic practice. No use, distribution or reproduction is permitted which does not comply with these terms.
*Correspondence: Henrik Svedäng, aGVucmlrLnN2ZWRhbmdAc3Uuc2U=
†ORCID: Henrik Svedäng, orcid.org/0000-0002-3639-7105; Sofia A. Wikström, orcid.org/0000-0003-3508-2109; Martin J. Whitehouse, orcid.org/0000-0003-2227-577X