 Januar Harianto
 Joshua Aldridge
 Sergio A. Torres Gabarda2
 Richard J. Grainger
 Maria Byrne
- 1School of Life and Environmental Sciences, The University of Sydney, Sydney, NSW, Australia
- 2Sydney Institute of Marine Science, Mosman, NSW, Australia
Ocean warming (OW) and acidification (OA) affects nearly all aspects of marine organism physiology and it is important to consider both stressors when predicting responses to climate change. We investigated the effects of long-term exposure to OW and OA on the physiology of adults of the sea urchin, Heliocidaris erythrogramma, a species resident in the southeast Australia warming hotspot. The urchins were slowly introduced to stressor conditions in the laboratory over a 7-week adjustment period to three temperature (ambient, +2°C, +3°C) and two pH (ambient: pHT 8.0; −0.4 units: pHT 7.6) treatments. They were then maintained in a natural pattern of seasonal temperature and photoperiod change, and fixed pH, for 22 weeks. Survival was monitored through week 22 and metabolic rate was measured at 4 and 12 weeks of acclimation, feeding rate and ammonia excretion rate at 12 weeks and assimilation efficiency at 13 weeks. Acclimation to +3°C was deleterious regardless of pH. Mortality from week 6 indicated that recent marine heatwaves are likely to have been deleterious to this species. Acclimation to +2°C did not affect survival. Increased temperature decreased feeding and increased excretion rates, with no effect of acidification. While metabolic rate increased additively with temperature and low pH at week 4, there was no difference between treatments at week 12, indicating physiological acclimation in surviving urchins to stressful conditions. Regardless of treatment, H. erythrogramma had a net positive energy budget indicating that the responses were not due to energy limitation. To test for the effect of parental acclimation on offspring responses, the offspring of acclimated urchins were reared to the juvenile stage in OW and OA conditions. Parental acclimation to warming, but not acidification altered juvenile physiology with an increase in metabolic rate. Our results show that incorporation of gradual seasonal environmental change in long-term acclimation can influence outcomes, an important consideration in predicting the consequences of changing climate for marine species.
Introduction
Many of the key challenges in predicting the ecological consequences of climate change stem from the fact that organisms are confronted with multiple biotic and abiotic stressors, which often interact (Boyd and Brown, 2015; Przeslawski et al., 2015; Boyd et al., 2017; Goldenberg et al., 2017). The impacts of global warming and ocean acidification are intricately linked as approximately 90% of the Earth’s heat and 25% of anthropogenic CO2 emissions are absorbed directly into the ocean (Gattuso et al., 2015). Further, marine heatwaves (MHW) are a major climate change stress in many regions (Babcock et al., 2019; Holbrook et al., 2019).
Ocean warming (OW) increases the body temperature of marine ectotherms, affecting metabolism and most biological processes (Brown et al., 2004; Somero, 2012). Concurrently, ocean acidification (OA) alters the carbonate saturation states in sea water which may alter the metabolic costs associated with acid–base regulation and calcification, with evidence of reduced biomineral production and hypercapnia (Byrne et al., 2013; Kroeker et al., 2013; Thomsen et al., 2015; Byrne and Fitzer, 2019). Given that warming and acidification both influence key metabolic processes, stressor interactions are inevitable with biological responses affected in unexpected ways (Kordas et al., 2011; Boyd and Brown, 2015; Boyd et al., 2017). This highlights the uncertainty as to our understanding of the drivers of ecosystem change in a high CO2 world. For example, increased temperature affects both oxygen demand and the supply of oxygen in water (Pörtner, 2010; Christensen et al., 2011; Schulte, 2015) and may limit oxygen delivery, restricting metabolism and exacerbating the energetic demands elicited by OA (Dillon et al., 2010; Deutsch et al., 2015; Lefevre, 2016).
Exposure to combined warming and acidification often causes negative impacts that are either additive (e.g., increased metabolism in sea urchins, Carey et al., 2016) or synergistic (e.g., increased photosynthesis in foraminifera, Schmidt et al., 2014). However, positive or neutral responses have also been observed, such as in the development and thermal windows of echinoderm larvae (Karelitz et al., 2016) and the growth of sea urchins and mussels (Keppel et al., 2015; Dworjanyn and Byrne, 2018), and reproduction in many taxa (Harvey et al., 2013). Warming can ameliorate the negative effects of acidification on biological processes such as calcification, but within limits (Sheppard Brennand et al., 2010; Dworjanyn and Byrne, 2018). Critical gaps remain in our understanding of the ability of marine species to acclimatize or adapt to global change stressors within and across generations as most studies involve short-term acute experiments where the stress is immediate and so is delivered at a pace unrealistic with respect to global change. Organisms respond differently to more gradual introduction to a stressor and long-term acclimation (Dupont et al., 2013; Byrne et al., 2020; Uthicke et al., 2020). In general, acclimation to increased temperature decreases thermal sensitivity over time (Seebacher et al., 2014), and if this coincides with gamete development, can have positive carryover effects in conveying stress resilience to offspring (Pechenik, 2018; Byrne et al., 2020).
Warming and/or acidification have broadly deleterious effects on sea urchin growth, behavior, metabolism, reproduction and immune defense and disease, with response magnitude influenced by the stressor levels used (Byrne et al., 2011a, b, 2013; Brothers et al., 2016; Carey et al., 2016; Delorme and Sewell, 2016; Sweet et al., 2016; Manríquez et al., 2017; Dworjanyn and Byrne, 2018; Byrne and Fitzer, 2019; Byrne and Hernández, 2020). Global change experiments with sea urchins and other marine invertebrates that incorporate an acclimation period show that outcomes differ from the acute, shock-type approach (e.g., Dupont et al., 2013; Munguia and Alenius, 2013; Bellworthy et al., 2019; Uthicke et al., 2020). For Strongylocentrotus droebachiensis, a decrease in fecundity was observed after 4 months exposure to acidification (−0.3 pH units), but not after 16 months (Dupont et al., 2013). For Sterechinus neumayeri, exposure to warming (+2°C) and acidification (−0.3 to −0.5 units) over 2 years diminished the negative effects of these stressors on metabolism and reproduction (Suckling et al., 2015; Morley et al., 2016). For Echinometra sp. a 20-month exposure to warming (+1°C, +2°C) and acidification (−0.2 to −0.3 units) had no effects on growth, respiration and reproduction (Uthicke et al., 2020). Similar acclimatory responses are reported for corals (Stylophora pistillata) and crustaceans (Paradella dianae) exposed to warming and acidification (Munguia and Alenius, 2013; Bellworthy et al., 2019).
Acclimation as an important mechanism of phenotypic plasticity to adjust to changing habitat conditions within and across generations (Ghalambor et al., 2007). Parental stress history can influence stress responses in offspring (Byrne et al., 2020). The temperature at which gametes develop determines the thermal tolerance of fertilization and offspring development in a range of species (Byrne, 2011; Byrne et al., 2011b). However, the progeny of S. intermedius were negatively affected by parental exposure (15 months) to warming (Zhao et al., 2018). Acclimation of S. droebachiensis in OA (14 months) through gonad maturation had some positive carryover effects for surviving offspring, although mortality was high (Dupont et al., 2013). In S. purpuratus acclimation in OA conditions (4.5 months) increased embryonic growth and altered the transcriptome (Wong et al., 2018), but it is not known if these responses are negative or positive. For Echinometra sp. acclimation of parents to warming and acidification had negative carryover effects for larvae (Karelitz et al., 2020).
We examined the combined effects of warming and acidification in an acclimation experiment with the sea urchin Heliocidaris erythrogramma and outcomes for offspring reared in these stressors. This species is ecologically important in structuring subtidal habitats across temperate Australia through its grazing ecology (Keesing, 2020). In the southeast region H. erythrogramma resides in a hotspot where habitat warming is the global change stressor of primary concern (Babcock et al., 2019). In a preconditioning single stressor acclimation study, where temperature was gradually increased (+2–4°C) followed by a 14-week exposure, this species exhibited some capacity to acclimate to moderate warming (+2°C) but struggled to survive at a higher (+4°C) temperature increase (Harianto et al., 2018). Here, we build on this research using a preconditioning period that involved a gradual introduction to warming (+2°C, +3°C) and acidification (−0.4 pH units) levels over 7 weeks in the flow-through aquaria to facilitate adjustment of the urchins to new conditions. This was followed by >5 months of acclimation under a natural pattern of seasonal temperature (offset at +2°C and +3°C) and photoperiod change at two pH levels (ambient pHT 8.0; −0.4 units: pHT 7.6). The treatments are commensurate with current and ongoing warming projections for the region, although recent MHWs which have extended for months have resulted in temperature increase at the levels used here (Oliver et al., 2018; Babcock et al., 2019).
Over 22-weeks we monitored survival and metabolic rate was measured at weeks 4 and 12 to evaluate physiological responses over two experimental periods and assess the acclimation response. Feeding, assimilation efficiency, excretion and survival were also recorded. As maintaining energy is key to long-term survival, the physiological parameter data were used to model scope for growth (SfG). This bioenergetics framework is used to quantify performance and energy budgets and has been applied to assess the impacts of warming and/or acidification on marine invertebrates including gastropods and sea urchins (Hill and Lawrence, 2006; Zhang et al., 2015, 2016; Delorme and Sewell, 2016). We used the SfG model to explore whether changes in the energy budget may be associated with the responses of H. erythrogramma. This approach allowed us to integrate multiple physiological traits under a single response metric to achieve a better understanding of the vulnerability of H. erythrogramma to warming and acidification.
We maintained H. erythrogramma for 22 weeks through the period of intense gonad development of local populations (September–December, see Laegdsgaard et al., 1991), a physiologically demanding period (Powell et al., 2020) to assess how they would survive in treatments and generate gametes with which to generate F1 progeny. The fast development of this species which metamorphoses within a week was used as a model to investigate carryover effects of parental acclimation. Offspring were reared to the juvenile in OW and OA conditions and their metabolic rate and growth were measured to determine if parental stress history altered these parameters.
We hypothesized that: (1) gradual introduction to warming and acidification conditions followed by acclimation would enhance tolerance to these stressors as seen in high survivorship (2) increased temperature and acidification would interact to affect metabolic rate, feeding rate and ammonia excretion rate (3) physiological adjustments to warming and acidification would be evident over acclimation time and (4) that there would be interactions between parental acclimation environment and offspring metabolic rate. Finally, as warming trends in the region are linked to increased disease in H. erythrogramma and that +4°C is close to the thermal tolerance of this species (Sweet et al., 2016; Harianto et al., 2018), we expected to see deleterious effects compounded over time at the upper level of warming used (+3°C).
Materials and Methods
Specimen Collection and Experimental Treatments
Heliocidaris erythrogramma (44.15 ± 3.25 mm test diameter, n = 100) were collected from the subtidal (2–3 m depth) and selected for size at low tide, at Milk Beach (33°51′23.3″S, 151°16′1.1″E) and Bottle and Glass Point (33°50′52.7″S, 151°16′12.4″E) in June 2014. Sea surface temperature (SST) at the time was 15.3°C. The urchins were transported to the Sydney Institute of Marine Science (SIMS) in Chowder Bay and were held in aquaria (80 L) supplied with ambient flow-through, filtered sea water (FSW, 70 μm, 1.5 L min–1). After 1 week, they were randomly allocated into six treatments, based on three temperature profiles (ambient +0°C, elevated +2°C and +3°C, adjusted weekly according to the mean SST profile determined from 5 years of in situ data (Supplementary Figure 1) and two constant pH levels (ambient: pHT 8.0, low: pHT 7.6). For each treatment, we used three replicate tanks (28 L) with 10 urchins per tank. The flow-through conditions ensured that the entire volume of the tanks was turned over 15 times per day.
Experiments were conducted in a controlled temperature room for precise adjustments of water temperature and pH in the flow through delivery system. Room lighting was adjusted weekly to reflect the diurnal sunrise/sunset cycle using a digital 24-h timer. Adjustments to water parameters were made in header tanks before the water was channeled to treatment tanks with the high flow-through rate reducing tank effects. Each header tank was supplied with FSW (20 μm) using a thermocouple-solenoid feedback system that mixed warm (25°C) and cold (14.5°C) filtered FSW (20 μm) in a 2 L mixing chamber to supply temperature-controlled water consistently. Each header tank was also equipped with a heater (75 W, EHEIM GmbH & Co KG, Germany) attached to a temperature controller (model 7028/3, TUNZE Aqraientechnik GmbH, Germany) as a second level of temperature control. Sea water pH was maintained using a mixed CO2 system, where a thermally compensated, low-flow controller valve (Parker Hannifin, OH, United States) and a proportional–integral–derivative controller, updated every 10 s, were used to precisely inject food-grade CO2 (BOC, Australia) into ambient air that had been scrubbed of CO2. The CO2-mix was bubbled vigorously and continuously into all header tanks using ceramic diffusers. The header tanks, diffusers and treatment tanks were checked, changed and cleaned frequently.
Increased temperature and acidification levels were changed gradually over 7 weeks and no mortality occurred. Temperature was increased at a rate of 1°C every 6 days until target temperatures were achieved. Sea water pH was lowered at a rate of −0.1 pHT units every week. These manipulations were performed on a staggered schedule so that all treatments achieved target conditions in the same week (Figure 1A). After 7 weeks the treatment temperatures were (mean ± SD) ambient (15.6 ± 0.4°C), +2°C (17.6 ± 0.4°C) and +3°C (18.6 ± 0.3°C). During the acclimation period, temperature levels were regulated to achieve the mean weekly temperature over the same period (Figure 1A) determined from reference data collected from loggers deployed in the H. erythrogramma habitat (2009–2014) (Supplementary Figure 1). Treatment temperatures were generally kept within ±0.4°C (max, min) of reference temperatures (see Supplementary Table 2), while mean measured pH values over the same period were pHT 8.0 ± 0.02 SD and pHT 7.64 ± 0.09 SD. Treatment temperatures and photoperiod followed the natural change that occurs from winter to summer. During the period of gonad growth, around which this study was scheduled, day length changes from 10 h in July to 14 h in December (data from Sydney Observatory). Because temperature affects CO2 solubility and temperatures were changing every week, the system maintained constant pHT (not CO2 ppm) within each treatment (Figure 1B). With the pH encountered in the subtidal environment at Chowder Bay, there is little seasonal change, with most variation associated with diurnal flux (range pHT 7.9–8.07; Runcie et al., 2018). For the experiment we used pHT 7.6 as representative of a projected pH scenario of a decrease in ocean pH by up to 0.4 pH units by 2100 (Collins et al., 2013).
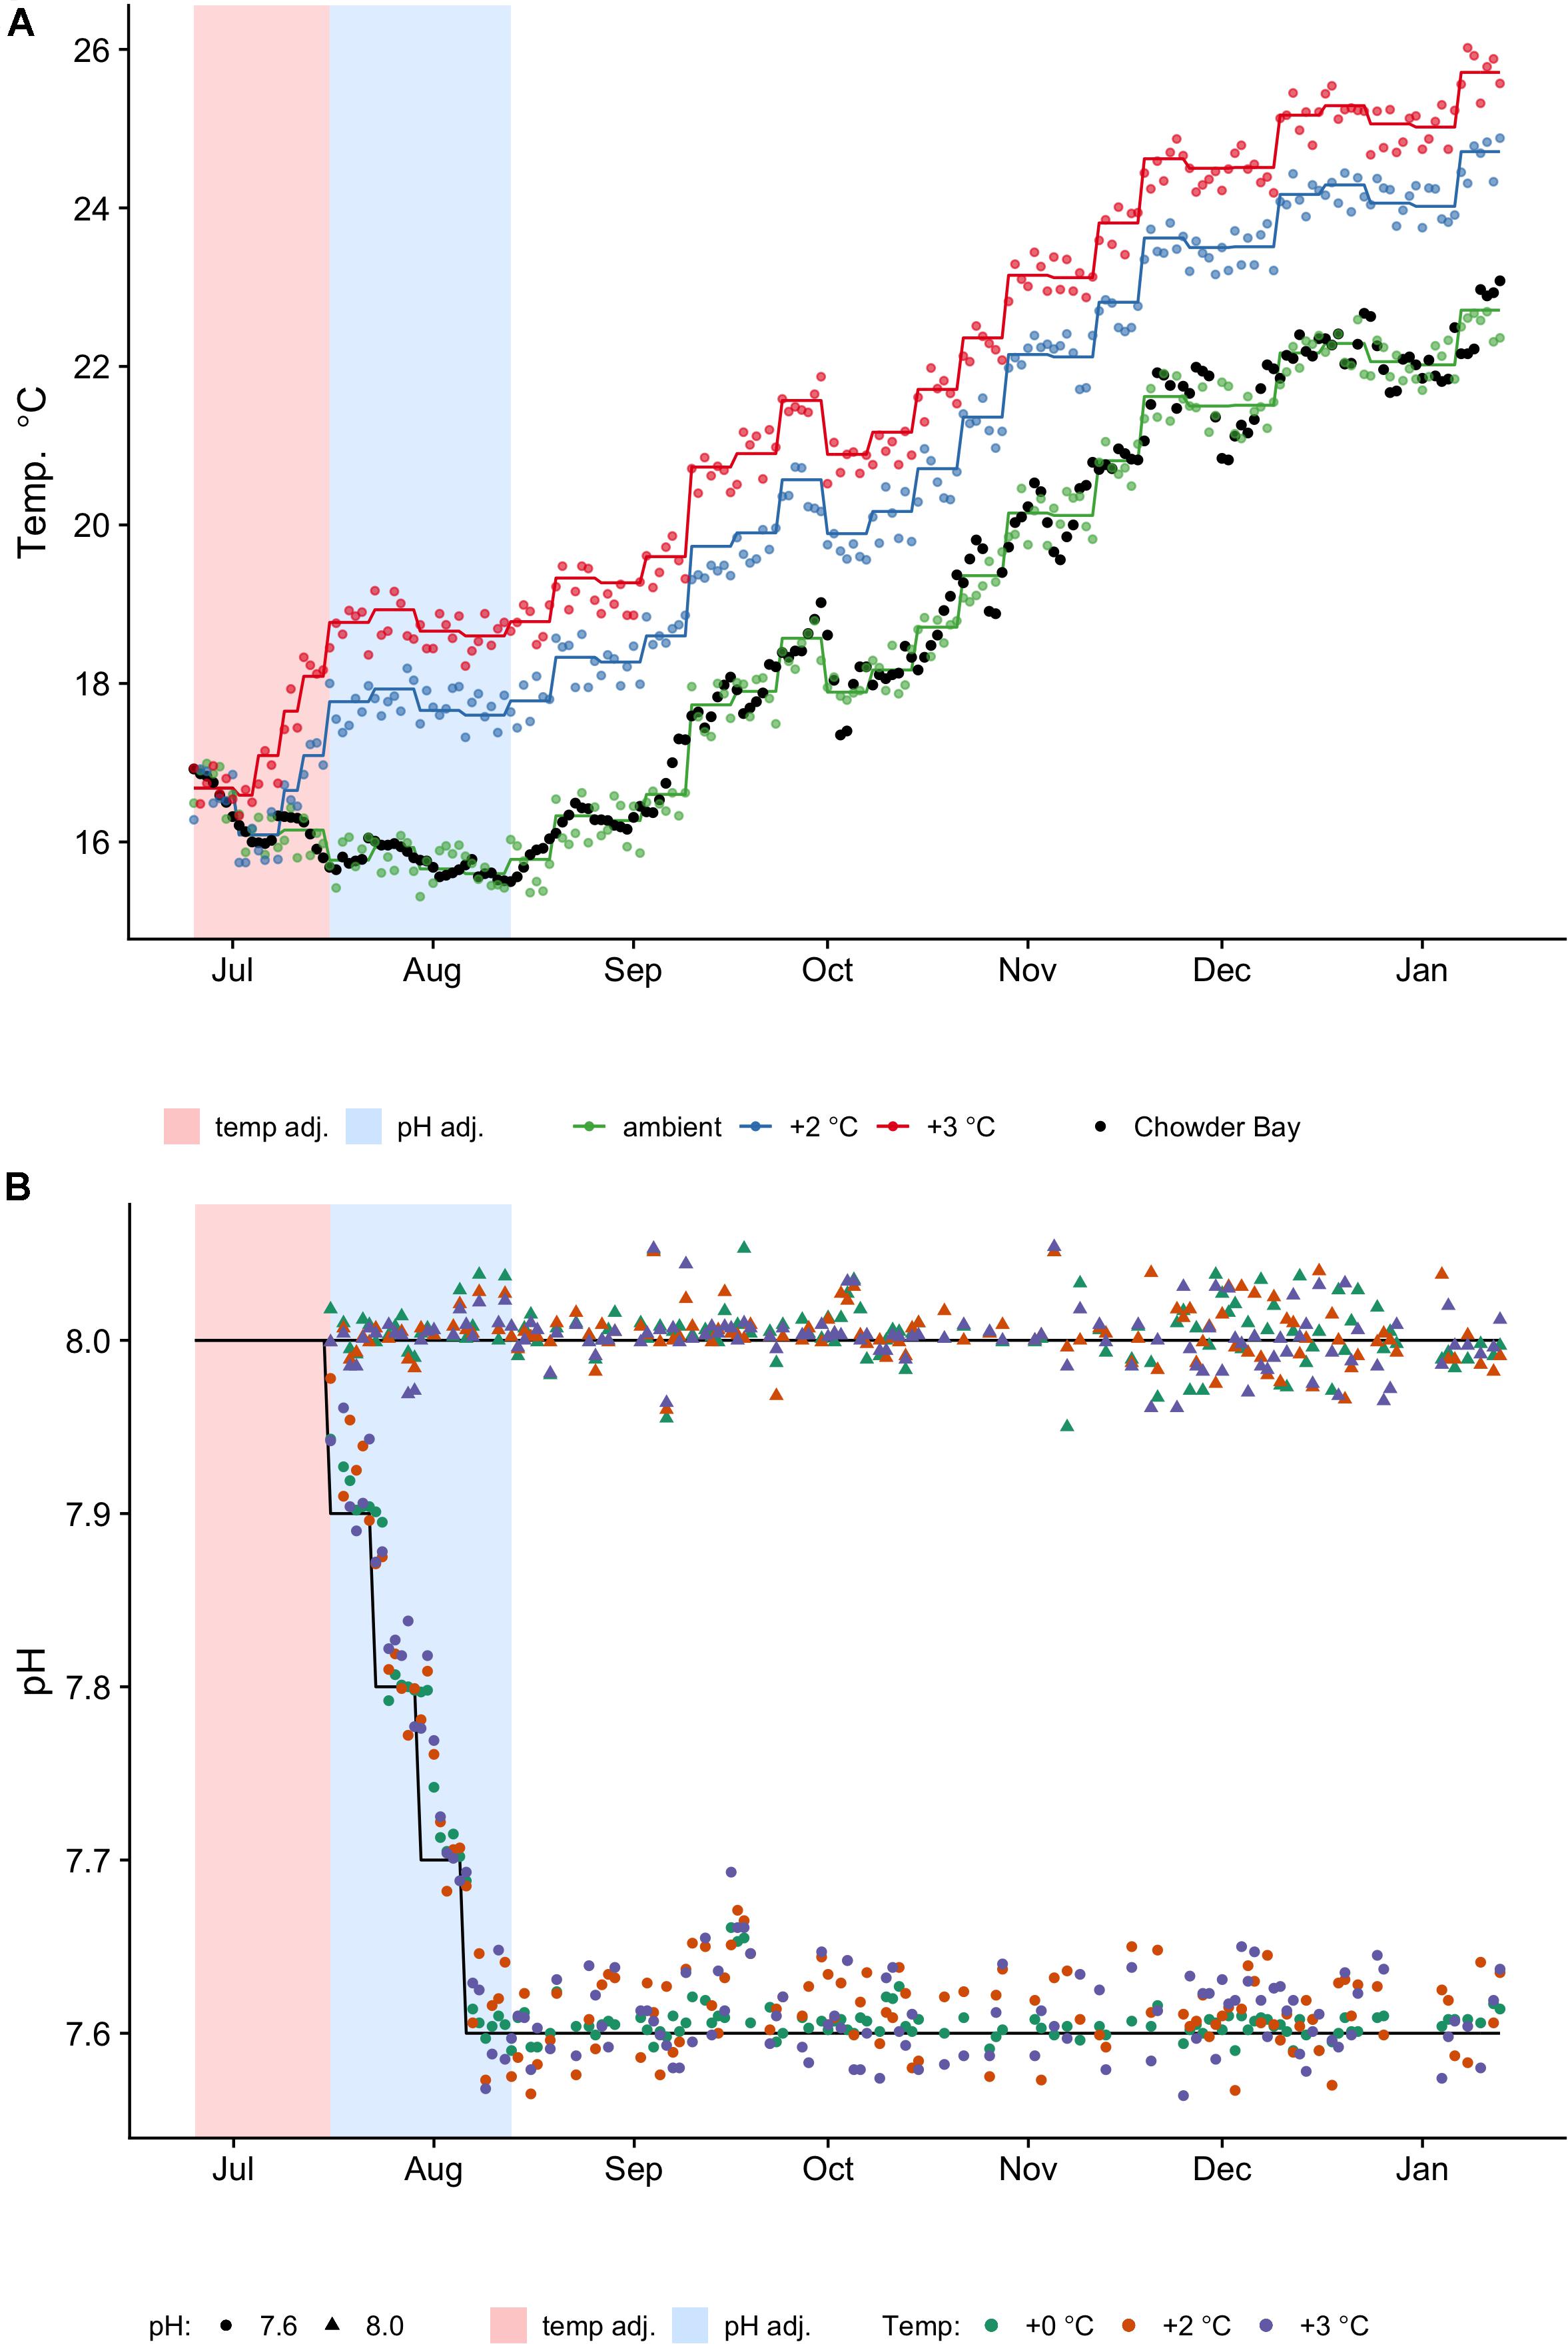
Figure 1. Temperature (A) and pH (B) profiles and measurements taken daily. One replicate tank for every treatment was selected at random for measurements. Shaded regions are the pre-acclimation adjustment periods for temperature (pink) and pH (blue), respectively. (A) Colored lines represent the planned temperature profiles (ambient, +2°C, +3°C), which change every week and the dots represent actual temperatures measured (see also Supplementary Table 1). Black dots are the reference temperatures collected from in situ loggers deployed in Chowder Bay from 2009 to 2014, averaged by day (see Supplementary Figure 1). (B) Black lines represent the reference profiles of constant pHT levels (8.0, 7.6) and initial adjustments. Actual measurements are indicated by shapes (triangle: 8.0; circle: 7.6). The actual mean measured pH values were pHT 8.0 (SD = 0.02, n = 378) and pHT 7.64 (SD = 0.09, n = 384). Colors represent the temperature group (see legend).
Temperature was logged using PT1000 resistance temperature detectors attached to a Graphtec multifunction logger (model GL840, Graphtec Corporation). Sea water pH was measured every 1–2 days to assess how acclimation treatments were tracking (Figure 1B) and was determined spectrophotometrically on the total scale with a custom-built pH sampling system connected to an Ocean Optics USB4000+ fiber optic spectrometer, using m-Cresol dye indicator (Acros Argonics, catalog number 110585000, Lot A0321770) and calculated according to Liu et al. (2011). The measurements were calibrated to certified reference material (CRM) for CO2 in sea water (Batch 139) following SOP 6b in Dickson et al. (2007). In addition, temperature, pH and salinity of the tanks across treatments were independently checked every 1–2 days using a Canter 376 RTD thermometer, a Vernier LabQuest 2 salinity sensor and a WTW Multi 3420 pH probe, respectively, to test for consistent conditions. The pH probe was calibrated using high precision buffers (pH 4, 7 and 10, ProSciTech).
For analysis of total alkalinity (AT), water samples (330 mL) were taken randomly from experimental tanks every 2 to 3 weeks (n = 36 samples across all treatments). AT was determined by potentiometric titration (907 Titrando, Metrohm), calibrated using sea water CRMs (Batch 139, Dickson et al., 2007). Carbonate chemistry parameters pCO2, calcite and aragonite saturation states ΩCa and ΩAr were calculated using the “seacarb” package in R (Gattuso et al., 2020) using the constants for K1 and K2 from Lueker et al. (2000), the constant for Kf from Perez and Fraga (1987) and the constant for Ks from Dickson (1990), as recommended by Dickson et al. (2007) (Supplementary Table 1).
Animal Maintenance and Monitoring
The sea urchins were fed on a mixed diet of Ecklonia radiata and Sargassum spp. suspended in kelp-based agar (MSC CO, Kyeongnam, Korea). To prepare the food, the algae were rinsed in fresh water, dried at 50°C for 48 h, and then ground into fine powder and mixed with agar powder (1:4 by weight). This was then mixed with FSW (20 μm) (1:10 by weight) at ∼80°C. The agar was left to cool and solidify for 45 min and then cut into 1 to 2 cm2 cubes. The urchins were fed twice a week by placing three to four cubes on top of each individual ensuring that each animal received the same amount of food in excess during the experimental period. They were checked daily for survival and condition (e.g., spine loss, bald patch disease, see Sweet et al., 2016) over 22 weeks (155 days). Dead individuals were removed immediately. Uneaten food and feces were removed every 2 days.
As the experimental period coincided with the time when local H. erythrogramma populations undergo gonad development to spawning, and we employed a seasonal temperature and daylength cycle in our experiments, we expected spontaneous gamete release to occur. During the spawning season, which starts in October and would be expected to continue through the experimental period (Laegdsgaard et al., 1991), the tanks were monitored for released eggs. Spawning is readily detected as H. erythrogramma releases large, buoyant eggs that become trapped at the water surface. As appears typical for H. erythrogramma (Byrne, pers. obs.), spawning occurred at night in all treatments. We could not determine how many individuals spawned and so the observations were recorded as an indication that the animals were close to their natural physiological/reproductive cycle but were not statistically analyzed.
Metabolic Rate
Routine weight-specific metabolic rate, MO2 was estimated by intermittent-flow respirometry at two time-points (week 4 and 12), using a random sample of 10 specimens from tanks across each treatment that were not fed for 5 days prior to measurement. They were transferred individually into 1 L respirometry chambers in individual water baths. Each chamber contained an oxygen sensor spot (SP-PSt3-NAU, PreSens GmbH, Germany) for the detection of dissolved oxygen concentration using an external multi-channel sensor (OXY-10-mini, PreSens). A magnetic stirrer ensured even mixing of water. The specimens were allowed to adjust to the chambers under flow-through conditions for 30 min prior to respirometry measures. At week 4, the temperatures were 16.6, 18.6, and 19.6°C and at week 12, were 20.7, 22.7 and 23.7°C for the ambient, +2 and +3°C treatments, respectively.
To measure oxygen uptake, the chambers were sealed, and dissolved oxygen (DO, mgO2 L–1) was measured every 10 s until a 10% decrease in DO was recorded. The chamber was then flushed, and the measurement repeated. Background respiration was determined by recording FSW-only blanks (n = 8) to correct the recordings for background respiration and instrument drift. At the end of each measurement, sea water weight was calculated by deducting chamber, stir bar and urchin wet weights from the total weight of the chamber, and then converted to volume using sea water density estimated from current temperature, salinity and barometric air pressure (Fofonoff and Millard, 1983).
Weight-specific MO2 (mgO2 L–1 h–1 kg–1) was calculated manually using the R package ‘respR’ (Harianto et al., 2019) and the equation (Lighton, 2008):
where ΔO2 is the linear regression of O2 concentration over time (mg L–1 h–1), V is the volume of the sea water available (L) and W is the wet weight of the urchin (kg).
Ammonia Excretion
Ammonia excretion rate was determined at 12 weeks after respiration experiments. Ten specimens were randomly selected from each treatment and transferred into 1 L chambers supplied with flow-through FSW at the same treatment conditions and left to rest for at least 45 min. Initial water samples were carefully collected (50 mL, 0,22 μm) and frozen. The chambers were then sealed and left in the water baths for 3 h before final water samples were collected. Background ammonia levels were determined by repeating the procedure without a specimen (n = 3 treatment–1). The water samples were immediately frozen and stored in the dark until they were analyzed spectrophotometrically (within 10 days) for total ammonia (Parsons et al., 1984). Spectrophotometric readings were obtained at 640 nm on a microplate reader (CLARIOstar Microplate Reader, BMG LABTECH, Offenburg, Germany) and calibrated using daily blanks and a standard ammonium solution. Ammonia excretion rate (U, μg kg–1 h–1) was calculated according to the equation:
where NC is the concentration of ammonia (μg at–N L–1), W is the weight of the specimen in kg and T is the time elapsed in hours. Ammonia concentration (NC) is determined using the equation:
where Es and Eb are the standard and corrected spectrophotometric extinction values of the blue indophenol color formed with ammonia, respectively, and V is the volume of the chamber (L). The precision of this technique (±0.1 μg at–N L–1) was determined using the equation (Parsons et al., 1984):
where h is the precision at the 1 μg at–N L–1 level, and n is the number of determinations.
Feeding Rate and Assimilation Efficiency
Feeding trials were conducted in week 13 where the temperatures were 20.1, 22.1, and 23.1°C for the ambient, +2 and +3°C treatments, respectively. Ten random specimens from each treatment were transferred into individual tanks (4 L) supplied with flow-through FSW (6 L h1) at the same treatment conditions. They were starved for 6 days in their new environments before feeding trials commenced, using the same agar-based food mixture used in routine feeding. The initial wet weight of the diet was determined, and the food was added to each tank in excess. Food-only autogenic controls were used to determine background changes in agar composition (n = 24).
After 48 h, unconsumed food was carefully collected and oven dried at 80°C for 48 h, and then reweighed. Fecal pellets were also collected for calculations of assimilation efficiency (see below). The specimens were removed from the tanks, blotted briefly with a paper towel, and weighed. To convert the initial wet weight (Wwet) of the food to their dry-weight equivalents, the wet:dry ratio of the food was determined in a regression analysis of wet to dry weights (W) (n = 60, r2 = 0.82, p < 0.01), and determined as:
Feeding rate (C, mg day–1 kg–1), was calculated by subtracting the final dry weight (WT1) from the initial dry weight (WT0), with adjustments for background changes and specimen weight (Wsp) and adjusted by time (T):
Fecal samples were dried at 60°C for 48 h and weighed. These samples were then ashed in a muffle furnace at 500°C for 2–3 h and re-weighed to determine their ash-free dry weight (AFDW). Assimilation efficiency (A) was calculated using the Conover method (Conover, 1966):
where F and E denote the AFDW:dry weight fraction measured in the diet and the feces, respectively. All weights were determined using the same analytical balance accurate to 0.0001 g.
Scope for Growth (SfG) Parameters
To explore the influence of temperature and pH stressors on the growth potential of H. erythrogramma, we constructed an SfG model using data from respirometry and ammonia analyses (week 12) and feeding trials (week 13). Details of parameter data, coding and analysis are provided in the Supplementary Data. Oxygen consumption was converted to energy equivalent values to calculate the energy lost in respiration per day (RE) using a conversion factor of 14.14 J mg–1 O2 (Elliott and Davison, 1975). A conversion factor of 0.025 J g–1 ammonia (Elliott and Davison, 1975) was used to estimate the energy equivalent of the energy lost due to ammonia excretion per day (UE). The energy available from food (CE) was calculated with bomb-calorimetry using an automatic adiabatic bomb calorimeter (Gallenkamp, London). The calorimeter was calibrated for the heat of combustion of 1 g of benzoic acid (26.493 kJ g–1) to determine the approximate effective heat capacity of both the bomb chamber and the mass of the water within the calorimeter chamber (CS Mean 10.27 ± 0.07 kJ°C, n = 3).
The diet was dried in an oven at 60°C to remove moisture. Approximately 1 g of the diet was used each time to determine gross energy by combustion and an average value (12.67 ± 0.25 S.D. kJ g–1, n = 6) was obtained using the equation:
where ΔT (°C) is the change in temperature – detected using a Beckmann thermometer – between the initial and post-combustion of the sample, CS is the effective heat capacity of the system (bomb chamber and water), and WS is the weight of the diet sample (g).
To calculate scope for growth (SfG) we used the equation adapted from Winberg (1960):
where CE is the energy obtained from diets, A is the assimilation efficiency, RE is the energy lost in respiration and UE is the energy lost due to ammonia excretion. All energy-related units are in kJ g–1 day–1, while assimilation efficiency is a proportion.
Spawning and Offspring Rearing
The gametes of H. erythrogramma that had been acclimated to two temperature (ambient, +2°C) and two pH levels (pHT 8.0, pHT 7.6) were used to generate offspring. There were insufficient spawners in the +3°C treatments to use for this experiment. The urchins were induced to spawn by injection of 0.5 ml of 0 M KCl. Although they had previously spawned during acclimation (see below), H. erythrogramma has continuous gamete production over the breeding period (Laegdsgaard et al., 1991). Gametes from at least three females and five males from each parental acclimation group were pooled and 500–1000 of the pooled eggs were placed in custom-built plankton kreisels, 100 ml volume (Supplementary Figure 2) in a controlled temperature room. There were three kreisels for each of 16 treatments, four temperatures (18°C, 20°C, 22°C, 24°C), two parental temperature conditions (ambient, +2°C) and the two parental pH levels (pHT 8.0, pHT 7.6) established as above and in a fully factorial design in a flow-through experimental water delivery system, with a header tank system similar to the adult experiment, with full turnover of water every 2 min to maintain conditions and circulation of larvae. The four temperatures reflect the range that the larvae encounter during the breeding season and recent warm summers and also included the thermal environment of the parents (21–24°C range). The eggs were fertilized (∼104 sperm mL–1) and fertilization was checked after 5 min by examining counts of 100 randomly selected eggs to ensure >90% fertilization. The flow-through system (50 mL min–1) was turned on to start the flow of experimental water and to wash away excess sperm. The kreisels had a 50 μm mesh covered outflow ports allowing constant flow of treatment water and gentle agitation of the embryos.
Heliocidaris erythrogramma has rapid development and by day 3.5–4 the larvae in all treatments were competent to settle as they had developed the five primary podia that are used to settle on the substrate. By day 4.5–5 most larvae had settled on the surface of the kreisels and completed metamorphosis to the juvenile which involves resorption of the larval tissue as juvenile structures develop. We did not document larval development as previous studies have shown that H. erythrogramma can develop normally in the temperature and pH conditions used, albeit with differential mortality of sensitive genotypes (Byrne et al., 2011a). Our primary interest was to span metamorphosis to the F1 advanced juveniles at 14 days old. It was not possible to follow mortality as dead embryos and larvae disintegrate quickly and were washed out of the system. Temperature and pH were monitored daily in kreisels across treatments (Supplementary Table 3). For AT, sea water samples (330 mL) were taken randomly from experimental treatments three times over the 2 weeks. Other carbonate chemistry parameters (Supplementary Table 3) were determined as described above.
Metabolic rate, MO2 of the juveniles was estimated using constant volume respirometry on day 14, 9–10 days after settlement. The respirometry chambers were 2 ml borosilicate glass vials with silicon septum lids (Thomas Scientific, United States). Oxygen concentration within the glass vials was measured using needle microsensors (PreSens) attached to 4 and 10 channel meters (OXY-10 and OXY-4 micro, PreSens). From each kreisel 50 juveniles were randomly collected and placed in the respirometry chamber filled with 0.22 μm FSW at the same treatment conditions they were reared in. Background respiration was measured in 4–6 vials containing only treatment water, measured separately for each group of juveniles. Thus, we had 50 juveniles in each of the three replicates for 16 treatments. Respirometry experiments ran for 12–15 h in the dark and oxygen concentrations did not drop below 85% air saturation at the end of the measurements. Temperatures were kept constant using water baths. The juveniles were photographed using an Olympus microscope and digital camera and test diameter was measured using ImageJ (NIH). Metabolic rates were scaled to the average test diameter per kreisel (pmol O2 h–1 juvenile–1 μm–1).
Statistical Analyses
Analyses were performed in R (v 3.4.5). The survival time for each specimen was determined by the number of days from time zero (when the acclimation period started) to the end of the experiment, a total period of 155 days. Survival data were analyzed using Kaplan–Meier log-rank analysis, with right censoring, to determine whether temperature and pH affect survival time. In addition, a Cox proportional hazards model (Cox, 1972) was fitted using survival as a function of temperature and pH to assess the effects of each stressor on mortality risk. The fitted Cox regression met the assumption of proportional hazards (Schoenfeld residual tests, Grambsch and Therneau, 1994; p = 0.673). As no interactions were found between temperature and pH (Cox proportional hazards regression, z = 0.61, df = 3, p = 0.54), the analysis was repeated with only the main effects tested. Post hoc tests for the differences between treatments were determined using pairwise tests of significance corrected using the Benjamini–Hochberg (BH) false discovery rate method (Benjamini and Hochberg, 1995).
Metabolic rate data were first analyzed by constructing a generalized linear mixed model of metabolic rate as a function of relative temperature (ambient, +2°C, +3°C) and pH (8.0, 7.6). To avoid the potential effect of survival bias, the two measurement time points (week 4 and 12) were analyzed separately. Feeding rate and ammonia excretion rate data were also analyzed as above with the response variable as a function of temperature and pH. For all analyses, the nested effects of tank, temperature within tank and pH within tank were added as a random parameter in the models, and then tested using a likelihood ratio test on random effects, which were all not significant (p ≥ 0.9 for all tests). To test for interactions, the nested terms were excluded from the final linear models to prevent confounding (Schielzeth and Nakagawa, 2013). ANOVA was performed on the linear models using Type III sums of squares when interactions were present, or Type II sums of squares when they were not (Langsrud, 2003).
For metabolic rate data, there were no statistically significant interactions between temperature and pH at 4 weeks (F2,54 = 0.2, p = 0.93), thus the data were re-analyzed to test for main effects only. For feeding and ammonia excretion rate data, there were no statistically significant interactions between temperature and pH (F2,47 = 1.07, p = 0.35 and F2,54 = 2.31, p = 0.11, respectively) and so the interaction term was also excluded before ANOVA was performed on each model. Prior to modeling tests, data were checked visually and statistically (if necessary) for normality using the Shapiro–Wilk test of normality (Royston, 1983), and homogeneity of variances using the Fligner–Killeen Test (Conover et al., 1981). Where treatment conditions were indicated to be significantly different, estimated marginal means (EMM, i.e., Least-Squares Means) were used to develop linear estimates, and then analyzed using the post hoc Tukey Highest Significant Difference (HSD) test to identify the significance between temperature-pH combinations. Significance was determined at p ≤ 0.05 for all tests.
For SfG, as the parameters used to construct the model were obtained from different individual sea urchins (i.e., the urchins were not tagged) and so the metric was calculated using treatment-averaged parameters (thus, n = 1), as in previous sea urchin studies (Stumpp et al., 2011; Delorme and Sewell, 2016). We constructed the SfG model using all the physiological parameter data to provide an overall indicative assessment of the impacts of the acclimation treatments on H. erythrogramma, but statistical analyses were not performed.
Interactions between parental treatments and offspring metabolic rate and size data were compared using analysis of covariance (ANCOVA). Parental temperature and pH were categorical variables, offspring temperature and pH were continuous covariates, and all possible interactions between all variables were included. The random effect of kreisel was tested using the ‘lmer()’ function in the ‘lme4’ package, which was not significant (general linear mixed-effects model, p > 0.05). Therefore, ANCOVA was performed using the ‘car’ package, with type III error to test for main effects and the interaction terms. For metabolic rate, there were no significant three-way interactions (p < 0.05), thus the terms were removed and the model reanalyzed. For growth, there were no two or three-way interactions, thus the model was analyzed for main effects only using type II error.
Results
Survival
There was a significant effect of treatment on survival (logrank test, χ2 = 61.23, df = 3, p < 0.001) (Figure 2). As single stressors, the +2°C and decreased pH treatments (pHT 7.6) did not affect survival (>80% survival at 22 weeks). The +3°C, treatments resulted in decreased survival regardless of pH level (p < 0.001, hazard ratio: 17.2, 95% CI: 5.27–56.25). These treatments intersected the median survival threshold after 14–20 weeks (Figure 2). Cox proportional hazards analysis showed a greater risk of mortality in urchins exposed to increased temperature compared with decreased pH (hazard ratios of 3.38 and 0.47, respectively). Post hoc results (pairwise tests, BH-corrected) showed that urchins acclimated to +3°C had significantly lower survival compared to all other treatments (p < 0.01 for all pairwise combinations), with no significant differences in all other pairwise comparisons. At week 22, urchins acclimated to +3°C and pH 7.6 had the lowest survival at 33% (Figure 2).
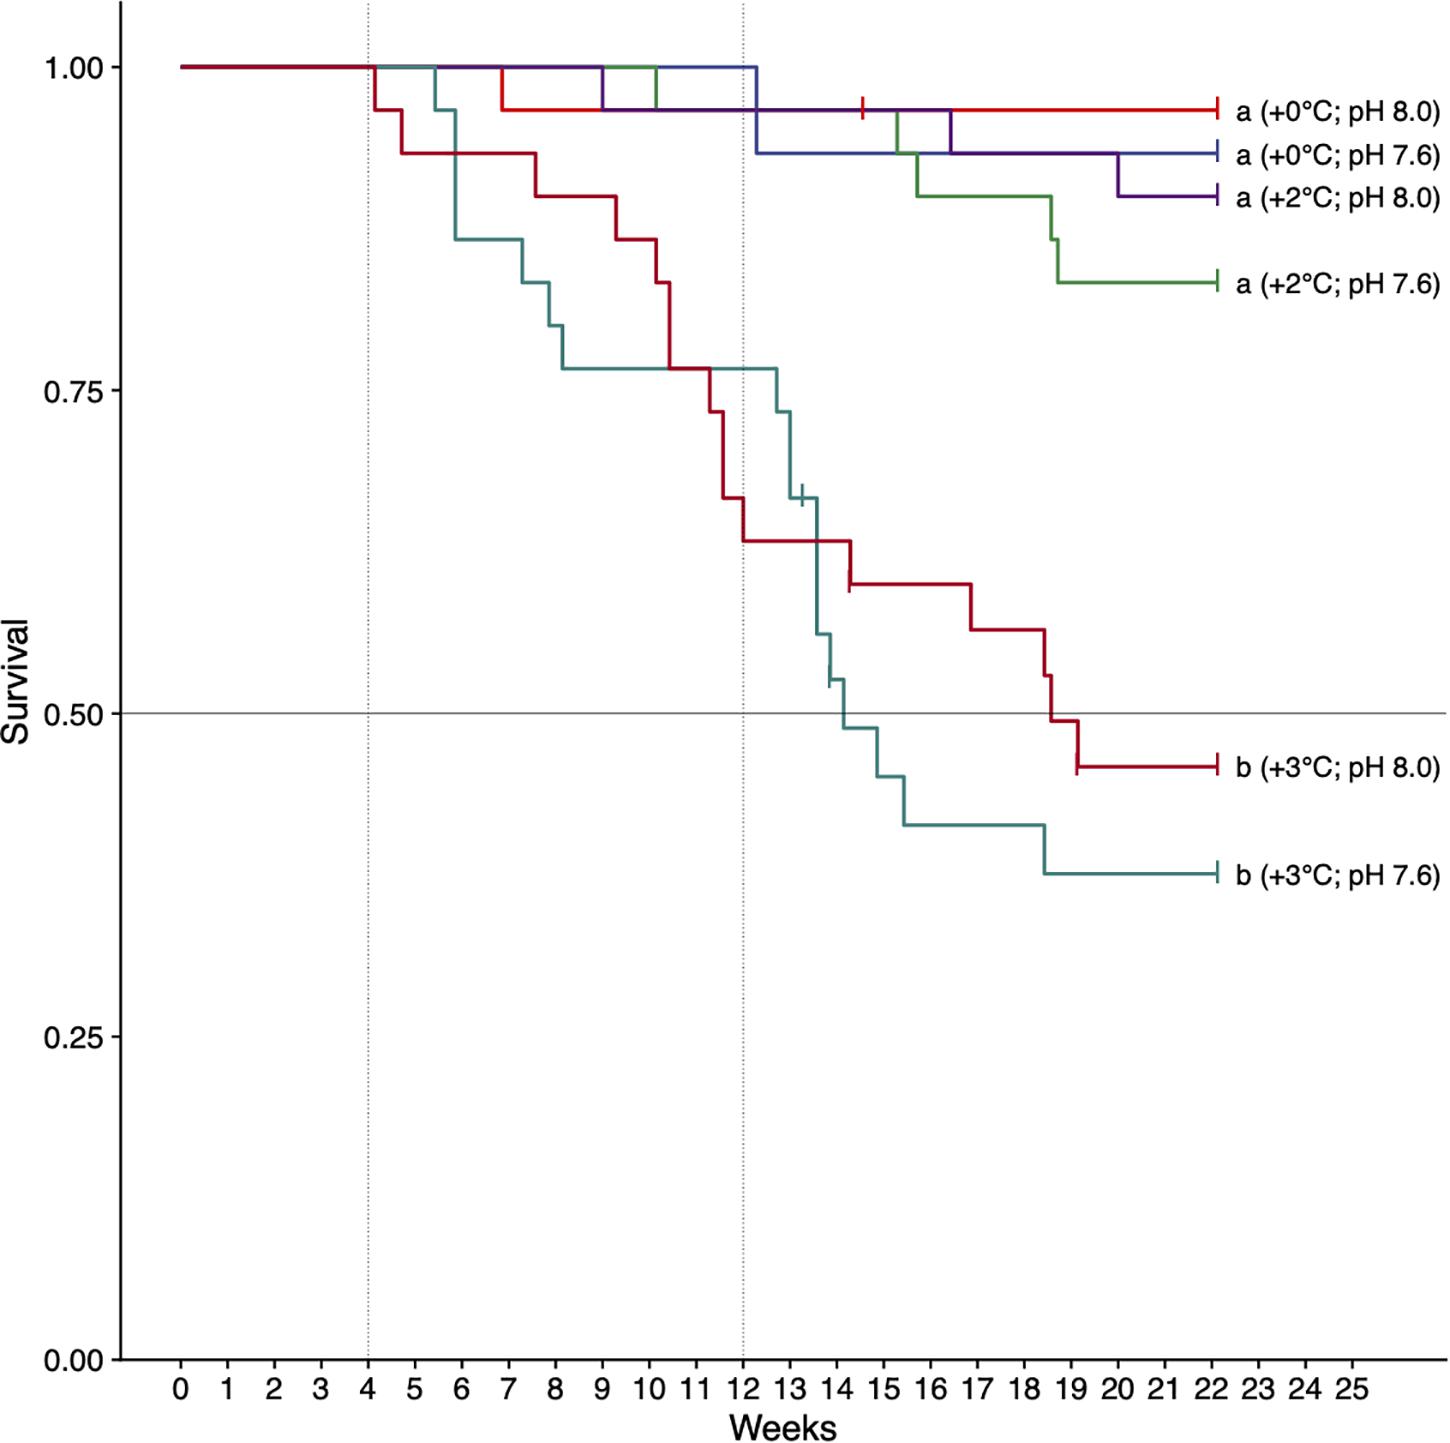
Figure 2. Survival of H. erythrogramma acclimated to three temperature (ambient, +2°C, +3°C) and two pHT (8.0, 7.6) levels in six treatments. Letters indicate treatments that differed (pairwise tests, with Benjamini–Hochberg [BH] false discovery rate corrections, p < 0.05). The horizontal line is the median survival threshold; vertical lines show times of data collection at 4 and 12 weeks of acclimation.
Metabolic Rate
After 4 weeks of acclimation, the metabolic rate of H. erythrogramma was significantly influenced by increased temperature (F2,54 = 15.9, p < 0.001) and decreased pH (F1,54 = 23.4, p < 0.001) with no interaction between stressors (Table 1). Generally, metabolic rate increased by up to 35% with warming and 25% with reduced pH. At week 4, the combined effects of warming and acidification were additive, increasing metabolic rate by up to 56% (Figure 3A). Post hoc comparisons of estimated marginal means using Tukey’s HSD showed that 10 of 15 pairwise comparisons differed significantly as shown in the pairwise-value plot (Supplementary Figure 3).
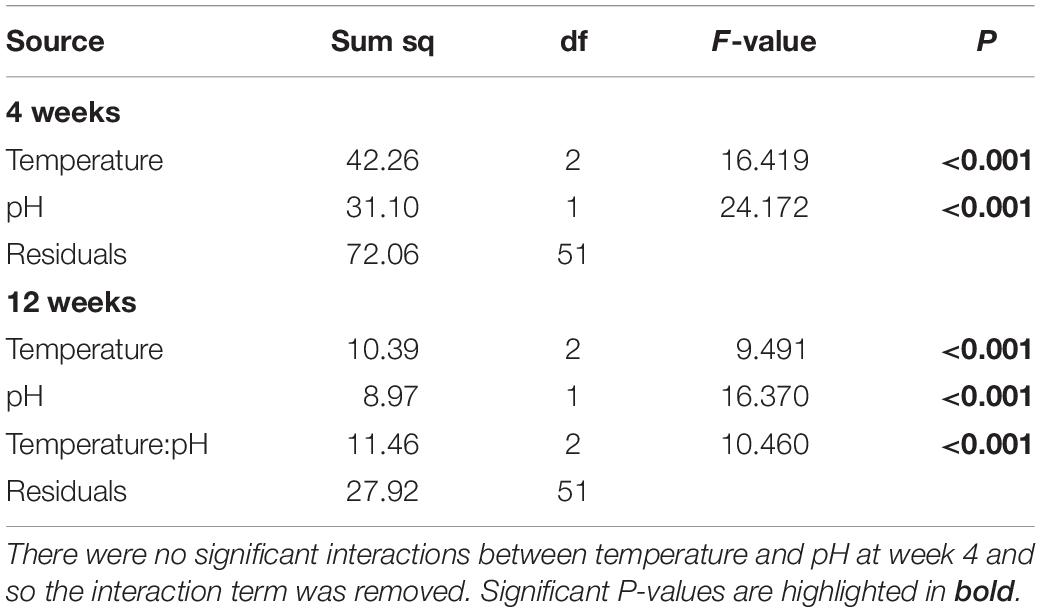
Table 1. Analysis of variance on the effects of increased temperature and decreased pH on the metabolic rate data from Heliocidaris erythrogramma after acclimation in three temperature (ambient, +2°C, +3°C) and two pHT (8.0, 7.6) treatments analyzed separately after 4 and 12-weeks.
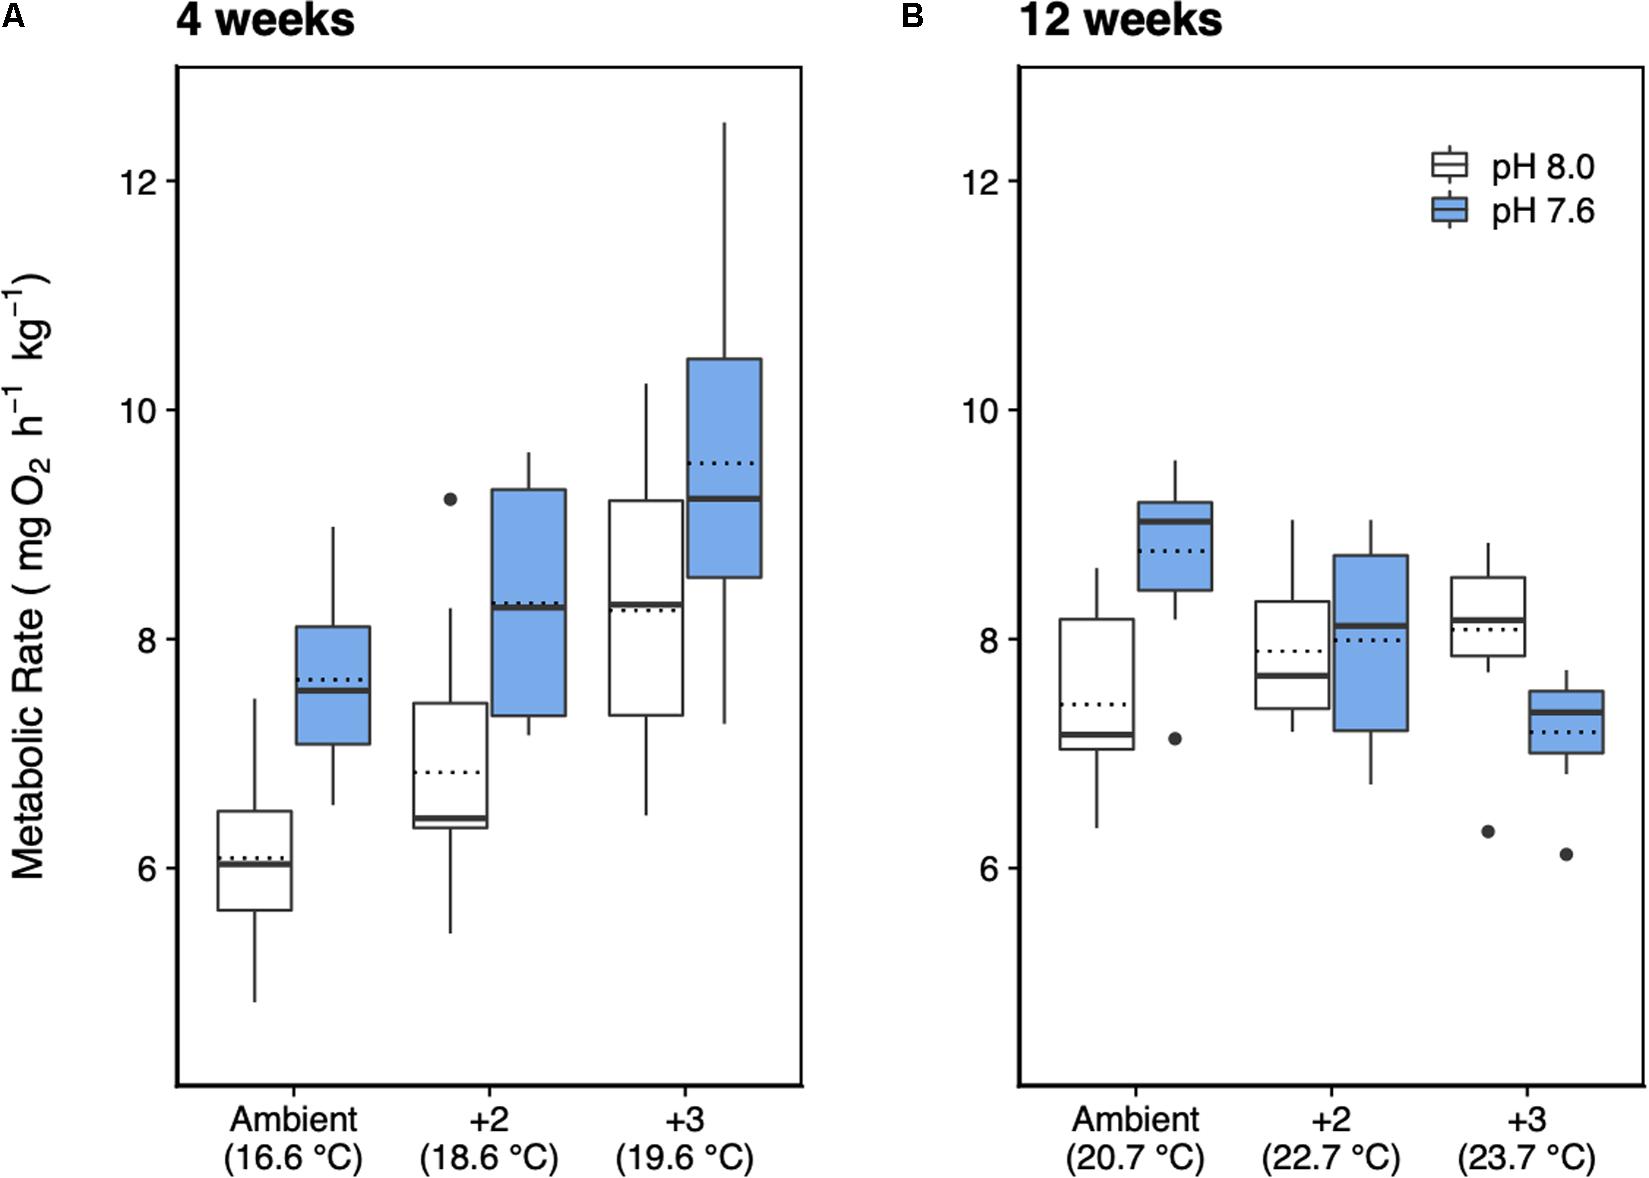
Figure 3. Metabolic rate of H. erythrogramma acclimated for (A) 4 and (B) 12 weeks in three temperature (ambient, +2°C, +3°C) and two pHT (white: 8.0, blue: 7.6) levels in six treatments. The top and bottom of the boxes represent the interquartile range (IQR) between the 25th and 75th percentile (Q1 and Q3, respectively). The horizontal line represents the median (Q2), the horizontal dotted line represents the mean, and the vertical lines (whiskers) represent the range of the data computed as follows: less than Q1 – 1.5 IQR (bottom whisker); greater than Q3 + 1.5 IQR (top whisker).
At 12 weeks of acclimation, metabolic rate responses were significantly affected by warming (F2,51 = 9.49, p < 0.001) and acidification (F1,51 = 16.37, p < 0.001), with a significant interaction between these stressors (F2,51 = 10.5, p < 0.001; Table 1) resulting in an antagonistic effect on metabolic rate (Figure 3B). Thus, at week 12 warming and decreased pH elevated metabolic rate by 9% and 18%, respectively, and in combination reduced metabolic rate by up to 3%. Post hoc comparisons of estimated marginal means using Tukey’s HSD showed that two of 15 pairwise comparisons differed significantly (Supplementary Figure 3). At pH 7.6, the +0°C and +3°C groups differed significantly (p < 0.001), and at +0°C, the pH 8.0 and pH 7.6 groups differed significantly (p < 0.01). No other pairwise differences were statistically significant (Supplementary Figure 3).
Feeding and Ammonia Excretion Rates
Feeding rate was significantly influenced by increased temperature (F2,49 = 13.5, p < 0.001), but not pH, with no interaction between temperature and pH (Table 2 and Figure 4A). Tukey’s HSD pairwise comparisons showed that feeding tended to decrease with increasing temperature, and that +2°C and +3°C decreased feeding at pHT 7.6 (p = 0.001 and p = 0.008, respectively), but not at pHT 8.0.
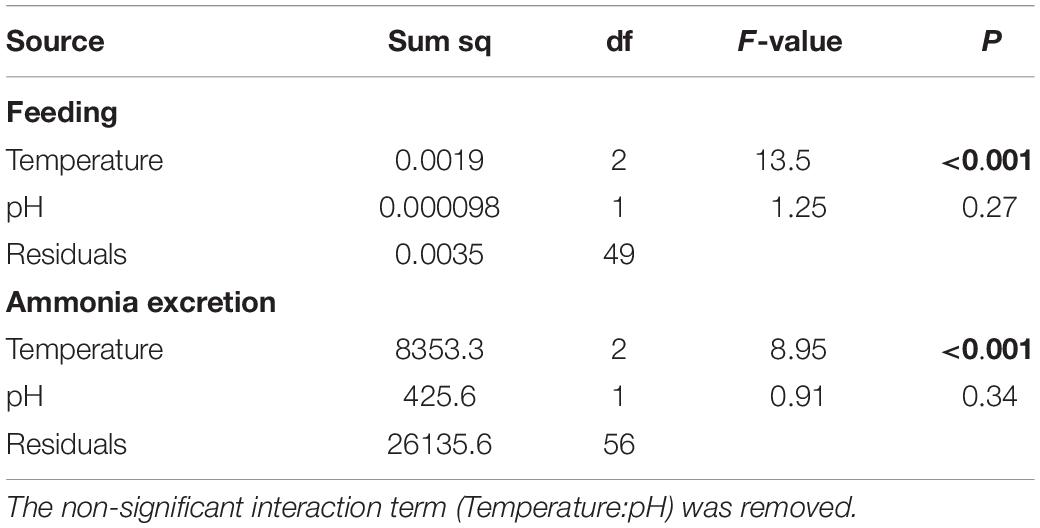
Table 2. Analysis of variance on the effects of increased temperature and decreased pH on feeding and ammonia excretion rate data from Heliocidaris erythrogramma after 12 weeks acclimation in three temperature (ambient, +2°C, +3°C) and two pHT (8.0, 7.6) treatments.
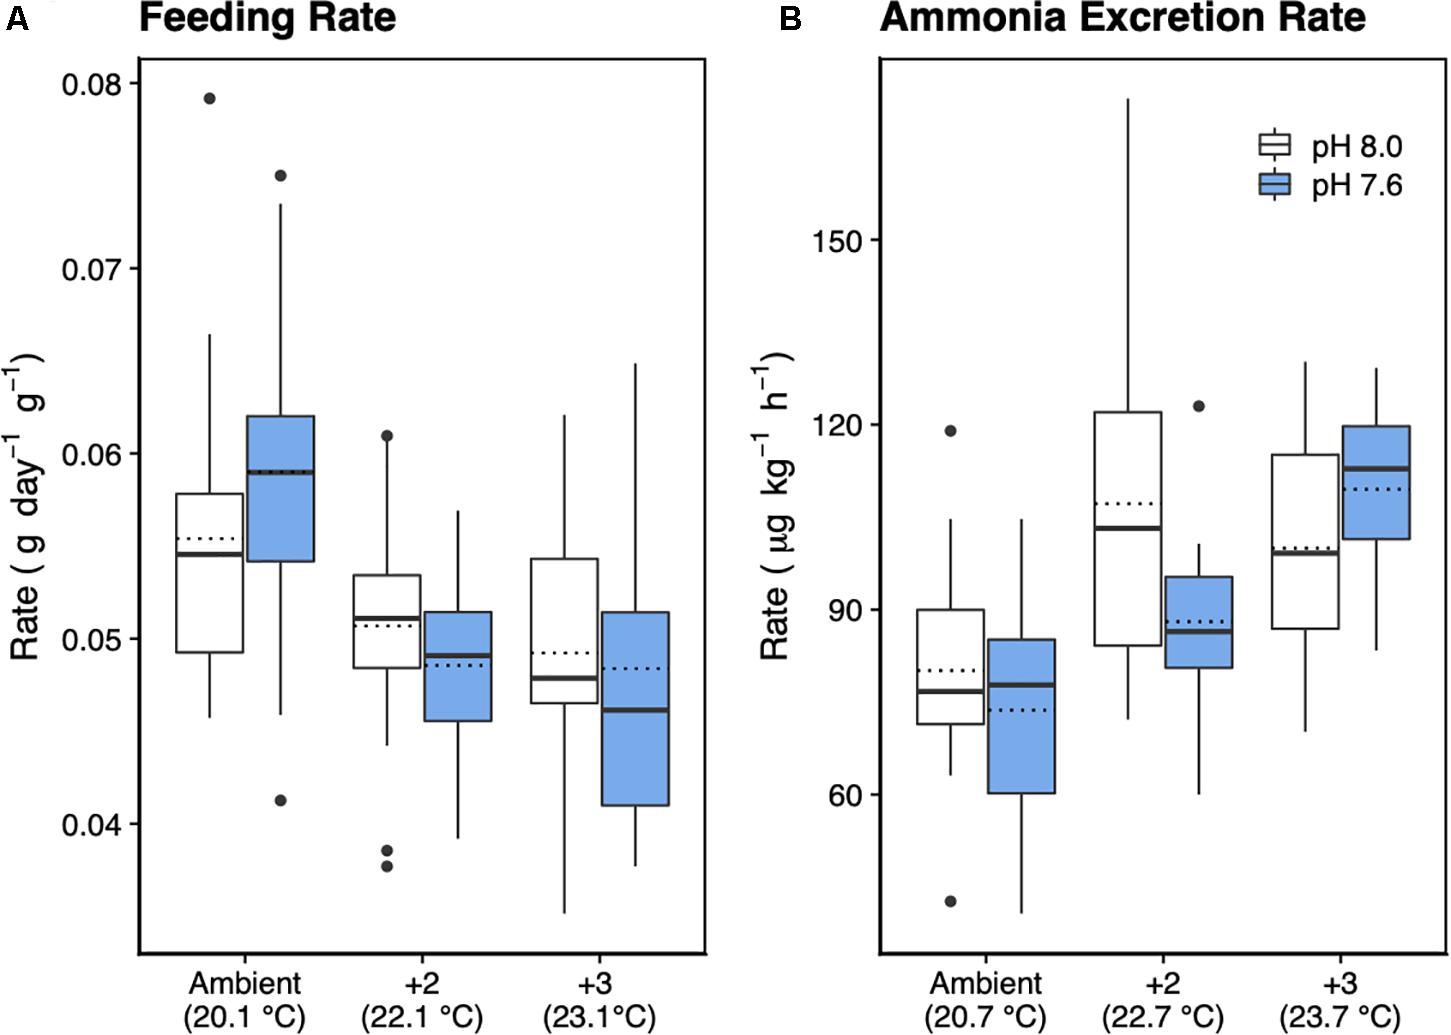
Figure 4. Feeding rate in dry food weight (A) and (B) ammonia (NH3) excretion rate of H. erythrogramma acclimated for 12 weeks in three temperature (ambient, +2°C, +3°C) and two pHT (white: 8.0, blue: 7.6) levels in six treatments. The top and bottom of the boxes represent the interquartile range (IQR) between the 25th and 75th percentile (Q1 and Q3, respectively). The horizontal line represents the median (Q2), the horizontal dotted line represents the mean, and the vertical lines (whiskers) represent the range of the data computed as follows: Q1 – 1.5 IQR (bottom whisker); greater than Q3 + 1.5 IQR (top whisker).
Urchins acclimated to elevated temperature treatments had significantly higher ammonia excretion rates (F2,56 = 8.94, p < 0.001; Figure 4B), with no effect of decreased pH and no interaction between temperature and pH (Table 2). Tukey’s HSD showed that at ambient pHT 8.0, acclimation to +2°C increased ammonia excretion by 1.3-fold (df = 54, p = 0.016), but not at +3°C (p = 0.099). At pHT 7.6, acclimation to +2°C did not significantly affect ammonia excretion (p = 0.29), but acclimation to pHT 7.6 and +3°C, increased excretion 1.5-fold (p = 0.016).
Scope for Growth
The scope for growth model for H. erythrogramma, incorporating metabolic rate, feeding rate, ammonia excretion rate and assimilation efficiency data, showed that there was a net positive energy budget under all experimental scenarios of warming and acidification after 12 weeks of acclimation (SfG > 0, Figure 5). Further, the energy acquired through feeding (with food in excess) contributed to most (>90%) of the energy budget (Table 3). While H. erythrogramma acclimated to low pH recorded a 16% increase in SfG (1.17 kJ g–1 day–1), exposure to +2°C and +3°C reduced overall SfG by 31–41%. In urchins acclimated to both stressors, overall SfG was reduced the most by 42–45%.
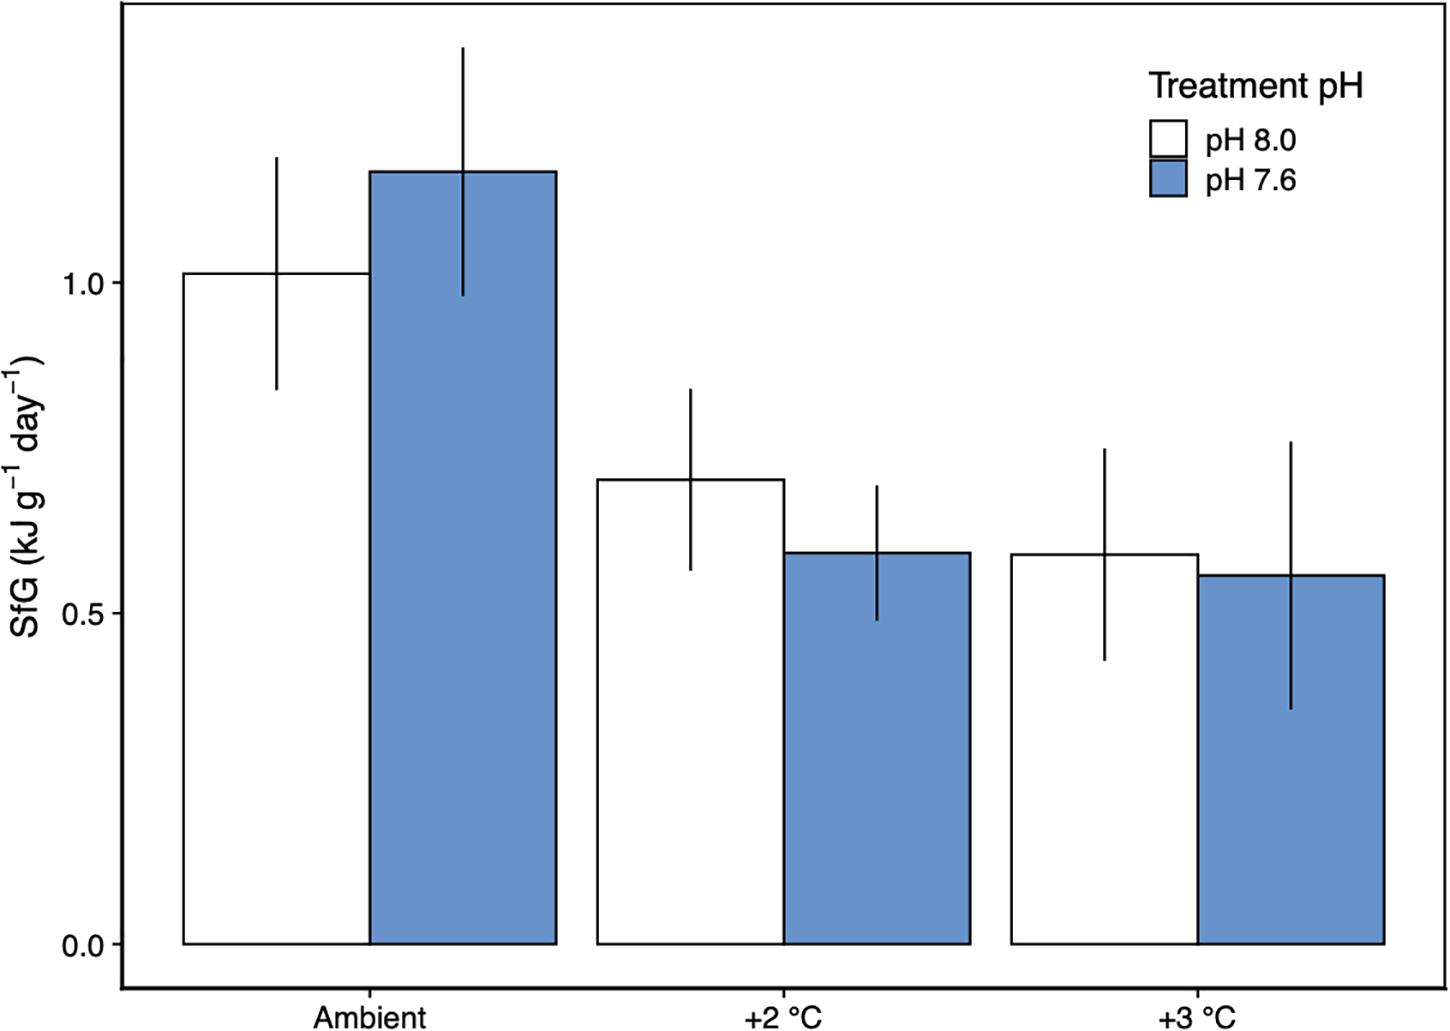
Figure 5. Scope for growth (±SD) of H. erythrogramma acclimated to three temperature (ambient, +2°C, +3°C) and two pHT (white: 8.0, blue: 7.6) levels. The model was determined from measurements of metabolic rate, feeding rate, ammonia excretion rate and assimilation efficiency. n = 1.
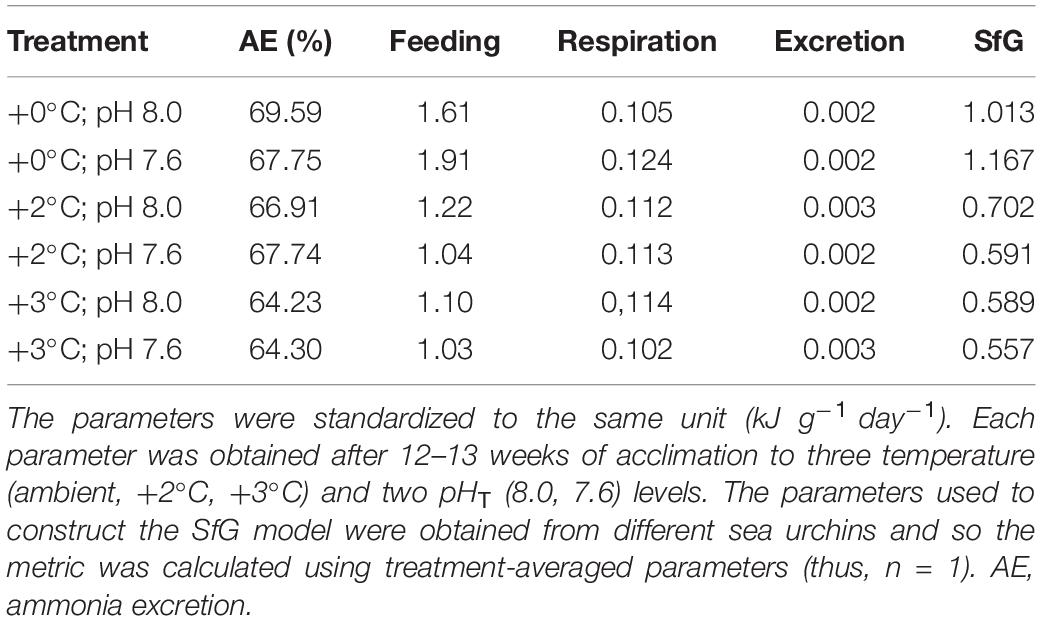
Table 3. Scope for growth (SfG) in Heliocidaris erythrogramma.
Spawning
Synchronous spawning occurred overnight on 7 and 24 October (week 7 and 10, respectively) with the first event occurring all treatments and the second spawning event only occurring in the +3°C treatments and combined +2°C/7.6 pHT treatments. These events involved males and females as indicated by the presence of developing embryos which progressed through larval and juvenile stages (data not shown).
Offspring Metabolic Rate and Size
There was a significant interaction between parental temperature treatment and offspring metabolic response to temperature (GLMM ANCOVA, F3,22 = 24.78, p < 0.001; Table 4). Juvenile metabolic rate increased significantly with temperature (F1,22 = 11.06, p < 0.003; Table 4). Parental acclimation to increased temperature (2°C above ambient) resulted in increased juvenile metabolism at higher temperature (Figure 6). At 24°C, the difference in metabolic rates between juvenile groups was up to 30% depending on whether their parents had been acclimated to increased temperature. Parental acclimation to acidification had no effect on juvenile metabolic rate (F1,22 = 1.68, p = 0.21). Low pH, regardless of parental environment, had no effect on juvenile metabolic rate (F1,22 = 0.24, p = 0.63).
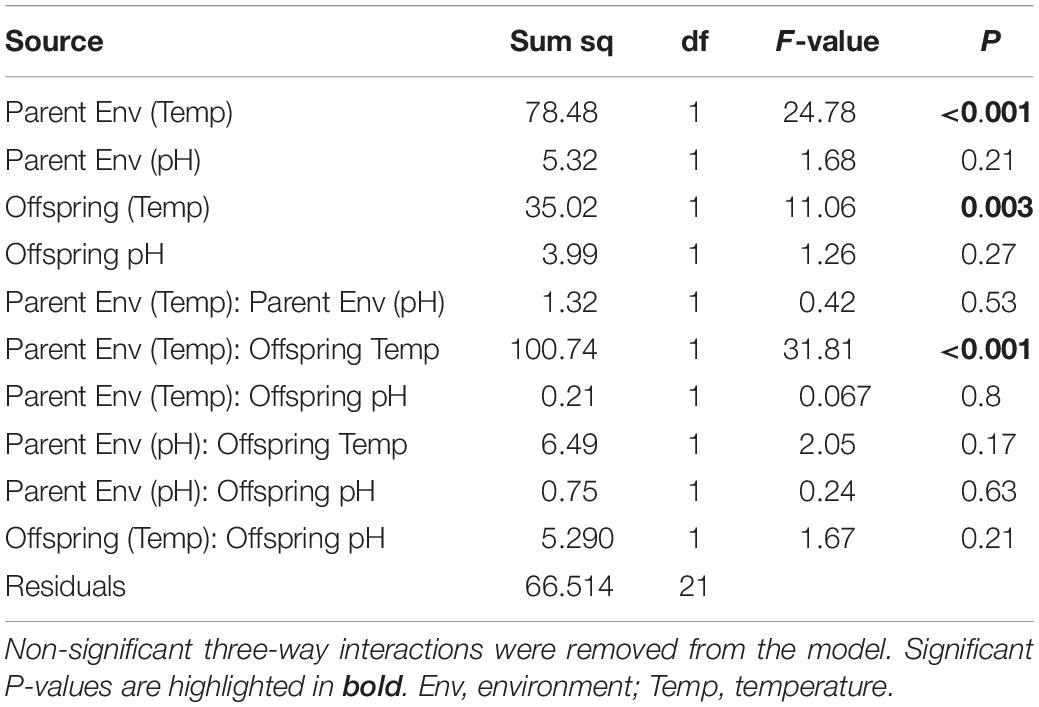
Table 4. Generalized linear models (GLMM) analyses of covariance (ANCOVA, Type III) on the effect of parental acclimation environment (ambient, +2°C, +3°C; pHT 8.0, pHT 7.6) and offspring rearing treatment (18°C, 20°C; 22°C, 24°C; pHT 8.0, pHT 7.6) on juvenile metabolic rate in H. erythrogramma.
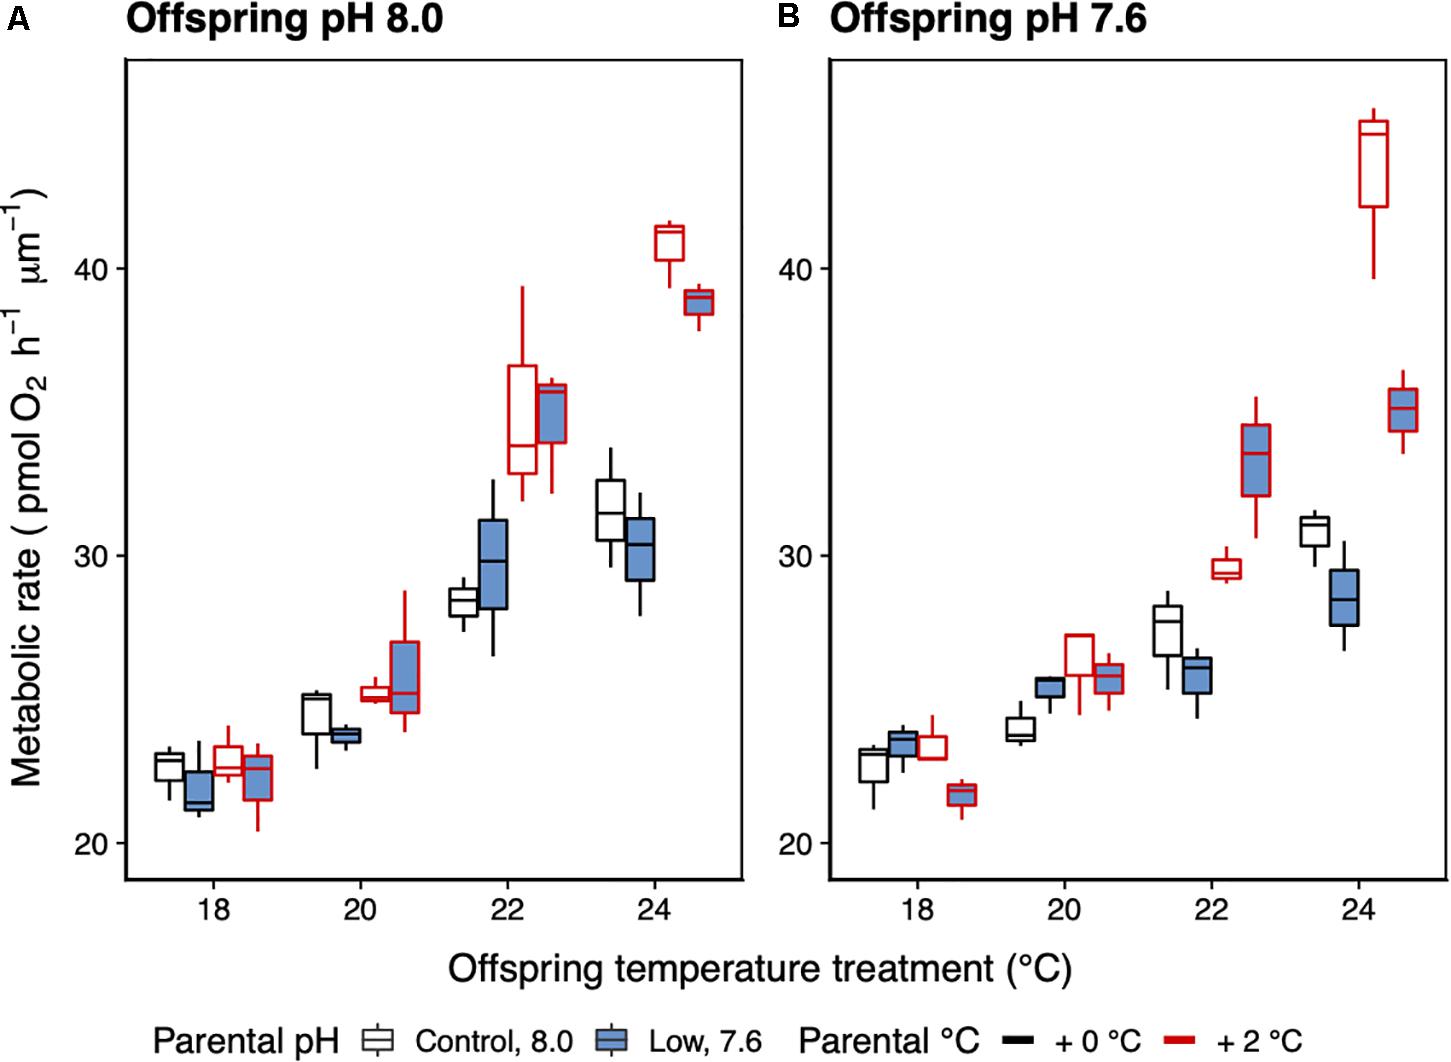
Figure 6. Mean metabolic rate (±SE) of 14-day-old juvenile offspring of H. erythrogramma parents that were acclimated for 3 months at two temperature (black outline: ambient, red outline: +2°C) and two pHT (white: 8.0, blue: 7.6) levels (A,B). The juveniles were reared in a range of temperatures (18–24°C). n = 3.
With respect to offspring test diameter, pHT 7.6 caused a statistically significant reduction in juvenile size of about 4% from 404 mm ± 2.25 (SE) to 387 ± 1.86 (SE) (F1,953 = 38.1, p < 0.001; Supplementary Figure 4), regardless of parental acclimation to warming (F1,953 = 0.003, p = 0.95) or acidification (F1,953 = 1.99, p = 0.16). Temperature had no effect (F1,953 = 1.32, p = 0.27).
Discussion
Long-term acclimation to warming and acidification, in parallel with the seasonal cycle of temperature and photoperiod, affected the survival, feeding, metabolism and ammonia excretion rates of H. erythrogramma. The high temperature offset (+3°C) caused significant mortality while the other treatments did not affect survival. For metabolic rate, temperature and pH did not interact at 4 weeks of acclimation, but significant, antagonistic interactions were detected at 12 weeks, where at pHT 7.6, metabolic rate decreased with increasing temperature. It appears that while the effect of temperature and pH were clear at 4 weeks where pH had a significant effect on metabolic rate and +3°C influenced almost every treatment, these differences in variation became less distinct after 12 weeks of acclimation. Scope for growth values were positive in all treatments, indicating that energy surplus (excess food) was adequate to support energy demands. We found no evidence of interactive effects of the two stressors on survival, feeding rate and ammonia excretion. Parental acclimation to warming (+2°C), but not acidification altered the physiology of juvenile offspring with an increase in metabolic rate.
Warming (+3°C) regardless of pH was the main driver of mortality risk (∼3-fold) in H. erythrogramma, while low pH was associated with a much lower risk of death (∼0.5-fold). The latter is similar to that found previously for this species (Byrne et al., 2009, 2011a; Harianto et al., 2018). Interestingly, in the +3°C treatments, ∼25% mortality occurred by week 10 when the highest temperature treatment had reached 24°C. This was not expected as temperatures below 24°C were not lethal after several months in previous studies (Carey et al., 2016; Harianto et al., 2018). However, 24°C which occurred ∼3 weeks later in the +2°C treatments – did not cause similar levels mortality. This points to the influence of timing of the increased temperature and the normal biological cycle. Warm conditions early may have created a mismatch between the photoperiod and temperature cues that control physiological processes associated with seasonal reproduction (Laegdsgaard et al., 1991). Successful spawning at the correct time in the +2°C treatment reflects gametogenic entrainment by the daylength cue with the onset of gamete release fine-tuned by temperature (Laegdsgaard et al., 1991). It appears that the earlier arrival of “summer” temperatures in the +3°C treatment was stressful. Heliocidaris erythrogramma matures from winter to spring, a metabolically intensive period as nutrients accumulate in the gonads (Laegdsgaard et al., 1991; Byrne and Sewell, 2019; Powell et al., 2020). Spontaneous spawning occurred in all treatments at the expected time and the gametes were fertile. This indicated that normal gametogenesis occurred, likely due to incorporation of seasonal temperature and photoperiod conditions, factors known to entrain gonad development in H. erythrogramma (Laegdsgaard et al., 1991), as also found for Echinometra sp. maintained in climate change conditions in conjunction with the seasonal cycle of light and temperature (Uthicke et al., 2020). In contrast, gonad development is inhibited or impaired in H. erythrogramma (Harianto et al., 2018) and other sea urchin species when in held in constant elevated temperature treatments (Uthicke et al., 2014; Brothers and McClintock, 2015; Delorme and Sewell, 2016; Morley et al., 2016).
For H. erythrogramma the thermal offset above ambient had negative consequences at +3°C, but not at +2°C. Our expectation that gradual introduction to warming conditions and acclimation would enhance tolerance to increased temperature seemed to be met in the +2°C treatment. The effect of the 1°C difference in sensitivity would not have been detected if seasonal profile of environmental change and prolonged acclimation were not incorporated into our investigation. This shows that understanding the effects of seasonal change on biological processes is vital for predicting how species will respond to ocean warming (Kreyling and Beier, 2013; Thompson et al., 2013). With respect to current interest in adaptive potential and the strong influence of environmental conditions on gonad development, this is a key consideration for marine climate change studies investigating carryover effects from parent to offspring (Karelitz et al., 2019, 2020; Byrne et al., 2020). For a better understanding of the impact of natural change in pH in the H. erythrogramma habitat as might be altered by ocean acidification, it would have also been interesting to incorporate the day–night diurnal change in pH with an offset. However, the source population only experiences a range of ∼0.07 pH units (Runcie et al., 2018).
As single stressors, increased temperature and reduced pH had a clear, positive effect on the metabolic rate of H. erythrogramma after 4 and 12 weeks of acclimation. This was expected. It is well-known that temperature modulates physiological activity in ectotherms (Brown et al., 2004; Dillon et al., 2010; Somero, 2012), and pH affects acid–base physiology associated with maintaining homeostasis in echinoderms (Catarino et al., 2012; Collard et al., 2013). Combined warming and acidification resulted in an increase in metabolic rate of H. erythrogramma at week 4 when the treatments were 16.6°C, 18.6°C and 19.6°C. There were no interactions between stressors, which was a similar outcome to a previous study where this species was kept in constant warm-low pH conditions (+5°C, −0.4 pHT) for 8 weeks (Carey et al., 2016). However, after 12 weeks, there was an antagonistic interaction between temperature and pH resulting in decreased metabolic rate, likely due to metabolic depression. Metabolic depression is a known stress response of many organisms faced with deleterious conditions as lowering of metabolism is an effective mechanism to conserve energy and maximize fitness in response to extreme temperatures (Storey and Storey, 1990; Guppy and Withers, 1999). Metabolic depression in H. erythrogramma was a stress response to exposure to combined warming and acidification over months, as this response was not observed when the sea urchins were exposed to each stressor individually. For H. erythrogramma these results indicated that the urchins may have experienced energetic trade-offs between the needs of routine metabolism and important processes such as feeding, reproduction and ATP allocation (Angilletta et al., 2009; Pörtner, 2010; Pan et al., 2015). Our results differ from that found for Echinometra sp. where there were no effects on metabolism after a 20-month acclimation to warming (+1°C, +2°C) and acidification (−0.2–0.3 pH units) (Uthicke et al., 2020). Comparison between the two studies is, however, difficult as different stressor levels and respirometry methods were used.
Exposure to low pH over 13 weeks did not significantly affect feeding, excretion and survival rates of H. erythrogramma, even when combined with warming (+2°C), suggesting that this species was able to successfully compensate for the potential effects of acidification on these traits and that gradual introduction of stressor levels and acclimation may have facilitated tolerance. Energetic trade-offs would be necessary to maintain acid–base balance, as metabolic rate did not increase with warming and low pH. However, the observed depression of metabolic rate in H. erythrogramma due to combined warming and acidification would limit the energy available to maintain these processes. While metabolic depression might be a necessary response to maintain the balance between energy supply and demand (Guppy et al., 1994; Guppy and Withers, 1999; Guderley and St-Pierre, 2002), in the longer term it can lead to a decrease in energy budget and reproduction as seen in gastropods and urchins (Stumpp et al., 2011; Zhang et al., 2015). This reduction of metabolic rate would be expected to impair the ability to persist in the face of habitat warming and acidification. Energetic responses to acidification conditions are also evident in long term studies of H. erythrogramma, other sea urchins and other marine invertebrates reared in acidification conditions, a result attributed to energetic constraints as seen in their smaller size, reduced biomineral production and lower gonad production/fecundity (Mos et al., 2016; Hu et al., 2018; Byrne and Fitzer, 2019; Johnson et al., 2020).
With respect to SfG, the levels determined here for H. erythrogramma (∼0.5–1.0 kJ g–1 day–1) were higher than that obtained for two other sea urchin species Arbacia punctulata (0.16–0.19 kJ g–1 day–1) and Lytechinus variegatus (0.17–0.18 kJ g–1 day–1) when subject to feeding and temperature treatments (Hill and Lawrence, 2006). For H. erythrogramma, increased temperature appeared to reduce SfG. For A. punctulata there was a slight increase in SfG with increased temperature (+8°C), and for L. variegatus this level of warming caused a decrease in SfG (Hill and Lawrence, 2006). In contrast, Evechinus chloroticus had a lower SfG at control temperature (0.14–0.18 kJ g–1 day–1) and this was reduced with increased temperature (+6°C) (0.03–0.05 kJ kg–1 day–1; Delorme and Sewell, 2016). It is difficult to compare SfG levels with these studies due to different approach to analyses. In our case all parameters were empirically determined (data and analyses are available as links provided in the section “Data Availability Statement” below).
To date, most long-term warming and acidification experiments with adult echinoderms have not incorporated seasonal change in temperature and daylength (e.g., Suckling et al., 2015; Carey et al., 2016; Morley et al., 2016; Dworjanyn and Byrne, 2018). Morley et al. (2016) presented the longest (40-month) study on the Antarctic sea urchin Sterechinus neumayeri. They found that acclimation to stable warming and acidification conditions diminished the negative effects of these stressors on feeding bioenergetics, with no differences between stress-acclimated (+2°C, −0.3 and −0.5 pH units) and ambient-acclimated sea urchins. After 2 months acclimation to constant warming and acidification conditions (+5°C, −0.5 pH units) Carey et al. (2016) showed evidence of metabolic acclimation in H. erythrogramma. In the only other study to incorporate seasonal change in temperature and photoperiod, Echinometra sp. exhibited full metabolic rate acclimation after 20 months in warming and acidification conditions (+1°C, +2°C; 0.2–0.3 pH units) although they had elevated ammonium excretion (Uthicke et al., 2020). We also noted increased ammonia excretion at +2°C and +3°C for H. erythrogramma. In the single study where a temperature offset (+2°C) from the seasonal trend was used, a 3-month exposure to this experimental treatment was lethal to Paracentrotus lividus (∼100% mortality) (Yeruham et al., 2015). This study did not incorporate a gradual introduction to increased temperature.
As expected, the juveniles exhibited an increase in metabolic rate in response to being reared at warmer temperature. In contrast to the feeding larvae of sea urchins and oysters (Stumpp et al., 2011; Parker et al., 2017) as well as larger H. erythrogramma (11–80 mm test diameter) (Carey et al., 2016) low pH as a single stressor or together with warming did not cause an increase in the metabolic rate of the juvenile H. erythrogramma, with the difference between the present and previous studies was the long pre-acclimation and acclimation times which is likely to have influenced out results. The increase in juvenile metabolic rate in response to warming was accentuated in the offspring of the warm acclimated (+2°C) parents seen in a 30% increase in metabolic rate at 24°C. The increased metabolic rate as a carryover effect of larvae from low pH exposed parents is likely to place a strain on the energy budget of the juveniles and so the response may be maladaptive. A similar response of increased metabolic rate of the larval progeny of warm acclimated parents is reported for Echinometra sp., although this was combined with low pH (pH 7.8) and so it is not known if the response was due to increased temperature, increased acidification or the combination (Karelitz et al., 2020). The influence of parental thermal history on offspring thermotolerance is seen in comparison of the performance of H. erythrogramma from different latitudes (Byrne et al., 2011b). For the progeny of the +2°C treatment adults there appears to have been transgenerational effects with adult acclimation linked to the offspring thermal stress response, which if occurs in nature may be an important mechanism to facilitate persistence, but for adaptation would need to be conveyed beyond the F1 generation. The larvae that reached the juvenile stage are likely to represent a subset of resilient larvae as well as due to the transgenerational carryover effects of parental conditioning (Byrne et al., 2011a, b, 2020). The resilience of the juvenile stage is likely due to selective mortality of sensitive individuals at the larval stage. Due to the flow through conditions, dead offspring were washed from the system. Larval survivorship data are needed to more fully understand the influence of sensitive and resistant genotypes on overall adaptive capacity. We do not know if thermotolerance would have been seen in progeny of +3°C acclimation parents as there were insufficient spawners. However, as this level of warming incurred high mortality, it is likely that gamete quality would have been marginal with negative effects for development.
Our findings underscore the need for a multifactorial and integrative approach to predicting the effects of climate change stressors on marine species as they show how physiological responses can change the interpretation of sensitivities to climate change (Gunderson et al., 2016). For adult H. erythrogramma increased energetic costs of OA may interact with warming to affect metabolism in ways that contrast with single stressor effects and there was a heightened larval metabolism depending on adult acclimation history. The 3°C increase in temperature caused significant levels of adult mortality in our treatments and an indication of reproductive failure, but these effects were not seen in the +2°C treatment. As H. erythrogramma showed little tolerance to +4°C in previous studies and recent regional increase in habitat temperature is linked to disease and mortality (Sweet et al., 2016; Harianto et al., 2018) we expected that we might see negative effects at +3°C, as we did. Six weeks at this level of warming approached lethal tolerance limits for H. erythrogramma. This indicates that H. erythrogramma in the region currently live close to their lethal temperature as they experience MHW and temperatures approaching 25°C (Harianto et al., 2018). However, larval transport of H. erythrogramma. to cooler climes will be facilitated by the strong poleward flow (see Byrne et al., 2011b) potentially avoiding the “wrong-way” migration shown elsewhere (Fuchs et al., 2020).
Finally, our results contribute to an increasing body of research (Hu et al., 2018; Byrne et al., 2020) that show the need to consider the influence of acclimation in assessing prospects for phenotypic adjustment and adaptation in marine species in the face of a changing climate.
Data Availability Statement
The raw data supporting the conclusion of this article will be made available by the authors, without undue reservation.
Author Contributions
JH and MB devised the project and wrote the manuscript. JH, JA, ST, and RG carried out the experiments. All authors commented on the manuscript.
Funding
This research was supported by grants from the ARC (DP150102771) and NSW Environmental Trust 2016RD0159.
Conflict of Interest
The authors declare that the research was conducted in the absence of any commercial or financial relationships that could be construed as a potential conflict of interest.
The reviewer MAS declared a past co-authorship with one of the authors MB to the handling editor.
Acknowledgments
The content of the manuscript has been published as part of the thesis of Harianto (2019). We thank the Sydney Institute of Marine Science (SIMS) for access to facilities and assistance. This is SIMS contribution 265.
Supplementary Material
The Supplementary Material for this article can be found online at: https://www.frontiersin.org/articles/10.3389/fmars.2020.588938/full#supplementary-material
Supplementary Figure 1 | Mean weekly temperature (±SD) for Chowder Bay from 2009 to 2014. Data were obtained from loggers deployed in situ at 3 m depth at the level of the sea urchin habitat and used to design the temperature profile of the elevated temperature treatments (see Figure 1). Colors represent the adjustment (blue) and acclimation (red) periods of the experimental treatments, respectively. The shaded region (gray) is the max/min of the temperatures recorded.
Supplementary Figure 2 | Diagram of the kreisel containers used to rear of H. erythrogramma to the juvenile stage. Filtered sea water was supplied at a rate of 50 mL min–1. At the water enters the kreisel it generates a continuous circular flow keep the embryos and larvae in suspension until they settle.
Supplementary Figure 3 | A graphical view of pairwise p-values from Tukey’s Honest Significant Difference (HSD) test, performed on the estimated marginal means (EMM) of treatment groups results, for comparisons of performance of metabolic rate in six treatments of three temperatures (ambient, +2°C, +3°C) and two pHT levels (8.0, 7.6). Separate analyses were performed at (A) 4 weeks and (B) 12 weeks. Factor levels are plotted on the vertical axis, and p-values are plotted on the horizontal axis. Numbers are the EMM values and vertical lines connect the levels being compared. P-values smaller than 0.05 indicate significant differences between paired levels. The p-value scale is non-linear.
Supplementary Figure 4 | Mean test diameter (±SE) of 14-day-old juvenile offspring of H. erythrogramma parents that were acclimated for 3 months at two temperature (black outline: ambient, red outline: +2°C) and two pHT (white: 8.0, blue: 7.6) levels. The juveniles were reared in a range of temperatures (18–24°C). n = 960.
Supplementary Table 1 | Carbonate system conditions (±SD) during the 22 weeks of acclimation of Heliocidaris erythrogramma in six treatments of three temperature (ambient, +2°C, +3°C) and two pHT (8.0, 7.6) levels. AT, total alkalinity; DIC, dissolved inorganic carbon, ΩCa and ΩAr, calcite and aragonite saturation states, respectively. n = 6.
Supplementary Table 2 | Weekly, sampling-averaged temperatures (°C + SD) for three temperature profile treatments (ambient +0°C, elevated +2°C and +3°C), logged over 22 weeks of acclimation for the sea urchin Heliocidaris erythrogramma. Temperatures were adjusted weekly according to the mean SST profile determined from 5 years of in situ data (Supplementary Figure 1).
Supplementary Table 3 | Carbonate system conditions (±SD) in offspring treatments of four temperatures (18°C, 20°C, 22°C, 24°C) and two pHT levels (8.0, 7.6). AT, total alkalinity; DIC, dissolved inorganic carbon, ΩCa and ΩAr, calcite and aragonite saturation states, respectively. n = 3.
References
Angilletta, M. J., Huey, R. B., and Frazier, M. R. (2009). Thermodynamic effects on organismal performance: is hotter better? Physiol. Biochem. Zool. 83, 197–206. doi: 10.1086/648567
Babcock, R. C., Bustamante, R. H., Fulton, E. A., Fulton, D. J., Haywood, M. D., Hobday, A. J., et al. (2019). Severe continental-scale impacts of climate change are happening now: extreme climate events impact marine habitat forming communities along 45% of Australia’s coast. Front. Mar. Sci. 6:411. doi: 10.3389/fmars.2019.00411
Bellworthy, J., Menoud, M., Krueger, T., Meibpm, A., and Fine, M. (2019). Developmental carry over effects of ocean warming and acidification in corals from a potential climate refugium, the Gulf of Aqaba. J. Exp. Biol. 222:jeb186940. doi: 10.1242/jeb.186940
Benjamini, Y., and Hochberg, Y. (1995). Controlling the false discovery rate: a practical and powerful approach to multiple testing. J. R. Stat. Soc. B 57, 289–300. doi: 10.1111/j.2517-6161.1995.tb02031.x
Boyd, P. W., and Brown, C. J. (2015). Modes of interactions between environmental drivers and marine biota. Front. Mar. Sci. 2:9. doi: 10.3389/fmars.2015.00009
Boyd, P. W., Collins, S., Dupont, S., Fabricius, K., Gattuso, J. P., Havenhand, J., et al. (2017). Experimental strategies to assess the biological ramifications of multiple drivers of global ocean change a review. Glob. Chang. Biol. 24, 2239–2261. doi: 10.1111/gcb.14102
Brothers, C. J., Harianto, J., McClintock, J. B., and Byrne, M. (2016). Sea urchins in a high-CO2 world: the influence of acclimation on the immune response to ocean warming and acidification. Proc. R. Soc. B 283:20161501. doi: 10.1098/rspb.2016.1501
Brothers, C. J., and McClintock, J. B. (2015). The effects of climate-induced elevated seawater temperature on the covering behavior, righting response, and Aristotle’s lantern reflex of the sea urchin Lytechinus variegatus. J. Exp. Mar. Biol. Ecol. 467, 33–38. doi: 10.1016/j.jembe.2015.02.019
Brown, J. H., Gillooly, J. F., Allen, A. P., Savage, V. M., and West, G. B. (2004). Toward a metabolic theory of ecology. Ecology 85, 1771–1789. doi: 10.1890/03-9000
Byrne, M. (2011). Impact of ocean warming and ocean acidification on marine invertebrate life history stages: vulnerabilities and potential for persistence in a changing ocean. Oceanog. Mar. Biol. Ann. Rev. 49, 1–42.
Byrne, M., and Fitzer, S. (2019). The impact of environmental acidification on the microstructure and mechanical integrity of marine invertebrate skeletons. Conser. Physiol. 7:coz062. doi: 10.1093/conphys/coz062
Byrne, M., Foo, S. A., Ross, P. M., and Putnam, H. M. (2020). Limitations of cross-and multigenerational plasticity for marine invertebrates faced with global climate change. Glob. Change Biol. 26, 80–102. doi: 10.1111/gcb.14882
Byrne, M., and Hernández, J. C. (2020). “Sea urchins in a high CO2 world: impacts of climate warming and ocean acidification across life history stages,” in Sea Urchins: Biology and Ecology, 4th Edn, ed. J. M. Lawrence (Amsterdam: Elsevier), 281–297. doi: 10.1016/B978-0-12-819570-3.00016-0
Byrne, M., Ho, M., Selvakumaraswamy, P., Nguyen, H. D., Dworjanyn, S. A., and Davis, A. R. (2009). Temperature, but not pH, compromises sea urchin fertilization and early development under near-future climate change scenarios. Proc. R. Soc. B 276, 1883–1888. doi: 10.1098/rspb.2008.1935
Byrne, M., Ho, M. A., Wong, E., Soars, N., Selvakumaraswamy, P., Sheppard Brennand, H., et al. (2011a). Unshelled abalone and corrupted urchins, development of marine calcifiers in a changing ocean. Proc. R. Soc. B 278, 2376–2383. doi: 10.1098/rspb.2010.2404
Byrne, M., Selvakumaraswamy, P., Ho, M. A., Woolsey, E., and Nguyen, H. D. (2011b). Sea urchin development in a global change hotspot, potential for southerly migration of thermotolerant propagules. Deep Sea Res. PT II 58, 712–719. doi: 10.1016/j.dsr2.2010.06.010
Byrne, M., Lamare, M., Winter, D., Dworjanyn, S. A., and Uthicke, S. (2013). The stunting effect of a high CO2 ocean on calcification and development in sea urchin larvae, a synthesis from the tropics to the poles. Philos. Trans. R. Soc. B 368:20120439. doi: 10.1098/rstb.2012.0439
Byrne, M., and Sewell, M. (2019). Evolution of maternal provisioning strategies in echinoids — selection for high quality juveniles. Mar. Ecol. Prog. Ser. 616, 95–106. doi: 10.3354/meps12938
Carey, N., Harianto, J., and Byrne, M. (2016). Sea urchins in a high CO2 world: partitioned effects of body size, ocean warming and acidification on metabolic rate. J. Exp Biol. 219, 1178–1186. doi: 10.1242/jeb.136101
Catarino, A. I., Bauwens, M., and Dubois, P. (2012). Acid-base balance and metabolic response of the sea urchin Paracentrotus lividus to different seawater pH and temperatures. Environ. Sci. Pollut. 19, 2344–2353. doi: 10.1007/s11356-012-0743-1
Christensen, A. B., Nguyen, H. D., and Byrne, M. (2011). Thermotolerance and the effects of hypercapnia on the metabolic rate of the ophiuroid Ophionereis schayeri: inferences for survivorship in a changing ocean. J. Exp. Mar. Biol. Ecol. 403, 31–38. doi: 10.1016/j.jembe.2011.04.002
Collard, M., Catarino, A. I., Bonnet, S., Flammang, P., and Dubois, P. (2013). Effects of CO2-induced ocean acidification on physiological and mechanical properties of the starfish Asterias rubens. J. Exp. Mar. Biol. Ecol. 446, 355–362. doi: 10.1016/j.jembe.2013.06.003
Collins, M., Knutti, R., Arblaster, J., Dufresne, J.-L., Fichefet, T., Friedlingstein, P., et al. (2013). “Long-term climate change: projections, commitments and irreversibility,” in Climate Change 2013: The Physical Science Basis. Contribution of Working Group I to the Fifth Assessment Report of the Intergovernmental Panel on Climate Change, eds T. F. Stocker, D. Qin, and D. Plattner (Cambridge: Cambridge University Press).
Conover, R. J. (1966). Assimilation of organic matter by zooplankton. Limnol. Oceanogr. 11, 338–345. doi: 10.4319/lo.1966.11.3.0338
Conover, W. J., Johnson, M. E., and Johnson, M. M. (1981). A comparative study of tests for homogeneity of variances, with applications to the outer continental shelf bidding data. Technometrics 23, 351–361. doi: 10.2307/1268225
Cox, D. R. (1972). Regression models and life-tables. J. R. Stat. Soc. B 34, 187–220. doi: 10.1111/j.2517-61611972.tb00899.x
Delorme, N. J., and Sewell, M. A. (2016). Effects of warm acclimation on physiology and gonad development in the sea urchin Evechinus chloroticus. Comp. Biochem. Phys. A 198, 33–40. doi: 10.1016/j.cbpa.2016.03.020
Deutsch, C., Ferrel, A., Seibel, B., Portner, H. O., and Huey, R. B. (2015). Climate change tightens a metabolic constraint on marine habitats. Science 348, 1132–1135. doi: 10.1126/science.aaa1605
Dickson, A. G. (1990). Standard potential of the reaction: AgCl(s) + 1/2H2(g) = Ag(s) + HCl(Aq), and the standard acidity constant of the ion HSO4- in synthetic sea water from 273.15 to 318.15 K. J. Chem. Thermodyn. 22, 113–127. doi: 10.1016/0021-9614(90)90074-Z
Dickson, A. G., Sabine, C. L., and Christian, J. R. (2007). Guide to Best Practices for Ocean CO2 Measurements. Sidney: North Pacific Marine Science Organization.
Dillon, M. E., Wang, G., and Huey, R. B. (2010). Global metabolic impacts of recent climate warming. Nature 467, 704–706. doi: 10.1038/nature09407
Dupont, S., Dorey, N., Stumpp, M., Melzner, F., and Thorndyke, M. (2013). Long-term and trans-life-cycle effects of exposure to ocean acidification in the green sea urchin Strongylocentrotus droebachiensis. Mar. Biol. 160, 1835–1843. doi: 10.1007/s00227-012-1921-x
Dworjanyn, S. A., and Byrne, M. (2018). Impacts of ocean acidification on sea urchin growth across the juvenile to mature adult life-stage transition is mitigated by warming. Proc. R. Soc. B 285:20172684. doi: 10.1098/rspb.2017.2684
Elliott, J. M., and Davison, W. (1975). Energy equivalents of oxygen consumption in animal energetics. Oecologia 19, 195–201. doi: 10.1007/BF00345305
Fofonoff, N. P., and Millard, R. C. (1983). Algorithms for computation of fundamental properties of seawater. UNESCO Techn. Pap. Mar. Sci. 44, 53–53.
Fuchs, H. L., Chant, R. J., Hunter, E. J., Curchitser, E. N., Gerbi, G. P., and Chen, E. Y. (2020). Wrong-way migrations of benthic species driven by ocean warming and larval transport. Nat. Clim. Change 10, 1052–1056. doi: 10.1038/s41558-020-0894-x
Gattuso, J. P., Epitalon, J. M., Lavigne, H., Orr, J., Gentili, B., Hagens, M., et al. (2020). Seacarb: Seawater Carbonate Chemistry. Available online at: https://CRAN.R-project.org/package =seacarb doi: 10.1038/s41558-020-0894-x (accessed May 23, 2020).
Gattuso, J. P., Magnan, A., Billé, R., Cheung, W. W. L., Howes, E. L., Joos, F., et al. (2015). Contrasting futures for ocean and society from different anthropogenic CO2 emissions scenarios. Science 349:aac4722. doi: 10.1126/science.aac4722
Ghalambor, C. K., Mckay, J. K., Carroll, S. P., and Rezenick, D. N. (2007). Adaptive versus non-adaptive phenotypic plasticity and the potential for contemporary adaptation in new environments. Funct. Ecol. 21, 394–407. doi: 10.1111/j.1365-2435.2007.01283.x
Goldenberg, S. U., Nagelkerken, I., Ferreira, C. M., Ullah, H., and Connell, S. D. (2017). Boosted food web productivity through ocean acidification collapses under warming. Glob. Change Biol. 23, 4177–4184. doi: 10.1111/gcb.13699
Grambsch, P. M., and Therneau, T. M. (1994). Proportional hazards tests and diagnostics based on weighted residuals. Biometrika 81, 515–526. doi: 10.2307/2337547
Guderley, H., and St-Pierre, J. (2002). Going with the flow or life in the fast lane: contrasting mitochondrial responses to thermal change. J. Exp. Biol. 205, 2237–2249.
Gunderson, A. R., Armstrong, E. J., and Stillman, J. H. (2016). Multiple stressors in a changing world: the need for an improved perspective on physiological responses to the dynamic marine environment. Annu. Rev. Mar. Sci. 8, 357–378. doi: 10.1146/annurev-marine-122414-033953
Guppy, M., Fuery, C., and Flanigan, J. (1994). Biochemical principles of metabolic depression. Comp. Biochem. Phys. B 109, 175–189. doi: 10.1016/0305-0491(94)90001-9
Guppy, M., and Withers, P. (1999). Metabolic depression in animals: physiological perspectives and biochemical generalizations. Biol. Rev. 74, 1–40. doi: 10.1017/S0006323198005258
Harianto, J. (2019). Physiological Responses of Adult and Juvenile Sea Urchins (Heliocidaris erythrogramma) to Warming and Acidification. Ph. D thesis, The University of Sydney, Sydney.
Harianto, J., Carey, N., and Byrne, M. (2019). respR—An R package for the manipulation and analysis of respirometry data. Methods Ecol. Evol. 10, 912–920. doi: 10.1111/2041-210x.13162
Harianto, J., Nguyen, H. D., Holmes, S. P., and Byrne, M. (2018). The effect of warming on mortality, metabolic rate, heat-shock protein response and gonad growth in thermally acclimated sea urchins (Heliocidaris erythrogramma). Mar. Biol. 165:96. doi: 10.1007/s00227-018-3353-8
Harvey, B. P., Gwynn-Jones, D., and Moore, P. J. (2013). Meta-analysis reveals complex marine biological responses to the interactive effects of ocean acidification and warming. Ecol. Evol. 3, 1016–1030. doi: 10.1002/ece3.516
Hill, S. K., and Lawrence, J. M. (2006). Interactive effects of temperature and nutritional condition on the energy budgets of the sea urchins Arbacia punctulata and Lytechinus variegatus (Echinodermata: Echinoidea). J. Mar. Biol. Assoc. U.K. 8, 783–790. doi: 10.1017/50025315406013701
Holbrook, N. J., Scannell, H. A., Gupta, A. S., Benthuysen, J. A., Feng, M., Oliver, E. C., et al. (2019). A global assessment of marine heatwaves and their drivers. Nat. Commun. 10, 1–13. doi: 10.1038/s41467-019-10206-z
Hu, M. Y., Lein, E., Bleich, M., Melzner, F., and Stumpp, M. (2018). Trans-life cycle acclimation to experimental ocean acidification affects gastric pH homeostasis and larval recruitment in the sea star Asterias rubens. Acta Physiol. 2018:e13075. doi: 10.1111/alpha.13075
Johnson, R., Harianto, J., Thomson, M., and Byrne, M. (2020). The effects of long-term exposure to low pH on the skeletal microstructure of the sea urchin Heliocidaris erythrogramma. J. Exp. Mar. Biol. Ecol. 523, 151250. doi: 10.1016/j.jembe.2019.151250
Karelitz, S. E., Lamare, M. D., Mos, B., De Bari, H., Dworjanyn, S. A., and Byrne, M. (2019). Impact of growing up in a warmer, lower pH future on offspring performance: transgenerational plasticity in a pan-tropical sea urchin. Coral Reefs 38, 1085–1095. doi: 10.1007/s00338-019-01855-z
Karelitz, S. E., Lamare, M. D., Patel, F., Gemmell, N., and Uthicke, S. (2020). Parental acclimation to future ocean conditions increased development rates, but decreases survival in sea urchin larvae. Mar. Biol. 167:2. doi: 10.1007/s00227-019-3610-5
Karelitz, S. E., Uthicke, S., Foo, S. A., Barker, M. F., Byrne, M., Pecorino, D., et al. (2016). Ocean acidification has little effect on developmental thermal windows of echinoderms from Antarctica to the tropics. Glob. Change Biol. 23, 657–672. doi: 10.1111/gcb.13452
Keesing, J. K. (2020). “Heliocidaris erythrogramma,” in Sea Urchins: Biology and Ecology, 4th Edn, ed. J. M. Lawrence (Amsterdam: Elsevier), 537–552. doi: 10.1016/b978-0-12-819570-3.00030-5
Keppel, E. A., Scrosati, R. A., and Courtenay, S. C. (2015). Interactive effects of ocean acidification and warming on subtidal mussels and sea stars from Atlantic Canada. Mar. Biol. Res. 11, 337–348. doi: 10.1080/17451000.2014.932914
Kordas, R. L., Harley, C. D., and O’Connor, M. I. (2011). Community ecology in a warming world: the influence of temperature on interspecific interactions in marine systems. J. Exp. Mar. Biol. Ecol. 400, 218–226. doi: 10.1016/j.jembe.2011.02.029
Kreyling, J., and Beier, C. (2013). Complexity in climate change manipulation experiments. Bioscience 63, 763–767. doi: 10.1093/bioscience/63.9.763
Kroeker, K. J., Gambi, M. C., and Micheli, F. (2013). Community dynamics and ecosystem simplification in a high-CO2 ocean. Proc. Natl. Acad. Sci. U.S.A. 110, 12721–12726. doi: 10.1073/pnas.1216464110
Laegdsgaard, P., Byrne, M., and Anderson, D. T. (1991). Reproduction of sympatric populations of Heliocidaris erythrogramma and H. tuberculata (Echinoidea) in New South Wales. Mar. Biol. 110, 359–374. doi: 10.1007/BF01344355
Langsrud, Ø (2003). ANOVA for unbalanced data: use Type II instead of Type III sums of squares. Stat. Comput. 13, 163–167. doi: 10.1023/A:1023260610025
Lefevre, S. (2016). Are global warming and ocean acidification conspiring against marine ectotherms? A meta-analysis of the respiratory effects of elevated temperature, high CO2 and their interaction. Conserv. Physiol. 4, 1–31. doi: 10.1093/conphys/cow009
Lighton, J. R. B. (2008). Measuring Metabolic Rates: A Manual for Scientists. Oxford: Oxford University Press.
Liu, X., Patsavas, M. C., and Byrne, R. H. (2011). Purification and characterization of meta-cresol purple for spectrophotometric seawater pH measurements. Environ. Sci. Technol. 45, 4862–4868. doi: 10.1021/es200665d
Lueker, T. J., Dickson, A. G., and Keeling, C. D. (2000). Ocean pCO2 calculated from dissolved inorganic carbon, alkalinity, and equations for K1 and K2: validation based on laboratory measurements of CO2 in gas and seawater at equilibrium. Mar. Chem. 70, 105–119. doi: 10.1016/S0304-4203(00)00022-0
Manríquez, P. H., Torres, R., Matson, P. G., Lee, M. R., Jara, M. E., Seguel, M. E., et al. (2017). Effects of ocean warming and acidification on the early benthic ontogeny of an ecologically and economically important echinoderm. Mar. Ecol. Prog. Ser. 563, 169–184. doi: 10.3354/meps11973
Morley, S. A., Suckling, C. C., Clark, M. S., Cross, E. L., and Peck, L. S. (2016). Long-term effects of altered pH and temperature on the feeding energetics of the Antarctic sea urchin, Sterechinus neumayeri. Biodiversity 17, 34–45. doi: 10.1080/14888386.2016.1174956
Mos, B., Byrne, M., and Dwoarjanyn, S. A. (2016). Biogenic acidification reduces sea urchin gonad growth and increases susceptibility of aquaculture to ocean acidification. Mar. Environ. Res. 112, 39–48. doi: 10.1016/j.marenvres.2015.11.001
Munguia, P., and Alenius, B. (2013). The role of preconditioning in ocean acidification experiments: a test with the intertidal isopod Paradella diane. Mar. Freshw. Behav. Physiol. 46, 33–44. doi: 10.1080/10236244.2013.788287
Oliver, E. C. J., Donat, M. G., Burrows, M. T., Moore, P. J., Smale, D. A., Alexander, L. V., et al. (2018). Long and more frequent marine heatwaves over the past century. Nat. Commun. 9:1324. doi: 10.1038/s41467-018-03732-9
Pan, T. C. F., Applebaum, S. L., and Manahan, D. T. (2015). Experimental ocean acidification alters the allocation of metabolic energy. Proc. Natl. Acad. Sci. U.S.A. 112, 4696–4701. doi: 10.1073/pnas.1416967112
Parker, L. M., O’Connor, W. A., Byrne, M., Coleman, R. A., Virtue, P., Dove, M., et al. (2017). Adult exposure to ocean acidification is maladaptive for larvae of the Sydney rock oyster Saccostrea glomerata in the presence of multiple stressors. Biol. Lett. 13:20160798. doi: 10.1098/rsbl.2016.0798
Parsons, T. R., Maita, Y., and Lalli, C. M. (eds). (1984). “Determination of ammonia (alternative method),” in A Manual of Chemical & Biological Methods for Seawater Analysis (Amsterdam: Pergamon), 14–17. doi: 10.1016/b978-0-08-030287-4.50013-x
Pechenik, J. A. (2018). “Latent effects: surprising consequences of embryonic and larval experience on life after metamorphosis,” in Evolutionary Ecology of Marine Invertebrate Larvae, eds T. J. Carrier, A. M. Reitzel, and A. Heyland (Oxford: Oxford University Press), 208–225.
Perez, F. F., and Fraga, F. (1987). Association constant of fluoride and hydrogen ions in seawater. Mar. Chem. 21, 161–168. doi: 10.1016/0304-4203(87)90036-3
Pörtner, H. O. (2010). Oxygen- and capacity-limitation of thermal tolerance: a matrix for integrating climate-related stressor effects in marine ecosystems. J. Exp. Biol. 213, 881–893. doi: 10.1242/jeb.037523
Powell, M., Marsh, A. G., and Watts, S. A. (2020). “Biochemical and energy requirements of gonad development in regular sea urchins,” in Sea Urchins: Biology and Ecology, 4the Edn, eds J. M. Lawrence and J. M. Lawrence (Amsterdam: Elsevier), 51–64. doi: 10.1016/b978-0-12-819570-3.00004-4
Przeslawski, R., Byrne, M., and Mellin, C. (2015). A review and meta-analysis of the effects of multiple abiotic stressors on marine embryos and larvae. Glob. Change Biol. 21, 2122–2140. doi: 10.1111/gcb.12833
Royston, J. P. (1983). Some techniques for assessing multivariate normality based on the Shapiro-Wilk W. J. R. Stat. Soc. C Appl. 32, 121–133. doi: 10.2307/2347291
Runcie, J. W., Krause, C., Torres Garbarda, S. A., and Byrne, M. (2018). Technical note: continuous fluorescence-based monitoring of seawater pH in situ. Biogeosciences 15, 4291–4299. doi: 10.5194/bg-15-4291-2018
Schielzeth, H., and Nakagawa, S. (2013). Nested by design: model fitting and interpretation in a mixed model era. Methods Ecol. Evol. 4, 14–24. doi: 10.1111/j.2041-210x.2012.00251.x
Schmidt, C., Kucera, M., and Uthicke, S. (2014). Combined effects of warming and ocean acidification on coral reef foraminifera Marginopora vertebralis and Heterostegina depressa. Coral Reefs 33, 805–818. doi: 10.1007/s00338-014-1151-4
Schulte, P. M. (2015). The effects of temperature on aerobic metabolism: towards a mechanistic understanding of the responses of ectotherms to a changing environment. J. Exp. Biol. 218, 1856–1866. doi: 10.1242/jeb.118851
Seebacher, F., White, C. R., and Franklin, C. E. (2014). Physiological plasticity increases resilience of ectothermic animals to climate change. Nat. Clim. Chang. 5, 61–66. doi: 10.1038/NCLIMATE2457
Sheppard Brennand, H., Soars, N., Dworjanyn, S. A., Davis, A. R., and Byrne, M. (2010). Impact of ocean warming and ocean acidification on larval development and calcification in the sea urchin Tripneustes gratilla. PLoS One 5:e11372. doi: 10.1371/journal.pone.0011372
Somero, G. N. (2012). The physiology of global change: linking patterns to mechanisms. Annu. Rev. Mar. Sci. 4, 39–61. doi: 10.1146/annurev-marine-120710-100935
Storey, K. B., and Storey, J. M. (1990). Metabolic rate depression and biochemical adaptation in anaerobiosis, hibernation and estivation. Q. Rev. Biol. 65, 145–174. doi: 10.1086/416717
Stumpp, M., Wren, J., Melzner, F., Thorndyke, M. C., and Dupont, S. T. (2011). CO2 induced seawater acidification impacts sea urchin larval development I: elevated metabolic rates decrease scope for growth and induce developmental delay. Comp. Biochem. Physiol. Part A Mol. Integr. Physiol. 160, 331–340. doi: 10.1016/j.cbpa.2011.06.022
Suckling, C. C., Clark, M. S., Richard, J., Morley, S. A., Thorne, M. A. S., Harper, E. M., et al. (2015). Adult acclimation to combined temperature and pH stressors significantly enhances reproductive outcomes compared to short-term exposures. J. Anim. Ecol. 84, 773–784. doi: 10.1111/1365-2656.12316
Sweet, M., Bulling, M., and Williamson, J. (2016). New disease outbreak affects two dominant sea urchin species associated with Australian temperate reefs. Mar. Ecol. Prog. Ser. 551, 171–183. doi: 10.3354/meps11750
Thompson, R. M., Beardall, J., Beringer, J., Grace, M., and Sardina, P. (2013). Means and extremes: building variability into community-level climate change experiments. Ecol. Lett. 16, 799–806. doi: 10.1111/ele.12095
Thomsen, J., Haynert, K., Wegner, K. M., and Melzner, F. (2015). Impact of seawater carbonate chemistry on the calcification of marine bivalves. Biogeosciences 12, 1543–1571. doi: 10.5194/bg-12-4209-2015
Uthicke, S., Liddy, M., Nguyen, H. D., and Byrne, M. (2014). Interactive effects of near-future temperature I crease and ocean acidification on physiology and gonad development in adult Pacific sea urchin, Echinometra sp. A. Coral Reefs 33, 831–845. doi: 10.1007/s00338-014-1165-y
Uthicke, S., Patel, F., Karelitz, S., Luter, H. M., Webster, N. S., and Lamare, M. (2020). Key biological responses over two generations of the sea urchin Echinometra sp. A under future ocean conditions. Mar. Ecol. Prog. Ser. 637, 87–101. doi: 10.3354/meps13236
Winberg, G. G. (1960). Rate of metabolism and food requirements of fishes. Transl. Ser. Fish. Res. Board Can. 194, 1–202.
Wong, J., Johnson, K. M., Kelly, M. W., and Hofmann, G. E. (2018). Transcriptomics reveal transgenerational effects in purple sea urchin embryos: adult acclimation to upwelling conditions alters the response of their progeny to differential pCO2 levels. Mol Ecol. 27, 1120–1137. doi: 10.1111/mec.14503
Yeruham, E., Rilov, G., Shpigel, M., and Abelson, A. (2015). Collapse of the echinoid Paracentrotus lividus populations in the Eastern Mediterranean-result of climate change? Sci. Rep. 5, 13479–13479. doi: 10.1038/srep13479
Zhang, H., Shin, P. K. S., and Cheung, S. G. (2015). Physiological responses and scope for growth upon medium-term exposure to the combined effects of ocean acidification and temperature in a subtidal scavenger Nassarius conoidalis. Mar. Environ. Res. 106, 51–60. doi: 10.1016/j.marenvres.2015.03.001
Zhang, H., Shin, P. K. S., and Cheung, S. G. (2016). Physiological responses and scope for growth in a marine scavenging gastropod, Nassarius festivus (Powys, 1835), are affected by salinity and temperature but not by ocean acidification. ICES J. Mar. Sci. 73, 814–824. doi: 10.1016/j.marenvres.2015.03.001
Keywords: climate change, metabolic rate, scope for growth, ocean acidification, ocean warming, transgeneration, Echinoidea, Echinodermata
Citation: Harianto J, Aldridge J, Torres Gabarda SA, Grainger RJ and Byrne M (2021) Impacts of Acclimation in Warm-Low pH Conditions on the Physiology of the Sea Urchin Heliocidaris erythrogramma and Carryover Effects for Juvenile Offspring. Front. Mar. Sci. 7:588938. doi: 10.3389/fmars.2020.588938
Received: 29 July 2020; Accepted: 14 December 2020;
Published: 21 January 2021.
Edited by:
Jonathan Y. S. Leung, University of Adelaide, AustraliaReviewed by:
Mary A. Sewell, The University of Auckland, New ZealandKaren Chan, Swarthmore College, United States
Narimane Dorey, UMR8539 Laboratoire de météorologie Dynamique (LMD), France
Copyright © 2021 Harianto, Aldridge, Torres Gabarda, Grainger and Byrne. This is an open-access article distributed under the terms of the Creative Commons Attribution License (CC BY). The use, distribution or reproduction in other forums is permitted, provided the original author(s) and the copyright owner(s) are credited and that the original publication in this journal is cited, in accordance with accepted academic practice. No use, distribution or reproduction is permitted which does not comply with these terms.
*Correspondence: Maria Byrne, bWFyaWEuYnlybmVAc3lkbmV5LmVkdS5hdQ==