 Fabiana Novellino1*
 María Eugenia López2,3,4
 Maria Grazia Vaccaro5
 Yus Miguel6
 María Luisa Delgado2
 Fernando Maestu2,3,4
- 1Neuroimaging Research Unit, Institute of Bioimaging and Molecular Physiology, National Research Council, Catanzaro, Italy
- 2Department of Experimental Psychology, Universidad Complutense de Madrid, Madrid, Spain
- 3Laboratory of Cognitive and Computational Neuroscience, Center for Biomedical Technology, Madrid, Spain
- 4Networking Research Center on Bioengineering, Biomaterials and Nanomedicine (CIBER-BBN), Madrid, Spain
- 5Institute of Neurology, University Magna Graecia, Catanzaro, Italy
- 6Radiology Department, San Carlos Clinical Hospital, Madrid, Spain
Objective: Although, the apolipoprotein E (APOE) genotype is widely recognized as one of the most important risk factors for Alzheimer's disease (AD) development, the neural mechanisms by which the ε4 allele promotes the AD occurring remain under debate. The aim of this study was to evaluate neurobiological effects of the APOE-genotype on the pattern of the structural covariance in mild cognitive impairment (MCI) subjects.
Methods: We enrolled 95 MCI subjects and 49 healthy controls. According to APOE-genotype, MCI subjects were divided into three groups: APOEε4 non-carriers (MCIε4−/−, n = 55), APOEε4 heterozygous carriers (MCIε4+/−, n = 31), and APOEε4 homozygous carriers (MCIε4+/+, n = 9) while all controls were APOEε4 non-carriers. In order to explore their brain structural pattern, T1-weighted anatomical brain 1.5-T MRI scans were collected. A whole-brain voxel-based morphometry analysis was performed, and all significant regions (p < 0.05 family-wise error, whole brain) were selected as a region of interest for the structural covariance analysis. Moreover, in order to evaluate the progression of the disease, a clinical follow-up was performed for 2 years.
Results: The F-test showed in voxel-based morphometry analysis a strong overall difference among the groups in the middle frontal and temporal gyri and in the bilateral hippocampi, thalami, and parahippocampal gyri, with a grading in the atrophy in these latter three structures according to the following order: MCIε4+/+ > MCIε4+/− > MCIε4−/− > controls. Structural covariance analysis revealed a strong structural association between the left thalamus and the left caudate and between the right hippocampus and the left caudate (p < 0.05 family-wise error, whole brain) in the MCIε4 carrier groups (MCIε4+/+ > MCIε4+/−), whereas no significant associations were observed in MCIε4−/− subjects. Of note, the 38% of MCIs enrolled in this study developed AD within 2 years of follow-up.
Conclusion: This study improves the knowledge on neurobiological effect of APOE ε4 in early pathophysiological phenomena underlying the MCI-to-AD evolution, as our results demonstrate changes in the structural association between hippocampal formation and thalamo-striatal connections occurring in MCI ε4 carriers. Our results strongly support the role of subcortical structures in MCI ε4 carriers and open a clinical window on the role of these structures as early disease markers.
Introduction
Individuals with mild cognitive impairment (MCI) have an increased risk of developing Alzheimer's disease (AD) compared to cognitively intact older people (1). There is a broad consensus that MCI subjects offer a potential model to understand factors involved in development of full-blown AD, before irreversible brain damage or mental decline has occurred.
Understanding neurobiological mechanisms happening in disease progression remains a priority of the scientific community, with the aim to create new intervention strategies for AD.
However, at present, the particular pathophysiological phenomena underlying the evolution across the MCI-to-AD continuum remain undetermined. Moreover, the risk factor action, which differently works in determining the pathophysiology of the disease, further adds complexity to the model.
One of the greatest risk factors is the apolipoprotein E (APOE) haplotype. The ε4 allele is present with a higher frequency in sporadic AD subjects than in the normal population (2, 3), and may interact with age at onset in modulating the clinical phenotype (4, 5). Indeed, the effect of the APOE ε4 genotype has been reported to be more deleterious in younger subjects, with accelerated rates of brain atrophy in regions particularly susceptible to deposition of neurofibrillary tangles and neuronal loss (6, 7). Less clear is how the APOE ε4 allele could act in modulating the expression of the disease, especially in early pathogenetic processes. Converging evidence from various pathological and in vivo studies suggests a region-specific effect of the ε4 allele on brain atrophy (8–13). Indeed, a gray matter (GM) loss selectively localized in the hippocampus, entorhinal cortex, and temporal pole (11), with relatively preserved volumes in the orbito-frontal cortex (11, 12, 14), has been reported in MCI– APOE ε4 carries. On the other hand, a growing body of evidence suggests that AD pathology propagates stepwise over time, following a specific topological pattern and involving large-scale brain networks (15, 16) rather than a focal brain region (17–19).
Based on the observation that related regions covary in morphometric characteristics, recent neuroimaging advances suggested that the study of anatomical structural covariance could represent a valuable tool to investigate the topological organization of the brain (20), providing complementary information to functional connectivity techniques. This approach was recently applied to AD subjects, providing critical support to the hypothesis that early disruptions in structural covariance between associative cortices and the entorhinal area could determine a disconnection potentially responsible to the clinical signs of AD (21). Moreover, a recent structural covariance study demonstrated that the pattern of structural association between the hippocampus and the rest of the brain differs as a function of APOE genotype in healthy young adults (22). This suggests that APOE genotype has an impact on topological organization of the brain.
Therefore, it could be hypothesized that differences in connectivity among regions differently affected by degenerative phenomena may underlie the different susceptibility to the development of AD in subjects with different APOE haplotype. At present, structural covariance approach has never been performed in subjects with MCI and different APOE genotype.
With the purpose to explore this hypothesis, the present study was designed to evaluate neurobiological effects of the APOE genotype in MCI subjects in terms of the degree of gray atrophy and structural covariance of specific brain areas differently affected, according to their APOE haplotype.
Materials and Methods
Subjects
Forty-nine healthy elders and 95 MCI patients were recruited from the Hospital Universitario San Carlos (Madrid, Spain) and from the Seniors Center of the District of Chamartín (Madrid, Spain). All subjects were right handed (23) and native Spanish speakers. Demographic and clinical data are shown in Table 1.
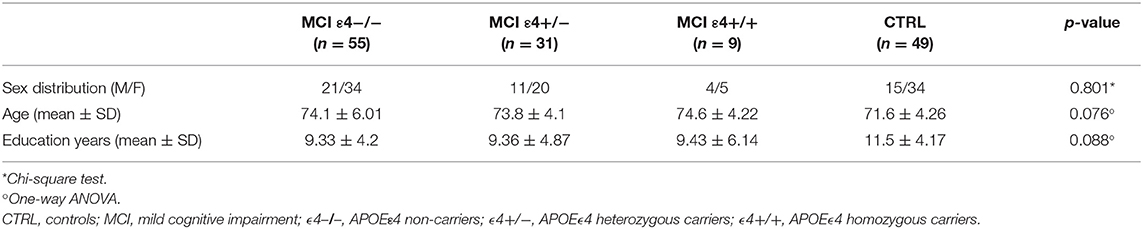
Table 1. Clinical and demographic characteristics in MCI patients and healthy controls.
All participants were screened using the following standardized diagnostic instruments: The Mini Mental State Examination (24), the Global Deterioration Scale (25), and the functional assessment questionnaire (FAQ) (26). In addition, they also received an exhaustive neuropsychological assessment that included: Clock Drawing Test (27), Direct and Inverse Digit Span Test [Wechsler Memory Scale Revised (WMS-III)] (28), Immediate and Delayed Recall (Wechsler Memory Scale Revised) (28), Phonemic and Semantic Fluency (Controlled Oral Word Association Test) (29), Rule Shift Cards (Behavioral Assessment of the Dysexecutive Syndrome) (30), Visual Object and Space Perception Test (31), Boston Naming Test (32), and Trail Making Test parts A and B (33).
The MCI diagnosis was established according to the National Institute on Aging–Alzheimer Association criteria (34), which consists of the following: (i) self- or informant-reported cognitive complaints, (ii) objective evidence of impairment in one or more cognitive domains, (iii) preserved independence in functional abilities, and (iv) not demented (35). Besides meeting the clinical criteria, MCI participants exhibited a loss of hippocampal volume and therefore were categorized as “MCI due to AD” with an intermediate likelihood.
All participants were in good health, with no significant medical, neurological, or psychiatric diseases (other than MCI). General inclusion criteria considered an age between 65 and 85 years, with a normal MRI, without indication of infection, infarction, or focal lesions (rated by two independent experiences radiologists) (36, 37).
The 95 MCI subjects were classified according their APOE genotype: APOEε4 non-carriers (MCIε4−/−, n = 55), APOEε4 heterozygous carriers (MCIε4+/−, n = 31), and APOEε4 homozygous carriers (MCIε4+/+, n = 9). Due to the low frequency of the APOE ε4 genotype in the population of healthy controls (2), we limited the enrollment to healthy APOE ε4 non-carriers.
All MCI subjects underwent a clinical evaluation every 6 months for 2 years in order to evaluate their clinical progression.
The present study was approved by the Hospital Universitario San Carlos Ethics Committee (Madrid, Spain) in conformity to the Declaration of Helsinki, and all participants signed a written informed consent prior to their participation.
MRI Acquisition
3D T1-weighted anatomical brain MRI scans were collected with a General Electric 1.5-T MRI scanner using a high-resolution antenna and a homogenization PURE filter (Fast Spoiled Gradient Echo sequence with the following parameters: repetition time/echo time/inversion time, 11.2/4.2/450 ms; flip angle, 12°; 1-mm slice thickness; a 256 × 256 matrix; and field of view, 25 cm).
APOE Genotype
Genomic DNA was extracted from 10 ml blood samples in ethylenediaminetetraacetic acid. APOE haplotype was determined by analyzing single nucleotide polymorphisms rs7412 and rs429358 genotypes with TaqMan assays using an Applied Biosystems 7900 HT Fast Real Time PCR machine (Applied Biosystems, Foster City, CA). A genotyping call rate over 90% per plate, sample controls for each genotype, and negative sample controls were included in each assay. Three well-differentiated genotyping clusters for each single nucleotide polymorphism were required to validate results. Intra- and inter-plate duplicates of several DNA samples were included (38). According to the presence or absence of the ε4 allele, participants were classified as APOEε4 heterozygous (MCIε4+/−) and homozygous carriers (MCIε4+/+), or non-carriers (MCIε4−/−) (see Table 1).
MRI Study Design and Statistical Analysis
First, we looked for structural differences between the MCIs and controls in GM by using voxel-based morphometry (VBM) in the whole brain, with no a priori region of interest (ROI). Then, we examined differences in network structural covariance. Those brain areas in which we found significant GM differences among groups by using VBM were selected as ROIs for structural covariance analysis. For both VBM and structural covariance approaches, we set the significance threshold at p < 0.05 with family-wise error (FWE) correction for multiple comparisons in the whole brain. Finally, with the aim to evaluate any association between clinical and neuropsychological variables and the significant clusters in both VBM and structural covariance analysis, we performed a Pearson's correlation analysis. For each subject, the mean values of GM intensity were extracted from each significant cluster in VBM analysis and then correlated with cognitive scores. To explore the relationship between structural covariance patterns and cognitive performance, individual brain scores for each significant cluster in the structural covariance analysis were extracted and then correlated with the neuropsychological scores. Correlational analysis was done separately for each group. Due to the number of tests conducted, the Bonferroni correction for multiple comparisons was calculated.
We evaluated differences among groups in the categorical variables (sex distribution, proportion of patients with disease progression) using the chi-square test. The Shapiro-Wilk test was used to check for normality before performing comparisons between continuous variables. Based on the results of this test, we used the one-way ANOVA, followed by the unpaired t-test corrected by Bonferroni, to assess differences among groups in age and education.
We used a multivariate analysis for neuropsychological scores. The assumption check for multivariate normality was tested through the Q-Q plot. Based on the results of this test, we performed the multivariate analysis of variance (MANOVA), followed by the Tukey's test for the post-hoc comparison. A series of MANOVAs were performed, one for each cognitive domain (general areas, memory, frontal/executive, language and visuospatial measures), using the group status (i.e., MCIε4−/− MCIε4+/−, MCIε4+/+, control) as the independent factor. Measures of effect size were expressed as partial eta square (η2) values. Statistical significance was set at p < 0.05.
VBM
Data were processed and examined using the SPM8 software (Wellcome Trust Center for Neuroimaging, London, UK), running under MATLAB R2010b (The MathWorks, Inc.).
The structural images were pre-processed using the VBM8 toolbox (http://dbm.neuro.uni-jena.de/vbm.html). Default parameters incorporating the DARTEL toolbox were used to obtain a high-dimensional normalization protocol. Images were bias-corrected, tissue classified, and registered using linear (12-parameter affine) and non-linear transformations (warping), within a unified model. Subsequently, the warped GM segments were affine transformed into Montreal Neurological Institute (MNI) space and were scaled by the Jacobian determinants of the deformations (modulated GM volumes). Finally, the modulated volumes were smoothed with a Gaussian kernel of 8-mm full width at half maximum. The GM volume maps were statistically analyzed using the general linear model based on Gaussian random field theory.
The individual smoothed-normalized GM maps were entered into a second-level general linear model ANOVA to obtain SPM-F maps that investigated the main effect of group (i.e., MCIε4−/−, MCIε4–/+, MCIε4+/+, and the control group) and to detect morphological differences in GM among all groups.
To remove the variance percentage related to variables of non-interest that could interfere with group differences such as age, gender, years of education, and individual total intracranial volume; they were included in the model as covariates of non-interest.
Structural Covariance Analysis
The regions significantly different among groups by using VBM were selected as ROIs for structural covariance analysis. To investigate the network structural covariance, regional GM volumes of each ROI were extracted from the pre-processed images. The MNI coordinates for the ROIs were defined using a threshold of p < 0.05 FWE (whole brain) using a 4-mm sphere centered on the MNI coordinates derived from VBM results (Table 3). Image processing was carried out based on a previous reported protocol (21).
Separate correlation analyses were performed by entering the extracted GM volumes from each ROI as a covariate of interest. The statistical model included covariates indicating each subject's gender, age, years of education, and intracranial volume values. First, the four groups were separately modeled in all of the analyses, in order to identify for each ROI which voxels expressed a positive correlation within each group. Then, we obtained correlation maps for each group that were thresholded at p < 0.05, corrected for FWE, and displayed on a standard brain template to allow qualitative comparisons between the groups. Furthermore, statistical contrasts were set to identify, for each ROI, voxels that expressed differences in the regression slopes among groups. We considered these differences in slopes as the differences in “structural association.” Specific ANOVA contrasts were established to map the voxels that expressed a different structural association strength among groups. The threshold for the resulting statistical parametric maps was established at a voxel-wise at p < 0.05 FWE-corrected for multiple comparisons. In addition, for a less conservative exploration of the results, we investigated whether additional regions resisted at a threshold of p < 0.001 uncorrected, >15 contiguous voxels.
Results
Clinical and Neuropsychological Findings
Demographical characteristics for each group, as well as the differences among groups, are shown in Table 1. Sex distribution, age at examination, and education level did not reached statistical significance among groups.
The detailed scores totalized in the complete neuropsychological battery as well as the MANOVAs (F-test, p-values, Wilk's lambda, and η2 values) are shown in Table 2.
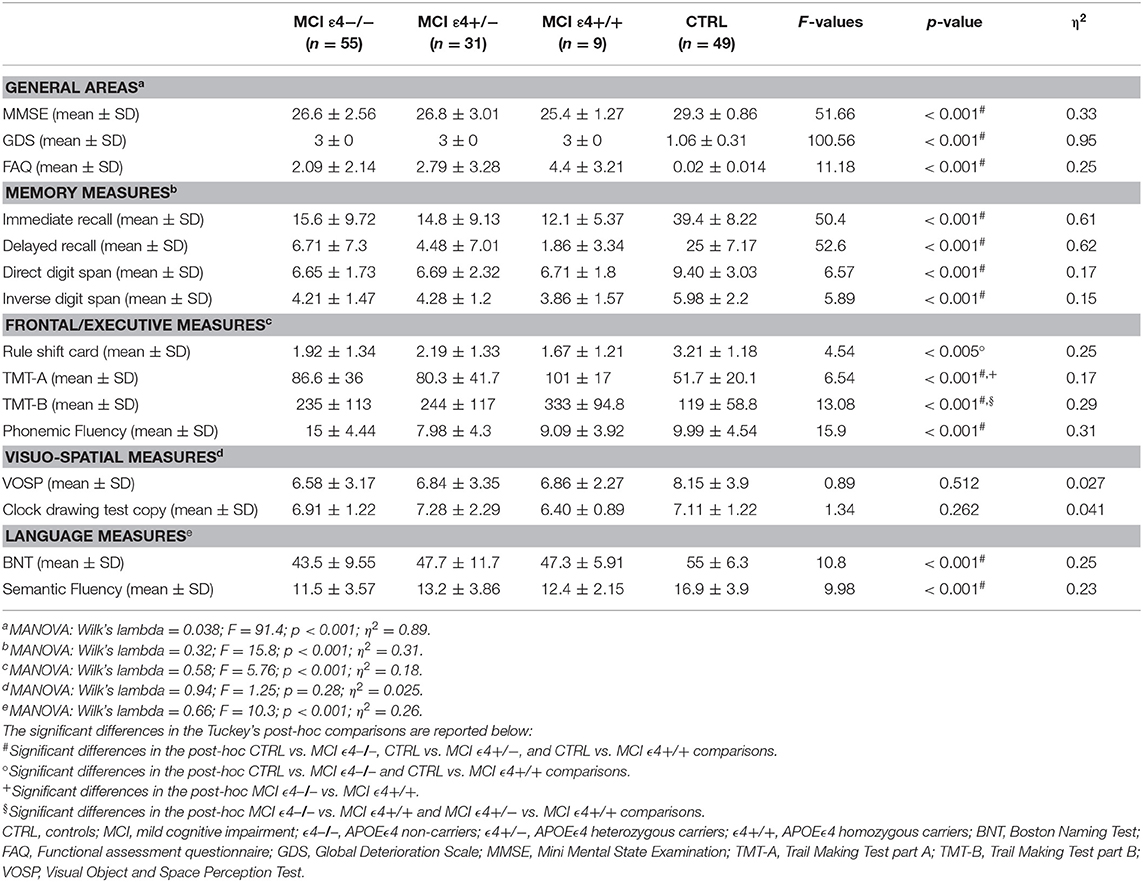
Table 2. Neuropsychological scores in MCI patients and healthy controls.
MCI subjects showed significantly lower scores than did the controls in almost all cognitive tests, with the exception of clock drawing copy test and Visual Object and Space Perception Test. The post-hoc analyses revealed that the three MCI groups differed in attentional and executive function (Trail Making Test A: MCIε4−/− vs. MCIε4+/+, p = 0.038; Trail Making Test B: MCIε4−/− vs. MCIε4+/+, p = 0.024; MCIε4+/− vs. MCIε4+/+, p = 0.036), in which MCIε4 carriers performed worse (MCIε4+/+ > MCIε4+/−).
The clinical 2-year follow-up revealed that 36 out of 95 (about 38%) MCIs developed AD: 17 out of 56 (30%) patients in the MCIε4−/− group, 15 out of 32 (47%) in the MCIε4+/− group, and 3 out of 9 (34%) in the MCIε4+/+ group. The difference in the frequencies of patients who progressed to dementia was not statistically significant among the three MCI groups (χ2 = 2.66, p = 0.26).
Differences Among Groups in VBM
Whole-brain VBM analysis revealed significant differences among groups in the following regions: right (x = −18; y = −7.5; z = −12) and left (x = 27; y = −12; z = −15) hippocampus, right (x = 8; y = −22.5; z = 8.1) and left (x = −3; y = −13.5; z = 3) thalamus, right (x = 24; y = −33; z = −1.5) and left (x = −20; y = −36; z = 3) parahippocampal gyrus, right middle frontal gyrus (x = 45; y = 38; z = 22), the orbital portion of the left middle frontal gyrus (x = −32; y = 56; z = −10), and right middle temporal gyrus (x = 62; y = −12; z = −9). The spatial extension and the significance of the single clusters are shown in Table 3 and in Figure 1. We found a grading in the atrophy of GM of the hippocampus, parahippocampal gyrus, and thalamus, ordered as follows: MCIε4+/+ > MCIε4+/− > MCIε4−/− > controls. The mean differences are shown in Figure 2. On the contrary, within the right and the left middle frontal gyrus, the GM atrophy observed in MCIε4−/− was more marked than the MCIε4+/− and MCIε4+/+ groups (Figure 2).
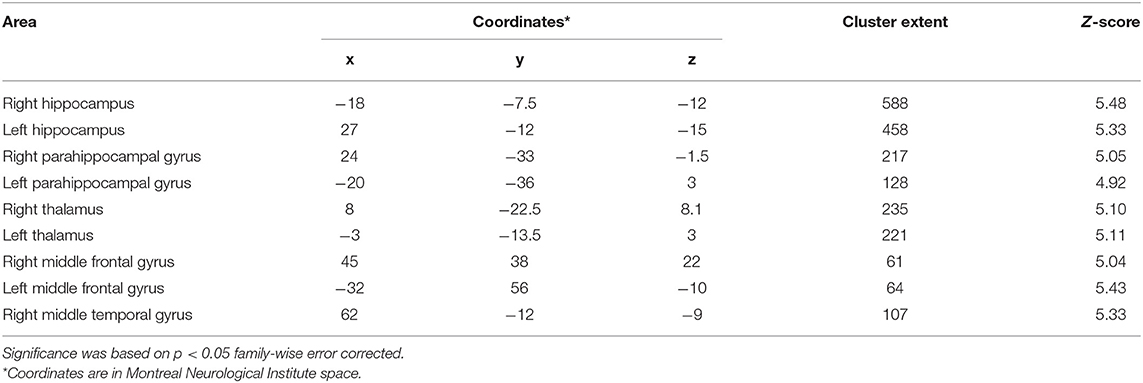
Table 3. Anatomical regions with significant differences among MCI ε4–/–, MCI ε4+/−, MCI ε4+/+ patients and control subjects in voxel-based morphometry analysis.
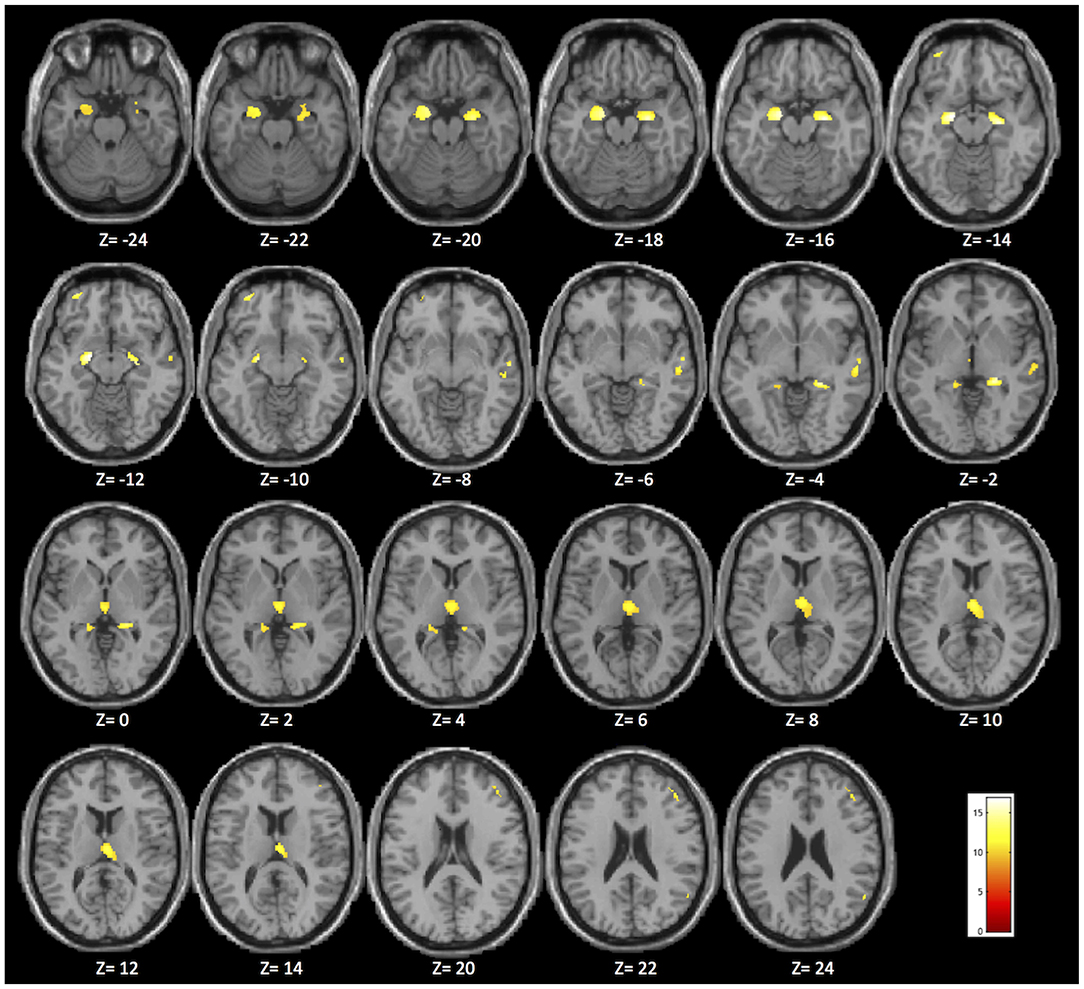
Figure 1. Brain areas in which significant differences were found among the MCIε4+/+, MCIε4+/−, MCIε4−/−, and control groups in the whole-brain voxel-based morphometry (VBM) analysis (p < 0.05 family-wise error (FWE) correction for multiple comparisons in the whole brain). The significant regions are superimposed on a standard template, with Montreal Neurological Institute (MNI) coordinates indicated at the bottom of each slice.

Figure 2. Plots depicting mean differences among groups within region of statistical significance in VBM analysis: right (A) and left (B) hippocampus; right (C) and left (D) parahippocampal gyrus; right (E) and left (F) thalamus, left (G) and right (H) middle frontal gyrus, and right middle temporal gyrus (I).
Differences Among Groups in Structural Covariance Association
We used seed-based structural covariance analyses to map the differences in pattern of structural covariance among the MCI (ε4–/–, ε4+/−, ε4+/+) and control groups. At the pre-established statistical threshold, an increased structural association between both the right hippocampus and the left caudate nucleus (x = −12; y = 6; z = 18; cluster size: 313), and the left thalamus and the left caudate nucleus (x = −12; y = 7.5; z = 16.5; cluster size: 203) was observed in both the MCIε4-carrier groups (Figures 3, 4; Supplementary Figures 1, 2). Moreover, this association was greater with increasing the dose of ε4 allele, being greater in homozygous (MCIε4+/+) than in heterozygous MCI carriers (MCIε4+/−). No significant differences, surviving at the statistical threshold, were obtained in the structural covariance starting from the other seed ROIs.
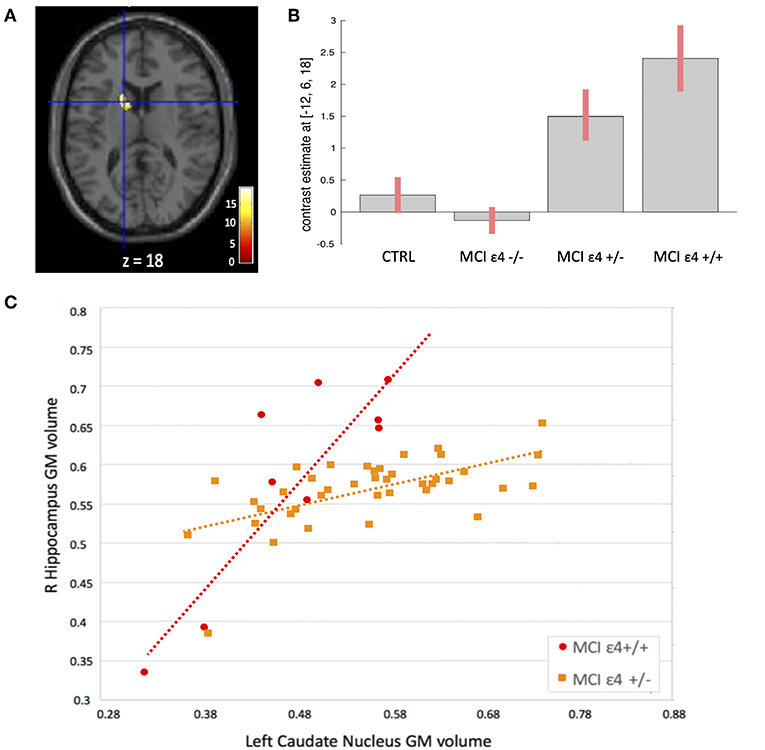
Figure 3. (A) Voxels that expressed the difference in structural association between the right hippocampus and the left caudate nucleus among the groups. (B) Plots depicting mean differences among the groups within region of statistical significance in structural covariance analysis. (C) Correlations between gray matter (GM) volumes extracted from 4-mm radius sphere centered on the ROI and the peak voxel expressing increased structural association in the MCIε4+/+ and in MCIε4+/− groups.
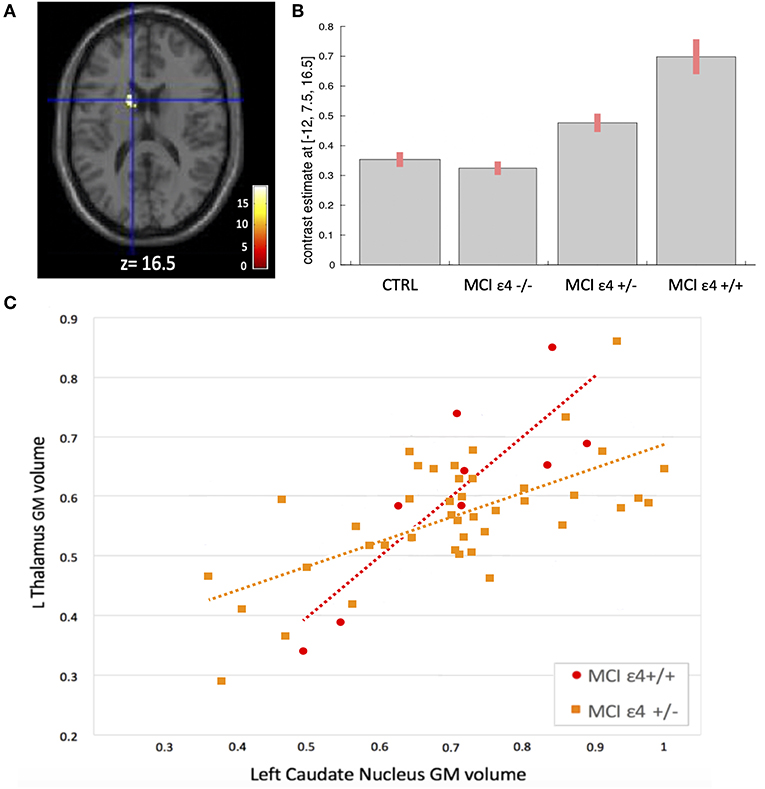
Figure 4. (A) Voxels that expressed the difference in structural association between the left thalamus and the left caudate nucleus among the groups. (B) Plots depicting mean differences among the groups within region of statistical significance in structural covariance analysis. (C) Correlations between GM volumes extracted from 4-mm radius sphere centered on the ROI and the peak voxel expressing increased structural association in the MCIε4+/+ and in MCIε4+/− groups.
In addition, when we evaluated the results at a lower statistical threshold, we found differences among groups in the structural association between all the selected ROIs and a number of brain regions (highly recurring among the ROIs) including the caudate nucleus, fusiform gyrus, cingulum, precuneus, angular gyrus, superior and middle frontal, and temporal gyrus. The detailed results of differences among all groups with and without FWE correction are shown in Supplementary Tables 1–9.
Relationship Between Clinical Findings and Structural Parameters
We performed regression analyses to investigate whether critical clinical and neuropsychological variables influenced the detected GM abnormalities in both VBM and structural covariance analysis.
Although present at the trend level, there were no significant correlations after the correction for multiple comparisons.
Discussion
The present study investigated how APOE genotype modulated the whole-brain large-scale structural networks in MCI subjects. By using a double VBM and structural covariance mapping approach, we were able to demonstrate that MCIε4 carriers displayed a pronounced atrophy in specific regions including the thalamus and the hippocampus, and that both regions had strong structural covariance association with the left caudate nucleus. These findings suggest that the ε4 allele may affect the regional atrophy processes, resulting in a distinct picture in which the interaction among the hippocampus, thalamus, and caudate nucleus plays a peculiar and crucial role.
Our study demonstrates that there is a dose-dependent effect of the APOE genotype on the regional brain atrophy. Moreover, MCI ε4 carriers showed a pronounced degree of atrophy in the mesial temporal structures (hippocampus and parahippocampal gyrus), according to the dose of ε4 allele (MCIε4+/+ > MCIε4+/− > MCIε4−/−). On the contrary, MCI ε4 carriers had a relative preservation of the right and left middle frontal gyrus, in which the MCIε4−/− group showed the most pronounced changes. This evidence is in agreement with previous studies (11–14). Moreover, our results add the novel finding that also a subcortical structure, the thalamus, shared the same APOE dose-dependent effect with temporo-mesial structures, showing a more pronounced GM loss in MCIε4 homozygous carriers. However, the main novelty of this study was derived from structural covariance analysis showing a strong structural association between both the hippocampus and the thalamus (the regions with the most pronounced volume loss) and the caudate nucleus in ε4 carriers, mainly in MCIε4+/+ patients.
The results of this study provided interesting new insight into AD-related pathophysiology, pointing out the role of subcortical structures in MCI subjects carrying the APOEε4 allele, one of the most important risk factors for AD developing. These results raise some questions.
First, what is the meaning of the involvement of the subcortical structures in early AD pathophysiology.
In recent years, growing interest has been aroused by subcortical structures in AD, and a number of studies that underline the importance of these regions in early stages of the disease have been recently published. Convincing evidence is derived from studies conducted in AD mutation carriers in pre-symptomatic stages. Indeed, changes within the striatum and thalamus of these subjects have been reported throughout structural MRI studies (39–42) and functional PET experiments assessing the amyloid deposition (43–47). This demonstrates that the subcortical involvement in genetic AD is a peculiar and early phenomenon.
More challenging is to understand the role of thalamus and basal ganglia in sporadic AD.
Subcortical structures exhibit amyloid deposition in sporadic AD patients in pathological (15, 48) and in vivo PET studies (49, 50). This suggests a role of these regions also in this form of AD, although findings coming from MRI studies are not always univocal. Indeed, although the reduction of caudate and thalamus volumes has been previously described in the progression of MCI to AD (51–53), this evidence has not been found in another study, in which the putamen (but neither the thalamus nor the caudate nuclei) showed a volumetric loss in AD (54). Regarding the role of APOE genotype, interesting findings came from both structural and functional MRI studies. Changes in the caudate nucleus were found in APOE ε4 carriers compared with non-carriers healthy middle-aged adults (55), while intact APOE ε4 carriers showed reduced hippocampal connectivity with several brain regions (including the thalamus and caudate nuclei) compared with non-carriers (56). These findings (56) were related to the episodic memory performance.
In this debate, our results provide critical support to the hypothesis that the APOE genotype modulates the pattern of structural changes in MCI subjects. In particular, our findings suggest that in the ε4-carriers the caudate nucleus and the thalamus play a key role, along with the hippocampus, to trigger changes in the earliest stages of the disease. Our results indicate that, although pathophysiological model of AD has concentrated on cortical mechanisms, subcortical dysfunctions strongly contribute to the distinctive changes occurring in MCI ε4 carriers.
Another question regards the meaning of the intra-hemispheric structural correlation we found between the left thalamus and the left caudate and the inter-hemispheric between the right hippocampus and the left caudate.
The interaction between the ipsilateral thalamus and caudate has been broadly described in the context of the semantic memory retrieval circuit. This pathway, which include the cortical (mainly SMA) and subcortical (thalamus–caudate) circuitry, is engaged for complex, controlled semantic search and retrieval mechanisms (57). These operations include rule-based categorization, high-order categorization tasks, sentence comprehension with metaphor abstraction, category-driven word generation, and second language phonemic search (58–61). The left hemisphere in which we found the structural association can take on this interpretation given the prominent role of the left hemisphere in language skills.
The structural association we found between the right hippocampus and the left caudate indicates an inter-hemispheric interaction between these regions. This is quite surprising given that a large amount of studies described the ipsilateral interaction between the hippocampus and the caudate nucleus as critically involved in the map-based spatial memory, in navigation ability, and in decision making (62–64). However, due to the complexity in the hippocampal functional organization, the study of intra- and inter-hemispheric connections of hippocampus has aroused growing curiosity. A recent meta-analysis applied to high-resolution functional and structural neuroimaging studies demonstrated that the right anterior hippocampus had contralateral connection with a number of regions within large, distributed networks, including the head of caudate nucleus, and that these connections are engaged in high-order, complex task-processing (65). In addition, a study focused on the role of intrinsic hippocampal-caudate interaction in the human navigation, demonstrating that both ipsilateral and contralateral interactions showed significantly positive correlation with individual's navigation ability (66). Thus, the contralateral interaction between the hippocampus and the caudate we found could be interpreted in the context of these findings suggestive of a complex intra- and inter-hemispheric specialization of the hippocampus. This evidence is interesting also in light of the emerging pathogenetic hypothesis proposed for AD, which is now currently modeled as a disease that lead, since in the earliest stages, dysfunction within large-scale brain networks (21). The additional exploratory evaluation of the structural covariance we performed also shows results that go in this direction, revealing changes in structural association within large-scale brain areas (described in Supplementary Material), consistent with the default mode network (67) and the caudate–fusiform circuit (68).
Follow-up evaluation further heightens the strength of our results. Indeed, based on the clinical follow-up of the enrolled MCIs, we know that 36 out of the 95 patients (38%) developed AD after 2 years. Therefore, we can reasonably hypothesize that the structural changes we observed are early phenomena in the progression of the disease. The proportion of patients who progressed to dementia was not statistically different among the three MCI groups, although the frequency of converting subjects was higher in the MCIε4+/− group. This is probably due to the relatively short duration of the clinical follow-up, which in this study was 2 years. Although present at the trend level, no correlation survived the correction for multiple comparisons. This is probably a consequence of the rigorous statistical correction we have applied and to the small number of patients, especially the MCI homozygotes group.
It should be noted that this is a preliminary study, which may be interpreted in the context of some limitations. Although the initial sample size was large (95 MCI subjects), when we divided the MCI based on APOE genotype, the three groups were non-perfectly balanced by number, being the sample size of MCIε4+/+ smaller than the other groups. However, this is reasonable considering the different allelic frequency in the population, and our numbers are in line with the prevalence of allelic variants found in the Spanish population (69). We acknowledge that it would be important to replicate our findings in a larger sample. However, it is remarkable that, despite the smaller number of subjects in the MCIε4+/+ group, we could detect significant differences at stringent thresholds. Moreover, the clinical features were very homogeneous in terms of age, gender, years of education, and cognitive tests, thus increasing the reliability and the clinical relevance of our findings. Finally, the clinical follow-up of our patients to assess the rate of evolution to AD represents a strength of our work.
Since this is the first study demonstrating a specific pattern of structural covariance in MCI subjects according to their APOE haplotype, our results represent an interesting starting point for future studies. It will be interesting to explore the interaction between the hippocampus and subcortical structures through other structural approaches employing different morphometric methods (70, 71) as well as through structural and functional neuronal connectivity, inferred from diffusion tensor imaging and resting state-functional MRI (72, 73).
In conclusion, our study demonstrates in vivo that subcortical structures may be involved in APOE-related pathophysiological phenomena with a dose-dependent effect. Our study opens a new horizon on the role of these structures as potential early disease markers.
Data Availability Statement
The datasets generated for this study are available on request to the corresponding author.
Ethics Statement
The present study was approved by the Hospital Universitario San Carlos Ethics Committee (Madrid, Spain) in conformity to the Helsinki Declaration and all participants signed a written informed consent prior to their participation. The patients/participants provided their written informed consent to participate in this study.
Author Contributions
FN contributed to the design of the study, drafting and revising the manuscript, and analysis and interpretation of the data. ML contributed to the data acquisition, draft writing, interpretation of results, and critical discussion of the manuscript. MV contributed to the analysis of the neuropsychological data, interpretation of results, and critical discussion of the manuscript. YM and MD contributed to the acquisition and analysis of the data and to the interpretation of results. FM contributed to the study concept/design, critical supervision of the article, and approval of the final version of the manuscript.
Funding
This study was supported by a project from the Spanish Ministry of Economy and Competitiveness (PSI2009-14415-C03-01) and from Madrid Neurocenter.
Conflict of Interest
The authors declare that the research was conducted in the absence of any commercial or financial relationships that could be construed as a potential conflict of interest.
Supplementary Material
The Supplementary Material for this article can be found online at: https://www.frontiersin.org/articles/10.3389/fneur.2019.01303/full#supplementary-material
References
1. Petersen RC. Mild cognitive impairment. Continuum. (2016) 22:404–18. doi: 10.1212/CON.0000000000000313
2. Kukull WA, Higdon R, Bowen JD, McCormick WC, Teri L, Schellenberg GD, et al. Dementia and Alzheimer disease incidence: a prospective cohort study. Arch Neurol. (2002) 59:1737–46. doi: 10.1001/archneur.59.11.1737
3. Saunders AM, Trowers MK, Shimkets RA, Blakemore S, Crowther DJ, Mansfield TA, et al. The role of apolipoprotein E in Alzheimer's disease: pharmacogenomic target selection. Acta Biochim Biophys. (2000) 1502:85–94. doi: 10.1016/S0925-4439(00)00035-1
4. van der Vlies AE, Pijnenburg YA, Koene T, Klein M, Kok A, Scheltens P, et al. Cognitive impairment in Alzheimer's disease is modified by APOE genotype. Dement Geriatr Cogn Disord. (2007) 24:98–103. doi: 10.1159/000104467
5. van der Flier WM, Pijnenburg YA, Fox NC, Scheltens P. Early-onset versus late-onset Alzheimer's disease: the case of the missing APOE ε4 allele. Lancet Neurol. (2011) 10:280–8. doi: 10.1016/S1474-4422(10)70306-9
6. Tang X, Holland D, Dale AM, Miller MI, Alzheimer's Disease Neuroimaging Initiative. APOE affects the volume and shape of the amygdala and the hippocampus in mild cognitive impairment and Alzheimer's disease: age matters. J Alzheimers Dis. (2015) 47:645–60. doi: 10.3233/JAD-150262
7. Chang YL, Fennema-Notestine C, Holland D, McEvoy LK, Stricker NH, Salmon DP, et al. APOE interacts with age to modify rate of decline in cognitive and brain changes in Alzheimer's disease. Alzheimers Dement. (2014) 10:336–48. doi: 10.1016/j.jalz.2013.05.1763
8. Polvikoski T, Sulkava R, Haltia M, Kainulainen K, Vuorio A, Verkkoniemi A, et al. Apolipoprotein E, dementia, and cortical deposition of beta-amyloid protein. N Engl J Med. (1995) 333:1242–47. doi: 10.1056/NEJM199511093331902
9. Tiraboschi P, Hansen LA, Masliah E, Alford M, Thal LJ, Corey-Bloom J. Impact of APOE genotype on neuropathologic and neurochemical markers of Alzheimer disease. Neurology. (2004) 62:1977–83. doi: 10.1212/01.WNL.0000128091.92139.0F
10. Nagy Z, Esiri MM, Jobst KA, Johnston C, Litchfield S, Sim E, et al. Influence of the apolipoprotein E genotype on amyloid deposition and neurofibrillary tangle formation in Alzheimer's disease. Neuroscience. (1995) 69:757–61. doi: 10.1016/0306-4522(95)00331-C
11. Hashimoto M, Yasuda M, Tanimukai S, Matsui M, Hirono N, Kazui H, et al. Apolipoprotein E epsilon 4 and the pattern of regional brain atrophy in Alzheimer's disease. Neurology. (2001) 57:1461–66. doi: 10.1212/WNL.57.8.1461
12. Pievani M, Rasser PE, Galluzzi S, Benussi L, Ghidoni R, Sabattoli F, et al. Mapping the effect of APOE epsilon4 on gray matter loss in Alzheimer's disease in vivo. Neuroimage. (2009) 45:1090–8. doi: 10.1016/j.neuroimage.2009.01.009
13. Alexander GE, Bergfield KL, Chen K, Reiman EM, Hanson KD, Lin L, et al. Gray matter network associated with risk for Alzheimer's disease in young to middle-aged adults. Neurobiol Aging. (2012) 33:2723–32. doi: 10.1016/j.neurobiolaging.2012.01.014
14. Geroldi C, Pihlajamäki M, Laakso MP, DeCarli C, Beltramello A, Bianchetti A, et al. APOE-epsilon4 is associated with less frontal and more medial temporal lobe atrophy in AD. Neurology. (1999) 53:1825–32. doi: 10.1212/WNL.53.8.1825
15. Braak H, Braak E. Neuropathological staging of Alzheimer-related changes. Acta Neuropathol. (1991) 82:239–59. doi: 10.1007/BF00308809
16. Corder EH, Woodbury MA, Volkmann I, Madsen DK, Bogdanovic N, Winblad B. Density profiles of Alzheimer disease regional brain pathology for the Huddinge brain bank: pattern recognition emulates and expands upon Braak staging. Exp Gerontol. (2000) 35:851–64. doi: 10.1016/S0531-5565(00)00147-9
17. Delbeuck X, Van der Linden M, Collette F. Alzheimer's disease as a disconnection syndrome? Neuropsychol Rev. (2003) 13:79–92. doi: 10.1023/A:1023832305702
18. Palop JJ, Chin J, Mucke L. A network dysfunction perspective on neurodegenerative diseases. Nature. (2006) 443:768–73. doi: 10.1038/nature05289
19. Reid AT, Evans AC. Structural networks in Alzheimer's disease. Eur Neuropsychopharmacol. (2013) 23:63–77. doi: 10.1016/j.euroneuro.2012.11.010
20. Alexander-Bloch A, Giedd JN, Bullmore E. Imaging structural covariance between human brain regions. Nat Rev Neurosci. (2013) 14:322–36. doi: 10.1038/nrn3465
21. Montembeault M, Rouleau I, Provost JS, Brambati SM, Alzheimer's Disease Neuroimaging Initiative. Altered gray matter structural covariance networks in early stages of Alzheimer's disease. Cereb Cortex. (2016) 26:2650–62. doi: 10.1093/cercor/bhv105
22. Stening E, Persson J, Eriksson E, Wahlund LO, Zetterberg H, Söderlund H. Specific patterns of whole-brain structural covariance of the anterior and posterior hippocampus in young APOE ε4 carriers. Behav Brain Res. (2017) 326:256–64. doi: 10.1016/j.bbr.2017.03.013
23. Oldfield RC. The assessment and analysis of handedness: the Edinburgh inventory. Neuropsychologia. (1971) 9:97–113. doi: 10.1016/0028-3932(71)90067-4
24. Lobo A, Ezquerra J, Gómez BF, Sala J, Seva DA. Cognocitive mini-test (a simple practical test to detect intellectual changes in medical patients). Actas Luso Esp Neurol Psiquiatr Cienc Afines. (1979) 7:189–202.
25. Reisberg B, Ferris SH, de Leon MJ, Crook T. The global deterioration scale for assessment of primary degenerative dementia. Am J Psychiatry. (1982) 139:1136–39. doi: 10.1176/ajp.139.9.1136
26. Pfeffer RI, Kurosaki TT, Harrah CH, Chance JM, Filos S. Measurement of functional activities in older adults in the community. J Gerontol. (1982) 37:323–29. doi: 10.1093/geronj/37.3.323
27. Agrell B, Dehlin O. The clock-drawing test. Age Ageing. (1998) 27:399–403. doi: 10.1093/ageing/27.3.399
28. Wechsler D. Wechsler Memory Scale-Third Edition Manual. (San Antonio, TX: The Psychological Corporation) (1997).
29. Benton AL, Hamsher K. Multilingual Aphasia Examination Manual. 2nd Ed. Iowa City, IA: University of Iowa (1989).
30. Norris G, Tate RL. The behavioural assessment of the dysexecutive syndrome (BADS): ecological, concurrent and construct validity. Neuropsychol Rehabil. (2000) 10:33–45. doi: 10.1080/096020100389282
31. Warrington E, James M. The Visual Object and Space Perception Battery. Bury St. Edmunds: Thames Valley Test Company (1991).
32. Kaplan E, Goodglass H, Weintraub S. The Boston Naming Test. Philadelphia, PA: Lea and Febiger (1983).
33. Reitan R. Validity of the Trail Making test as an indicator of organic brain damage. Percept Mot Ski. (1958) 8:271–76. doi: 10.2466/pms.1958.8.3.271
34. Albert MS, DeKosky ST, Dickson D, Dubois B, Feldman HH, Fox NC, et al. The diagnosis of mild cognitive impairment due to Alzheimer's disease: recommendations from the National Institute on Aging-Alzheimer's Association workgroups on diagnostic guidelines for Alzheimer's disease. Alzheimers Dement. (2011) 7:270–79. doi: 10.1016/j.jalz.2011.03.008
35. McKhann GM, Knopman DS, Chertkow H, Hyman BT, Jack CR Jr, Kawas CH, et al. The diagnosis of dementia due to Alzheimer's disease: recommendations from the National Institute on Aging-Alzheimer's Association workgroups on diagnostic guidelines for Alzheimer's disease. Alzheimers Dement. (2011) 7:263–9. doi: 10.1016/j.jalz.2011.03.005
36. Bai F, Shu N, Yuan Y, Shi Y, Yu H, Wu D, et al. Topologically convergent and divergent structural connectivity patterns between patients with remitted geriatric depression and amnestic mild cognitive impairment. J Neurosci. (2012) 32:4307–18. doi: 10.1523/JNEUROSCI.5061-11.2012
37. López ME, Bruña R, Aurtenetxe S, Pineda-Pardo JÁ, Marcos A, Arrazola J, et al. Alpha-band hypersynchronization in progressive mild cognitive impairment: a magnetoencephalography study. J Neurosci. (2014) 34:14551–9. doi: 10.1523/JNEUROSCI.0964-14.2014
38. Hixson JE, Vernier DT. Restriction isotyping of human apolipoprotein E by gene amplification and cleavage with HhaI. J Lipid Res. (1990) 31:545–8.
39. Fortea J, Sala-Llonch R, Bartrés-Faz D, Bosch B, Lladó A, Bargalló N, et al. Increased cortical thickness and caudate volume precede atrophy in PSEN1 mutation carriers. J Alzheimers Dis. (2010) 22:909–22. doi: 10.3233/JAD-2010-100678
40. Lee GJ, Lu PH, Medina LD, Rodriguez-Agudelo Y, Melchor S, Coppola G, et al. Regional brain volume differences in symptomatic and presymptomatic carriers of familial Alzheimer's disease mutations. J Neurol Neurosurg Psychiatry. (2013) 84:154–62. doi: 10.1136/jnnp-2011-302087
41. Ryan NS, Keihaninejad S, Shakespeare TJ, Lehmann M, Crutch SJ, Malone IB, et al. Magnetic resonance imaging evidence for presymptomatic change in thalamus and caudate in familial Alzheimer's disease. Brain. (2013) 136:1399–414. doi: 10.1093/brain/awt065
42. Sala-Llonch R, Lladó A, Fortea J, Bosch B, Antonell A, Balasa M, et al. Evolving brain structural changes in PSEN1 mutation carriers. Neurobiol Aging. (2015) 36:1261–70. doi: 10.1016/j.neurobiolaging.2014.12.022
43. Benzinger TL, Blazey T, Jack CR Jr, Koeppe RA, Su Y, Xiong C, et al. Regional variability of imaging biomarkers in autosomal dominant Alzheimer's disease. Proc Natl Acad Sci USA. (2013) 110:E4502–9. doi: 10.1073/pnas.1317918110
44. Klunk WE, Price JC, Mathis CA, Tsopelas ND, Lopresti BJ, Ziolko SK, et al. Amyloid deposition begins in the striatum of presenilin-1 mutation carriers from two unrelated pedigrees. J Neurosci. (2007) 27:6174–84. doi: 10.1523/JNEUROSCI.0730-07.2007
45. Knight WD, Okello AA, Ryan NS, Turkheimer FE, Rodríguez Martinez de Llano S, Edison P, et al. Carbon-11-Pittsburgh compound B positron emission tomography imaging of amyloid deposition in presenilin 1 mutation carriers. Brain. (2011) 134:293–300. doi: 10.1093/brain/awq310
46. Shi Z, Wang Y, Liu S, Liu M, Liu S, Zhou Y, et al. Clinical and neuroimaging characterization of Chinese dementia patients with PSEN1 and PSEN2 mutations. Dement Geriatr Cogn Disord. (2015) 39:32–40. doi: 10.1159/000366272
47. Villemagne VL, Ataka S, Mizuno T, Brooks WS, Wada Y, Kondo M, et al. High striatal amyloid beta-peptide deposition across different autosomal Alzheimer disease mutation types. Arch Neurol. (2009) 66:1537–44. doi: 10.1001/archneurol.2009.285
48. Thal DR, Rüb U, Orantes M, Braak H. Phases of A beta-deposition in the human brain and its relevance for the development of AD. Neurology. (2002) 58:1791–800. doi: 10.1212/WNL.58.12.1791
49. Price JC, Klunk WE, Lopresti BJ, Lu X, Hoge JA, Ziolko SK, et al. Kinetic modeling of amyloid binding in humans using PET imaging and pittsburgh compound-B. J Cereb Blood Flow Metab. (2005) 25:1528–47. doi: 10.1038/sj.jcbfm.9600146
50. Klunk WE, Engler H, Nordberg A, Wang Y, Blomqvist G, Holt DP, et al. Imaging brain amyloid in Alzheimer's disease with Pittsburgh Compound-B. Ann Neurol. (2004) 55:306–19. doi: 10.1002/ana.20009
51. Liu Y, Paajanen T, Zhang Y, Westman E, Wahlund LO, Simmons A, et al. Analysis of regional MRI volumes and thicknesses as predictors of conversion from mild cognitive impairment to Alzheimer's disease. Neurobiol Aging. (2010) 31:1375–85. doi: 10.1016/j.neurobiolaging.2010.01.022
52. Madsen SK, Ho AJ, Hua X, Saharan PS, Toga AW, Jack CR Jr, et al. 3D maps localize caudate nucleus atrophy in 400 Alzheimer's disease, mild cognitive impairment, and healthy elderly subjects. Neurobiol Aging. (2010) 31:1312–25. doi: 10.1016/j.neurobiolaging.2010.05.002
53. Dukart J, Mueller K, Villringer A, Kherif F, Draganski B, Frackowiak R, et al. Relationship between imaging biomarkers, age, progression and symptom severity in Alzheimer's disease. Neuroimage Clin. (2013) 3:84–94. doi: 10.1016/j.nicl.2013.07.005
54. Zhao H, Li X, Wu W, Li Z, Qian L, Li S, et al. Atrophic patterns of the frontal-subcortical circuits in patients with mild cognitive impairment and Alzheimer's disease. PLoS ONE. (2015) 10:e0130017. doi: 10.1371/journal.pone.0130017
55. Ten Kate M, Sanz-Arigita EJ, Tijms BM, Wink AM, Clerigue M, Garcia-Sebastian M, et al. Impact of APOE-ε4 and family history of dementia on gray matter atrophy in cognitively healthy middle-aged adults. Neurobiol Aging. (2016) 38:14–20. doi: 10.1016/j.neurobiolaging.2015.10.018
56. Li W, Antuono PG, Xie C, Chen G, Jones JL, Ward BD, et al. Aberrant functional connectivity in Papez circuit correlates with memory performance in cognitively intact middle-aged APOE4 carriers. Cortex. (2014) 57: 67–76. doi: 10.1016/j.cortex.2014.04.006
57. Hart J Jr, Maguire MJ, Motes M, Mudar RA, Chiang HS, Womack KB, et al. Semantic memory retrieval circuit: role of pre-SMA, caudate, and thalamus. Brain Lang. (2013) 126:89–98. doi: 10.1016/j.bandl.2012.08.002
58. Grossman M, Smith E, Koenig P, Glosser G, DeVita C, Moore P, et al. The neural basis for categorization in semantic memory. NeuroImage. (2002) 17:1549–61. doi: 10.1006/nimg.2002.1273
59. Gotts SJ, Milleville SC, Bellgowan PS, Martin A. Broad and narrow conceptual tuning in the human frontal lobes. Cereb Cortex. (2011) 21:477–91. doi: 10.1093/cercor/bhq113
60. Stringaris AK, Medford NC, Giampietro V, Brammer MJ, David AS. Deriving meaning: distinct neural mechanisms for metaphoric, literal, and non-meaningful sentences. Brain Lang. (2007) 100:150–62. doi: 10.1016/j.bandl.2005.08.001
61. Grogan A, Green DW, Ali N, Crinion JT, Price CJ. Structural correlates of semantic and phonemic fluency ability in first and second languages. Cereb Cortex. (2009) 19:2690–8. doi: 10.1093/cercor/bhp023
62. Müller NCJ, Konrad BN, Kohn N, Muñoz-López M, Czisch M, Fernández G, Dresler M. Hippocampal-caudate nucleus interactions support exceptional memory performance. Brain Struct Funct. (2018) 223:1379–89. doi: 10.1007/s00429-017-1556-2
63. Brown TI, Ross RS, Tobyne SM, Stern CE. Cooperative interactions between hippocampal and striatal systems support flexible navigation. Neuroimage. (2012) 60:1316–30. doi: 10.1016/j.neuroimage.2012.01.046
64. Johnson A, van der Meer MA, Redish AD. Integrating hippocampus and striatum in decision-making. Curr Opin Neurobiol. (2007) 17:692–7. doi: 10.1016/j.conb.2008.01.003
65. Robinson JL, Salibi N, Deshpande G. Functional connectivity of the left and right hippocampi: evidence for functional lateralization along the long-axis using meta-analytic approaches and ultra-high field functional neuroimaging. Neuroimage. (2016) 135:64–78. doi: 10.1016/j.neuroimage.2016.04.022
66. Kong XZ, Pu Y, Wang X, Xu S, Hao X, Zhen Z, et al. Intrinsic hippocampal-caudate interaction correlates with human navigation. bioRxiv. (2017) 116129. doi: 10.1101/116129
67. Andrews-Hanna JR, Smallwood J, Spreng RN. The default network and self-generated thought: component processes, dynamic control, and clinical relevance. Ann N Y Acad Sci. (2014) 1316:29–52. doi: 10.1111/nyas.12360
68. Tan LH, Chen L, Yip V, Chan AH, Yang J, Gao JH, et al. Activity levels in the left hemisphere caudate-fusiform circuit predict how well a second language will be learned. Proc Natl Acad Sci U S A. (2011) 108:2540–4. doi: 10.1073/pnas.0909623108
69. Ward A, Crean S, Mercaldi CJ, Collins JM, Boyd D, Cook MN, et al. Prevalence of apolipoprotein E4 genotype and homozygotes (APOE e4/4) among patients diagnosed with Alzheimer's disease: a systematic review and meta-analysis. Neuroepidemiology. (2012) 38:1–17. doi: 10.1159/000334607
70. Liu G, Tan X, Dang C, Tan S, Xing S, Huang N, et al. Regional shape abnormalities in thalamus and verbal memory impairment after subcortical infarction. Neurorehabil Neural Repair. (2019) 33:476–85. doi: 10.1177/1545968319846121
71. Farokhian F, Beheshti I, Sone D, Matsuda H. Comparing CAT12 and VBM8 for detecting brain morphological abnormalities in temporal lobe epilepsy. Front Neurol. (2017) 8:428. doi: 10.3389/fneur.2017.00428
72. Barbagallo G, Caligiuri ME, Arabia G, Cherubini A, Lupo A, Nisticò R, et al. Structural connectivity differences in motor network between tremor-dominant and nontremor Parkinson's disease. Hum Brain Mapp. (2017):4716–29. doi: 10.1002/hbm.23697
Keywords: MCI, APOE, caudate nucleus, thalamus, structural covariance, MRI
Citation: Novellino F, López ME, Vaccaro MG, Miguel Y, Delgado ML and Maestu F (2019) Association Between Hippocampus, Thalamus, and Caudate in Mild Cognitive Impairment APOEε4 Carriers: A Structural Covariance MRI Study. Front. Neurol. 10:1303. doi: 10.3389/fneur.2019.01303
Received: 21 June 2019; Accepted: 26 November 2019;
Published: 20 December 2019.
Edited by:
Christian Gaser, Friedrich Schiller University Jena, GermanyReviewed by:
Xiaoying Tang, Southern University of Science and Technology, ChinaIan Brian Malone, University College London, United Kingdom
Clarissa Lin Yasuda, Campinas State University, Brazil
Copyright © 2019 Novellino, López, Vaccaro, Miguel, Delgado and Maestu. This is an open-access article distributed under the terms of the Creative Commons Attribution License (CC BY). The use, distribution or reproduction in other forums is permitted, provided the original author(s) and the copyright owner(s) are credited and that the original publication in this journal is cited, in accordance with accepted academic practice. No use, distribution or reproduction is permitted which does not comply with these terms.
*Correspondence: Fabiana Novellino, ZmFiaWFuYS5ub3ZlbGxpbm9AY25yLml0