 Daniel W. Hook
 Simon J. Porter
 Christian Herzog
- 1Digital Science, London, United Kingdom
- 2Centre for Complexity Science, Imperial College London, London, United Kingdom
- 3Department of Physics, Washington University in St. Louis, St. Louis, MO, United States
Dimensions is a new scholarly search database that focuses on the broader set of use cases that academics now face. By including awarded grants, patents, and clinical trials alongside publication and Altmetric attention data, Dimensions goes beyond the standard publication-citation ecosystem to give the user a much greater sense of context of a piece of research. All entities in the graph may be linked to all other entities. Thus, a patent may be linked to a grant, if an appropriate reference is made. Books, book chapters, and conference proceedings are included in the publication index. All entities are treated as first-class objects and are mapped to a database of research institutions and a standard set of research classifications via machine-learning techniques. This article gives an overview of the methodology of construction of the Dimensions dataset and user interface.
1. Introduction
Garfield's original motivation for the creation of an index for scholarly content in the 1950s was to study the history and development of science. However, through the latter half of the twentieth Century and the early part of the twenty-first Century, use cases for this type of data have significantly diversified. To date, few have moved beyond the core publication-citation graph and extended it to explore allied areas of research activity such as awarded grants, patents, and clinical trials. The central theses of the Dimensions database are that: (i) these data are now sufficiently available to make such a database possible with good enough coverage that the results and linkages are interesting; (ii) the combination of these data give a user access to greater context of a piece of research and allow this user to fulfill a significantly wider set of use cases.
Scholarly citation engines have begun to play an increasingly important part of the academic ecosystem. The wave of researchers that emerged from their postgraduate studies during the 1980s, resulted from widening access to universities (Bolton, 2012). This led both to a more highly-skilled workforce in the western world but also led to a greater number of highly-skilled individuals wishing to follow a research career. Through several resulting coincident effects, research has needed to professionalize.
As academic ranks have swelled the rate of publication has also increased. Tracking the development of academic fields was important before the enlargement of the research base, but now efficiency and utility is often tracked. Strategic decisions are based on data often derived from scholarly citation databases. Even though the future direction of research is informed by such tools, most would openly acknowledge that these tools are still blunt in nature.
When funders and governments sought additional information to help them make evidence-driven decisions, the Science Citation Index (SCI) was the most logical choice. Indeed, at that time it was the only available homogeneous record of published research. Additionally, the SCI had a proven track record in the fledgling area of “science of science” as the SCI had already been used to create and establish Journal Impact Factor as an early proxy for journal quality in the early 1970s (Garfield, 1972).
In the last 20 years there has been an increasing interest in research evaluation driven partly by increasing competitiveness in research, but also by greater availability of data and, more immediately, by a greater need to justify use of public funds following the economic crisis of 2008. The evaluation community has moved from using journal-level metrics to inform and assist evaluation to article-level metrics and has, most recently, invested significantly in broadening their view of impact (King's College London and Digital Science, 2015; Greenhalgh et al., 2016; Australian Research Council, 2017; Tahamtan and Bornmann, 2018).
The evaluative environment has driven the diversification of evaluation use cases around publication and citation data. It has also given rise to a diversification of research use cases that have not been met by scholarly citation databases.
Research outputs, that is to say, monographs and publications, have been at the center of scholarly communication for more than 350 years. However, there has been a fundamental shift in research across almost all fields in the last half century. The production of data, its collection, its processing, and its analysis has changed how research takes place. Funding mechanisms have matured, commercialization of research has become commonplace and the application of research to solve the problems of health have created significant benefits to humanity. Today's research is increasingly translational in nature and does not exist in a bubble.
Context, we argue, is now king. Both in evaluation and in research itself we know that the types of metrics that can be derived from publication data are not appropriate to create measures of quality but, at best, measures of attention. However, in both research and evaluation it is extremely valuable to be able to understand the context of a piece of work. In the evaluation use case, understanding if the amount of scholarly attention received by a paper (number of citations) is high or low for a field and for a paper of a particular age is essential. In the research use case, understanding who is citing a paper and the diversity of fields that cite a piece of research makes that research more valuable.
The Dimensions database is a scholarly database that goes beyond research articles and their citations by including not only books, chapters, and conference proceedings, but also awarded grants, patents, clinical trials, policy documents, and altmetric information (with datasets to come later in 2018). In addition, these entities are interlinked in a rich multipartite extension of a citation graph. This database attempts to capture and give insight into a larger world around a piece of research (Bode et al., 2018). The database can be accessed at http://app.dimensions.ai. The free version includes a searchable publications index and links to all the other different entities. The subscription version includes further faceting, further analytical capabilities, and searchable indices of the non-publication content. Data is freely available to support bibliometric and scientometric research.
There are many use cases for context of the type that Dimensions is able to bring. The bibliometrics community has been a strong proponent of using metrics to support peer review, so called “informed peer review.” Responsible use of metrics has become a mainstream theme in research evaluation circles, as governments and funders have sought to reduce the burden and expense of peer review in their processes. There is now a significant body of literature that seeks to guide the sector and argues for diverse metrics and indicators to support rather than replace reviewers (DORA, 2013; Hicks et al., 2015; Wilsdon, 2015; Leydesdorff et al., 2016; Waltman, 2016; Sugimoto and Lariviére, 2018). Dimensions was also created to support diversity in metrics. It should be clear that it is not the aim of Digital Science to create metrics in isolation from the community but rather to ensure that data is made available to the research community to create an increased diversity of open, reproducible metrics that are owned by the community.
In particular, The Metric Tide (Wilsdon, 2015) offers five of its own “dimensions”: Robustness, Humility, Transparency, Diversity, and Reflexivity. Each dimension covers an aspect of how data used to create metrics should be handled in order to maximize the confidence that we can place in the metrics that we are employing in different areas and levels of research evaluation. Robustness refers to the data quality—Dimensions is committed to make data available to the research community in a manner that allows audit easily and transparently. Humility refers to the irreplaceability of humans in the evaluation process—Dimensions is designed to working with the community to provide tools to those with roles in evaluation rather than producing a tool that automates evaluation. Transparency refers to having a clear, well-documented process for the creation of the database—Dimensions continues to not only document the choices that have been made in the production of the database but also attempts to disseminate those choices through a number of means including papers such as this one. Diversity refers to sensitivity around the different requirements for different fields, rather than trying to adopt a one-size-fits-all approach. The Dimensions approach is to ensure that the community has access to data and the freedom to innovate with the data. Metrics that we include will be close to the data with transparency around how they are generated. Other papers will doubtless follow that delve deeper into various methodological points behind metrics that are eventually included. Reflexivity refers to responsiveness to updating metrics as research and the community move forward. The Dimensions team continues to innovate and push the boundaries of technical capability and hence this concept is very natural and well-aligned with how Dimensions is built and the ethos behind the project.
It is encouraging that a number of authors in the bibliometrics community have moved rapidly to explore Dimensions. Already papers assessing and comparing data quality between Dimensions and other data sources have appeared (Chen, 2018; Orduña-Malea and Delgado-López-Cózar, 2018; Thelwall, 2018). Much of this work centers around the publication index, which makes sense at this stage in the development of the system. However, it is clear that a deeper analysis of Dimensions links outside the core publications index is of use to the wider community.
Although we focus on aspects of how we built the publications index in Dimensions in this brief paper, we have also tried to broaden the discussion to give colleagues in the bibliometrics community an insight into how other parts of the Dimensions database relate to the publications core. Specifically, we describe how different data entities have been brought together, normalized, mapped to common reference points (such as Fields of Research and GRID) and packaged in a way that makes them valuable to researchers, evaluators, and to the public.
2. Building Dimensions
In building a database such as Dimensions, there are a number of choices that one must make early on. These decisions are helped by having guiding principles. Through lengthy discussions both internal within the Dimensions team and external with collaborating partners, the following principles were established:
• Some parts of the system must be freely available to anyone in order to ensure that the whole community can benefit. This means that the database must be created in an efficient manner, using automated routines and technologies such as AI, that allows a free offering to be delivered in a sustainable manner.
• Data must be made as openly available as possible so that any metrics built on the database can be independently calculated and verified.
• Items in the database, wherever possible, should be associated with open unique persistent identifiers. Beyond this, existing open standards should always be used where they are fit for purpose and stable enough to be relied upon.
• The database should not be selective but rather should be open to encompassing all scholarly content that is available for inclusion. In practice, the bar for inclusion should be the association of a record with a recognized unique identifier. The community should then be able to choose the filter that they wish to apply to explore the data according to their use case.
• Dimensions should include metrics that are close to the data (i.e., accepted, externally defined metrics that are computationally expensive to calculate) or those the community have asked to be included. Dimensions should not seek to establish its own set of metrics.
• The aim of the database is not for a user to find a single citation or a particular grant (although that should be possible). The aim is to allow a user to quickly survey a field or to place an entity in context with ease.
With these principles the overall structure of the database becomes a lot clearer. The database must be built in a highly automated manner that doesn't require a large amount of human intervention. In addition, the database will require well-defined “axes” so that data can be filtered with reference to those axes. The requirement of a unique identifier is the only editorial hurdle for inclusion in the database. Full-text versions of any entity should be directly linked wherever possible as this will enable data extraction to give a homogeneous view of entities in the database.
2.1. Beyond Bibliometrics
While the publication remains the centre of the research dissemination process in many fields, there are many other objects in the research information landscape that allow us to gain a better understanding of the context of a piece of research or get an overview of a field with speed. The key to creating this view is two fold: Firstly, data must be mapped to good-quality “axes” such as a list of research institutions, a list of journals or a mapping to a research categorization system and secondly, links must be created between items in order that they are related.
Many readers will recognize a “cartoon” version of the research and discovery process, that is clearly a vast simplification of a complex and multifaceted process, but which illustrates our core point in Figure 1. The timescale of events in this figure should not be taken to be absolute but rather indicative. It is also recognized that some fields will have different processes where some steps are missed altogether or are reversed. Yet, this serves as a recognizable and reasonable framework to think about when considering how research objects relate to one another.
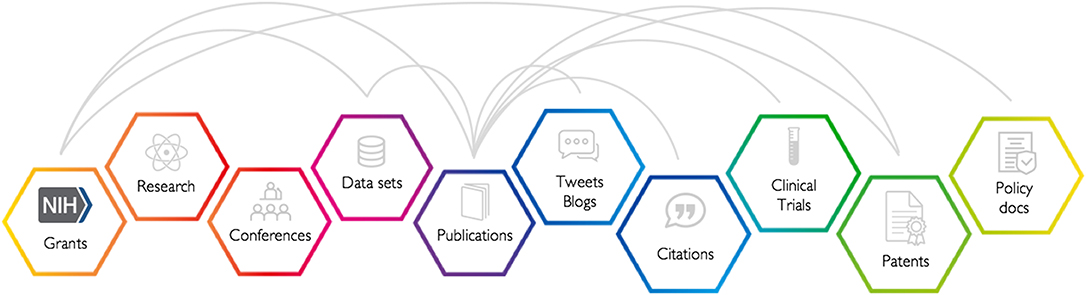
Figure 1. Publications are the result of grants being awarded, research being carried out, feedback from colleagues at conferences and use of research datasets, just to name of a few of the possible inputs. Publications often result in public attention and scholarly attention and can lead to clinical, industrial, or policy impacts and outcomes.
From having an idea to getting a grant to support the development of that idea through doing the research, disseminating that research at a conference, developing datasets, publishing, and seeing attention and impact can take many years. Grants are an early signal for what will come while citations look backward to the scholarly “fall out” of what has been discovered and patents, clinical trials, and policy documents give signals about the translation of research into the practical realm.
With a linked data structure such as the one indicated in Figure 1 it is possible to build significantly more complex, subtle, and revealing metrics than when limited to the citation graph alone.
2.2. Data Spine
In any data system it is important to establish axes so that sense may be made of the contents of the system. In the case of Dimensions, we are trying to describe a piece of research in a broad context. For the purposes of this article we focus on the idealized research flow in Figure 1 to illustrate broader points. A piece of research happens at a set of research institutions; it involves a set of people, equipment, and other resources that are funded from a variety of sources. It relates to a set of topics, takes place over a certain period of time and may give rise to impact in many forms. This concise characterization gives rise to a natural choice of “axes” upon which to project data describing the discovery process. In turn, this implies a navigation and location system for different elements of the research data system. On top of this information, there is specific data in each case of a research object, for a publication this includes the journal information, issue number, volume number, pagination, and unique identifiers.
In this section we concern ourselves with how to build that navigational layer and enhance it so that the user can not only navigate to an individual paper but also walk between papers (citations), understand the funding that a paper, set of papers, group of academics, or an institution has received, and perceive the industrial, clinical, or policy outcomes of a piece of research.
Of the data types shown in Figure 1, most already existed in different databases before Dimensions was built. However, data was siloed and there was limited or non-existant linkage between different data types. Altmetric had already brought together data in the form of tweets, blog posts, news articles, and policy documents, which we regard as different types of attention associated with academic output. IFI Claims, the provider of the patent data in Dimensions, had already established a homogenized set of data from multiple different patent authorities from around the globe and had mined this data for publication references and citations of patents to patents. ÜberResearch had created a database of awarded grant and funding-related information. The remaining outstanding piece that did not exist in the Digital Science portfolio prior to the Dimensions project was a full database of publication related content and hence the short case study below describes how this index is created.
The first step in the process is to create a list of all publications that exist. From the guiding principles discussed above, we are led to choose an approach that prioritizes data sources that provide unique identifiers. Given the ubiquity of the DOI and PubMed identifiers, the logical choice is to base the Dimensions core on the Crossref database and PubMed. Combining these two datasets gives a “data spine” that allows one to then enhance this core data with additional information. The Crossref dataset contains: article title, journal name, volume, issue, and pagination, a list of co-authors and any unique identifier such as a DOI, PubMed identifier, or ORCID that may be associated to the article.
2.3. Data Enhancements
Having established the data spine, we are then able to associate additional data with either a DOI or PubMed identifier. These data may be sourced from a number of different external databases. PubMed contains some valuable information on affiliations and on funder attribution. Beyond these fields in the PubMed data, PubMed makes available links to open access versions from which further data can legitimately be mined. Full text is also available from DOAJ (Directory of Open Access Journals) as well as around 100 publishers (at launch), who were kind enough to supply access to full text for the creation of Dimensions.
We carry out a number of data enhancements using artificial intelligence in the form of machine learning and topic modeling. The following sections give a high-level survey of what is involved in each case. Figure 2 gives a summary of the links that are in place at the end of the enhancement process. However, Figure 2 does not address or summarize the further work that we do to match all of these entities (not just publications) to institutions and the work that is done to categorize work.
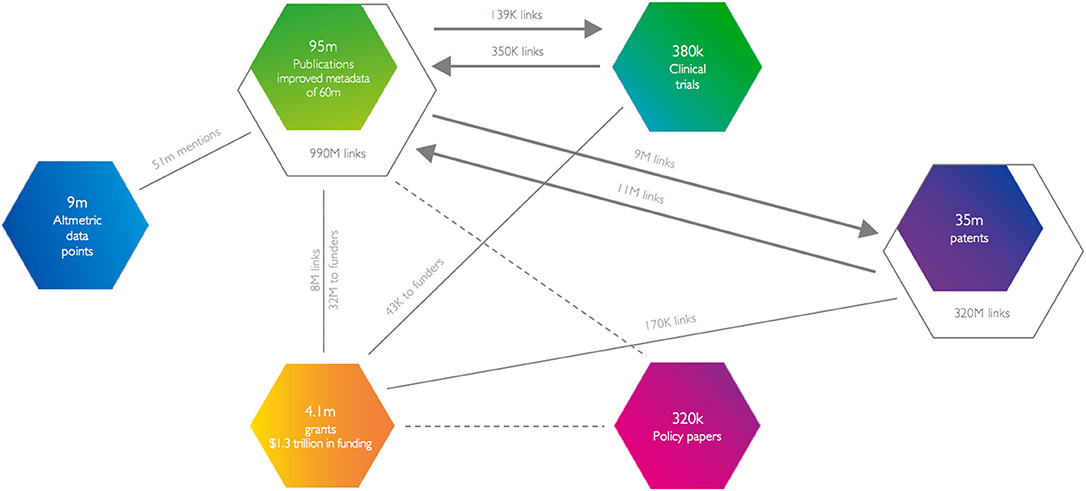
Figure 2. In the launch version of Dimensions, the database contained 90 million publications (of which 50 million were enhanced using a full-text version) to create 873 million citation links. In addition, grants information from more than 250 funders provided 3.7 million grant objects representing 1.3 trillion US dollars of funding and, by mining acknowledgments sections and use of PubMed data, resulted in 8 million links to grants and 32 million funder acknowledgments. The IFI claims patent database was added with 34 million patents and 320 million citations within those patents with a further 11 million citations to scholarly articles and 9 million citations from scholarly articles. Altmetric provided information on attention concerning 9 million articles. Clinical trials data represented a smaller dataset with 380,000 records and links to 350,000 papers, from 139,000 papers and 43,000 grant acknowledgments.
2.3.1. Affiliation Mapping
Creating the “axis” for institutions that are involved with research requires the mapping of author affiliations on papers to specific institutions. This is a non-trivial task demanding some subtle technological approaches. The process begins with the creation of an appropriate database of institutions where research takes place. The list must be sufficiently exhaustive as to be a good cover for the institutions appearing on address lists of publications—that means that it should include not just research institutions but also companies, government research labs, hospitals, and a number of other classes of entity. It also means that we need to define rules to consistently handle institutions. There are many examples that are difficult to handle: Is the Max Planck Society one entity or should each of the 84 constituent institutes be handled separately? Is a university's hospital or business school a separate entity?
In 2014, we started working on the problem of creating an entity list for organizations involved in research, this is the GRID (Global Research Identifier Database) system. At that time we defined a set of policies for how we wanted to handle the definition of a research entity. The high-level policies are posted on the GRID website. As of the time of writing, GRID contains 80,000 unique organizations.
To create GRID we first extracted address data from the PubMed data. We then used a clustering algorithm to find similar names. We mapped duplicate names together and then looked at names that were close on the basis of Levenshtein distance. Clusters were then manually curated and name variants where stored against a unique identifier. Each unique identifier in the GRID database is an accepted official name (often the legal name of the entity) and a number of public name variants, for example, translations and acronyms. Behind the scenes in the core database there are many name variants for each institution. A good example would be that the string “Judge Business School” might be the affiliation that an academic has chosen to declare on a paper, without mentioning the University of Cambridge, which is the institute listed in GRID. GRID knows from the initial curation exercise and then millions of examples that it has now looked at that “Judge Business School” is part of the University of Cambridge.
This iterative name resolution approach that combines machine learning and manual curation is at the heart of GRIDs institutional mapping. Other challenges in affiliating objects to institutions include academic papers with compound address strings. A real address string, from a CRISPR-related paper, that exemplifies these types of issues is: “Broad Institute of MIT and Harvard, 7 Cambridge Center, Cambridge, MA 02142, USA, and McGovern Institute for Brain Research, Department of Brain and Cognitive Sciences, Department of Biological Engineering, Massachusetts Institute of Technology (MIT), Cambridge, MA 02139, USA, Harvard University.” Although this is readable to a human it is extremely difficult to parse for a statistical algorithm. Hence, enhanced machine-learning approaches need to be brought to bear. In our algorithms, we need to actually be smart about recognizing geographies and what the various parts of this string mean. The example above is a particularly difficult example even for the human reader: How many institutions are mentioned? Is it two, three, or perhaps more? This type of disambiguation is the most difficult to handle.
Once mapped to GRID, we can take advantage of further data vested in GRID. For instance, GRID has address data for primary campuses of each research organization. In each case, we have longitude and latitude available and also have a mapping to the Geonames database (Geonames, 2018). In the case of addresses in the EU we have also included the NUTS (Nomenclature of Territorial Units for Statistics) classification of regions as published by EuroStat. Using GRID as a reference, we're able to work with all the data in Dimensions with a full geographical structure to support further queries.
2.3.2. Citations
Citations are a critical piece of the puzzle in any database like Dimensions—academic or scholarly attention in the form of citations has been the mainstay of bibliometric analysis since the late 1950s and an evaluative tool since the mid-1980s. Dimensions builds up its citation graph using multiple techniques.
For several years, Crossref has permitted publishers to choose to donate the references associated with each article for which they mint a DOI in Crossref's central database. This formed the core of several initiatives that have tried to build citation engines.
At the 8th Conference on Open Access Scholarly Publishing in 2016, a small group of stakeholders came together to form the I4OC (Initiative for Open Citations). The I4OC has played a critical role in making citation data more openly available over the last 18 months to the extent that building Dimensions would have been significantly more challenging, time-consuming, and the data would contain many more errors without their efforts. Publishers are free to deposit references contained in their papers with the I4OC and these data are made available through Crossref's services. Without access to this resource, Dimensions would only have the reference lists from a few hundred publishers: Specifically citations from those publishers directly participating in our programme together with articles that may legitimately be mined from an open access copy.
While more than 60 publishers make their reference data available to Crossref (I4OC, 2018), accounting for around 50% of citations, this leaves a long tail who do not. Some of these publishers have been keen to work with Dimensions but do not have data in an appropriate format to automatically put data into the Crossref archive. In these cases, we have extracted references either from HTML or from PDF documents.
All these approaches come together to yield (at the time of writing) 990 million links from publication to publication, 139,000 links from publications to Clinical trials and 320 million links from publications to patents.
2.3.3. Funder Acknowledgments
Linking funding to its outcomes is something that has been championed by various groups across research in recent years, amongst which the OpenAire standard is possibly the most visible. Linking funding to outcomes opens the door to all sorts of metrics and indicators enabling us to access important questions: What is the typical route from grant funding to impact? What types of grant funding are most efficient in developing a field? Does the efficiency of the funding depend on the level of development of a field?
Funder acknowledgments are another part of the system were we can take a hybrid approach. Some data sources such as PubMed include data that has either been reported to a funder regarding the association of a paper with a grant or appears in the paper. We can take this data as a learning dataset to provide the basis for a machine learning approach. Secondly, from our dataset of funding information, originally built by ÜberResearch, we can search acknowledgments for the grant numbers and codes.
It is worthy of note that, as mentioned in Figure 2, we have been able to link 8 million publications to one or more grants in our database of 3.7 million grants. These links are based on machine learning, where publisher relationships allow us to access their content. In addition, we are able to establish attributions to a funder where grant identifiers are not explicit or where we don't have a grant number listed in our database. Through this ancillary entity recognition approach, we recognize and record 32 million links between papers and funding bodies. In the same way that we search author-address strings for affiliations that we can map to GRID, we search acknowledgments sections for strings that match to funder names that we have in a registry of funders and funder name variants.
There is an ongoing need in the space to associate unique cross-funder identifiers for grants and to capture this type of structured data in a consistent manner, ideally at the time of submission. Dimensions represents, we believe, the most thorough consolidated view on these data currently and is hence the only place where reliable metrics may be developed and tested.
2.3.4. Category Mapping
Categorization of articles has developed significantly in the last few years. Journal-level categorization was, for many years, the state of the art process by which articles inherited their classification from the journal level. This supported a standardized mapping of publications and indirectly supported the establishment of the Impact Factor. In recent years, the move to article-level metrics has meant that the focus on journal-level subject classification has become more challenging.
In the case of Dimensions, journal-level categorization was never an option for the system since journal-type objects account for only one piece of the information graph. It is critical to be able to classify publications, grants, policy papers, clinical trials, and patents using a common approach across types.
In Dimensions standardized and reproducible subject categorization is achieved algorithmically using a machine-learning approach. Dimensions has the capacity for an expert to build a classification based on a set of search terms. An expert starts the process by searching for a general term or a longer constructed search string to amass an inclusive set of objects that fall into the presumptive category. Concepts are extracted from the corpus that has been returned and the expert has the opportunity to boost particular keywords, re-ranking the search results to produce a different relevance score, or to exclude objects that include particular terms. By repeating this process the expert (who is an expert in the subject but not an expert in computer coding) can define a field in a way that a computer is able to understand.
This unique approach allows the computer to codify a set of rules that can be applied reproducibly to any content. One of the greatest problems in categorizing articles in the human element. Humans are constantly learning and changing their opinion. An expert may classify an article one way on one day but completely differently a year later. If we want to have a standardized basis for analysis of categories then we need to remove the human element and the technique described above does that.
Using this technology and a few days of work, we can build a useful, reproducible definition of an arbitrary categorization system that will automatically be applied to any new content that is brought into Dimensions.
2.3.5. Person Disambiguation and ORCID
Another critical normalization for a modern dataset that attempts to describe the actors in the research ecosystem must deal with people. Person disambiguation has been recognized to be one of the most challenging pieces in tying together a picture of the research landscape. There are many examples of researchers who publish with a number of versions of their name: As hard as people try to be consistent, their co-authors can easily forget to add a critical initial to the metadata for a publication. Sometimes an academic does not desire to publish consistently with the same name—we refer to this internally as the “Iain Banks” problem. Iain Banks and Iain M Banks are the same person, however, the former author name is exclusively by the author for his mainstream fiction work and the latter is used exclusively for science fiction output. In addition, people change names for a plethora of reasons.
In the initial release of Dimensions, we have used an purely algorithmic approach to name disambiguation. Using affiliation data, co-authorship and citation patterns as well as subject area traits we can cluster authors together with some accuracy. The algorithm is defined to favor precision over recall, which is to say that authors will tend to find a number of clusters associated with author names that have not been joined together rather than finding grants or publications that are not associated with a particular cluster of work.
In resolving outstanding issues, the Dimensions team has released a more powerful approach that makes use of the public ORCID dataset (ORCID, 2018). At the time of writing ORCID has close to 5 million authors in its registry. Much of these data are relatively well curated and form a good basis for improving the name disambiguation in Dimensions. Following the inclusion of the ORCID data, clusters from the algorithmic approach are associated with ORCIDs based on overlap of article DOIs in a cluster with the DOIs associated to the a record in the ORCID registry. Should an author find that they are missing DOIs associated with their output in Dimensions then they can go to ORCID to update their record - the corrected data will then flow through to the Dimensions system.
3. Bringing it All Together
As demonstrated in the previous sections, significant investment has been made to enhance source data by mapping it to existing unique identifiers and external structures such as ORCID for people and Geonames for geographic information. In this section, we briefly explore the user interface and API for Dimensions.
The user interface was built to preserve familiar characteristics that users are comfortable with in search interfaces but to extend this user intuition to allow them to explore and understand the context of the data that they are experiencing. It was also key to bring researchers into contact with the actual content that they wished to find as rapidly as possible.
As previously stated, it was important to the Dimensions team to provide a free version of the product that remained highly functional. Figure 3 shows the difference between the Dimensions free and Dimensions Plus (paid) versions. In the free version, searching is limited to the publications index with a slightly cut-down set of facets and analytical capabilities. Where an individual publication record that links to Altmetric data, a grant, a patent or a clinical trial the detail page of any of those objects is available through the free interface. The 1-click connection to content in limited to open access content. In the paid version, grants, patents, and clinical trials are all searchable and extended facets and analytics are available.
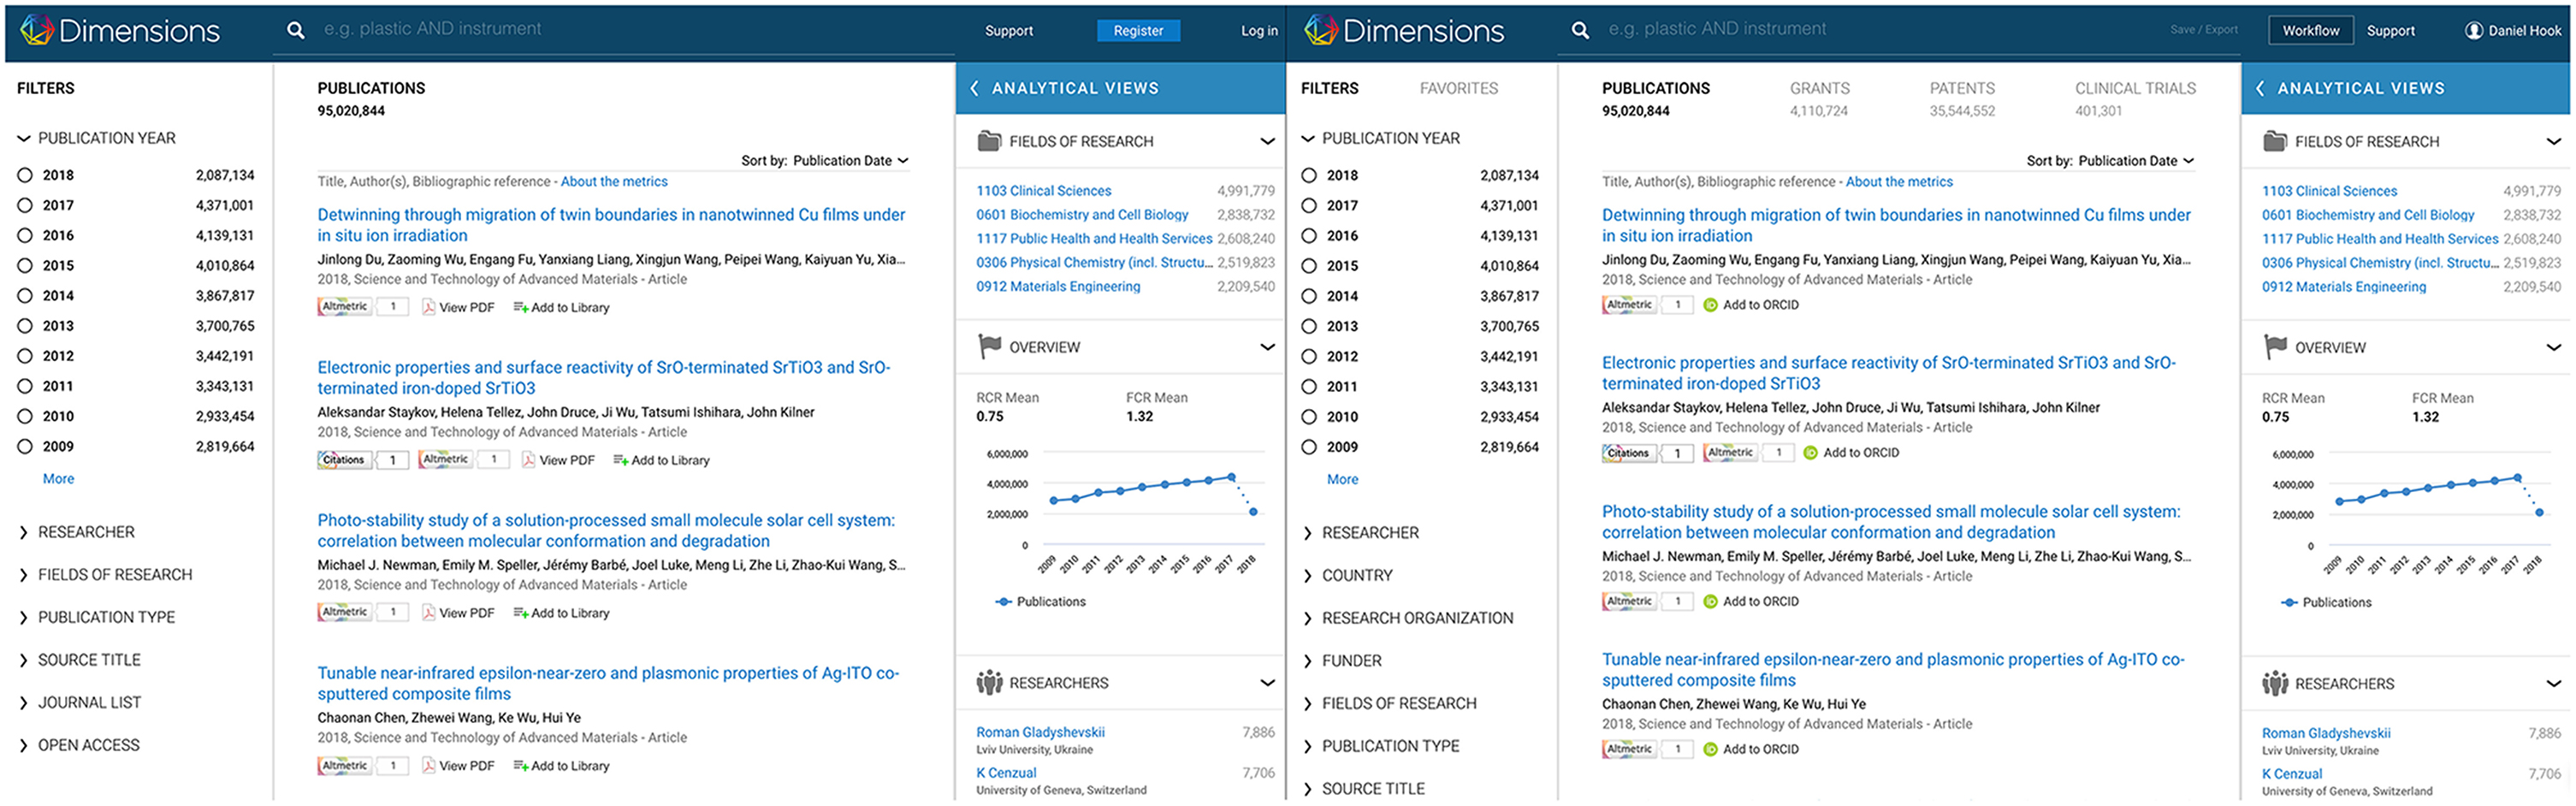
Figure 3. Free (left) and paid (right) versions of Dimensions side-by-side. On the left you notice more limited filters than on the right and only the publications index is searchable. On the right, the grants, patents and clinical trials searches are visible. Not shown, a greater degree of sophistication is available in the analytics panel in the paid version.
It was also always the aim to bring the ability to innovate with metrics to a broader audience. Dimensions offers for free a metrics API and Dimensions badges for non-commercial users (https://www.dimensions.ai/info/open-metrics/detail/). In the paid version of Dimensions there is an additional, powerful API that may be used to interrogate the underlying Dimensions database.
In creating Dimensions, over 100 research organizations participated to help to define and to feedback on the functionality that is found in the user interface. In taking on the Dimensions project in this way we were able to keep close to user needs and use cases. At the same time the team worked to create a general tool that would be powerful enough to meet use cases that had not been envisaged.
A critical piece of the Dimensions product vision was the creation of context around search results. The Analytical Views tab provides much of the contextual feel that Dimensions delivers to a user. The Analytical View tab goes significantly beyond the article detail page where the user can see the grants, funding bodies, altmetric, clinical trial, and patent relationships that Dimensions has brought together. The tab gives an aggregated summary of all the results that have been returned by the search criteria. Once the Analytical Views tab is drawn over the search results, as shown in Figure 4, users can quickly switch between different analyses of an underlying set of results.
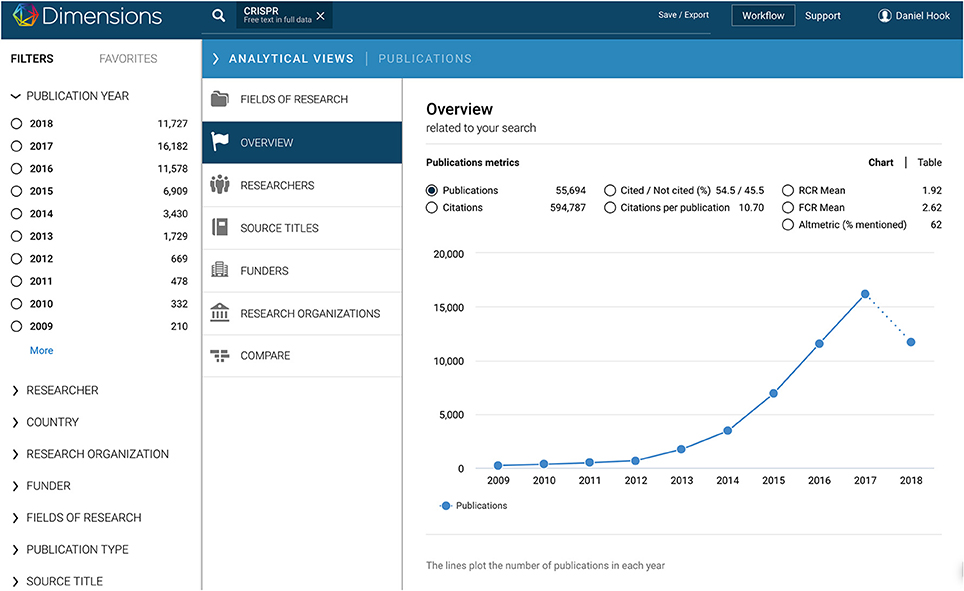
Figure 4. Analytics functionality (screenshot from paid version). Once a user has performed a search, they are able to see an analytical summary of their search results in the analytics panel, which draws across the search results from the right bar. This functionality is available in both the free and paid editions of Dimensions, but more capabilities are available in the paid version. This example shows how the rate of publication mentioning “CRISPR” in the full text has grown with time. It is this analytical capability that most quickly provides a user with the contextualized summary of search results. This includes: most productive researchers related to the search results, volume of publication, volume of citation, key institutions active, research categorization (mapped to AUSNZ FOR Codes), funders that have been acknowledged by relevant publications and journals in which work has appeared. Analytics panels give specific details depending on whether the underlying search results involve publications, grants, clinical trials, or patents.
The set of analyses that are available on the Analytical Views tab is dependent on the object being returned as a result of a search. That is to say that the Analytical View tab for a set of search results containing Publications will have analyses that are appropriate to summarize and give insight into publications results. The Analytical View tab overlayed on top of a set of search results related to Patents will have a different set of analysis. The left pane, which shows the different search facets that may be applied to search results has a similar context-specific adaptation.
A common academic use case is to quickly gain an understanding of the nature of a research area that they have heard about in a seminar or conversation with a colleague. Perhaps the area is newly emergent and it is interesting to understand which institutions have researchers who are active in the field, which researchers those are and whether the field is sufficiently developed to attract funding. All this is possible with the analytical functionality in Dimensions, simply by performing a search including a few terms that describe the field of interest. It is equally easy to ascertain the research collaborations between a user's home institution and one that they may be visiting or may wish to visit. Finding postdoctoral candidates or identifying potential collaborators are equally easy questions to answer naturally using the contextual functionality in Dimensions.
While Dimensions already meets many use cases there are many more that require a more direct level of access to the data. It is for these reasons as well as reasons of data volume download that the API was created.
The Dimensions API is a domain-specific language (DSL). What this means is that the API is written in such a way that the user does not need to know the underlying structure of the data in Dimensions but rather the user is able to use their intuitive understanding of the relationships between different objects to ask questions. For example, if one wished to know which publications contained the acronym “CRISPR” that had been written between 2012 and 2015 where one of the authors was affiliated with an institution in Canada then this can be accomplished using a single, simple command.
The last piece of functionality that we cover here is the access to full text content with a single click. This functionality is known as “Anywhere Access.” Figure 5 shows how a publication looks when it is rendered in Dimensions. The PDF copy is still available for download for those users who wish to save a version to their computer or local library if that is permitted by the publisher. All open access publications are available instantly at a single click in Dimensions through this mechanism.
Figure 5. Anywhere Access functionality. Wherever a user sees a “View PDF” link against a record in Dimensions, they are able to load a full text copy of that publication in the browser directly, using ReadCube's viewer technology. If the user has a ReadCube account then they can directly add the paper to their library. This functionality allows the user to be one click away from content. In the free version of Dimensions, open access content is delivered seamlessly in this way. In the paid version of Dimensions organizational holdings information can be integrated to ensure that all content under subscription can be reached in one click by a user, even if they are traveling and are away from their home institution.
In the case where the user signs up for a Dimensions account and their home institution is a subscriber to Dimensions, an integration can be performed to allow most content to be delivered in a single click through the Dimensions user interface. Once logged into Dimensions, the system knows that the user is a member of a particular institution. This means that content that is within the subscription of that institution can be delivered through Dimensions directly to the user, even if they are not currently within the institutions firewall. This significantly increases ease of access to content.
4. Discussion
Above, we have described some of the approaches that were taken to produce the Dimensions core dataset. In Figure 6, we show a high-level schematic of the core data entities in Dimensions at the time of launch. It is critical to note that Dimensions would not have been possible without the large amount of open data that is starting to be made available by publishers and as a result of the Open Access movement. In many senses, Dimensions is a study in the innovation that is possible if data is made openly available. Data mappings were standardized using algorithmic and AI-based mappings to recognized unique identifiers such as Crossref DOIs (for data improvements, citations and altmetric associations), open listings of ISSNs for journals such as the DOAJ list, ORCIDs for people, GRID for research organizations, Geonames for geographic data, and Australia New Zealand Fields of Research Codes for subject categorization. These identity registers are each taken to be a source of truth for the data element that they hold. Reinventing these structures was beyond the scope of our project and deemed not to add value to the broader community.
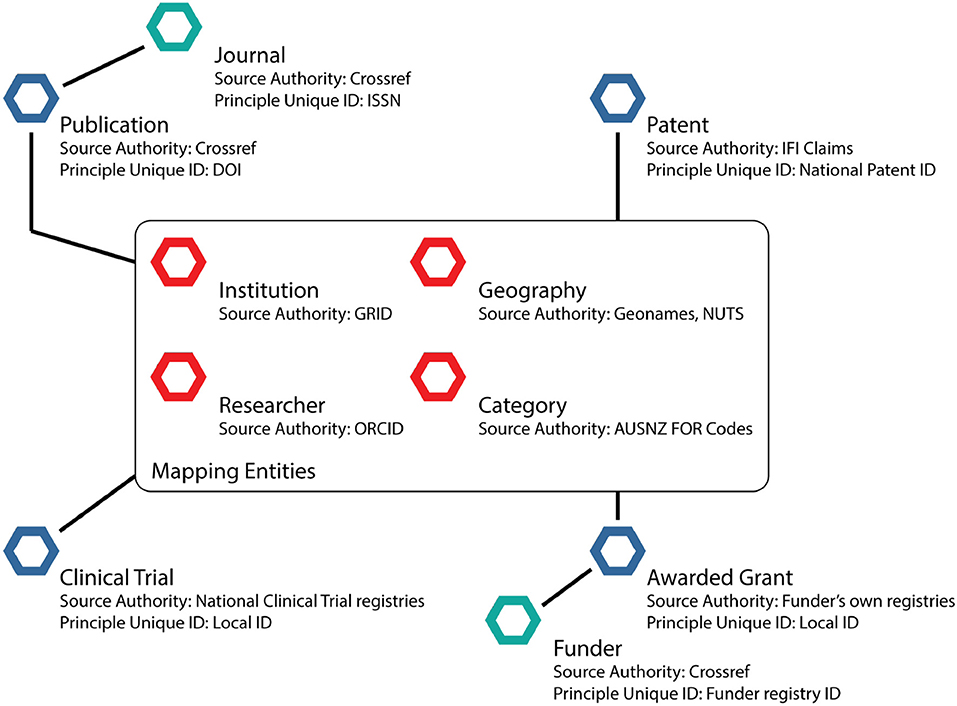
Figure 6. The core data entities as at the launch of Dimensions. The diagram is not exhaustive but illustrates the key points raised in the text. Each entity marked with a blue regular hexagon corresponds to one of the major data types in the system: Publication, Clinical trial (keyed by the unique identifiers in the main repositories such as ClinicalTrials.gov), Patents (keyed by patent number from each patent office), and Grants (keyed by the unique identifier of each funder). Publications are associated with journals (green hexgon, which are in turn linked to publishers), which have public unique identifiers in the form of ISSNs. Grants are associated with funders, which have unique identifiers in the Crossref Funder Registry. For clinical trials and patents the unique identifiers for national bodies tend to match to countries. In the center of the diagram, we have a collection of standard entities for mapping: Person (uniquely identifier by ORCID), Research Organizations (uniquely identified by GRID), Geographic data (uniquely identified by Geonames), Subject Categorization (uniquely identified by AUSNZ FOR codes and other schemes).
While we have highlighted some of the challenges that we have come across in building Dimensions and some of our solutions, anyone who uses the data in Dimensions will encounter properties of the data that we have yet to normalize (Thelwall, 2018). For example, one key aspect of the publication data is that it contains a significant amount of book and book chapter information. For many publishers there is no easy route from a DOI associated with a book chapter to the DOI associated with the book containing the chapter. Thus, standardized and well-understood handling of these data entities remains challenging. Nevertheless, initial exploration of some use cases has been performed (Adams et al., 2018).
Finally, while we have highlighted issues of data standardization and de-siloing of data for this special topic issue, we have not highlighted one other important part of the Dimensions project such as democratization of access to scholarly data, which was always at the heart of the Dimensions plan. The democratization that we seek to bring about consists of two parts: Firstly, ensuring that all researchers, regardless of affiliation or geography, are able to access a fully faceted database of information describing research; and, secondly, ensuring that all participants in the research environment, regardless of role, have access to the context of a piece of research.
Author Contributions
All authors listed have made a substantial, direct and intellectual contribution to the work, and approved it for publication.
Conflict of Interest Statement
All the authors are employees of Digital Science, the producer of Dimensions.
Acknowledgments
The authors would like to thank the three reviewers for their detailed comments, which significantly improved the depth and breath of the presentation in this paper.
References
Adams, J., Jones, P., Porter, S., Szomszor, M., Draux, H., and Osipov, I. (2018). Dimensions–A Collaborative Approach to Enhancing Research Discovery. Technical report. Digital Science. doi: 10.6084/m9.figshare.5783160.v1
Bode, C., Herzog, C., Hook, D., and McGrath, R. (2018). A Guide to the Dimensions Data Approach. Technical report. Digital Science. doi: 10.6084/m9.figshare.5783094.v5
Bolton, P. (2012). Education: Historical Statistics. Standard Note SN/SG/4252, Library, House of Commons.
Chen, C. (2018). Cascading citation expansion (to appear). J. Inform. Sci. Technol. Pract. 6, 6–23. doi: 10.1633/JISTaP.2018.6.2.1
Geonames (2018). About the Geonames Database. Available online at: http://www.geonames.org/about.html (Accessed April 15 , 2018).
Greenhalgh, T., Raftery, J., Hanney, S., and Glover, M. (2016). Research impact: a narrative review. BMC Med. 14:78. doi: 10.1186/s12916-016-0620-8
Hicks, D., Wouters, P., Waltman, L., de Rijcke, S., and Rafols, I. (2015). Bibliometrics: the Leiden Manifesto for research metrics. Nature 520:429. doi: 10.1038/520429a
I4OC (2018). Participating Publishers. Available online at: https://i4oc.org/#publishers (Accessed April 15, 2018).
King's College London and Digital Science (2015). The Nature, Scale and Beneficiaries of Research Impact: An Initial Analysis of Research Excellence Framework (REF) 2014 Impact Case Studies. Technical report.
Leydesdorff, L., Wouters, P., and Bornmann, L. (2016). Professional and citizen bibliometrics: complementarities and ambivalences in the development and use of indicators–a state-of-the-art report. Scientometrics 109, 2129–2150. doi: 10.1007/s11192-016-2150-8
ORCID (2018). Orcid Public Data File. Available online at: https://orcid.org/content/orcid-public-data-file-use-policy (Accessed April 15, 2018).
Orduña-Malea, E., and Delgado-López-Cózar, E. (2018). Dimensions: re-discovering the ecosystem of scientific information. Nature 27, 420–431. doi: 10.3145/epi.2018.mar.21
Sugimoto, C. R., and Lariviére, V. (2018). Measuring Research: What Everyone Needs to Know. New York, NY: Oxford University Press.
Tahamtan, I., and Bornmann, L. (2018). Core elements in the process of citing publications: conceptual overview of the literature. J. Informetr. 12, 203–216. doi: 10.1016/j.joi.2018.01.002
Thelwall, M. (2018). Dimensions: a competitor to scopus and the web of science? J. Informetr. 12, 430–435. doi: 10.1016/j.joi.2018.03.006
Waltman, L. (2016). A review of the literature on citation impact indicators. J. Informetr. 109, 365–391. doi: 10.1016/j.joi.2016.02.007
Keywords: scholarly search, contextual search, open data, artificial intelligence, machine learning, unique identifiers, scholarly communications, research evaluation
Citation: Hook DW, Porter SJ and Herzog C (2018) Dimensions: Building Context for Search and Evaluation. Front. Res. Metr. Anal. 3:23. doi: 10.3389/frma.2018.00023
Received: 16 April 2018; Accepted: 31 July 2018;
Published: 23 August 2018.
Edited by:
Min Song, Yonsei University, South KoreaReviewed by:
Terrie Rose Wheeler, Weill Cornell Medicine, United StatesLiza Chan, University of Alberta, Canada
Karen Gutzman, Northwestern University, United States
Copyright © 2018 Hook, Porter and Herzog. This is an open-access article distributed under the terms of the Creative Commons Attribution License (CC BY). The use, distribution or reproduction in other forums is permitted, provided the original author(s) and the copyright owner(s) are credited and that the original publication in this journal is cited, in accordance with accepted academic practice. No use, distribution or reproduction is permitted which does not comply with these terms.
*Correspondence: Daniel W. Hook, ZGFuaWVsQGRpZ2l0YWwtc2NpZW5jZS5jb20=