 Steffen Lemke
 Maryam Mehrazar
 Athanasios Mazarakis
 Isabella Peters
- 1Web Science Group, ZBW - Leibniz Information Centre for Economics, Kiel, Germany
- 2Web Science Group, Department of Computer Science, Kiel University, Kiel, Germany
The Social Sciences have long been struggling with quantitative forms of research assessment—insufficient coverage in prominent citation indices and overall lower citation counts than in STM subject areas have led to a widespread weariness regarding bibliometric evaluations among social scientists. Fueled by the rise of the social web, new hope is often placed on alternative metrics that measure the attention scholarly publications receive online, in particular on social media. But almost a decade after the coining of the term altmetrics for this new group of indicators, the uptake of the concept in the Social Sciences still seems to be low. Just like with traditional bibliometric indicators, one central problem hindering the applicability of altmetrics for the Social Sciences is the low coverage of social science publications on the respective data sources—which in the case of altmetrics are the various social media platforms on which interactions with scientific outputs can be measured. Another reason is that social scientists have strong opinions about the usefulness of metrics for research evaluation which may hinder broad acceptance of altmetrics too. We conducted qualitative interviews and online surveys with researchers to identify the concerns which inhibit the use of social media and the utilization of metrics for research evaluation in the Social Sciences. By analyzing the response data from the interviews in conjunction with the response data from the surveys, we identify the key concerns that inhibit social scientists from (1) applying social media for professional purposes and (2) making use of the wide array of metrics available. Our findings show that aspects of time consumption, privacy, dealing with information overload, and prevalent styles of communication are predominant concerns inhibiting Social Science researchers from using social media platforms for their work. Regarding indicators for research impact we identify a widespread lack of knowledge about existing metrics, their methodologies and meanings as a major hindrance for their uptake through social scientists. The results have implications for future developments of scholarly online tools and show that researchers could benefit considerably from additional formal training regarding the correct application and interpretation of metrics.
Introduction
The first to introduce the idea of evaluating the importance of scientific work based on quantitative metrics—more specifically citation counts—were Gross and Gross (1927) in 1927 (Bornmann and Daniel, 2008). Since then, the assessment of research, which had historically been based on the qualitative practice of peer review, has incorporated a multitude of quantitative methods and indicators (Desrochers et al., 2018). Among these quantitative methods the most commonly used techniques are still bibliometric, i.e., based on output and citation analysis, well-known examples being the Journal Impact Factor or the h-index (Hirsch, 2005). Other developments in quantitative research evaluation, like the “Norwegian model” (Sivertsen, 2016) or the book-oriented “libcitation count” (White et al., 2009), try to solve known problems of an evaluation system predominantly focusing on citations. Moreover, recently numerous promising alternatives and complements to citations as indicators for research impact have been enabled by the proceeding digitalization of the scientific community.
Because scientific publications are to an increasing extent accessed as electronic documents online, the providers of publication outlets hosting those documents can without difficulty record and display the attention that individual publications receive as usage metrics, i.e., as download- or page view counts. Another prevalent family of web-based metrics is called altmetrics, a term coined by Priem et al. (2010) to comprise various signals of the buzz scholarly products receive on social media. The concept of altmetrics includes a heterogeneous multitude of indicators, ranging from counts of postings referring to a publication on social networks like Twitter, over numbers of bookmarks pointing to that publication on the literature management system Mendeley, to the amount of online news outlets and blogs citing the respective publication. Altmetrics have been shown to circumvent several weaknesses of citations as indicators for scientific attention (Wouters and Costas, 2012): they can be collected for a large variety of scientific products, e.g., for software, presentation slides, posters, individual book chapters, et cetera; altmetrics are available much faster than citation counts as the major part of altmetric resonance toward a publication happens very shortly after its publication [see also (Thelwall et al., 2013)]; they show a broader spectrum of scientific impact than citations, as they are able to also reflect resonance among non-scientific audiences; most altmetrics are based on publicly available APIs which are open and free to use, unlike the commercial databases commonly used for citation analyses.
Still, the scientometrics community is widely concordant that altmetrics are by no means meant to be used as self-sufficient, flawless indicators for scientific relevance, but merely valuable complements to existing research impact measures (see e.g., Hicks et al., 2015). Just like bibliometrics, altmetrics come with their own shortcomings and yet unsolved challenges. Haustein (2016) identified issues of data quality, heterogeneity and technological dependencies as three “grand challenges” of altmetrics. Another frequently stated problem of altmetrics is their susceptibility to gaming (Bellis et al., 2014). And altmetrics are—just like the Journal Impact Factor—not fit for cross-discipline comparisons: for example, STM subject areas and Life Sciences tend to be significantly better represented on various altmetric data sources than the Social Sciences, Arts, and Humanities (Jobmann et al., 2014; Peters et al., 2014).
For a metric's applicability to a discipline, that discipline's degree of coverage in the metric's data base is a crucial factor. The smaller the share of a discipline's output that is represented in such a data base, the less truthful and comprehensive measurements based on it will be. In other words, low degrees of coverage diminish the validity of both macro- (e.g., institutional-level) and micro-level (e.g., author- or article-level) assessments of research performance in respective disciplines. In the context of alt- and usage metrics for the Social Sciences this means: as long as only few Social Science publications are made visible on the web, web-based metrics' applicability to the discipline is substantially restricted. For the case of Social Sciences their current low coverage online seems especially deplorable, as due to their also non-satisfying representation in prevalent citation indices (Archambault et al., 2006; Sivertsen and Larsen, 2012) and their compared to “hard” sciences usually lower volume of citations (Glänzel, 1996; Nederhof, 2006) they could benefit particularly from alternatives to citation-based indicators for quantitative research evaluation.
Only if researchers perceive the work-related usage of social media as genuinely beneficial, they will spend time and effort to disseminate and discuss their research on the platforms that can be used to derive web-based metrics for research evaluation. Hence, identifying the barriers that keep social scientists from utilizing social media for work and thus inhibit an increase of Social Science publications' coverage on social media is a necessary part of the endeavor to make altmetrics useful for the Social Science-related fields of research. Such barriers might lie in a wide array of researchers' general concerns regarding the usage of individual social media platforms, which are the main data sources for altmetric data. These concerns might range from concerns regarding technical aspects (e.g., concerns regarding the security of data uploaded to a certain platform) to user- or content-related concerns (e.g., concerns regarding the target groups assumed to be represented on a certain platform). With its goal of identifying such reservations inhibiting researchers from utilizing social media for their work, this study follows previous studies: Nicholas and Rowlands (2011) examined researchers' utilization of social media in the research workflow in a large-scale survey study, which also inquired about barriers inhibiting such usage. Analyzing about 2,000 responses, they found Lack of time, Problems of authority and trust and Unclear benefits to be the most prevalent reasons for researchers not to use social media. In another survey study specifically targeting researchers that already use social media, Collins et al. (2016) asked their participants to state suspected reasons why many of their colleagues would refrain from using Twitter. The most commonly given responses were “Fear of the unknown” and “Lack of time.” In reference to ResearchGate's success, Van Noorden (2014) suggests further possible reasons that might demotivate scientists to use social media professionally: researchers might for instance be wary to openly share data and papers, or they might be repelled by high volumes of emails automatically sent from the platforms.
To better understand and to develop strategies to overcome such concerns we conducted qualitative interviews and a subsequent online survey, primarily addressing researchers from the Social Sciences. By studying the response data we aim to answer the following research question:
RQ1: Which concerns inhibit researchers in their work-related usage of social media?
While identifying social scientists' concerns regarding researchers' professional usage of social media might reveal what would need to be done to increase Social Science publications' coverage on social media, altmetrics' (and usage metrics') usefulness for the discipline is limited by at least one other major factor: their acceptance among stakeholders—most of which will be researchers. Hammarfelt and Haddow (2018) analyzed the attitudes of Australian and Swedish researchers from the Social Sciences and Humanities toward bibliometric indicators, finding that “scholar's attitudes regarding bibliometrics are mixed; many are critical of these measures, while at the same time feeling pressured to use them.” Also they found the shares of researchers that had already used bibliometrics to vary significantly between the two countries. Rousseau and Rousseau (2017) surveyed economists about their knowledge about several citation-based indicators, identifying the Journal Impact Factor as the most well-known indicator, followed by the h-index. Overall they found the bibliometric knowledge of their respondents to be fairly heterogeneous. They propose the concept of “metric-wiseness” to describe a researcher's capacities to appropriately use scientometric indicators. And, among other things, Rousseau and Rousseau (2017) provide arguments why such metric-wiseness might be of particular importance for social scientists, as many researchers might for instance not be aware of the fact that Google Scholar also records citation counts and indices for non-English publications and working papers.
Biblio-, alt-, and usage metrics serve several purposes besides research evaluation (NISO, 2016), e.g., increasing scholarly outputs' discoverability or enabling researchers to showcase their achievements. The acceptance of metrics probably varies with the area of application—in this study however we focus on the most sensitive area, i.e., research evaluation. We therefore also aim to answer the following research question by using interview- and survey data:
RQ2: Which concerns do researchers have regarding various metrics used for research evaluation?
To get to a more accurate picture of whether researchers' stated concerns toward metrics for research evaluation affect their acceptance of certain types of metrics more strongly than others, we also aim to answer the research question RQ3 by drawing from the interview- and survey responses:
RQ3: Which metrics used for research evaluation do researchers consider as useful?
Materials and Methods
To learn about researchers' thoughts and concerns related to metrics as well as social media usage in professional contexts, we conducted usage studies following a two-step approach. As the first step, we interviewed 9 researchers face-to-face in groups about their work-related usage of social media and their notions on metrics used for research evaluation. Although these exploratory interviews allowed us to inquire about individual researchers' usage- and perceptual patterns in great detail, because of their low sample size we cannot assume their findings to be universally valid for whole disciplines. As the second step, we therefore conducted online surveys among the broader population of researchers, which more extensively investigated on the researchers' concerns we learned about during the interviews. This quantitative section of the study is our primary source from which we aim to derive insights that apply to the Social Sciences as a whole.
Methods Used for Qualitative Interviews
Interviews: Design
For the semi-structured group interviews we designed a questionnaire with three sections as a guideline: the first two sections consisted of questions about the interviewees' experiences and perceptions regarding the use of online tools and social media in their field of research, the third section contained questions about the interviewees' notions on various metrics for measuring research impact. We tested and adjusted the questionnaire over the course of four iterations during which various acquainted scientists (without direct relation to our research project) took the roles of the interviewees. After these test runs the final questionnaire contained a total of 25 questions, which in a group with two to three interviewees should in total take between 90 and 120 min to discuss. The interview questionnaire is part of this article's Supplementary Material.
Interviews: Sampling
To recruit researchers as interviewees, we resorted to a subset of the participants of the *metrics project's1 first international survey on social media usage from spring 2017 [see also (Lemke et al., 2018; Mehrazar et al., 2018)]. Like in this study, the 2017 survey‘s prioritized target groups during dissemination had been researchers from Economics, Social Sciences and respective sub-disciplines, which subsequently accounted for 83% of the survey’s 3,427 respondents. At the end of the survey, participants had been given the option to provide an email address in case they would be interested in taking part in other studies related to the *metrics project. From the list compiled this way, we extracted 22 mail addresses from research institutes situated in Northern Germany to allow for easy traveling to face-to-face interviews. We invited the respective researchers to take part in our interviews, offering them a reimbursement of 50€ for their participation. Seven researchers were recruited this way (more information on participants in section Interviews: Demographics).
Along with the responses given by said seven researchers in this article we will also report on the responses given during our fourth internal test run. The interviewees in that final test run were two computer scientists acquainted to the authors of this article. For this test run we used the same questionnaire as during the later, “real” interviews, while our test candidates had been given analogous preparatory information on the interviews' content and purpose as our later, “real” interviewees. Thus, the conditions of that final test run and the real interviews were similar enough to justify the former's inclusion in the results.
While the later surveys should focus exclusively on social scientists, we decided to also allow researchers from other disciplines to the interviews. First, many more general concerns regarding the usage of social media and metrics will be applicable to all disciplines, meaning there would very likely be a lot to learn from the experiences of researchers from other disciplines that also holds true for many social scientists. Second, possible discipline-specific patterns should become easier to detect with interview data for different disciplines at hand.
Written informed consent was obtained from all interview participants before the start of the interviews (the consent form is available upon request).
Interviews: Conduction and Analysis
We conducted the interviews in groups with two to three interviewees, two interviewers and an assistant responsible for the data's later transcription. The role of the interviewers was filled by two of this study's authors (MM & SL). Interviewees were—as far as their availability allowed us to—grouped according to their field of research and their academic rank (see section Interviews: Demographics, Table 1). By interviewing multiple researchers from similar disciplines and career stages at the same time we hoped to allow for more extensive digressions regarding discipline- or role-specific phenomena. All interviews were conducted in English to minimize later translation requirements, regardless of the participants' mother tongues.
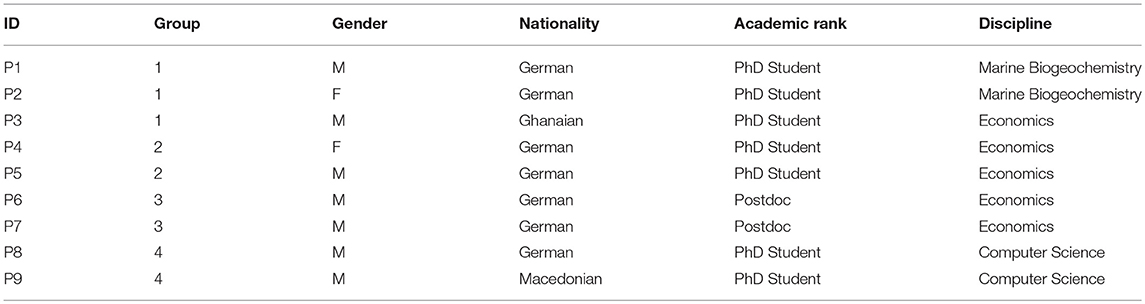
Table 1. Demographic details of interview participants.
The transcribed interviews were analyzed with qualitative methods based on grounded theory (Burnard, 1991). A first topic-related coding of interview contributions was applied during the interviews' transcription. The transcribing assistant and the authors reviewed and discussed the preliminary coding in two iterations; the resulting adjusted coding scheme was subsequently applied to the full transcripts. The coding scheme was used to tag transcript sections in which interviewees stated their concerns and usage purposes, both regarding researchers' social media- and metrics usage. While the coding was used as guidance during the review of the interview data, in this article's results section slightly different, more self-explanatory category names are used to structure the interview results.
Methods Used for Online Surveys
Online Surveys: Design
As our second major step, we designed an online survey to check to which degree observations made during the analysis of the interview responses apply to the broader population of social scientists.
A crucial part of our survey design was the set of social media platforms to include in platform-related questions. As the landscape of social media platforms with potential relevance for researchers is multifaceted and vastly growing (see also Kramer and Bosman, 2015) for a crowd-sourcing-based catalog of online tools used by researchers—in July 2018 it had about 680 entries, many of which could qualify as “social media”), we were forced to select a set of only particularly relevant or interesting platforms, so we would not overwhelm our survey participants with too many sub-questions. The basis for this set of platforms was the previous *metrics survey from 2017, in which we collected extensive data about the online tools used by social scientists, allowing us to derive a ranking of the most-used platforms among these researchers. Starting from the top of the ranking we added every platform to our set that could be classified as social media according to a definition from Kaplan and Haenlein (2010), i.e., “Internet-based applications that build on the ideological and technological foundations of Web 2.0, and that allow the creation and exchange of User Generated Content.” In the next step we removed every platform used by < 100 respondents of the previous *metrics survey from the set. Finally we added Xing and Quora to the set, both of which had not been included in 2017's survey but had been mentioned frequently there as “other platform” by respondents in a respective free text-field. This left us with a set of 18 social media platforms to include in our survey: Academia.edu, Facebook, GitHub, Google+, LinkedIn, Mendeley, Quora, ResearchGate, Scholarly blogs (e.g., WordPress), SlideShare, SourceForge, StackExchange (including its communities, e.g., StackOverflow), Twitter, Vimeo, Wikipedia, Xing, Youtube, and Zotero.
To avoid having an overly time-consuming and exhausting questionnaire, while still being able to ask all the questions we would need to solve our research questions, we decided to split the questionnaire into two separate surveys. The first survey—from here on referred to as survey A—contained a total of 14 questions, the pivotal 6 of them about the researchers' thoughts and concerns regarding their professional usage of various social media platforms. Survey B contained a total of 15 questions, the central 7 of them being about the participants' conceptions regarding metrics that are used to evaluate research impact. The remaining 8 questions were identical across both surveys and aimed at obtaining context information, namely about the participants' demographics and their previous knowledge regarding social media. Both questionnaires are included in the Supplementary Material for this article.
Online surveys: Design—RQ1
To examine to which degree concerns regarding social media usage that came up in the interviews apply to the broader population of social scientists, we incorporated those previously identified concerns into a question for survey A. To account for the survey format we transformed the concern groups found during the interviews into more self-explaining individual concerns, sometimes splitting a group into multiple concerns when this seemed to increase their comprehensibility. This left us with twelve individual concerns to ask for in the survey, e.g., Concerns about privacy, Concerns about data security, et cetera (for the full list of concerns see section RQ1: Survey Results).
Each participant was asked to report which of these concerns demotivate them to use which specific social media platforms in the form of a matrix checkbox question. This matrix question listed on its vertical axis all social media platforms the participant had marked as “used at least once” in a previous question—this should prevent participants from being asked to make statements about platforms whose features they do not know. On its horizontal axis the question contained the 12 concerns mentioned above.
To allow our survey participants to provide further explanations or to add other individual concerns regarding their use of social media for work purposes, the survey question described above was followed by a free text question asking “Are there any other concerns you have using the mentioned services? If so, please tell us.”
Online surveys: Design—RQ2
Our second research question—about the concerns researchers have regarding metrics used for the evaluation of research—was included into survey B in the form of a free text question: “Do you have any thoughts or concerns about using metrics like these to evaluate research? If so, please tell us.” Beforehand, the survey participants had already been asked to assess various types of metrics regarding their perceived usefulness for determining a scientific product's relevance (see section Online Surveys: Design—RQ3 below), so at this stage they would already have seen several examples for the types of metrics we are investigating.
Online surveys: Design—RQ3
This study's third research question was represented by a matrix question in survey B: “The following list contains several types of metrics that can be used to evaluate the impact of a scientific output (e.g., a publication, a video, …) and/or its author. Would you find these individual metrics useful to decide whether to consume (read/watch/…) a respective scientific output?” The “list” mentioned in the question's text referred to the vertical axis of the matrix which listed 14 types of metrics, e.g., Citation number of the scientific output, Number of downloads of the scientific output, et cetera (for the full list of metrics we included see section RQ3: Survey Results). To every type of metric depicted on the vertical axis each participant had to assign one of the five options Very useful, Useful, Hard to use, Useless, No answer/Don't know.
Online Surveys: Sampling
Both questionnaires were implemented and distributed using the online survey tool LimeSurvey2 The sampling process followed the approach of the 2017 survey described in Lemke et al. (2018): a mailing list administered by the ZBW Leibniz Centre for Economics was used to contact about 12,000 researchers working in economic institutions from German-speaking parts of Europe; further invitations were sent to about 42,000 email addresses of authors of Economics- or Social Science-related papers mined from RePEc and Web of Science. As we had divided our questions into two surveys as described above, we also divided these 54,000 mail addresses randomly into two lists of 27,000 addresses, each group receiving an invitation to one of our two surveys. As an incentive for participating, we gave participants the option to enter a drawing of 25 10€-Amazon.com vouchers at the end of the surveys.
Before their submission of responses, participants were asked to give their informed consent about their participation in the survey. On the first page of the survey (see also “Questionnaire for Survey A/B” in the Supplementary Material), participants were provided with respective information about it3 along with the note that at the end of the survey they would be asked to confirm their consent to submit their answers under these terms. Accordingly, on the survey's last page, participants were asked to indicate that they had read all the given information and voluntarily agree to participate by clicking on a submit-button.
Online Surveys: Conduction and Analysis
The initial dissemination of both surveys took place over the course of 20 days from June 25th to July 14th 2018. A wave of reminders was sent to those who had not yet responded to (or not yet opted out of) their first invitation during the second week of August. Afterwards, the survey was kept running till August 27th 2018.
Results
The following sections provide results from the interviews and online surveys regarding our three research questions.
Interviews: Demographics
Table 1 shows demographic information about the participants of the qualitative interviews. The recordings of the four group interviews added up to 375 min of interview material, which were subsequently transcribed and coded. The allocated time was almost equally distributed among the four groups.
Online surveys: Demographics
Till the day on which we closed the two surveys, 1,065 participants had responded to survey A, 1,018 participants to survey B, meaning a rate of response of ~4% for both surveys. For our study we are primarily interested in the perceptions of all kinds of social scientists, therefore we considered only responses from researchers identifying themselves in the survey as primarily working in either Social Sciences, Political Sciences, Sociology, Psychology, Demography, Human Geography, Economics or Business Studies. This leaves us with 872 respondents for survey A and 948 respondents for survey B. Table 2 shows the demographic properties of those respondents.
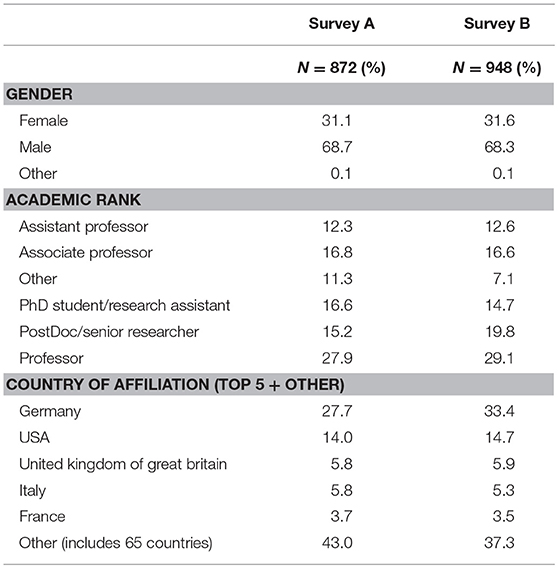
Table 2. Surveys–demographics.
The median time participants spent in the survey was 7 min 51 s for survey A and 6 min 54 s for survey B.
RQ1: Which Concerns Inhibit Researchers in Their Work-Related Usage of Social Media?
To provide answers to our first research question we will first review the segments of our qualitative interviews in which participants expressed concerns and reasons that might inhibit them or their colleagues from using social media platforms as part of their work life. Afterwards we will report data from our online surveys, in which we asked a larger sample of social scientists about the concerns we had compiled through the interviews and subsequent discussions.
RQ1: Interview Results
In this section we describe statements from the interviewees relevant to RQ1. We start with the concerns that were brought up more frequently and then move to the less often expressed issues.
Represented target groups/style of communication
A concern inhibiting social media usage for professional purposes mentioned in every single group interview was the suspicion, research-related communication on social media would often remain shallow due to the target groups represented and reachable on the respective platforms.
P2, P3, and P8 specifically mentioned Facebook as an example for a service that is usually more associated with non-professional, casual communication, which is why they would not expect researchers to share a lot of professionally relevant information or articles there. Independently confirming this, P7 stated: “I wouldn't post a paper I published on Facebook, because I have so many friends who are not into research; who are not really interested in that.”
Also, P2 added that she would distinguish between media and platforms suitable for communicating with researchers and others suitable for the communication with policy makers or the broader public.
P1 mentioned scientific communication on social media sometimes being restricted by the need to address too many target groups at once: “I get suspicious if it gets so superficial. I mean, if you communicate something that addresses many target groups – policy makers and economists and the broader public – then sure, Twitter can be used – for information that is not so into detail.” Related to that argument, P2 stated a concern regarding how Twitter's technical details restrict professional communication in a similar fashion: “If you have only [140] signs[…], that's just too short. And my problem with that is that I would never know what I can put there while still being precise and basing on the facts. […] I could imagine that this applies to many researchers, so that's why they don't have an account there, because they simply don't really know how to use that and still be a researcher.”
Information overload/spamming
Another frequently stated concern referred to the problem of dealing with information overload or spamming during platform usage, either previously experienced or just expected by the participants.
While P1, P2 and P8 named Twitter as a service often sending overwhelming amounts of notifications, P1 and P7 mentioned similar problems with ResearchGate.
Moreover, referring to ResearchGate, P7 mentioned another related concern that might prevent researchers with teaching duties from using platforms that enable one-sided follower-relations: “Also students use it. And then you will get like 20 students per semester which want to – or which will follow you. I mean, it's not ‘want to follow’, they follow you. […] And that's a bit annoying. So that's why I don't really use it.”
Another reported facet of information overload experienced when using social media for professional purposes lies in the difficulty of distinguishing important from unimportant information, as explained by P1 and P8. This leads P1 to believe that services like Twitter are more appropriate for achieving an overview than for investigating about “actual research.”
Related to this, P3 explained that especially on ResearchGate he is sometimes missing compliance with quality standards: “I know a lot of others who are using ResearchGate as a playground. Any little thing they do, they put it there. They developed a small proposal that has not seen any proofreading – they put it there.” Similar impressions were stated by P4: “On ResearchGate I would always think that there is ‘quantity over quality’ for most of the people. Because they put all their work there and then, of course, I know that not all of the listed articles are of high quality.”
P2 explained a problem of being bothered with redundant information resulting from connecting to the same persons or institutions on several platforms in parallel: “What I find irritating is when they share something on Facebook, Instagram and WhatsApp and I get the same message three times in a row.”
A very specific aspect related to the concern of spamming was described by P1, who referred to the experiences of a publicly well-known researcher working on emotionally charged topics: “There is one [colleague] that says, he doesn't for example use Twitter or Facebook, because he would be spammed with emails or requests, because the research he undertakes is kind of a very emotional hot topic. […] So at some point I guess you have to refuse to use these kinds of media, because you otherwise would get spammed.”
Time consumption
Similarly consistently, interview participants mentioned the concern that social media usage could easily consume much time (P1, P2, P3, P4). Closely related to the problem of information overload, participants frequently brought up the assumption that making sense of the volume of information incurring in social media would cost time that could likely be better spent for other aspects of work. As P1 put it: “And I think one thing stays constant the whole time and that's the time that people have during a day. I mean, there is more and more popping up, more and more to do, but everyone just has the same amount of time, so something has to fall over the table.”
While P4 acknowledged that a researcher's high degree of activity on social media could hint at that researcher being a good networker, she still expressed doubts about whether using the time for networking on social media is really well spent: “I would also say the good networkers are those who are using [Social Media] more frequently, but one could also say that they could use the time they spend on social media, promoting and working on their profiles, they could rather use it to do research or something like that.” also adding that “I also know that you can get lost and can waste a lot of time on those platforms. As I said, when I don't have anything to do then sometimes I go on ResearchGate […].”
Separation of private and professional matters/Privacy
Often the aforementioned concern of time consumption seemed to be related to another concern: the question whether time spent on social media can actually qualify as “work” and whether it is therefore appropriate for researchers to spend the time necessary for social media's utilization during worktime. Very clearly stated was this issue by P8, who explained: “I think social media and Computer Science has always a little bit of… bad flavor? Kind of, if you use social media then you're not working (laughs).”
P4 even reported that “if my professor walks into my office and I have Facebook and Twitter open, I always close it (laughs), even though I might be on [professionally relevant sites].”
Another problem related to the separation of private and professional matters on social media and mentioned during most interviews are the difficulties that arise from using private social media accounts for professional communication.
P8 stated that while he finds it easy to follow a quite strict policy of using Facebook for private and LinkedIn for professional communication, he misses this kind of clarity on Twitter, making it more difficult for him there to determine which information is important for him and which is not.
As was previously reported regarding the concern Represented target groups, P7 also would not use Facebook for professional postings as this would lead to private contacts being addressed that probably would not be interested in the respective postings. P7 even stated that he would be aware of functions helping in this case, but would find it too bothersome to use them. Additionally, he stated an analogous concern regarding his professional contacts; adding them on Facebook would enable those contacts in undesirable ways: “I mean they could see some comments I did, I don't know, ten years ago on some picture and maybe, I don't know, at a late time at night. Yeah, I mean this kind of stuff…”
P6 phrased his disinterest in using his private social media accounts for professional purposes differently: “I [just don't think that] someone who I'm in a direct professional relationship with needs to see my interests, or needs to know me that close.”
Data security
P1 mentioned that concerns about the security of data uploaded to social media platforms led to restrictions regarding which platforms researchers at his institute are allowed to use for professional purposes, explaining that there would be “clouds that are set up specifically for [storing] data,” that these researchers had to use instead.
Paywalls
P3 stated a concern specifically regarding the usage of the academic social network Academia.edu, stating that the service would require users to make fee-based subscriptions to increase the visibility of their articles—an approach that according to P3 would have led to a lot of his colleagues moving to ResearchGate instead.
Apart from these concerns regarding the professional usage of social media, P4 and P9 also brought up the concern how the availability of social media might lead to disadvantages for researchers not using those new opportunities for their work. P9: “When I went to a conference I saw that everybody was using Twitter, to share the program or to just follow each other, and then it was a must. […] Practically it was a requirement to fully participate and follow the event (laughs).”
P4 speculated that the rise of social media might especially benefit researchers with certain skillsets: “I don't know if it's a disadvantage for people who are not so good networkers, because they now are even less visible than they have been before.”
RQ1: Survey Results
As explained in section Online Surveys: Design—RQ2, transforming the concern groups we encountered in the interviews into individual concerns to ask for in the survey left us with 12 such concerns:
• Concerns about data security
• Concerns about privacy
• Concerns about the respective user base (e.g., in terms of expected reactions/addressable target groups)
• Costs too much time
• Lack of interest
• Overwhelming amount of data/news
• Spamming
• There are better alternatives
• Too few/restricted functions
• Too many emails sent from the platform
• Too many functions
• Usage feels inconvenient
Figure 1 shows how often the individual concerns were marked in survey A for all platforms aggregated. The percentage values express the shares that the occurrences of a specific concern have among all concerns reported in total. It can be seen that, if no distinction between platforms is made, costs too much time (887 occurrences) is the most frequently reported concern demotivating our survey participants from using social media for their work. Also relatively high rank a general lack of interest (727) as well as concerns about privacy (718). The lowest ranked concerns are too few/restricted functions (410), spamming (362), and too many functions (160).
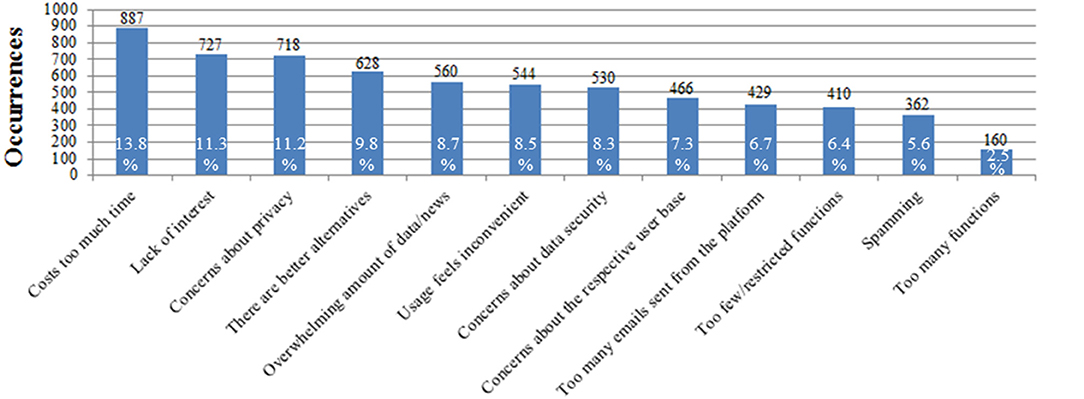
Figure 1. Social scientists' concerns regarding social media usage for work purposes (non-service-specific).
Figure 2 shows the data from Figure 1 broken down by gender, with positions on the y-axis in this case indicating the shares that occurrences of a specific concern have among all concerns reported by respondents of the respective gender in total.
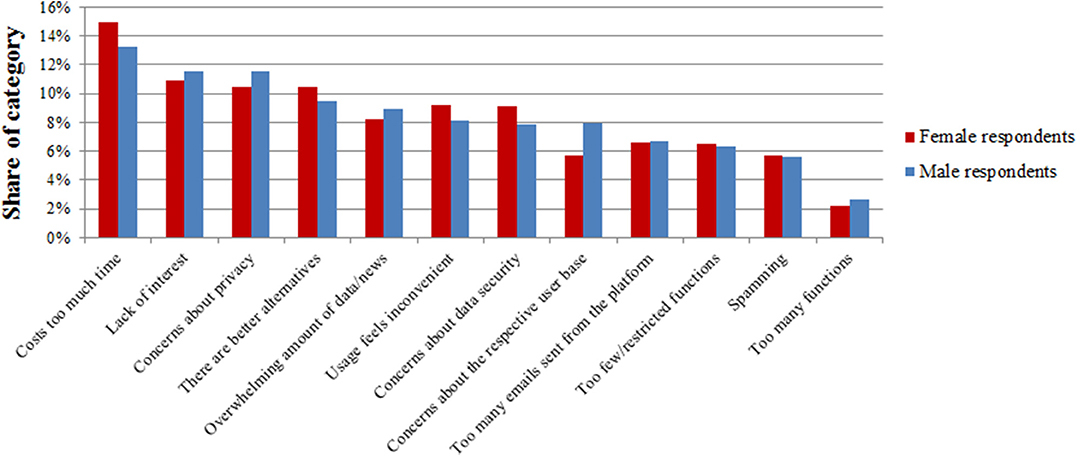
Figure 2. Concerns regarding social media usage for work purposes (non-service-specific) by gender.
Analogically, Figure 3 shows concerns broken down by respondents' research roles. The group of “Professors” in this case includes respondents identifying as associate-, assistant-, as well as full professors; “PostDocs” include postdocs and senior researchers; “Ph.D. students/Research assistants” include respondents identifying as either Ph.D. students, research assistants or a combination of the two.
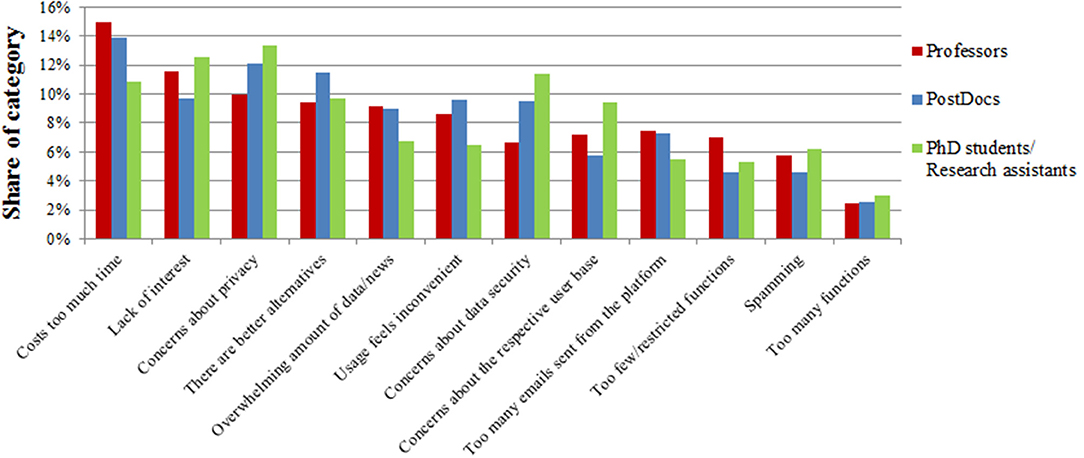
Figure 3. Concerns regarding social media usage for work purposes (non-service-specific) by role.
Drawing from the response data from the same survey question, Figure 4 shows concerns related to individual platforms as a heat map. The data from every cell of the map was normalized by the number of survey participants who previously had stated that they would have used that platform at least once—this number equals the amount of participants who had been asked to voice their concerns regarding the respective platform. This way the heat map shows whether there are certain concerns that particularly large proportions of the users of a specific platform share. Darker cells represent concerns more commonly expressed in conjunction with the respective platform, brighter cells less frequent concerns. Our way of normalizing data means that the presented color coding is insensitive to the variation of usage degrees between the platforms—information on the percentage of survey respondents who reported to have used a respective platform for work at least once is therefore given in column UD, on the right side of Figure 4.
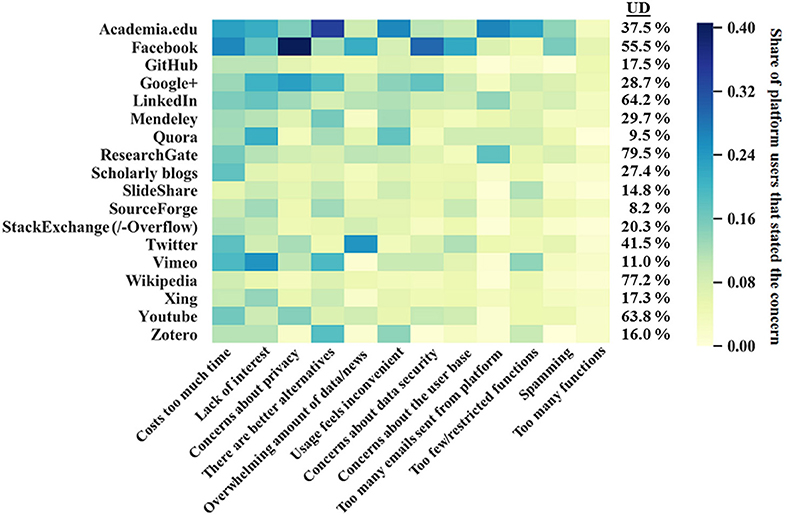
Figure 4. Social scientists' concerns regarding social media usage for work purposes (service-specific).
Comparisons of individual rows of the heat map show how platforms perform regarding user concerns: the darker a row, the more concerns were voiced regarding that platform's usage. It can for instance be seen that researchers have few complaints regarding GitHub, StackExchange or Wikipedia in general. Academia.edu, Facebook or Google+ on the other hand exhibit wider varieties of perceived deficiencies. Looking at the darkest cell of a given row reveals the most widespread concern related to a respective platform—this way we can for example see that Academia.edu, Zotero, and Mendeley are often considered to be suboptimal choices as there are better alternatives available; Facebook and Google+ prevalently arouse concerns regarding privacy; ResearchGate tends to annoy its users with too many emails; Quora and Vimeo simply do not catch many researchers' interest; and on Twitter the amount of news/data displayed is found to be overwhelming. Going through the heat map column by column leads to a view similar to the one presented by Figure 1, as particularly bright columns correspond to overall rarer types of concerns and vice versa.
Answers to free text question
In addition to marking their service-related concerns in the matrix question, a total of 125 participants also entered a response to the accompanying optional free text question “Are there any other concerns you have using the mentioned services? If so, please tell us.” Cleansing this data from non-topical answers like “no,” “don't want to answer,” et cetera left us with 72 answer texts, which were subsequently coded according to the concern categories used before. This revealed that many answer texts once more confirmed the concerns asked about in the previous survey question—most frequently answer texts repeated that social media usage would cost too much time (13 times), platforms' target groups would not match the researcher's (8 times), and the usage of (often specific) platforms would feel inconvenient (5 times). Apart from such answers repeating previously identified concerns, three additional kinds of answers occurred repeatedly: a total of 8 respondents mentioned financial costs or “paywalls” as disincentives, often specifically referring to Academia.edu (Note: although this concern had also been brought up during the qualitative interviews, we had not included it as a predefined answer in the survey as we had deemed it to be applicable to too few of the platforms we planned to ask about). Another five respondents stated that they perceive the lack of quality assurance on social media as a problem, while two respondents mentioned the difficulty of sharing contents from within one platform with people outside of that platform as a disincentive—a result of the “‘walled garden’ model” of Academia.edu and ResearchGate, as one respondent called it.
Beyond that, some more specific concerns occurred in the responses only once each. These included gender bias and a missing openness to new Economics-related entries on Wikipedia, the fact that nothing one puts on the internet can really be deleted, and the fear that “it can be seen as unprofessional to use social media as a researcher.” Another researcher reported a very specific reason for frustration coming out of using social media: “One of the platforms really annoyed me because there was a high access to one of my papers, but I could not retrieve any citation.” Finally, one respondent just stated that “some services are not meant to be used academically” without further explanation.
RQ2: Which Concerns Do Researchers Have Regarding Various Metrics Used for Research Evaluation?
After having looked at the concerns that inhibit social scientists from using social media for their work, we in this section will report on the thoughts and concerns that researchers participating in our user studies stated regarding the usage of various research impact metrics, several of which draw from the previously examined online platforms. First we will review respective responses from our qualitative interviews, then we will inspect our survey data to examine how the perceptions of our interviewees compare to those of a larger sample of social scientists.
RQ2: Interview Results
Researchers' prior knowledge regarding metrics for research evaluation
An observation made repeatedly during all interviews was that when asked which indicators would come to the interviewees' minds upon hearing the terms “metrics for scientific impact” or “metrics for research evaluation,” in every single interview the first indicators to be mentioned were citation-based. P1, P2, and P3 started with mentioning the h-index, citations, and the Journal Impact Factor (in that order), P4 and P5 mentioned the Journal Impact Factor and citations, P6 and P7 mentioned the Journal Impact Factor and the h-index and P8 and P9 mentioned citations and then researchers' numbers of publications. After a bit of discussion P4 also suggested the ResearchGate score, P5 stated that he had also heard of the h-index before, P7 mentioned the Handelsblatt-Ranking, P6 the GEWISOLA-Ranking as well as university rankings. Beyond that, none of the interview participants seemed to have an idea of the concepts of altmetrics or web-based usage metrics for the evaluation of scientific impact yet. Also, even when interviewees named more intricate metrics like h-index or Journal Impact Factor, they were barely able to explain correctly how these indicators are calculated.
After these initial questions we provided the interview participants with a handout featuring a list of various existing indicators for research impact, explaining individual indicators where necessary. This list included citations, h-index, Almetric.com score, ResearchGate score, download counts, science rankings, Journal Impact Factor, Eigenfactor, and nine types of web citations as they can be collected with existing altmetric software such as Altmetric.com or Webometric Analyst (http://lexiurl.wlv.ac.uk/), e.g., Mendeley reader counts, Wikipedia citations, Google book citations et cetera. After the interviewees had read that list, we asked them what they would think about metrics used for research evaluation in general and about the ways these metrics are used right now.
Lack of familiarity and transparency
In line with the previously identified interviewees' limited prior knowledge regarding metrics, a frequently stated concern regarding their usage involved a perceived lack of familiarity with and knowledge about them. As a result, many types of metrics remain non-transparent to our interviewees, which limits their abilities to trust in the metrics' validity. As P8 stated with regards to web-based metrics: “Most of the [types of] web citations I just don't know, I have to admit. […]This is always a problem, when I don't understand their metric, what does it tell me? And if I then need to invest a lot of time to understand the metric or if it's not even publicly available, then I can just not use it.” But, according to P8, classical bibliometric citations have similar problems, stating that “nobody knows where [providers of citation data] get their numbers from, and how they aggregate them and in which intervals. So okay, what does it tell you now, that their Google Scholar says 1,700 citations? Nobody knows.” A similar point—regarding metrics in general—was made by P1, who stated: “The point is – is [metric data] really transparent? So, is everyone in the same knowledge what it means? And the more [metrics] there are out there, the more – at least as an early career scientist – the more you resign. The more you kind of give up to really look through all this.” The problem of insecurity about how to interpret metrics was confirmed by P2, who mentioned that she had no idea about how to inquire truthful citation counts for a given article.
Reliability
In several cases interviewees went one step further than voicing concerns about metrics' missing transparency by questioning whether the metrics reliably captured what they might claim to capture at all.
Referring to citations, P2, P3, and P8 all mentioned that they would not believe them to be reliable proxies for scientific quality, but emphasized the necessity to check an article's content to be able to evaluate it truthfully. P8 illustrated citations' shortcomings as proxies for scientific quality with an anecdote from the field of Computer Science: “You see with these neural networks, most of the publications I think were from the eighties and nineties. Nobody really cared about them – now everyone seems to care about them. The publications from 20, 30 years ago get really high citation counts, but although this means only now they have an impact, the quality was good 20, 30 years ago, when they had no impact. […]And there I see a little bit of difficulty, because a low level, low quality paper can have a huge impact when it's just of popular interest, and the other way around.”
P6 showed awareness for the Matthew effect of citations, stating that “once you are above a certain threshold of citations, you probably receive lots of more citations, even though [the article] is not that relevant.”
Another mentioned drawback of citation counts was the concern that their validity as proxies for relevance could easily be distorted by self-citations (P3).
Moving on to web-based metrics, P5 and P6 both stated that they would perceive social media-based metrics merely as “network measures,” which indicate how well connected an author is and not necessarily the relevance or quality of a respective publication.
P4 mentioned that she would not likely trust in download counts as indicators for scientific relevance due to how easily they could be gamed. A similar mindset regarding the potential value of download counts was expressed by P6, who stated that it would be “easy to download an article and throw it in the virtual trash.”
Regarding the differentiation between scientific quality and relevance, P6 and P7 shared thoughts on which types of metrics might better reflect which of these two properties. P7 said that his “greatest concern” regarding social media-based metrics would be that while they might successfully capture what a broad audience or the media perceives as relevant, highly theoretical or foundational research might have considerable disadvantages there, even though it might be of high quality, highly useful for its specific community and therefore often cited by it. P6 seconded this by adding an example from the field of food security: “So, when it's about understanding when prices spike or why prices have a certain movement or behaviour, this is usually of high policy relevance and everyone wants to know about it. But the methods to understand price behaviour or to identify the drivers – these papers are more important but would never be on the media, because no one will be interested in understanding the estimator and the standard error or whatever. […] In our area […] works are based on a model which you need to calibrate, which is the high quality research that is in the shadows somewhere, because it [is neither empirical nor does it have any policy implications]. But it's the base for all the applied work.”
Restricted comparability
Another set of stated concerns referred to perceived limitations regarding the validity of cross-discipline or cross-community comparisons based on metrics.
Such concerns were particularly often related to the Journal Impact Factor. P4 explained this by mentioning how top journals from Natural Sciences would typically exhibit much higher impact factor scores than top journals from Economics. P6 described similar conditions regarding comparisons of different sub-fields from Economics.
P3, P6, and P7 reported of known cases in their disciplines in which impact factor comparisons would not reflect the relative prestige certain journals have among their research communities, with P7 assuming that the degree of interdisciplinarity of a journal would influence its Journal Impact Factor: “For instance, in agricultural economics the journal with the highest impact factor is maybe ranked third or fourth if you consider the prestige of the journal. But it has the highest Impact Factor because it's a bit more interdisciplinary – it has a broader audience and higher citations. But everyone in the field knows that another journal is the number one in the field, although it has a lower impact factor.”
P9 mentioned the necessity to keep in mind that metrics need time to accumulate, something that should be considered especially when evaluating the impact of younger publications.
Increasing publication pressure
While the above mentioned concerns mostly deal with the correct application or interpretation of metrics, another set of concerns expressed in the interviews was linked to possible negative effects on the scientific system caused by the usage of quantitative impact metrics in general.
P1, P2, P3, and P5 voiced assumptions that the expanding quantitative evaluation of research outputs would increase the already existing pressure for researchers to publish. P5 hypothesized that the wide usage of quantitative impact metrics might lead to a gratification of quantity over quality, making publishing a higher priority than carrying out truly valuable research: “You have to deliver. […] If you're this far away from the solution but you don't get it published, that doesn't make you a bad researcher, but it will get you very low scores. […] The pressure to publish something at some point is definitely something that is not really pushing quality.”
RQ2: Survey Results
Similar to the question we asked in the interviews, we also in the survey inquired about the participants' concerns regarding the usage of metrics by asking “Do you have any thoughts or concerns about using metrics like these to evaluate research?” as a free text question. In total 241 responses were collected this way, of which 215 answer texts remained after the removal of non-topical answers. These 215 answers were coded manually for the themes and concerns regarding the usage of metrics they addressed, one theme per answer text. The high topical variation between the answers led to a large number of themes identified this way—nevertheless, certain themes reoccurred especially frequently in the answer texts. Table 3 shows the ten themes that occurred more than five times along with examples taken from the response data.
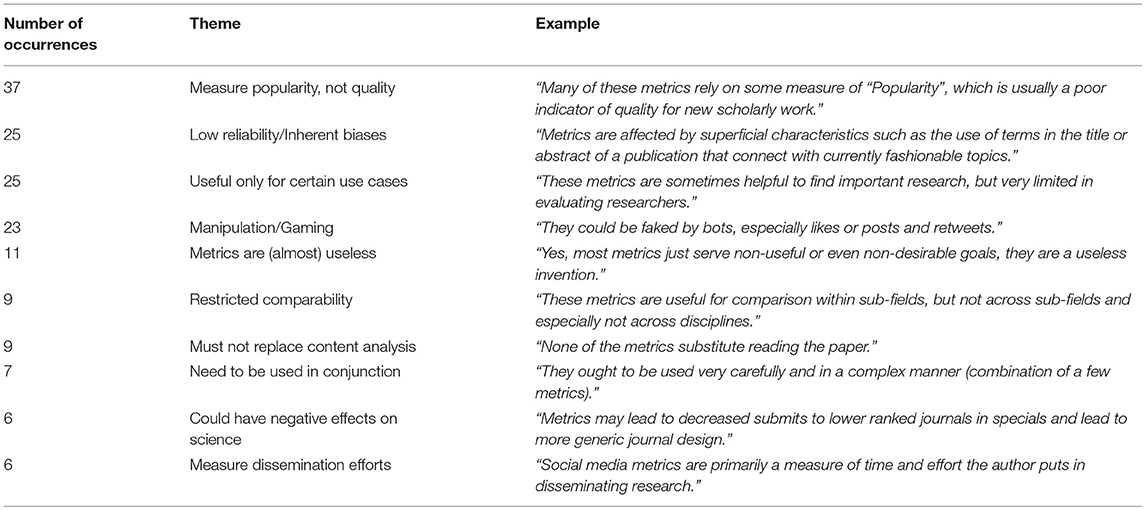
Table 3. Survey responses—concerns regarding the usage of impact metrics.
Most of the concerns we encountered during the qualitative interviews reappeared in some form in the survey responses, although with different intensities. The most frequent kinds of concern stated in the survey refer to the notion that metrics might be misused as direct indicators for scientific quality, although they are perceived to primarily be indicators for popularity or the degree of dissemination efforts undertaken. Many researchers also suspect specific types of metrics to be inherently biased, be it toward certain fields, certain forms of publications, more “mainstream” research, “fashionable topics,” English publications, and against “hard science” and small fields of research. Other widespread concerns relate to metrics susceptibility to gaming and their shortcomings during comparisons. Slightly more optimistic groups of answers stressed that metrics do have value, albeit use cases have to be selected carefully, they may not replace the consideration of a publication's content entirely, and instead of using isolated metrics they should be used in conjunction. A few answers described particular negative effects the reliance on metrics could have for science in its entirety, e.g., by leading to researchers spending less attention to the underlying research of publications, by incentivizing a “click bait behavior” among researchers, or by leading to “decreased submits to lower ranked journals in specials” and thus ultimately to “more generic journal design.”
When we compare interview- with survey responses, one major difference becomes apparent: while for the interviewees their lack of familiarity with many metrics and their perceived non-transparency was a very present concern, in the survey only few participants reported similar issues (only 3 occurrences). We propose two explanations for this: (1) participants of the survey might just not have felt asked to explain their state of knowledge in this question, while in the interviews we purposefully led the conversation to this aspect, and (2) our interviewees' overall lower average academic experience might also explain comparatively lesser knowledge about impact metrics and their methodologies, making perceived lack of familiarity and non-transparency more apparent issues.
RQ3: Which Metrics Used for Research Evaluation Do Researchers Consider as Useful?
To obtain a precise picture of how the previously examined concerns affect researchers' perceptions of individual metrics in comparison, we will now review our interviewees' statements about how they utilize these metrics themselves, before again consulting the survey data on this matter.
RQ3: Interview Results
As seen in section Interview Results, the interviewees' preconceptions regarding research metrics were mostly restricted to bibliometric indicators, in particular citations and Journal Impact Factor. Accordingly, when asked if and how they would make use of such metrics themselves, most responses revolved around these indicators.
Journal Impact Factor
Although the Journal Impact Factor was, along with citations, the most frequently brought up metric during the interviews, notions about its usefulness seemed to vary a lot between the researchers. P3 explained that the Journal Impact Factor would play a major role for him during literature research because of a particular previous experience: “I remember I was once using a paper to argue at one of my presentations and the professor mentioned “What is the source?” I mentioned the article and then the journal. Then he turned to the postdoc asking “Has it got an impact factor?” and the postdoc said “No, I don't think so.”
P1 and P4 also mentioned that the Journal Impact Factor would sometimes help them as a filter mechanism, although they would not solely rely on it. P2, P6, and P7 on the other hand stated that they usually would not pay attention to the Journal Impact Factor due to their concerns regarding its comparability (see section Interview Results). Nevertheless, P6 said that looking into highly ranked journals according to Journal Impact Factor can be a good way to get informed about “the newest kind of research,” as the most progressive research will more likely be found in highly ranked journals.
Citations
Despite the various concerns interviewees expressed toward citations' shortcomings as indicators for quality or relevance, many of our participants stated that citation counts would be helpful to quickly identify the most important publications in a certain field of research (P4, P5, P6, P8, P9).
According to P4 and P5, citation counts get more meaningful the higher they are—so although in many common cases they might not be reliable indicators for an article's relevance, if an article reaches an unusual high amount of citations one can fairly reliably assume that article to be of particular relevance for its field.
Furthermore, P5 and P6 stated that sometimes a particularly high citation count might indicate a “mandatory” citation in its field of research, “[an article that] you have to cite to be taken seriously in the field” (P5) or rather “a citation [that] must not be disregarded when it comes to your own research” (P6).
Hypothetical metrics
At some points during the interviews, interviewees described possible metrics they would find interesting, although they did not ever use anything like them until now. For example, P7 and P8 expressed interest in a (hypothetical) metric that would capture citations along with context information about the citing works. P8 suggested to somehow capture the shares of criticizing, negative citations, while P7 would like to see citation counts that only include citations from peer-reviewed sources, not knowing that Web of Science provides such features. P9 on the other hand said that he would imagine an article-level metric informing about the number of researchers currently considering that piece of work as a reference to be helpful—so effectively a metric reflecting the expected future citations of an article.
RQ3: Survey Results
Figure 5 shows the survey participants' responses to the question “The following list contains several types of metrics that can be used to evaluate the impact of a scientific output (e.g., a publication, a video, …) and/or its author. Would you find these individual metrics useful to decide whether to consume (read/watch/…) a respective scientific output?”
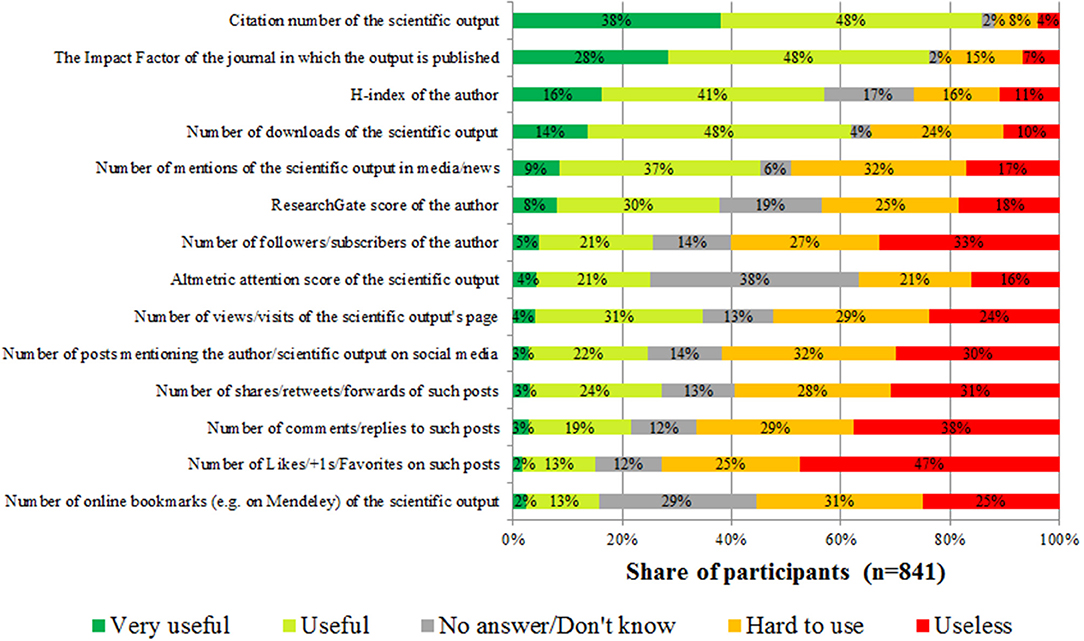
Figure 5. Perceived usefulness of different types of research impact metrics for social scientists.
It can be seen that regarding the shares of participants describing a metric as very useful the bibliometric indicators clearly lead the field, although with considerable differences between each other: the highest acceptance receive citation counts, followed by the Journal Impact Factor, while the h-index ranks on the third position regarding participants judging that metric to be very useful. Looking at web-based metrics, only download numbers are considered to be either useful or very useful by a comparably large share of participants. The various altmetric indicators all perform drastically worse regarding their perceived usefulness—for all of them the shares of participants considering them to be useful or very useful are lower than the shares finding them either hard to use or useless. Another tendency indicated by Figure 5 is that the metrics that are perceived as less useful on average also seem to be unknown to larger shares of respondents. Regarding awareness levels, the most noteworthy case is the Altmetric attention score, for which the group of participants not knowing said metric (38%) is larger than any of the other four groups.
Discussion
RQ1: Which Concerns Inhibit Researchers in Their Work-Related Usage of Social Media?
Our interviews revealed several distinctive types of concerns that demotivate social scientists to use social media in work-related contexts, the most frequent being: the platforms' target groups and prevailing styles of communication are often felt to be unsuitable for academic discourse; social media usage seems to cost much time; on several platforms separating personal from professional matters is bothersome; and the utilization of more platforms increases the efforts necessary to handle information overload. The wider prevalence of these concerns was also confirmed by the responses to our survey, where especially the aspect of time-consumption stood out as an often held concern—a finding in line with previous studies (Nicholas and Rowlands, 2011; Collins et al., 2016). Researchers' reluctance to use social media due to the platforms being perceived as unsuitable for scientific discussions on the other hand confirms a finding by Collins et al. (2016), who report similar concerns from researchers for the specific cases of Facebook and Twitter. Moreover, our survey data showed that complaints about the platforms' technological affordances, e.g., complaints about the amount of functionalities provided, play comparatively minor roles for the social scientists that participated.
Several of the identified concerns often seem to be intertwined: the impression that utilizing social media channels might cost so much time could well be a result of having to cope with an overload of available information there, a problem which bothers many respondents. Similarly, although an effective separation of professional from private matters could on most platforms be realized by consistently maintaining separate profiles for both scopes, this would often be inconvenient and time-consuming. In the interviews we learned that even when platforms already provide customizable filters to reduce the incoming amount of information or functionalities to manage different groups of contacts, respondents find their usage bothersome and thus ultimately not worth the effort. We think that in these aspects lies a lot of potential for technological improvements of the existing social media platforms which researchers could particularly benefit from, for instance in the form of easier-to-use and more transparent information filters, or in form of tools that assist in the creation and maintenance of multiple clearly divided profiles on the same platform.
The fact that academics hesitate to use certain social media platforms for scientific discussions because they perceive the style of communication on those platforms to be non-academic could be a self-fulfilling prophecy (Merton, 1948): similar to how rumors about a bank's insolvency—no matter whether true or false—can lead to that bank actually becoming insolvent as a result of customer actions motivated by the rumors, mere suppositions of a platform not being suitable for academic communication could lead to academics abandoning that platform, subsequently further depleting it of academic contents. Such developments would severely reduce social media platforms' value for the scientific community, both as tools for scholarly communication and as sources for altmetrics data. Overcoming this problem seems to be a particularly difficult task—what could help to showcase individual platforms' potentials as tools for scholarly communication would be to bring subject matter experts together in highly focused and easily discoverable discussion groups, similar to how mailing list services like JiscMail4 manage email-based discussion lists for clearly defined interest groups. Although various social media platforms offer group- or list-functionalities that can be exploited for such discussion groups, browsing already existing groups can be difficult due to a lack of structured directories cataloging them. Another way of encouraging more social scientists to go online and increase the amount of scientific discussions on social media would be to explicitly integrate some online dissemination efforts into institutions' codified publication workflows. Such measures could also counter the researchers' feeling of not doing work when being on social media, as it was expressed in our interviews. This feeling is also fed by the fact that online visibility still barely counts in the reputation system of science, leading to a lack of external incentives to actively use social media platforms as a researcher.
In spite of all the barriers discussed in this article which inhibit social scientists in their work-related use of social media, interviewees also occasionally expressed the belief that not using social media could nowadays lead to noticeable disadvantages career-wise. Thus, right now many researchers might feel pressure to engage in professional social media activities, although various concerns make it a cumbersome or uncomfortable experience for them. Hence, developing tools to overcome these concerns is not only a necessary step to increase Social Science publications' visibility online and thus allowing the discipline to benefit from web-based impact measurement, but also a way of addressing everyday needs social scientists will most likely continue to face in the times to come.
RQ2 and RQ3: Which Concerns Do Researchers Have Regarding Various Metrics Used for Research Evaluation? Which Metrics Do They Consider as Useful?
Considering our second and our third research question, the first finding of the interviews was that the researchers' knowledge about metrics was mostly restricted to bibliometric measures, and even there some often-used concepts like the Journal Impact Factor or the h-index were in many cases not understood in detail. Nevertheless, it could be seen that the researchers do use bibliometric indicators, mainly for filtering purposes during literature research or to assess journals when considering where to publish their own research. Also, many interviewees and survey respondents showed awareness of some of the indicators' specific shortcomings, e.g., their restricted applicability in several kinds of comparisons.
As could also be seen in the interviews, non-bibliometric alternatives like usage- and altmetrics many researchers are not even aware of. Accordingly, the survey-based comparison of the perceived usefulness of various types of metrics revealed that bibliometric indicators are perceived as useful by much larger shares of the community of social scientists than altmetrics, with usage metrics mostly lying in between. Two differing explanations for perceiving a metric as useless are possible: first, a metric can be seen as inherently flawed and thus not suitable for measuring what is meant to be measured; second, missing expertise about how to apply and interpret said metric might make its utilization so difficult it becomes effectively useless, although the metric in principle might have the desired properties to measure what is meant to be measured. While several free text responses to the survey indicated that some researchers reject certain metrics due to suspected inherent flaws, our interview and survey results strongly suggest that also the second reason might apply to many social scientists.
Hence, the lack of familiarity with existing metrics substantially constrains their usefulness for individual researchers. Many survey respondents voiced their concerns of metrics being misused—be it unintentionally or on purpose. Researchers' limited knowledge about the indicators' properties increases the risk of such unintentional misapplication and -interpretation. Thus, for social scientists the sheer lack of knowledge seems to be a decisive hindrance to making better use of metrics for research impact. This indicates that Social Science researchers could benefit from better formal training in the correct application and interpretation of metrics. Such training should ideally already be provided in “scientific working” courses at universities and be explicitly supported by thesis advisors, but also libraries can play an important role here by informing about the whole range of indicators available, their individual fields of application, strengths, and—especially—their limitations. Content-wise, the recommendations provided by the San Francisco Declaration on Research Assessment (Cagan, 2013) and the Leiden manifesto (Hicks et al., 2015) provide foundations for guidelines that researchers could be provided with. Moreover, various online resources exist that can be helpful for informing about metrics' peculiarities in more detail, e.g., the Metrics Toolkit5, the Parthenos project's modules on research impact6, or EC3metrics' periodic table of scientometric indicators7. A better familiarity with metrics among social scientists would address researchers' frequently brought up concern that metrics appear non-transparent in their methodologies, decrease the risk of unintentional misapplication, and could also dispel a commonly stated reason for frustration by clarifying which kinds of comparisons on basis of certain metrics are valid and which are not. Also, as Rousseau and Rousseau (2017) argue, “a basic knowledge of informetrics, including knowledge of scientometrics indicators and data sources, should be part of any doctoral education” so that “assessment processes […] would potentially be less distorted and the advantage of more knowledgeable researchers would be reduced.” Thus, a better and more comprehensive education about metrics could also lead to more fairness in research assessments by at least slightly leveling the field regarding researchers' knowledge about how to optimize metrics for their own research outputs.
Beyond that, interviewees and survey respondents voiced a multitude of suspected negative effects that an excessive focus on metrics might have on science in general, e.g., higher publication pressure for individuals, increased concentration on more conservative and therefore “safe” research endeavors, and overall more generic journal design, to name a few (see also Rijcke et al., 2016) for a review of literature examining the potential effects of increased indicator use on science). Most of these undesirable scenarios follow the premise of metrics gaining a disproportionate amount of influence in hiring- and funding decisions in academia. While assuring that such decisions are not inappropriately based on impact metrics ultimately is a matter that governments and administrations have to administer to (Wilsdon et al., 2017), we believe that achieving a widespread awareness among researchers about what metrics can and what they cannot do is a major step toward preventing those scenarios from happening.
Limitations of the Study
A limitation of this study lies in the sample of researchers which participated in the qualitative interviews. First, the majority of our interviewees were fairly young researchers, which might be an explanation for their altogether restricted knowledge about indicators used for measuring research impact. Some use cases for such indicators these young researchers just might not have encountered yet, e.g., hiring decisions, promotion-, or grant applications. This hypothesis of younger researchers having less experience with metrics usage is also backed up by Hammarfelt and Haddow (2018), who found researchers with < 5 years of academic experience to be the group with the lowest usage of impact metrics in their sample.
Also, all our interviewees were from German institutions, so the interview results might be shaped by region-specific effects we are not aware of. Furthermore, our reliance on convenience samples for both the interviews and the surveys leads to potential self-selection biases; this could lead to overrepresentations of participants with a comparatively strong opinion on the subjects of social media and/or metrics. And finally, all interviews were conducted in English although our interviewers and participants were non-native speakers, which might have reduced our abilities to express and recognize linguistic nuances.
A more specific limitation results of the way we asked our survey question about concerns related to individual social media platforms. As explained in section Online Surveys: Design—RQ1, we only asked researchers to state their concerns regarding platforms if they had selected those platforms as “used at least once” in a previous question. There might of course be cases of researchers that know a platform well enough to have precise reservations against it despite never having used it before—these are cases that would not be covered by our survey.
Furthermore, there are potential barriers inhibiting an uptake of web-based metrics specific to the Social Sciences that are not explained by the researcher perspective which we examined in this article. Many metrics' reliance on specific persistent identifiers (like DOIs) for instance peculiarly penalizes publication patterns prevalent in Social Sciences, where monographs often play a more important role than in hard sciences (Glänzel, 1996; Nederhof, 2006). Another disadvantage for certain Social Sciences in web-based as well as bibliometric impact measurements results from their often comparatively high dependencies on local contexts. While such aspects' implications have been examined for bibliographic citation analysis [see for instance (Hicks, 2005)], regarding web-based metrics further work is necessary.
Conclusions and Future Work
In this study we examined researchers' concerns inhibiting the use of various metrics for research evaluation in the Social Sciences by analyzing the results of face-to-face interviews and two associated online surveys. More specifically, we identified problems that prevent Social Science publications from gaining visibility online and thus impede web-based metrics' usefulness for the discipline. Alongside these findings we provide recommendations for how to tackle these problems. Our findings and recommendations have implications for various stakeholders, among them platform providers and –developers, community managers, research instructors, libraries, policy makers, research administrations, and of course the researchers themselves.
This study will be followed by experiments in which we will examine how researchers from the Social Sciences make decisions based on various indicators for research impact. The experimental data in combination with this article's findings will provide us with a foundation to more clearly describe the state of how social scientists use and interpret the multitude of impact metrics and should thus help to point out misconceptions that might be prevalent in the discipline.
To obtain a more comprehensive picture of social scientists' notions on professional social media usage and metrics, further work should go into analyzing the relationships between various researcher demographics and specific concerns. Also, the conduction of similar studies like this one for other disciplines could highlight discipline-specific peculiarities that did not become apparent as such in this study. Another interesting subject for future research was exposed by our interviewees P6's and P7's hypothesis that certain types of metrics might give an advantage to certain types of publications. While work has been done to identify document properties that lead to increasing altmetric resonance (see e.g., Haustein et al., 2015; Zagovora et al., 2018), the properties examined usually refer to document type, -structure, or -meta data, and not to the publications' contents.
Ethics Statement
An ethics approval was not required as per applicable institutional and national guidelines and regulations.
Data Availability Statement
The raw survey data supporting the conclusions of this manuscript will be made available by the authors, without undue reservation, to any qualified researcher. The full interview transcripts will not be made available, as agreed upon with the interviewees to protect their personal data.
Author Contributions
AM, IP, MM, and SL contributed conception and design of the study; MM and SL conducted the interviews, implemented and supervised the online survey and provided the figures used in the manuscript; IP acquired funding for the research project; SL performed the statistical analysis, coded the survey free text answers according to their themes and wrote the first draft of the manuscript. All authors contributed to manuscript revision, read and approved the submitted version.
Funding
This work is part of the DFG-funded research project *metrics (project number: 314727790). Further information on the project can be found on https://metrics-project.net.
Conflict of Interest Statement
The authors declare that the research was conducted in the absence of any commercial or financial relationships that could be construed as a potential conflict of interest.
Acknowledgments
We thank Felix Heute for transcribing the qualitative interviews as well as for his assistance during the phases of interview conduction and coding. Also, we wish to express our gratitude to all the researchers who helped us by participating in our interviews or surveys.
Supplementary Material
The Supplementary Material for this article can be found online at: https://www.frontiersin.org/articles/10.3389/frma.2018.00039/full#supplementary-material
Footnotes
1. ^https://metrics-project.net/
2. ^https://www.limesurvey.org/
3. ^This included information about the purpose of the survey and the project behind it, about why the respective participant had been asked to participate, about which data will be stored for which purposes and in which locations, that stored answers will be anonymized, that their participation is entirely voluntary and that they can withdraw from the survey at any time, as well as our contact information in case of questions.
4. ^https://www.jiscmail.ac.uk/
5. ^http://www.metrics-toolkit.org/
6. ^http://training.parthenos-project.eu/sample-page/intro-to-ri/research-impact/
7. ^https://s3-eu-west-1.amazonaws.com/mailclark/attachments/1/2/3/5/7/1/12357153_LdT8UV7FTjyWGrDPZHi1lQ/tablaper3.pdf
References
Archambault, É., Vignola-Gagn,é, É., Côt,é, G., Larivière, V., and Gingrasb, Y. (2006). Benchmarking scientific output in the social sciences and humanities: the limits of existing databases. Scientometrics 68, 329–342. doi: 10.1007/s11192-006-0115-z
Bellis, N. D., Wouters, P., Day, R. E., Furner, J., Gingras, Y., McCain, K. W., et al. (2014). “Altmetrics,” in Beyond Bibliometrics: Harnessing Multidimensional Indicators of Scholarly Impact, 1 Edn, eds B. Cronin and C. R. Sugimoto (Cambridge, MA: The MIT Press), 263–288.
Bornmann, L., and Daniel, H.-D. (2008). What do citation counts measure? A review of studies on citing behavior. J. Doc. 64, 45–80. doi: 10.1108/00220410810844150
Burnard, P. (1991). A method of analysing interview transcripts in qualitative research. Nurse Educ. Today 11, 461–466. doi: 10.1016/0260-6917(91)90009-Y
Cagan, R. (2013). The San Francisco declaration on research assessment. Dis. Model. Mech. 6, 869–870. doi: 10.1242/dmm.012955
Collins, K., Shiffman, D., and Rock, J. (2016). How are scientists using social media in the workplace? PLoS ONE 11:e0162680. doi: 10.1371/journal.pone.0162680
Desrochers, N., Paul-Hus, A., Haustein, S., Costas, R., Mongeon, P., Quan-Haase, A., et al. (2018). Authorship, citations, acknowledgments and visibility in social media: symbolic capital in the multifaceted reward system of science. Soc. Sci. Inf. 57,223–248. doi: 10.1177/0539018417752089
Glänzel, W. (1996). A bibliometric approach to social sciences. National research performances in 6 selected social science areas, 1990-1992. Scientometrics 35, 291–307. doi: 10.1007/BF02016902
Gross, P. L., and Gross, E. M. (1927). College libraries and chemical education. Science 66, 385–389. doi: 10.1126/science.66.1713.385
Hammarfelt, B., and Haddow, G. (2018). Conflicting measures and values: how humanities scholars in Australia and Sweden use and react to bibliometric indicators. J. Assoc. Inf. Sci. Technol. 69, 924–935. doi: 10.1002/asi.24043
Haustein, S. (2016). Grand challenges in altmetrics: heterogeneity, data quality and dependencies. Scientometrics 108, 413–423. doi: 10.1007/s11192-016-1910-9
Haustein, S., Costas, R., and Larivière, V. (2015). Characterizing social media metrics of scholarly papers: the effect of document properties and collaboration patterns. PLoS ONE 10:e0120495. doi: 10.1371/journal.pone.0120495
Hicks, D. (2005). “The four literatures of social science,” in Handbook of Quantitative Science and Technology Research, eds H. F. Moed, W. Glänzel, and U. Schmoch (Dordrecht: Kluwer Academic Publishers), 473–496.
Hicks, D., Wouters, P., Waltman, L., de Rijcke, S., and Rafols, I. (2015). Bibliometrics: the leiden Manifesto for research metrics. Nat. News 520,429. doi: 10.1038/520429a
Hirsch, J. E. (2005). An index to quantify an individual's scientific research output. Proc. Natl. Acad. Sci. U.S.A. 102, 16569–16572. doi: 10.1073/pnas.0507655102
Jobmann, A., Hoffmann, C. P., Künne, S., Peters, I., Schmitz, J., and Wollnik-Korn, G. (2014). Altmetrics for large, multidisciplinary research groups : comparison of current tools. Bibliometr. Prax. Forsch. 3, 1–19. doi: 10.5283/bpf.205
Kaplan, A. M., and Haenlein, M. (2010). Users of the world, unite! The challenges and opportunities of Social Media. Bus. Horiz. 53, 59–68. doi: 10.1016/j.bushor.2009.09.003
Kramer, B., and Bosman, J. (2015). 400+ Tools and Innovations In Scholarly Communication. Google Docs. Available online at: https://docs.google.com/spreadsheets/d/1KUMSeq_Pzp4KveZ7pb5rddcssk1XBTiLHniD0d3nDqo/edit?usp=embed_facebook (Accessed February 16, 2017).
Lemke, S., Mehrazar, M., Mazarakis, A., and Peters, I. (2018). “Are there different types of online research impact?,” in Proceedings of the 81st ASIS&T Annual Meeting: Building an Ethical & Sustainable Information Future with Emerging Technology (Silver Springs, MD,: American Society for Information Science), 282–289. Available online at: https://www.asist.org/wp-content/uploads/2018/11/Final-81st-Annual-Meeting-Proceedings.pdf.
Mehrazar, M., Kling, C. C., Lemke, S., Mazarakis, A., and Peters, I. (2018). “Can we count on social media metrics?: first insights into the active scholarly use of social media,” in Proceedings of the 10th ACM Conference on Web Science WebSci '18. (New York, NY: ACM), 215–219.
Nederhof, A. J. (2006). Bibliometric monitoring of research performance in the social sciences and the humanities: a review. Scientometrics 66, 81–100. doi: 10.1007/s11192-006-0007-2
Nicholas, D., and Rowlands, I. (2011). Social media use in the research workflow. Inf. Serv. Use 31, 61–83. doi: 10.3233/ISU-2011-0623
NISO (2016). NISO RP-25-2016 Outputs of the NISO and Alternative Assessment Metrics Project. Baltimore, MD: National Information Standards Organization (NISO) Available online at: https://www.niso.org/publications/rp-25-2016-altmetrics (Accessed October 12, 2018).
Peters, I., Jobmann, A., Eppelin, A., Hoffmann, C. P., Künne, S., and Wollnik-Korn, G. (2014). Altmetrics for large, multidisciplinary research groups: a case study of the leibniz association,” in Assessing Libraries and Library Users and Use. Part II: Altmetrics - New Methods in Assessing Scholarly Communication And Libraries: Issues Applications, Results (Zadar: University of Zadar, Department of Information Sciences). Available online at: http://www.leibnizopen.de/suche/handle/document/115088 (Accessed October 14, 2018).
Priem, J., Taraborelli, D., Groth, P., and Neylon, C. (2010). Altmetrics: A Manifesto. Available online at: http://altmetrics.org/manifesto/ (Accessed January 23, 2017).
Rijcke, S., de Wouters, P. F., Rushforth, A. D., Franssen, T. P., and Hammarfelt, B. (2016). Evaluation practices and effects of indicator use—a literature review. Res. Eval. 25, 161–169. doi: 10.1093/reseval/rvv038
Rousseau, S., and Rousseau, R. (2017). Being metric-wise: heterogeneity in bibliometric knowledge. El Prof. Inf. 26, 480–487. doi: 10.3145/epi.2017.may.14
Sivertsen, G. (2016). “Publication-based funding: the norwegian model,” in Research Assessment in the Humanities: Towards Criteria and Procedures, eds M. Ochsner, S. E. Hug, and H.-D. Daniel (Cham: Springer International Publishing), 79–90.
Sivertsen, G., and Larsen, B. (2012). Comprehensive bibliographic coverage of the social sciences and humanities in a citation index: an empirical analysis of the potential. Scientometrics 91, 567–575. doi: 10.1007/s11192-011-0615-3
Thelwall, M., Haustein, S., Larivière, V., and Sugimoto, C. R. (2013). Do altmetrics work? Twitter and ten other social web services. PLoS ONE 8:e64841. doi: 10.1371/journal.pone.0064841
Van Noorden, R. (2014). Online collaboration: scientists and the social network. Nature 512, 126–129. doi: 10.1038/512126a
White, H. D., Boell, S. K., Yu, H., Davis, M., Wilson, C. S., and Cole, F. T. H. (2009). Libcitations: a measure for comparative assessment of book publications in the humanities and social sciences. J. Am. Soc. Inf. Sci. Technol. 60, 1083–1096. doi: 10.1002/asi.21045
Wilsdon, J., Bar-Ilan, J., Frodeman, R., Lex, E., Peters, I., and Wouters, P. (2017). Next-Generation Metrics: Responsible Metrics and Evaluation for Open Science. Luxembourg City: Publications Office.
Wouters, P., and Costas, R. (2012). Users, Narcissism and the Control: Tracking the Impact of Scholarly Publications In the 21st Century. Utrecht: Stichting Surf Available online at: http://research-acumen.eu/wp-content/uploads/Users-narcissism-and-control.pdf
Keywords: research assessment, altmetrics, bibliometrics, social media usage, concerns, interviews, online survey
Citation: Lemke S, Mehrazar M, Mazarakis A and Peters I (2019) “When You Use Social Media You Are Not Working”: Barriers for the Use of Metrics in Social Sciences. Front. Res. Metr. Anal. 3:39. doi: 10.3389/frma.2018.00039
Received: 15 October 2018; Accepted: 12 December 2018;
Published: 08 January 2019.
Edited by:
Andreas Ferus, Academy of Fine Arts Vienna, AustriaCopyright © 2019 Lemke, Mehrazar, Mazarakis and Peters. This is an open-access article distributed under the terms of the Creative Commons Attribution License (CC BY). The use, distribution or reproduction in other forums is permitted, provided the original author(s) and the copyright owner(s) are credited and that the original publication in this journal is cited, in accordance with accepted academic practice. No use, distribution or reproduction is permitted which does not comply with these terms.
*Correspondence: Steffen Lemke, cy5sZW1rZUB6YncuZXU=