 Elizabeth Chen
 Wilson Luu1,2
 Juno Kim
- 1School of Optometry and Vision Science, University of New South Wales, Kensington, NSW, Australia
- 2Centre for Eye Health, University of New South Wales, Kensington, NSW, Australia
The most common approach to assessing the optic nerve head (ONH) in the detection and management of glaucoma relies on frontal stereoscopic images acquired by a fundus camera. Subjective clinical assessment of ONH parameters from these images (e.g., cup/disc ratio and cup depth) is limited by the absence of monocular perspective cues normally available in oblique viewing. This study examined whether viewing a rotatable 3D reconstruction of the ONH could improve the accuracy of subjective assessments by increasing linear perspective information. Images were reconstructed from optical coherence tomography (OCT) of the ONH. Trained optometry students assessed the cup/disc (C/D) ratio of ONHs with either a flat stereoscopic display or virtual reality (VR) head-mounted display (HMD) with or without dynamic slant control. Dynamic stereoscopic assessment of optic nerve head models in VR resulted in larger estimates of C/D ratio and cup depth compared to static stereoscopic assessments. A follow-up experiment using an external display revealed that relative to static monoscopic viewing, adding either dynamic viewing or stereoscopic viewing to the same display improved subjective estimates of C/D ratio relative to Cirrus HD-OCT defined objective values of C/D ratio. The findings suggest that simply changing the viewing orientation of ONH models improves clinical evaluation of C/D ratio by generating perspective cues to depth without the need for stereo viewing.
Introduction
Glaucoma refers to a group of ocular diseases characterized by progressive and irreversible damage to the optic nerve and associated visual field loss (Foster et al., 2002). For reliable diagnosis and monitoring of disease progression, clinicians are required to accurately detect subtle changes in optic nerve structure. These structural changes may be documented through imaging techniques such as optic nerve stereophotography and optical coherence tomography (OCT), which provide a wide range of information to support subjective judgments and objective measurements for the diagnostic assessment of optic nerve structure and shape. Optimizing viewing conditions in an immersive virtual reality (VR) environment may improve the clinician's perceptual performance and thus increase the accuracy and reliability of optic nerve head (ONH) evaluations. These improvements in evaluations may also allow clinicians to achieve subjective estimates which better align with objective measurements of ONH anatomical parameters, such as those obtained through OCT imaging. This would improve the translatability of measurements to facilitate more comprehensive multimodal glaucoma assessments. Here, we were concerned with whether different 3D visualization devices having different levels of interactivity and immersion offer benefits over 2D visual assessment of retinal structure relevant to glaucoma.
The recent emergence of innovations that combine OCT and fundus camera systems (Meditec, 2019; Nidek, 2019) and high-performance consumer grade head-mounted displays (HMDs) for VR may provide new utility for optimizing viewing conditions with existing technology for improved diagnostic outcomes. As such, the use of immersive VR technology in the visualization of retinal anatomy is not new. Aaker et al. has reported on the 3D renderings of 2D OCT images in a Computer Assisted Virtual Environment (CAVE) for analysis (Aaker et al., 2011), while Schulze et al. investigated the visualization of 3D reconstructions of OCT images in VR in the context of different ophthalmic clinical workflows (Schulze et al., 2013). More recently, virtual reality has shifted to real-time, where Draelos et al. explored the use of real-time visualization of both static and live OCT volume scans in immersive VR (Draelos et al., 2018). However, these studies only reported on rendered 3D models reconstructed from OCT volume scans alone, without the inclusion of fundus camera photos. This study sought to determine the conditions under which VR technology might improve clinical judgments of ONH models reconstructed from a combination of high-resolution OCT and fundus camera images. The ONH reconstructions were rendered to appear as realistic clinical models comparable to live viewing through microscope oculars.
Although the exact pathogenesis of glaucoma is not yet known, glaucoma ultimately produces specific and characteristic morphological changes in the optic nerve head. Progressive apoptosis of the retinal ganglion cells and their axons gradually leads to neuroretinal rim loss (Quigley, 1999; Agarwal et al., 2009; Weinreb et al., 2014), and the resultant optic neuropathy gradually leads to a characteristic “cupping” appearance (Quigley, 1999). Other glaucomatous structural changes include thinning and posterior bowing of the lamina cribrosa (Quigley et al., 1981, 1983; Yan et al., 1994; Furlanetto et al., 2013). As morphological changes in optic nerve structure often precede clinically detectable visual field loss in glaucoma (Sommer et al., 1991; Sung et al., 2011; Kuang et al., 2015), as in the case with pre-perimetric glaucoma, the ability to detect such changes with greater sensitivity may facilitate earlier diagnoses of glaucoma, and thus decrease the likelihood of visual function loss.
Examples of visual cues relevant to optic nerve assessment include variations in surface reflectance and color, which generate image contrast patterns that assist in localizing the optic cup. As such, the lighter-colored optic disc has higher albedo compared to the darker surrounding retina, creating stronger contrast boundaries (Anderson and Winawer, 2005) to better articulate the optic disc margins. Accurately identifying these optic disc margins is critical for subjective estimations of C/D ratios. Changes in the specular highlights and textural gradients generated by the curvature of the blood vessels leaving the optic cup and disc also provide further cues to shape (Fleming et al., 2004). Textural cues can also enhance the visibility of lamina cribrosa pores, which are more commonly visible in glaucomatous optic nerves compared to non-anomalous nerves due to larger C/D ratios (Yan et al., 1994; Healey and Mitchell, 2004), and thus provide helpful information regarding optic nerve structure and health. Imaging techniques that provide a range of static perceptual cues to infer three-dimensional (3D) shape can therefore assist in the qualitative monitoring of morphological changes, including neuroretinal rim loss over time.
Stereophotography is a current and major valuable reference standard for optic nerve photo-documentation in glaucoma (Gordon and Kass, 1999; Zeyen et al., 2003; Krupin et al., 2005), and offers multiple benefits over monoscopic viewing of the optic nerve. Stereoscopic depth cues provided by the disparity in stereo-images can assist in judgments of 3D shape and thus improve the reproducibility of C/D ratio judgments (Litcher, 1976; Morgan et al., 2005). Moreover, as stereoviewing provides an additional viewpoint compared to monoscopic viewing, extra-structural information can be inferred (Huang and Lee, 1989), which may therefore improve the sensitivity in detecting changes in the neuroretinal rim (Chan et al., 2014). This would allow for greater consistency in subjective measurements between viewers, as reflected by the greater interobserver agreement in stereoscopic C/D ratio evaluations compared to monoscopic evaluations (Litcher, 1976; Morgan et al., 2005).
In comparison to stereophotography, OCTs provide automated, highly reproducible, and objective measurements for quantifying optic nerve parameters such as disc size and area, cup volume, and vertical C/D ratio, by taking volumetric 3D scans of the retina (Mwanza et al., 2010, 2011; Sung et al., 2012; Wong et al., 2015). These measurements are achieved by fully automated algorithms which segment and identify key anatomical landmarks to calculate the different parameters. Such landmarks include Bruch's membrane opening (BMO), which forms the true anatomic outer border of the ONH. Recent research has also indicated that these OCT-derived parameters have excellent specificity in the clinical diagnosis of the early glaucoma (Chauhan et al., 2013), and that OCT-calculated vertical C/D ratios are a key parameter in discriminating between healthy and glaucomatous eyes (Calvo et al., 2014). It has also been demonstrated that the OCT analysis of ONH parameters is qualitatively similar to, and more repeatable than traditional expert clinician evaluations of Sharma et al. (2011).
Advances in OCT technology have also enabled the rapid acquisition of high-resolution 3D datasets that provide a wealth of quantitative measurements, leading to 3D reconstructions of anatomical features performed by in-built software. These 3D reconstructions can also facilitate subjective estimates of optic nerve head parameters because they may be manually slanted to view the retinal topography from different perspectives. In addition to these perspective cues, dynamic cues generated by active rotation of the stimulus may facilitate subjective estimates of optic nerve head shape. These include motion parallax (Gibson et al., 1959), kinetic depth (Sperling and Landy, 1989), and structure from motion (Ullman, 1979), which enable the recovery of additional 3D depth and structural information. For example, motion parallax can assist the visual system in deriving further information regarding surface reflectance (Marlow and Anderson, 2016), which may assist clinicians in identifying blood vessel contours to assess optic cup shape. These motion parallax cues appear to overcome the potential problem of classifying image structure for inferring shading important for 3D shape perception (Kim and Anstis, 2016). Hence, a major disadvantage of the clinical reconstructions is that pertinent details of the 3D retinal structures can be lost when viewing static presentations monoscopically on 2D desktop screens, which lack stereoscopic depth cues and dynamic motion cues that are readily provided by modern VR HMDs.
Given that static stereoscopic and dynamic perceptual shape cues have the potential to improve the visualization of optic nerve anatomy, a combination of both cue types in VR simulations is likely to overcome the limitations of current conventional viewing methods. VR allows for the examination and manipulation of the stimulus in different 3D perspectives using an immersive interface that also tracks the head movements of the user to increase their perceived depth through motion parallax. This combination of active control and depth perception provides a highly immersive experience for the viewer in dynamic virtual environments (Palmisano et al., 2016, 2019; Kim et al., 2018). Previous research which examined the different effects of immersion in VR (Laha et al., 2012) has reported that stereoscopic viewing of 3D medical images improved accuracy in spatially complex searches of crowded features, such as distinguishing blood vessels from surrounding musculature.
There is evidence from other disciplines to suggest that stereoscopic HMD VR should facilitate the visualization of structure for improving information appraisal in applied visualization. For example, VR is known to improve the perceptual recall of 3D shape information, as was found in one education study on the use of VR for teaching anatomy of the inner ear (Jang et al., 2017). The researchers found that participants who actively manipulated a rotatable 3D model of the inner ear could subsequently reproduce the structures observed through drawings. This benefit of active control over visualization was found to be superior to passive viewing of a pre-recorded playback of the visualization in naïve participants. However, they only used stereoscopic displays that did not allow for dynamic exploratory head movements. Earlier work in non-medical visualization has shown that knowledge retention of 3D information might be improved with HMD VR immersion (Polcar and Horejsi, 2015). Polcar and Horejsi (2015) compared knowledge acquisition in a 3D visualization task using an Oculus Rift DK2, a PC workstation, and a stereo projection display. They found that knowledge acquisition was best using the PC workstation and lowest when using the Oculus Rift DK2 HMD. They also found that the Oculus Rift and stereo projections both generated cybersickness—the adverse experience of nausea and other symptoms similar to simulator sickness (See Kennedy et al., 1993). Interestingly, participants who reported cybersickness were also found to have lower knowledge retention following the 3D visualization.
It is possible that the type of HMD VR system could influence knowledge acquisition in application for data visualization. The Oculus Rift DK2 is known to have a relatively high display lag of at least 28 ms [see (Kijima and Miyajima, 2016)]. Older systems like Oculus Rift DK1 have higher display lag and generate rather compelling cybersickness (Arcioni et al., 2019). Recent reports have demonstrated that more recent HMDs like the Oculus Rift CV1 and S have lower display lag due to Asynchronous Time Warp (ATW) inherent in these displays (Feng et al., 2019). Feng et al. (2019) found that artificially increasing the display lag of the Oculus Rift CV1 above its baseline latency of ~5 ms significantly increased reported cybersickness. It is possible that the benefits of HMD VR can be realized when using the Oculus Rift CV1 or later. We therefore consider whether the Oculus Rift CV1 can provide the stereoscopic diagnostic advantage in the assessment of vertical C/D ratio in both glaucomatous and non-anomalous optic nerves.
We predicted that performance in perceptual judgments of 3D optic nerve shape and structure would improve in HMD VR when observers rely on both static stereoscopic or dynamic perceptual cues to examine the optic nerve. The study was designed to determine whether dynamic viewing conditions improve the subjective assessment of optic nerve parameters compared with static viewing conditions with and without stereopsis. For example, under the optimized viewing conditions in VR, we would expect that observers would report vertical C/D ratios which are more veridical to benchmark C/D ratio values calculated by the Cirrus HD-OCT. We assessed the accuracy of these viewing conditions for making C/D ratio judgments relative to an objective measure provided by an automated benchmark calculated by the Cirrus HD-OCT. We investigate how a combination of both static and dynamic cues to shape and depth may influence the perception of the anatomy of the optic nerve and improve agreement between subjective judgments and objective measurements of optic nerve head parameters by enhancing the optic nerve images with VR by student optometrists. We recruited student optometrists in their final year of accredited study as their judgments of optic nerve parameters tend to exhibit greater variability in comparison to experienced optometrists.
Methods
Participants
Twenty-five participants were recruited from the 2018 final-year Master of Clinical Optometry cohort from the UNSW School of Optometry and Vision Science to assess the vertical C/D ratio and cup depth of 10 optic nerve head models using three different viewing methods. Participants had a habitual near visual acuity of at least N4 (20/20) or better, both monocularly and binocularly, with a minimum stereoacuity of 40 s of arc. Participants not meeting these criteria were excluded. The interpupillary distance of the participants ranged from 56.0 to 66.5 mm. The study was approved by the UNSW Human Research Ethics Advisory Biomedical Panel (HREA-B), in accordance with the NHMRC National Statement on Ethical Conduct in Human Research 2007. All participants were provided with written informed consent prior to participating.
Image Acquisition
Six eyes without ocular anomalies and four eyes diagnosed with glaucoma were selected to create an image bank for psychophysical testing. Five of the six eyes without ocular anomalies were recruited from individuals aged 22 to 23 years old. The four glaucomatous eyes were classified to be stage 0, pre-perimetric glaucoma (Mills et al., 2006), and were recruited from individuals ranging in age from 56 to 70 years, with a mean age of 61.7 years, at the Center of Eye Health (UNSW, Guide Dogs NSW/ACT) in Sydney, Australia. One suspect glaucomatous eye without ocular anomalies, from an individual aged 51 years old, was also recruited at this location. These eyes had been previously diagnosed as glaucomatous or glaucomatous-suspect by an ophthalmologist. Patient eyes were excluded if they were classified to have moderate or advanced glaucoma, high degrees of myopia (≥6.00 D), slanted or obliquely inserted optic discs, or unusual optic disc features such as extensive peripapillary atrophy or optic nerve head drusen.
Scanning Protocol
Two sets of images were required to generate 3D models of the optic nerve head: retinal photos and OCT volume scans. The optic nerve heads were photographed with a Kowa 2D/3D Non-Mydriatic WX Retinal Camera (Kowa, Tokyo, Japan) and scanned by the Spectralis HRA+Optical Coherence Tomographer (Heidelberg Engineering, Heidelberg, Germany) and the Cirrus HD-Optical Coherence Tomographer (Carl Zeiss Meditec, Dublin, CA, USA). The stereoscopic photographs were obtained with the 3D stereo function on the Kowa retinal camera with a field angle of 34 degrees, resulting in a stereo-pair image. This retinal camera uses a beam splitter that can reduce illumination, and therefore often requires pharmacological dilation prior to imaging. Thus, when it was not possible to obtain appropriate image quality without dilation, pharmacological dilation was performed. The data required for the construction of the 3D optic nerve head models was scanned with the Spectralis HRA+OCT to obtain volume scans of size 20 × 20 degrees with an automatic real-time tracking (ART) of 50, producing a total of 49 cross-sectional scans for each optic nerve head (see Figure 1).
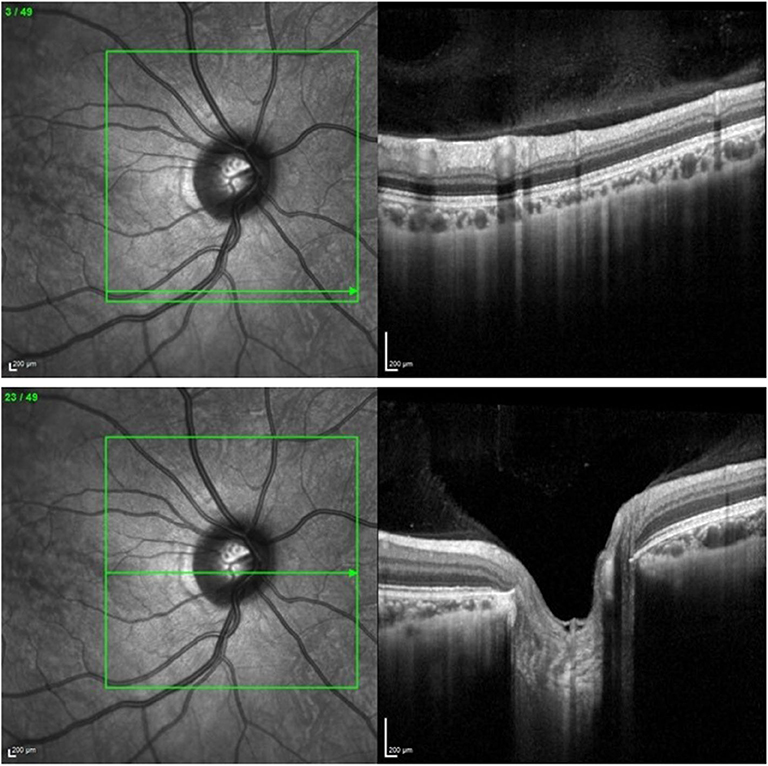
Figure 1. (Upper) Volume scan of the retina as exported from the Heidelberg Spectralis HRA+OCT Optical Coherence Tomographer. (Lower) Volume scan of the optic nerve head as exported from the Heidelberg Spectralis HRA+OCT Optical Coherence Tomographer.
The vertical C/D ratio measurements obtained from the Cirrus HD-OCT with the Optic Disc Cube 200 × 200 scanning protocol were used as an objective point of reference for comparison against the subjective estimations of vertical C/D ratio. The Cirrus HD-OCT was selected to provide this benchmark for its high diagnostic accuracy of ~81.3% (Monsalve et al., 2017) and specificity in differentiating glaucomatous and non-glaucomatous eyes with the vertical C/D ratio measurement (Koh et al., 2018).
3D Model Construction
Each individual OCT line scan was manually segmented at the level of the inner limiting membrane and Bruch's membrane to correct for possible instrument errors during the automated segmentation process. These images were then exported and cropped with the IrfanView (ver 4.40) to remove the IR reference images and obtain 49-line scans (512 × 496 pixels) for each eye.
Cropped images were then imported into OCToPi, a custom image processing software program (www.juno3d.com/software/octopi.html). The OCToPi software was used to manually segment the surface profile of the retina and optic nerve head and extract a smoothed profile of the retinal surface for each volume scan in order to construct a height map profile of the optic nerve. The component volume line scans were then each encoded as an array of 49 pixels with 8-bit luminance range (0–255). A separate luminance array was generated for each of the volume line scans. The 49 luminance arrays were then collated as separate adjacent rows of a single 2D image that served as a 3D height map. The resultant height map created from the OCToPi software was then exported in 8-bit BMP format for subsequent 3D reconstruction.
The height map was then imported into a Blender 3D (ver. 2.79) environment to generate a vertex displacement map (see Figure 2, upper). This created a mesh topology of 2,593 vertices, which closely resembled the surface of the scanned retina and optic nerve head. The model was then exported as a wavefront OBJ model.
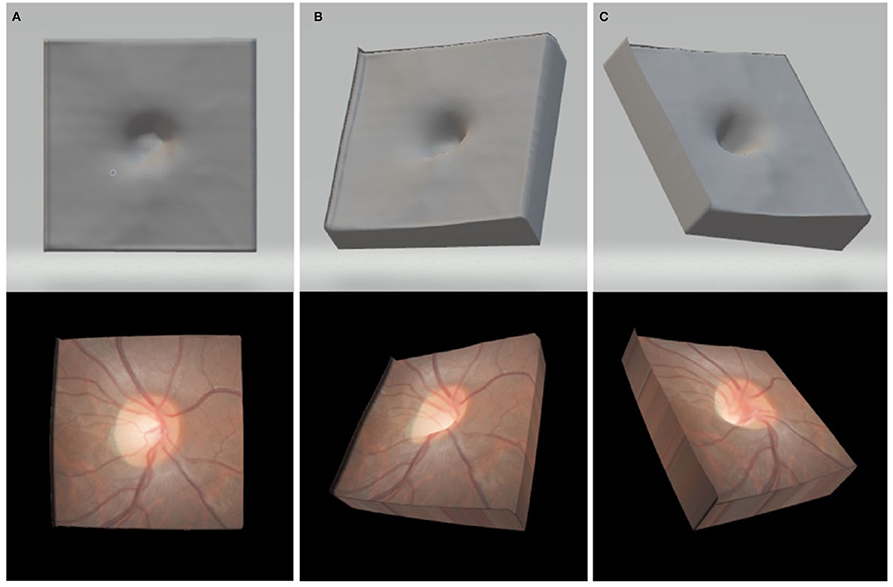
Figure 2. Upper: exported OBJ format 3D model in the en-face viewing position (A) a leftward oblique viewing orientation (B) and an upper-right oblique viewing orientation (C) Lower: images in each panel show the final renderings of the same 3D models with the fundus photos textured onto the surfaces shown directly above.
To create the color overlay for texturing the 3D optic nerve models, the corresponding stereophotographs were exported from the KOWA database and the clearer of the two images in the pair was selected. Adobe Photoshop CS3 was used to align and crop the stereophotograph to the infra-red reference image taken from the Spectralis HRA+OCT, manually adjusting for size and rotation. The resultant fundus color image was resized to 328 × 328 pixels and exported in 24-bit RGB color BMP format (see Figure 2, lower).
The aforementioned procedures were repeated for each of the 10 optic nerve head models to obtain a wavefront OBJ model and color overlay textures in BMP format for each optic nerve. The model and texture files were then openable in our custom VR viewing software.
Psychophysical Testing
Habitual near visual acuity was measured using a Rodenstock Reading Test Card in N notation. Near interpupillary distance was measured using a pupillary distance ruler, and stereopsis was measured using a Randot Stereoacuity Test (Bernell Corporation, Mishakawa, USA).
Prior to commencing, participants were informed that they would be assessing the C/D ratio and cup depth of 10 ONH models under different viewing conditions. The order of display for the three viewing conditions (stereoscopic, VR without dynamic rotational control, and VR with dynamic rotational control) was counterbalanced across participants. For each viewing condition, the models were presented in a completely random order. The participants were shown all 10 ONH models for the same viewing modality before moving on to the next viewing modality. Participants viewed all ONH models under three different viewing conditions, totalling 30 presentations. Measurements and data collection were unmasked and conducted by two experimenters. To prevent participant bias, the participants were not informed of the numbers of glaucomatous and non-glaucomatous ONHs in the experimental set, and the experimenters only spoke to the participants during the process of assessment to provide instruction.
Participants could refer to the model as often as required to encourage optimal confidence in their perceptual judgments before confirming their answers. The number of different ONH images provided experimental diversity while allowing each participant to perform all psychophysical tasks within a 30-min period, minimizing participant fatigue. Participants remained seated at the testing station throughout the duration of the experiment.
For the stereoscopic viewing method, participants were given a hand-held stereo-viewer. The image was displayed on a HP LP1965 LCD screen with a screen resolution of 1,280 × 1,024 (CNET, 2018) and approximate pixel density of 36.5 pixels per degree (PPD) at a 50 cm viewing distance. This was connected to a Windows computer running with a NVIDIA GeForce GTX 1050ti graphics card. Participants were then asked to grade the vertical C/D ratio and cup depth at the bottom of the screen. The participants then input their answers for C/D ratio, using the up- and down- arrow keys on a keyboard in increments of 0.05 between 0.00 and 1.00. Judgments of cup depth were input using the left- and right- arrow keys, with the three options of “shallow,” “medium,” and “deep.” Participants then pressed the spacebar key to advance to the next ONH image. This process was repeated until the participant had evaluated all 10 ONH models. Participants were instructed to keep their fingers over the keyboard and rest their wrists on an ergonomic computer desk for entering responses following each trial. All participants were post-graduate students who regularly write reports on computer and have sound understanding of the haptic layout of a standard keyboard.
The Oculus Rift CV1 head mounted display (HMD) was selected for use in the study due to the improvement in screen resolution, which was increased to 1,080 × 1,200 per eye (Martindale, 2018), from 640 × 800 in a previous DK1 model (Oculus Rift Specs, 2016). The CV1 HMD thus had an approximate calculated pixel density of 12 PPD, an improvement from the previous DK1 calculated pixel density of 7 PPD (Boger, 2017). Although the DK1 is sufficient for generating accurate experience of motion in visual environments, it has considerably long latency (Kim et al., 2015; Palmisano et al., 2017). In contradistinction however, the CV1 offers far shorter latencies (~5 ms) to support the simulation of real-world applications with temporal realism (Feng et al., 2019). Participants in this study were therefore able to enjoy a real-time viewer centric perspective of the ONH as the viewpoint in the scene updated with 6DOF tracking of the HMD. This procedure generated the experience of a highly immersive virtual environment and was the rationale for using the Oculus Rift CV1 in our application.
The VR viewing environment involved both dynamic and static conditions. In the dynamic VR condition, participants were instructed to slant the models around the horizontal x-axis and vertical y-axis using the up- and down- and left- and right- arrow keys on the keyboard to examine the anatomy of the ONH. The rotational range was limited to 45 degrees along the horizontal and vertical meridians. Participants were then requested to leave the ONH model in the orientation they perceived to be the most informative for evaluating C/D parameters. For the static VR condition, the model was only viewed in an en-face orientation similar to conventional stereoscopic viewing, without control of the model surface orientation.
In both VR viewing conditions, the participants were asked to evaluate the vertical C/D ratio and cup depth. When ready, participants were asked to input their C/D ratio and cup depth estimates following the procedure described above for stereo viewing. Participants were informed they could toggle back to the ONH model anytime by pressing the spacebar prior to submitting their answers with the enter key. The program automatically recorded the final preferred surface orientation of the ONH model when the observer progressed to the next presentation. This process was repeated for all 10 ONH models.
Follow-Up Investigation
A follow-up study was conducted to determine the impact of dynamic viewing and higher viewing resolution on estimating C/D ratio, with image resolution and viewing condition as the independent variables.
Participants viewed reconstructed 3D models of optic nerves with two different viewing conditions: a monoscopic image on a flat LED monitor or stereoscopic images presented on the same flat LED monitor. The images were displayed on the HP 27x, which has a higher screen resolution of 1,920 × 1,080. For each viewing condition, the 3D optic nerve was presented with both a static frontal image, and a dynamic rotatable image.
Sixteen participants were recruited from the 2019 final-year Master of Clinical Optometry cohort from the UNSW School of Optometry and Vision Science to assess the vertical C/D ratio and of twenty-one optic nerve head models. The follow-up image bank consisted of eleven optic nerves without ocular anomalies, and ten optic nerves diagnosed with either pre-perimetric glaucoma or stage one glaucoma (Mills et al., 2006).
All optic nerves were imaged with the scanning protocol of the initial investigation. Twenty-one optic nerve models were then constructed with the same method documented above (3D model construction).
Statistical Analysis
Data analysis was performed with a Type-I error rate of 0.05 and using the statistical package R (ver 3.5.1). For analysis, cup depth levels were assigned ordinal values of: “shallow” = 0, “medium” = 1, “deep” = 2. Repeated-measures two-way ANOVAs were used to compare the average C/D ratio and cup depth across all three viewing conditions. Planned comparisons were performed on C/D ratios estimates between stereoscopic and static viewing, between dynamic VR and static VR, and between dynamic VR and stereo viewing. Bonferroni correction was used to control family-wise error rate for all planned contrasts made between specific viewing conditions. For the C/D ratio data, Cronbach's alpha was computed to evaluate the reliability of subjective estimates made by the participants in the three different viewing conditions.
The subjectively estimated vertical C/D ratio values were also compared against the objective vertical C/D ratio values obtained from the Cirrus HD-OCT, where a value of 1.0 indicates identical objective and subjective estimates. We computed the ratio of each subjective estimate from each participant on each condition relative to the CDR estimated by the Cirrus OCT. Ratios were preferred for comparison over difference scores to account for Weber's law in the expected pattern of data among subjective estimates. To this end, one-sample t-tests were performed to determine whether there was a statistically significant difference between the subjective estimates for each viewing condition and the OCT value. As the Cirrus HD-OCT vertical C/D ratio value was later found to be corrupted and unable to be retrieved for one of the eyes without ocular anomalies, this eye was excluded from these calculations.
Descriptive statistics were also used to analyse the preferred surface viewing orientation settings made by participants when estimating C/D parameters. Pearson product-moment correlations were then performed to assess any correlation between surface orientation and perceived C/D ratio as well as surface orientation and perceived cup depth.
Results
Subjective Estimates of Cup/Disc Ratio
Figure 3 shows a bar graph of mean vertical C/D ratios between glaucomatous and non-anomalous optic nerve heads across the three different viewing conditions. A repeated-measures two-way ANOVA found that there was a significant main effect of viewing condition on C/D ratio estimates, F(2,48) = 14.26, (p < 0.01). There was a significant main effect of ONH type on C/D ratio estimates, which was consistent across the different viewing conditions, F(1,24) = 356.7, (p < 0.01). There was no interaction between viewing condition and ONH type in subjective estimates of C/D ratio, F(2,48) = 0.892 (p = 0.42).
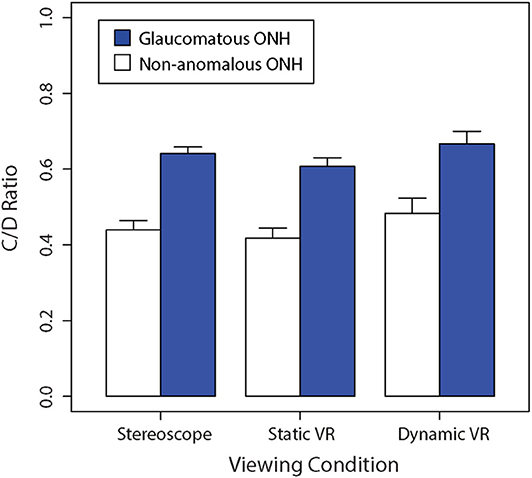
Figure 3. Comparison of the mean non-anomalous vs. glaucomatous subjectively estimated vertical C/D ratios for each viewing condition (stereoscopic vs. static VR vs. dynamic VR). Error bars are standard errors of the mean.
The Bonferroni-corrected planned contrasts found no significant difference in C/D ratio between stereoscopic viewing and static VR (p > 0.05). However, The C/D ratio obtained with dynamic VR was significantly greater than the C/D ratios obtained with stereoscopic viewing (p < 0.05) and static VR (p < 0.05).
Cronbach's alpha was determined to be 0.953 for the stereoscopic viewing condition, 0.897 for the static VR condition and 0.932 for the dynamic VR condition. These findings suggest that reliability was very high amongst estimates of optic nerve heads across participants for the en-face stereoscopic and dynamic VR conditions. However, the reliability was comparatively lower for the optic nerves viewed en-face in static VR.
Both the non-anomalous and glaucomatous average C/D ratios were perceived to be the largest in the dynamic VR viewing condition, where participants had active rotational control over the optic nerve head model, followed by the stereoscopic viewing condition, with the lowest C/D ratios estimates being produced in the static VR viewing condition.
Cup/Disc Ratio vs. OCT
Overall, as seen in Figure 4, judgments of vertical C/D ratios in the dynamic VR viewing condition were most similar to the objective measurements obtained from the Cirrus HD-OCT, followed by stereoscopic viewing condition, and then the static VR condition. All models were perceived to have smaller C/D ratios than the Cirrus-measured parameters.
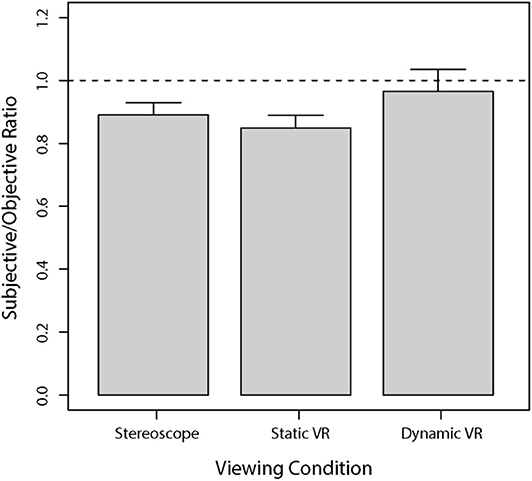
Figure 4. Mean subjectively estimated vertical C/D ratios for each viewing condition compared to the vertical C/D ratios obtained from the Cirrus HD-OCT. The results are presented as a ratio of subjective responses to objective measures, whereby the dashed horizontal line at 1.0 indicates the OCT value relative to the subjective response. Error bars are standard errors of the mean.
A series of one-sample t-tests was performed to assess the difference between subjective estimates relative to the benchmark provided by Cirrus HD-OCT for each of the three viewing conditions. Estimates obtained with stereoscopic viewing were significantly lower than the objective benchmark [t(24) = 4.69, p < 0.0001]. Estimates obtained with static viewing in VR were also significantly lower than the objective benchmark [t(24) = 5.70, p < 0.00001]. However, estimates obtained with dynamic viewing in VR were not significantly different to the objective benchmark [t(24) = 0.50, p = 0.62].
Subjective Evaluation of Optic Nerve Cup Depth
Figure 5 shows a bar graph of average cup depths between glaucomatous and non-anomalous optic nerve heads across the three different viewing conditions. A Shapiro-Wilk test revealed that data on cup depth violated the assumption of normality (W = 0.972, p < 0.005). We therefore used Kruskal-Wallis tests to compare rank-order differences between our two sets of experimental factors. There was a significant rank-order difference between viewing conditions (H = 18.5, p < 0.0001). Consistent with the well-documented pathophysiological process of glaucoma, glaucomatous discs had significantly deeper perceived cups compared to the non-anomalous discs regardless of the viewing condition (H = 51.2, p < 0.0001).
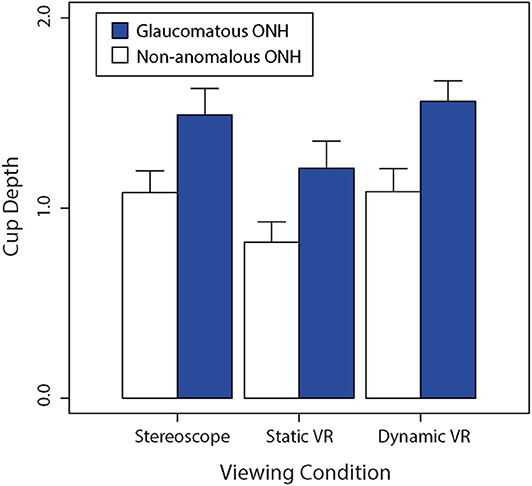
Figure 5. Comparison of the average non-anomalous vs. glaucomatous subjectively estimated cup depths for each viewing condition (stereoscopic vs. static VR vs. dynamic VR). Error bars are standard errors of the mean.
Both non-anomalous and glaucomatous average cup depths were estimated to be greater in the dynamic VR viewing condition where participants had rotational control over the optic nerve head model, followed by the stereoscopic viewing condition, then the static VR viewing condition. This trend was followed between the optic nerve head types, with the glaucomatous optic nerve heads being consistently estimated to be deeper than the non-anomalous optic nerve heads across the three viewing conditions.
Cup/Disc Ratio vs. Cup Depth
Observer estimates of C/D ratio were plotted against their estimates of cup depth in Figure 6 below. A Spearman's correlation was performed on our cup depth data, which revealed a significant positive correlation between the subjective estimates of C/D ratio and cup depth, rho = 0.80 (p < 0.01).
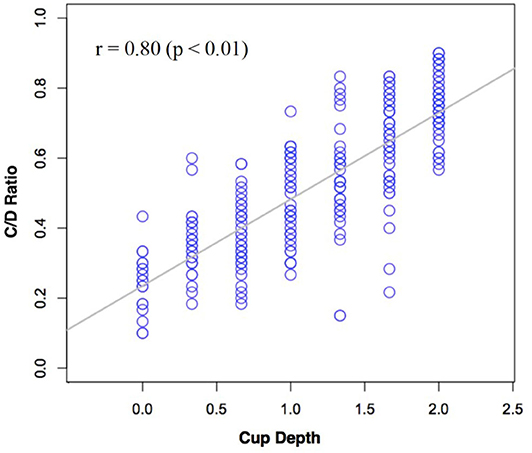
Figure 6. Subjective estimates of C/D ratio plotted against subjective estimates of cup depth across all participants.
Correlation Between Cup/Disc Ratio and Preferred Viewing Orientation
Observer estimates of C/D ratio and cup depth were compared against the average preferred viewing orientation. A Pearson's product-moment correlation performed between C/D ratio and the average preferred orientation (degrees) for viewing ONH in the dynamic VR condition indicated a statistically significant moderate positive correlation, r = +0.43, p < 0.01 (R2 = 0.18). This analysis was also performed between perceived cup depth and the average preferred orientation (degrees), and no significant correlation was found, r = +0.21, p = 0.3181 (R2 = 0.04). On average, all participants indicated that an oblique viewing orientation provided more perceptual information compared to the conventional en-face viewing orientation. However, variability in discrete settings of preferred orientation per se does not appear to account for much of the variability in the ratings of C/D ratio.
Results of the Follow-Up Investigation
Figure 7 shows bar graphs of average subjective estimates of C/D ratio between glaucomatous and non-anomalous optic nerve heads across the three different viewing conditions when viewed as a static image with no control over surface orientation (A) or as dynamic image with slant control over surface orientation (B). A repeated-measures three-way ANOVA found there was a significant main effect of stereoscopic viewing on C/D ratio estimates, F(1, 15) = 9.10, (p < 0.01). Dynamic viewing (i.e., slant control over the 3D model) also showed a significant main effect on estimates of C/D ratio, F(1, 15) = 22.43, (p < 0.0005). Presence of glaucoma also had significant main effect on the C/D ratio estimates, F(1, 15) = 497.7, (p < 0.00001). There was no significant interaction effect between stereo viewing and presence of glaucoma, F(1, 15) = 0.39, (p = 0.54). There was no three-way effect.
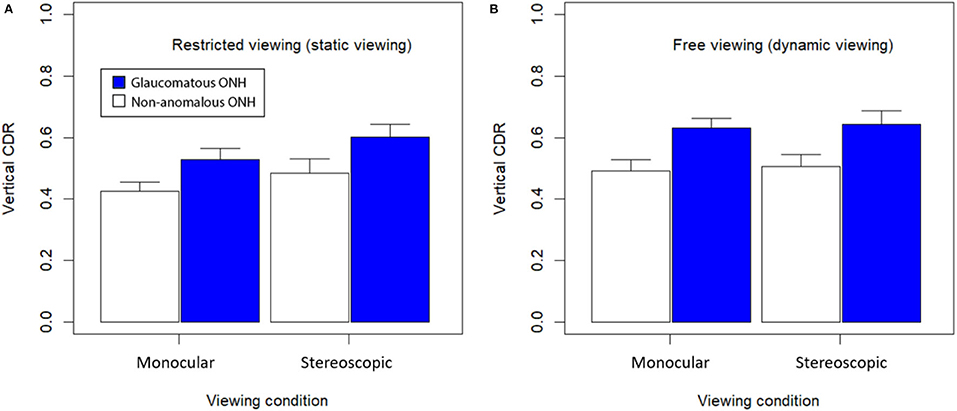
Figure 7. Mean C/D ratio for each viewing condition and glaucomatous condition. (A) Viewed statically with no control and en-face viewing only; and (B) viewed dynamically with control over surface orientation. Error bars are standard errors of the mean.
Overall, average subjective estimates of C/D ratio were all higher in dynamic viewing conditions compared to static viewing conditions. Stereoscopic viewing with disparate retinal images presented by the LED monitor also generated higher estimates of C/D ratio. Images from patients with glaucoma were rated to have higher C/D ratio than non-anomalous images. The largest C/D ratio estimates were produced with the glaucomatous optic nerve models in the dynamic viewing condition, while the smallest C/D ratio estimates were provided in response to non-anomalous optic nerve models in the static viewing condition.
Figure 8 replots the data transformed as a proportion of subjective C/D ratio values relative to objective C/D ratio values provided by the Cirrus HD-OCT. One sample t-tests performed on these data found that monoscopic static viewing generated subjective C/D ratio values that were proportionally lower than Cirrus-OCT estimates of C/D ratio, t(15) = 7.01 (p < 0.0001). However, there was no significant difference in subjective estimates of C/D ratio for static stereoscopic viewing compared with object values obtained using Cirrus-OCT, t(15) = 1.48 (p = 0.16). There was also no significant difference in subjective estimates of C/D ratio for dynamic monoscopic viewing compared with object values obtained using Cirrus-OCT, t(15) = 1.83 (p = 0.09). There was no significant difference in subjective estimates of C/D ratio for dynamic stereoscopic viewing compared with object values obtained using Cirrus-OCT, t(15) = 0.50 (p = 0.62). Together, these data suggest that either dynamic viewing or stereo viewing can improve subjective C/D ratio estimates. However, combining the two modalities provides little additional benefit for subjective performance in estimating C/D ratio.
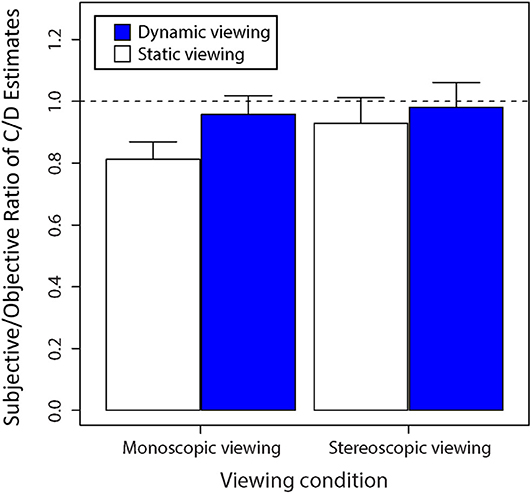
Figure 8. Average ratio of subjective C/D ratio estimates to objective C/D ratio estimates as determined by the Cirrus OCT as shown by the value “1” when viewed statically and dynamically. Error bars are standard errors of the mean.
Discussion
This study found that dynamic assessment of the optic nerve head provides additional perceptual cues that generate larger estimates of optic disc parameters compared to static frontal viewing. Observers reported greater estimates of both C/D ratio and cup depth in dynamic HMD viewing condition compared to the static en-face viewing conditions using and HMD of frontal display. There was a positive correlation between cup disc and cup depth, as well as a correlation between C/D ratio and preferred orientation. The follow-up experiment using a frontal display further confirmed that observer estimates of C/D ratio were greater across all the dynamic viewing and stereo viewing conditions, compared to the static monocular viewing conditions. Estimates of C/D ratio were not only larger for stereo viewing or dynamic viewing, but these estimates were also closer to the automated objective Cirrus HD-OCT values.
Our study indicated that compared with the objective OCT measurements, observer estimates of vertical C/D ratio were significantly lower in en-face stereoscopic and static VR viewing conditions. This difference between subjective and objective estimates of vertical C/D ratio is not uncommon, with multiple studies noting that objective C/D ratio values obtained from OCT scans are comparatively larger than subjective estimates of C/D ratio by skilled observers grading stereoscopic fundus photographs (Arthur et al., 2006; Savini et al., 2009; Sharma et al., 2011). Moreover, it has been noted that inconsistencies in clinical definitions of the optic disc margin due to the oblique orientation of border tissues can often lead to inaccurate clinical estimates of neuroretinal rim tissue and C/D ratio (Reis et al., 2012). The challenges in determining the optic disc margin may therefore result in an underestimation or overestimation of the C/D ratio. While a smaller C/D ratio due to an underestimation may lead to the under-diagnosis of glaucoma, overestimations resulting in a larger C/D ratio due differences in perception may cause unnecessary ophthalmology over-referrals. However, this clinical limitation is overcome by the Cirrus HD-OCT, the OCT imaging technology used in this study, since the anatomical landmark of BMO which is difficult to visually define, is instead used as a consistent reference to delineate the border of the optic disc (Sharma et al., 2011). The added perspective cues for estimating BMO offered by the dynamic VR viewing method may therefore provide a perceptual advantage over the static en-face viewing methods. By improving subjective C/D ratio estimates such that they are closer to the automated objective OCT values, clinicians will have greater consistency across different viewing conditions and assessment methods.
Indeed, observers indicated that an oblique viewing orientation provided more perceptual information for judging optic disc parameters when given the freedom to slant the model. Dynamically manipulating the 3D surface's orientation was preferred to viewing an en-face static presentation of the same surface. As such, viewing the model from multiple perspectives would seem to provide greater confidence in achieving a more accurate experience of 3D surface shape (Foster and Gilson, 2002). This increase in accuracy with slant of the surface in depth was observed consistently when using HMD VR or a flat panel display (in the follow-up investigation). Clinical en-face C/D ratio estimates often rely on assessing the contour changes in blood vessels to distinguish the margins of the optic cup. Viewing the optic nerve obliquely provides additional information concerning blood vessel orientation and foreshortening perspective cues to better delineate the edges of the neuroretinal rim to estimate cup diameter.
It is possible that differences in display resolution may account for the lower estimates of C/D ratio in the static en-face HMD VR condition compared to stereoscopic en-face 3D models on a flat LED panel display. For example, the 3D optic nerve models underwent greater image processing compared to the stereopair images, leading to a decline in image pixel resolution. This degradation in image resolution was then compounded by the lower Oculus Rift HMD pixel density of ~12 PPD, compared to the 36.5 PPD of the desktop screen. Observers also experienced additional distortion or blur when not looking through the optical center of the Fresnel lenses in the Oculus Rift HMD, a common phenomenon experienced when viewing objects off-axis through prismatic lenses (Adams et al., 1971; Flanders and Sarkis, 1999). However, in the follow-up investigation, we found subjective estimates made in the stereoscopic en-face viewing condition of 3D models on a flat LED display improved to levels comparable to the dynamic stereoscopic HMD VR condition. This improvement can be attributed to the differences in the orientation of the light source relative to the object surface. As such, in conventional stereo viewing, the lighting direction is aligned with the viewing direction, whereas in 3D stereo viewing, the lighting direction was oriented downwards relative to the viewing direction. It may be worthwhile considering how lighting and the formation of specular reflections of the light source contributes to the perception of shape, as a recent study showed that the quality of specular highlights affects perception of color boundaries (Honson et al., 2020).
The C/D ratios and cup depths in glaucomatous eyes were found to be significantly larger and deeper respectively, compared to non-anomalous eyes. This finding is consistent with previous studies reporting early glaucoma pathophysiology with axonal injury leading to the erosion of the neuroretinal rim (Burgoyne and Morrison, 2001; Agarwal et al., 2009; Weinreb et al., 2014) and posterior bowing of the lamina cribrosa matrix (Quigley et al., 1981, 1983). Together, these changes result in both an enlarged and deepened optic cup (Jonas et al., 1993; Uchida et al., 1996; Medeiros et al., 2008; Park et al., 2015; Jung et al., 2016). This trend is also reflected by the strong positive correlation noted between estimated C/D ratio and perceived cup depth. This occurs even in non-anomalous eyes, where physiologically larger optic cups generally correspond to deeper cup depths (Jonas et al., 1988, 2003).
It could be argued that the mode of inputting responses varied slightly across tasks (e.g., UP/DOWN or LEFT/RIGHT arrow keys used to input responses of C/D ratio), which could have biased observer reporting of judgments across the different visualization devices used in the current study. However, we believe the mode of user input was unlikely to significantly influence the responses provided by our clinical participants. Student clinicians are thoroughly trained to make C/D ratio judgements visually when looking at images of the optic nerve. These judgments tend to be made visually when looking at images of the optic nerve before participants commence inputting their responses using the keyboard. Although it is unlikely these judgments were biased by the mode of input used to communicate the values decided upon, it would be worthwhile keeping the mode of input consistent in future studies to eliminate any potential bias.
Across all conditions where the 3D ONH models were used, we found that estimates of C/D ratio could be improved by either increasing stereopsis or perspective cues generated by increasing surface slant in depth. There was little gain achieved by combining these sets of cues, which suggests that viewing a rotatable 3D model on a flat display alone is sufficient for achieving accurate perceptual judgments relative to automated objective measures from Cirrus-HD OCT. This is particularly valuable, since it is cost-effective, and not all clinical observers have global stereopsis and are capable of optimizing performance in a combined stereoscopic surface slant scenario. We envisage that the utility of dynamic viewing will improve translational outcomes across multimodal assessments of the optic nerve in glaucoma.
In related research reported previously, Aygar et al. (2018) assessed the relative contributions of stereoscopic cues and kinetic depth information on the perceived layout of 3D point clouds. The point clouds were either rendered statically or rotated dynamically (to generate kinetic depth) and were viewed either stereoscopically or non-stereoscopically. Although either kinetic depth or stereoscopic viewing improved perceptual performance, kinetic depth was found to be more effective than stereoscopic viewing at reducing errors in target detection in 3D point clouds. Earlier studies on similar 3D data visualization tasks have also observed superior benefits of kinetic depth over stereoscopic cues (e.g., Sollenberger and Milgram, 1993; Ware and Mitchell, 2005). It is possible that volumetric surface reconstruction from 3D point cloud data could provide more reliable geometric perceptive cues to infer 3D shape of objects depicted in single rendered images (e.g., Farhood et al., 2020). The results we obtained in our optic nerve reconstruction and visualization study suggest that the perceptual benefit of perspective cues provided by viewing slanted surfaces improves estimates of C/D ratio more than stereopsis alone. We believe it is the perspective provided by the slant of surfaces per se that accounts for the perceptual advantages we observe, rather than the kinetic depth information generated during dynamic tilting of surfaces. However, it would be of benefit in future to determine whether the kinetic depth (i.e., from the change in surface slant) rather than achieved slant per se could also serve to improve performance in estimates of C/D ratio. To this end, it may also be worthwhile considering how motion parallax cues combined with stereopsis might also facilitate or distort perception in these visualization tasks (Allison et al., 2003).
Conclusion
This study demonstrates that viewing a dynamic rotatable model of the optic nerve head on a conventional display provides the additional perceptual cues necessary to improve observer judgements of optic nerve parameters. The results show that it is possible to enhance clinical assessment of the optic nerve in a cost-effective and convenient manner, without the need to use HMD VR. Compared with desktop displays, HMD VR is prone to generating cybersickness—the experience of nausea and other adverse symptoms—that are inherent side effects of HMD VR even at low latencies (Feng et al., 2019; Kim et al., 2020). Although cybersickness can be reduced by monocular viewing (Palmisano et al., 2019), the results of the present study find that monocular viewing would not be ideal for supporting the best perceptual interpretations of 3D shape.
We thus anticipate that implementing optic nerve head visualizations using technologies based on conventional stereoscopic displays will provide the best diagnostic leverage in the context of clinical practice in optometry and ophthalmology. However, we also envisage that future practice will evolve toward the use of mobile handheld displays for visualizing automated reconstruction of 3D models based on OCT scans and fundus photos. For example, future clinical integration could shortly include handheld displays (like the Nintendo 3DS) that use a lenticular display for presenting stereoscopic images to enhance perceived depth and 3D shape. These displays also retain significant advantages in hygiene management over HMDs, which require regular cleaning and thorough sterilization between users. Through these ongoing innovations, we hope that capacity for clinical monitoring and assessment of glaucoma (and other eye diseases) will continue to expand capacity for the delivery of improvements in ocular healthcare.
Data Availability Statement
The raw data supporting the conclusions of this article will be made available by the authors, without undue reservation.
Ethics Statement
The studies involving human participants were reviewed and approved by University of New South Wales Human Research Ethics Advisory Biomedical Panel (HREA-B). The patients/participants provided their written informed consent to participate in this study.
Author Contributions
All authors contributed to writing this manuscript, design, data collection, and interpretation of findings.
Funding
This research was supported by an Australian Research Council (ARC) Future Fellowship awarded to JK (FT140100535), and NHMRC 1033224 partnership grant. WL was a Ph.D. candidate supported by the Australian Government Research Training Program and a scholarship from Guide Dogs NSW/ACT. Guide Dogs NSW/ACT was a partner on the NHMRC grant. This study was aided by the Sensory Processes Innovation Network (SPINet).
Conflict of Interest
The authors declare that the research was conducted in the absence of any commercial or financial relationships that could be construed as a potential conflict of interest.
Acknowledgments
Many thanks to M. Markoulli, J. Phu, S. Wei, and L.-M. Voon for their helpful comments and suggestions. Thanks also to D. Pye for his suggestions on an earlier development of this project.
References
Aaker, G. D., Gracia, L., Myung, J. S., Borcherding, V., Banfelder, J. R., D'Amico, D. J., et al. (2011). Volumetric three-dimensional reconstruction and segmentation of spectral-domain OCT. Ophthalmic Surg. Lasers Imaging 42(Suppl.), S116–S120. doi: 10.3928/15428877-20110627-11
Adams, A. J., Kapash, R. J., and Barkan, E. (1971). Visual performance and optical properties of fresnel membrane prisms. Am. J. Optom. Arch. Am. Acad. Optom. 48, 289–297. doi: 10.1097/00006324-197104000-00001
Agarwal, R., Gupta, S. K., Agarwal, P., Saxena, R., and Agrawal, S. S. (2009). Current concepts in the pathophysiology of glaucoma. Indian J. Ophthalmol. 57, 257–266. doi: 10.4103/0301-4738.53049
Allison, R. S., Rogers, B. J., and Bradshaw, M. F. (2003). Geometric and induced effects in binocular stereopsis and motion parallax. Vision Res. 43, 1879–1893. doi: 10.1016/S0042-6989(03)00298-0
Anderson, B. L., and Winawer, J. (2005). Image segmentation and lightness perception. Nature 434, 79–83. doi: 10.1038/nature03271
Arcioni, B., Palmisano, S., Apthorp, D., and Kim, J. (2019). Postural stability predicts the likelihood of cybersickness in active HMD-based virtual reality. Displays 58, 3–11. doi: 10.1016/j.displa.2018.07.001
Arthur, S. N., Aldridge, A. J., De Leon-Ortega, J., McGwin, G., Xie, A., and Girkin, C. A. (2006). Agreement in assessing cup-to-disc ratio measurement among stereoscopic optic nerve head photographs, HRT II, and Stratus OCT. J. Glaucoma 15, 183–189. doi: 10.1097/01.ijg.0000212216.19804.ee
Aygar, E., Ware, C., and Rogers, D. (2018). The contribution of stereoscopic and motion depth cues to the perception of structures in 3D point clouds. ACM Trans. Appl. Percept. 15, 1–13. doi: 10.1145/3147914
Boger, Y. (2017). Understanding Pixel Density and Retinal Resolution, and Why It's Important for AR/VR Headsets. Available online at: https://www.roadtovr.com/understanding-pixel-density-retinal-resolution-and-why-its-important-for-vr-and-ar-headsets/ (accessed October, 2018).
Burgoyne, C. F., and Morrison, J. C. (2001). The anatomy and pathophysiology of the optic nerve head in glaucoma. J. Glaucoma 10, S16–S18. doi: 10.1097/00061198-200110001-00007
Calvo, P., Ferreras, A., Abadia, B., Ara, M., Figus, M., Pablo, L. E., et al. (2014). Assessment of the optic disc morphology using spectral-domain optical coherence tomography and scanning laser ophthalmoscopy. BioMed Res. Int. 2014, 1–6. doi: 10.1155/2014/275654
Chan, H. H. L., Ong, D. N., Kong, Y. X. G., O'Neill, E. C., Pandav, S. S., Coote, M. A., et al. (2014). Glaucomatous optic neuropathy evaluation (GONE) project: the effect of monoscopic versus stereoscopic viewing conditions on optic nerve evaluation. Am. J. Ophthalmol. 157, 936–944. doi: 10.1016/j.ajo.2014.01.024
Chauhan, B. C., O'Leary, N., AlMobarak, F. A., Reis, A. S. C., Yang, H., Sharpe, G. P., et al. (2013). Enhanced detection of open-angle glaucoma with an anatomically accurate optical coherence tomography-derived neuroretinal rim parameter. Ophthalmology 120, 535–543. doi: 10.1016/j.ophtha.2012.09.055
CNET (2018). HP LP1965 - LCD Monitor - 19" Series Specs. Available online at: https://www.cnet.com/products/hp-lp1965-lcd-monitor-19-series/specs/ (accessed October, 2018).
Draelos, M., Keller, B., Viehland, C., Carrasco-Zevallos, O. M., Kuo, A., and Izatt, J. (2018). Real-time visualization and interaction with static and live optical coherence tomography volumes in immersive virtual reality. Biomed. Opt. Express 9, 2825–2843. doi: 10.1364/BOE.9.002825
Farhood, H., Perry, S., Cheng, E., and Kim, J. (2020). Enhanced 3D point cloud from a light field image. Remote Sens. 12:1125. doi: 10.3390/rs12071125
Feng, J., Kim, J., Luu, W., and Palmisano, S. (2019). “Method for estimating display lag in the Oculus Rift S and CV1,” in Paper presented at the SIGGRAPH Asia 2019 Posters, SA 2019 (Brisbane). doi: 10.1145/3355056.3364590
Flanders, M., and Sarkis, N. (1999). Fresnel membrane prisms: clinical experience. Can. J. Ophthalmol. 34, 335–340.
Fleming, R. W., Torralba, A., and Adelson, E. H. (2004). Specular reflections and the perception of shape. J. Vis. 4, 798–820. doi: 10.1167/4.9.10
Foster, D. H., and Gilson, S. J. (2002). Recognizing novel three-dimensional objects by summing signals from parts and views. Proc. Biol. Sci. 269, 1939–1947. doi: 10.1098/rspb.2002.2119
Foster, P. J., Buhrmann, R., Quigley, H. A., and Johnson, G. J. (2002). The definition and classification of glaucoma in prevalence surveys. Br. J. Ophthalmol. 86, 238–242. doi: 10.1136/bjo.86.2.238
Furlanetto, R. L., Park, S. C., Damle, U. J., Sieminski, S. F., Kung, Y., Siegal, N., et al. (2013). Posterior displacement of the lamina cribrosa in glaucoma: in vivo interindividual and intereye comparisons. Invest. Ophthalmol. Vis. Sci. 54, 4836–4842. doi: 10.1167/iovs.12-11530
Gibson, E. J., Gibson, J. J., Smith, O. W., and Flock, H. (1959). Motion parallax as a determinant of perceived depth. J. Exp. Psychol. 58, 40–51. doi: 10.1037/h0043883
Gordon, M. O., and Kass, M. A. (1999). The ocular hypertension treatment study: design and baseline description of the participants. Arch. Ophthalmol. 117, 573–583. doi: 10.1001/archopht.117.5.573
Healey, P. R., and Mitchell, P. (2004). Visibility of lamina cribrosa pores and open-angle glaucoma. Am. J. Ophthalmol. 138, 871–872. doi: 10.1016/j.ajo.2004.05.058
Honson, V., Huynh-Thu, Q., Arnison, M., Monaghan, D., Isherwood, Z. J., and Kim, J. (2020). Effects of shape, roughness and gloss on the perceived reflectance of colored surfaces. Front. Psychol. 11:485. doi: 10.3389/fpsyg.2020.00485
Huang, T. S., and Lee, C. H. (1989). Motion and structure from orthographic projections. IEEE Trans. Pattern Anal. Mach. Intell. 11, 536–540. doi: 10.1109/34.24786
Jang, S., Vitale, J. M., Jyung, R. W., and Black, J. B. (2017). Direct manipulation is better than passive viewing for learning anatomy in a three-dimensional virtual reality environment. Comput. Educ. 106, 150–165. doi: 10.1016/j.compedu.2016.12.009
Jonas, J. B., Fernandez, M. C., and Sturmer, J. (1993). Pattern of glaucomatous neuroretinal rim loss. Ophthalmology 100, 63–68. doi: 10.1016/S0161-6420(13)31694-7
Jonas, J. B., Gusek, G. C., and Naumann, G. O. (1988). Optic disc, cup and neuroretinal rim size, configuration and correlations in normal eyes. Invest. Ophthalmol. Vis. Sci. 29, 1151–1158.
Jonas, J. B., Thomas, R., George, R., Berenshtein, E., and Muliyil, J. (2003). Optic disc morphology in south India: the Vellore eye study. Br. J. Ophthalmol. 87, 189–196. doi: 10.1136/bjo.87.2.189
Jung, K. I., Jeon, S., and Park, C. K. (2016). Lamina cribrosa depth is associated with the cup-to-disc ratio in eyes with large optic disc cupping and cup-to-disc ratio asymmetry. J. Glaucoma 25, e536–e545. doi: 10.1097/IJG.0000000000000387
Kennedy, R. S., Lane, N. E., Berbaum, K. S., and Lilienthal, M. G. (1993). Simulator sickness questionnaire: an enhanced method for quantifying simulator sickness. Int. J. Aviat. Psychol. 3, 203–220. doi: 10.1207/s15327108ijap0303_3
Kijima, K., and Miyajima, K. (2016). “Measurement of head mounted display's latency in rotation and side effect caused by lag compensation by simultaneous observation—An example result using Oculus Rift DK2,” in 2016 IEEE Virtual Reality (VR) (Greenville, SC), 203–204. doi: 10.1109/VR.2016.7504724
Kim, J., and Anstis, S. (2016). “Decoding figure-ground occlusions from contours and shading,” Paper presented at the First International Workshop on Pattern Recognition (Tokyo). doi: 10.1117/12.2242783
Kim, J., Chung, C. Y., Nakamura, S., Palmisano, S., and Khuu, S. K. (2015). The Oculus Rift: a cost-effective tool for studying visual-vestibular interactions in self-motion perception. Front. Psychol. 6:248. doi: 10.3389/fpsyg.2015.00248
Kim, J., Luu, W., and Palmisano, S. (2020). Multisensory integration and the experience of scene instability, presence and cybersickness in virtual environments. Comput. Human. Behav. 113:106484. doi: 10.1016/j.chb.2020.106484
Kim, J., Moroz, M., Arcioni, B., and Palmisano, S. (2018). “Effects of head-display lag on presence in the Oculus Rift,” Paper presented at the Proceedings of the ACM Symposium on Virtual Reality Software and Technology (Tokyo). doi: 10.1145/3281505.3281607
Koh, V., Tham, Y. C., Cheung, C. Y., Mani, B., Wong, T. Y., Aung, T., et al. (2018). Diagnostic accuracy of macular ganglion cell-inner plexiform layer thickness for glaucoma detection in a population-based study: comparison with optic nerve head imaging parameters. PLoS ONE 13:e0199134. doi: 10.1371/journal.pone.0199134
Krupin, T., Liebmann, J. M., Greenfield, D. S., Rosenberg, L. F., Ritch, R., Yang, J. W., et al. (2005). The Low-Pressure Glaucoma Treatment Study (LoGTS) study design and baseline characteristics of enrolled patients. Ophthalmology 112, 376–385. doi: 10.1016/j.ophtha.2004.10.034
Kuang, T. M., Zhang, C., Zangwill, L. M., Weinreb, R. N., and Medeiros, F. A. (2015). Estimating lead time gained by optical coherence tomography in detecting glaucoma before development of visual field defects. Ophthalmology 122, 2002–2009. doi: 10.1016/j.ophtha.2015.06.015
Laha, B., Sensharma, K., Schiffbauer, J. D., and Bowman, D. A. (2012). Effects of immersion on visual analysis of volume data. IEEE Trans. Vis. Comput. Graph 18, 597–606. doi: 10.1109/TVCG.2012.42
Litcher, P. (1976). Variability of expert observers in evaluating the optic disc. Trans. Am. Ophthalmol. Soc. 74, 532–572.
Marlow, P. J., and Anderson, B. L. (2016). Motion and texture shape cues modulate perceived material properties. J. Vis. 16:5. doi: 10.1167/16.1.5
Martindale, J. (2018). Oculus Rift vs. HTC Vive. Virtual Reality. Available online at: https://www.digitaltrends.com/virtual-reality/oculus-rift-vs-htc-vive/ (accessed October, 2018).
Medeiros, F. A., Vizzeri, G., Zangwill, L. M., Alencar, L. M., Sample, P. A., and Weinreb, R. N. (2008). Comparison of retinal nerve fiber layer and optic disc imaging for diagnosing glaucoma in patients suspected of having the disease. Ophthalmology 115, 1340–1346. doi: 10.1016/j.ophtha.2007.11.008
Meditec, Z. (2019). Cirrus Photo. Available online at: https://www.zeiss.com/meditec/int/product-portfolio/optical-coherence-tomography-devices/cirrus-photo-family.html
Mills, R. P., Budenz, D. L., Lee, P. P., Noecker, R. J., Walt, J. G., Siegartel, L. R., et al. (2006). Categorizing the stage of glaucoma from pre-diagnosis to end-stage disease. Am. J. Ophthalmol. 141, 24–30. doi: 10.1016/j.ajo.2005.07.044
Monsalve, B., Ferreras, A., Calvo, P., Urcola, J. A., Figus, M., Monsalve, J., et al. (2017). Diagnostic ability of humphrey perimetry, octopus perimetry, and optical coherence tomography for glaucomatous optic neuropathy. Eye 31, 443–451. doi: 10.1038/eye.2016.251
Morgan, J. E., Sheen, N. J., North, R. V., Choong, Y., and Ansari, E. (2005). Digital imaging of the optic nerve head: monoscopic and stereoscopic analysis. Br. J. Ophthalmol. 89, 879–884. doi: 10.1136/bjo.2004.046169
Mwanza, J. C., Chang, R. T., Budenz, D. L., Durbin, M. K., Gendy, M. G., Shi, W., et al. (2010). Reproducibility of peripapillary retinal nerve fiber layer thickness and optic nerve head parameters measured with Cirrus HD-OCT in glaucomatous eyes. Invest. Ophthalmol. Vis. Sci. 51, 5724–5730. doi: 10.1167/iovs.10-5222
Mwanza, J. C., Oakley, J. D., Budenz, D. L., Anderson, D. R., and Cirrus Optical Coherence Tomography Normative Database Study Group (2011). Ability of Cirrus HD-OCT optic nerve head parameters to discriminate normal from glaucomatous eyes. Ophthalmology 118, 241–248. doi: 10.1016/j.ophtha.2010.06.036
Nidek (2019). Optical Coherence Tomography Retina Scan Duo™. Available online at: https://www.nidek-intl.com/product/ophthaloptom/diagnostic/dia_retina/rs-330.html (accessed September, 2018).
Oculus Rift Specs (2016). Oculus Rift Specs–DK1 vs DK2 Comparison. Available online at: https://riftinfo.com/oculus-rift-specs-dk1-vs-dk2-comparison (accessed October, 2018).
Palmisano, S., Mursic, R., and Kim, J. (2017). Vection and cybersickness generated by head-and-display motion in the Oculus Rift. Displays 46, 1–8. doi: 10.1016/j.displa.2016.11.001
Palmisano, S., Summersby, S., Davies, R. G., and Kim, J. (2016). Stereoscopic advantages for vection induced by radial, circular, and spiral optic flows. J. Vis. 16:7. doi: 10.1167/16.14.7
Palmisano, S., Szalla, L., and Kim, J. (2019). “Monocular viewing protects against cybersickness produced by head movements in the Oculus Rift,” in Paper presented at the Proceedings of the ACM Symposium on Virtual Reality Software and Technology (Parramatta, NSW). doi: 10.1145/3359996.3364699
Park, S. C., Brumm, J., Furlanetto, R. L., Netto, C., Liu, Y., Tello, C., et al. (2015). Lamina cribrosa depth in different stages of glaucoma. Invest. Ophthalmol. Vis. Sci. 56, 2059–2064. doi: 10.1167/iovs.14-15540
Polcar, J., and Horejsi, P. (2015). Knowledge acquisition and cyber sickness: a comparison of VR devices in virtual tours. MM Sci. J. 2015, 613–616. doi: 10.17973/MMSJ.2015_06_201516
Quigley, H. (1999). Neuronal death in glaucoma. Prog. Retin. Eye Res. 18, 39–57. doi: 10.1016/S1350-9462(98)00014-7
Quigley, H. A., Addicks, E. M., Green, W. R., and Maumenee, A. E. (1981). Optic nerve damage in human glaucoma. II. The site of injury and susceptibility to damage. Arch. Ophthalmol. 99, 635–649. doi: 10.1001/archopht.1981.03930010635009
Quigley, H. A., Hohman, R. M., Addicks, E. M., Massof, R. W., and Green, W. R. (1983). Morphologic changes in the lamina cribrosa correlated with neural loss in open-angle glaucoma. Am. J. Ophthalmol. 95, 673–691. doi: 10.1016/0002-9394(83)90389-6
Reis, A. S., Sharpe, G. P., Yang, H., Nicolela, M. T., Burgoyne, C. F., and Chauhan, B. C. (2012). Optic disc margin anatomy in patients with glaucoma and normal controls with spectral domain optical coherence tomography. Ophthalmology 119, 738–747. doi: 10.1016/j.ophtha.2011.09.054
Savini, G., Espana, E., Acosta, A., Carbonelli, M., Bellusci, C., and Barboni, P. (2009). Agreement between optical coherence tomography and digital stereophotography in vertical cup-to-disc ratio measurement. Graefe's Arch. Clin. Exp. Ophthalmol. 247, 377–383. doi: 10.1007/s00417-008-0968-3
Schulze, J. P., Schulze-Dobold, C., Erginay, A., and Tadayoni, R. (2013). Visualization of three-dimensional ultra-high resolution OCT in virtual reality. Stud. Health Technol. Inf. 184, 387–391. doi: 10.3233/978-1-61499-209-7-387
Sharma, A., Oakley, J. D., Schiffman, J. C., Budenz, D. L., and Anderson, D. R. (2011). Comparison of automated analysis of Cirrus HD OCT spectral-domain optical coherence tomography with stereo photographs of the optic disc. Ophthalmology 118, 1348–1357. doi: 10.1016/j.ophtha.2010.12.008
Sollenberger, R. L., and Milgram, P. (1993). The effects of stereoscopic and rotational displays in a three-dimensional path-tracing task. Hum. Factors 35, 483–500. doi: 10.1177/001872089303500306
Sommer, A., Katz, J., Quigley, H. A., Miller, N. R., Robin, A. L., Richter, R. C., et al. (1991). Clinically detectable nerve fiber atrophy precedes the onset of glaucomatous field loss. Arch. Ophthalmol. 109, 77–83. doi: 10.1001/archopht.1991.01080010079037
Sperling, G., and Landy, M. S. (1989). Kinetic depth effect and identification of shape. J. Exp. Psychol. Hum. Percept. Perf. 15, 826–840. doi: 10.1037/0096-1523.15.4.826
Sung, K. R., Kim, S., Lee, Y., Yun, S. C., and Na, J. H. (2011). Retinal nerve fiber layer normative classification by optical coherence tomography for prediction of future visual field loss. Invest. Ophthalmol. Vis. Sci. 52, 2634–2639. doi: 10.1167/iovs.10-6246
Sung, K. R., Na, J. H., and Lee, Y. (2012). Glaucoma diagnostic capabilities of optic nerve head parameters as determined by Cirrus HD optical coherence tomography. J. Glaucoma 21, 498–504. doi: 10.1097/IJG.0b013e318220dbb7
Uchida, H., Brigatti, L., and Caprioli, J. (1996). Detection of structural damage from glaucoma with confocal laser image analysis. Invest. Ophthalmol. Vis. Sci. 37, 2393–2401.
Ullman, S. (1979). The interpretation of structure from motion. Proc. R. Soc. Lond. B Biol. Sci. 203, 405–426. doi: 10.1098/rspb.1979.0006
Ware, C., and Mitchell, P. (2005). “Reevaluating stereo and motion cues for visualizing graphs in three dimensions,” in ACM Proceedings of the 2nd Symposium on Applied Perception in Graphics and Visualization (A Coruña), 51–58. doi: 10.1145/1080402.1080411
Weinreb, R. N., Aung, T., and Medeiros, F. A. (2014). The pathophysiology and treatment of glaucoma. JAMA Ophthalmol. 311, 1901–1911. doi: 10.1001/jama.2014.3192
Wong, E., Yoshioka, N., Kalloniatis, M., and Zangerl, B. (2015). Cirrus HD-OCT short-term repeatability of clinical retinal nerve fiber layer measurements. Optom. Vis. Sci. 92, 83–88. doi: 10.1097/OPX.0000000000000452
Yan, D. B., Coloma, F. M., Metheetrairut, A., Trope, G. E., Heathcote, J. G., and Ethier, C. R. (1994). Deformation of the lamina cribrosa by elevated intraocular pressure. Br. J. Ophthalmol. 78, 643–648. doi: 10.1136/bjo.78.8.643
Keywords: virtual reality, material perception, 3D shape, optic nerve, optometry, ophthalmology
Citation: Chen E, Luu W, Chen R, Rafik A, Ryu Y, Zangerl B and Kim J (2020) Virtual Reality Improves Clinical Assessment of the Optic Nerve. Front. Virtual Real. 1:4. doi: 10.3389/frvir.2020.00004
Received: 21 March 2020; Accepted: 22 June 2020;
Published: 05 August 2020.
Edited by:
Michael Madary, University of the Pacific, United StatesReviewed by:
Benjamin Weyers, University of Trier, GermanyKyle John Johnsen, University of Georgia, United States
Copyright © 2020 Chen, Luu, Chen, Rafik, Ryu, Zangerl and Kim. This is an open-access article distributed under the terms of the Creative Commons Attribution License (CC BY). The use, distribution or reproduction in other forums is permitted, provided the original author(s) and the copyright owner(s) are credited and that the original publication in this journal is cited, in accordance with accepted academic practice. No use, distribution or reproduction is permitted which does not comply with these terms.
*Correspondence: Juno Kim, anVuby5raW1AdW5zdy5lZHUuYXU=