 Virginia Nichols
 Lydia English
 Sarah Carlson
 Stefan Gailans
 Matt Liebman1
- 1Department of Agronomy, Iowa State University, Ames, IA, United States
- 2Practical Farmers of Iowa, Ames, IA, United States
Cool-season cover crops have been shown to reduce soil erosion and nutrient discharge from maize (Zea mays L.) and soybean [Glycine max (L.) Merr.] production systems. However, their effects on long-term weed dynamics are not well-understood. We utilized five long-term research trials in Iowa to quantify germinable weed seedbank densities and compositions after 10+ years of cover cropping treatments. All five trials consisted of zero-tillage maize-soybean rotations managed with and without the inclusion of a yearly winter rye (Secale cereal L.) cover crop. Seedbank sampling was conducted in the early spring before crop planting at all locations, with three of the five trials having grown a soybean crop the preceding year, and two a maize crop. Two of the trials (both previously soybean) showed significant and biologically relevant decreases (4,070 and 927 seeds m−2, respectively) in seedbank densities in cover crop treatments compared to controls. In another two trials, one previously maize and one previously soybean, no difference was detected in seedbank densities. In the fifth trial (previously maize), there was a significant, but biologically unimportant increase of 349 seeds m−2. All five trials' weed communities were dominated by common waterhemp [Amaranthus tuberculatus (Moq.)], and changes in seedbank composition from cover-cropping were driven by changes in this species. Although previous studies have shown that increases in cover crop biomass are strongly correlated with weed suppression, in our study we did not find a relationship between seedbank changes and the mean amount of cover crop biomass produced over a 10-years period (experiment means ranging from 0.5 to 2.0 Mg ha−1 yr−1), the stability of the cover crop biomass production, nor the amount produced going into the previous crop's growing season. We conclude that long-term use of a winter rye cover crop in a maize-soybean system has the potential to meaningfully reduce the size of weed seedbanks compared to winter fallows. However, identifying the mechanisms by which this occurs requires further research into processes such as seed predation and seed decay in cover cropped systems.
Introduction
One-third of the global maize (Zea mays L.) and soybean [Glycine max (L.) Merr.] production comes from the United States (US; Food and Agriculture Organization of the United Nations, 2020). The majority of US production occurs in the Midwest region (USDA, 2020a), and 80% of the agricultural land in the two top-producing states, Iowa and Illinois, is dedicated to a rotation consisting solely of these two crops (USDA, 2020b). Maize-soybean cropping systems traditionally leave the soil fallow over the winter and early spring, resulting in high levels of nutrient and soil export that render the sustainability of the system questionable (O'Neal et al., 2005; Dold et al., 2017; Nearing et al., 2017; Jones et al., 2018). Incorporation of an over-wintering rye (Secale cereal L.) cover crop into these systems can significantly reduce soil erosion and nutrient leaching (Strock et al., 2004; Kaspar and Singer, 2011; Kaspar et al., 2012), and may offer additional long-term benefits to the soil (Moore et al., 2014; Basche et al., 2016a,b). Surveys indicate farmers consider cover crops to be a valuable component of an integrated approach to weed management (Arbuckle and Lasley, 2013). Moreover, ecologically-based approaches to weed management such as cover crops are becoming more critical as weeds develop herbicide resistance to multiple modes of action (Patzoldt et al., 2005; Price et al., 2011; Bunchek et al., 2020; MacLaren et al., 2020). However, the effects of over-wintering cover crops on weed dynamics in these systems is not well-understood.
There is evidence cover crops can reduce weed biomass in many production contexts (Baraibar et al., 2018; MacLaren et al., 2019; Smith et al., 2020), and specifically in midwestern maize-soybean systems (Nichols et al., 2020a). In other production systems, there is also evidence cover crops can reduce weed seed densities in the soil (Moonen and Bàrberi, 2004; Mirsky et al., 2010; Alonso-Ayuso et al., 2018) and decrease the survival success of herbicide-resistant weeds (Cholette et al., 2018; Wallace et al., 2019). However, the majority of relevant studies have been conducted in plots where cover crop treatments were in place <3 years, so the long-term effect of cover cropping on weed dynamics in these systems is unclear. The density and species composition of emerged weeds can vary greatly from year to year based on weather conditions, rendering the more subtle effects of management practices difficult to discern in short-term studies (Teasdale et al., 2018). Additionally, weed seeds can persist in the soil for several years, creating legacy effects that can overwhelm short-term changes in management. Measurements taken in long-term, replicated settings may therefore more accurately reflect management-induced changes.
Aboveground measurements of weeds are useful, but the potential for annual weed species to interfere with crop growth and yield is ultimately an expression of the weed seedbank. In the midwestern US, management practices that target weed seedbanks are particularly relevant, as the majority of problematic weeds are annual species whose persistence depends on replenishing seedbanks (Davis, 2006). While seedbank sizes are of primary concern, the seedbank composition can provide insight into weed dynamics and differences in composition can be used to assess the relative strength of the filters defining the weed community (e.g., Ryan et al., 2010). Additionally, there is some evidence that crop yield loss and weed diversity are negatively correlated (Adeux et al., 2019) and more diverse assemblages of weed seeds in the soil may reflect the impacts of more sustainable management strategies (Storkey and Neve, 2018). Information about the size and composition of weed seedbanks after two or more full crop rotation sequences may therefore provide a more complete picture of weed responses to cover cropping.
To address the lack of data concerning long-term effects of cover cropping on weed seedbanks in maize-soybean systems, we measured the size and composition of the germinable weed seedbank sampled from five trials in Iowa where rye cover crop treatments had been in place for at least 10 years. We hypothesized that long-term use of over-wintering rye cover crops in maize-soybean rotation systems would: (1) reduce the size and (2) increase the species diversity of the weed seedbank.
Methods and Materials
Site Descriptions
Three research sites were used for this study (Table 1). The West and East sites were grain production fields on commercial farms, and only one phase of the maize-soybean rotation was present each year. The Central site had both a grain-based maize-soybean rotation and a silage-based rotation. In the silage rotation, the maize phase was harvested for silage at the milk stage (R3; Abendroth et al., 2011). The trials were part of a larger study (Kaspar et al., 2007, 2012) and had both phases of the rotations of both systems (grain- and silage-based) present each year, but each phase was located in a separate field.
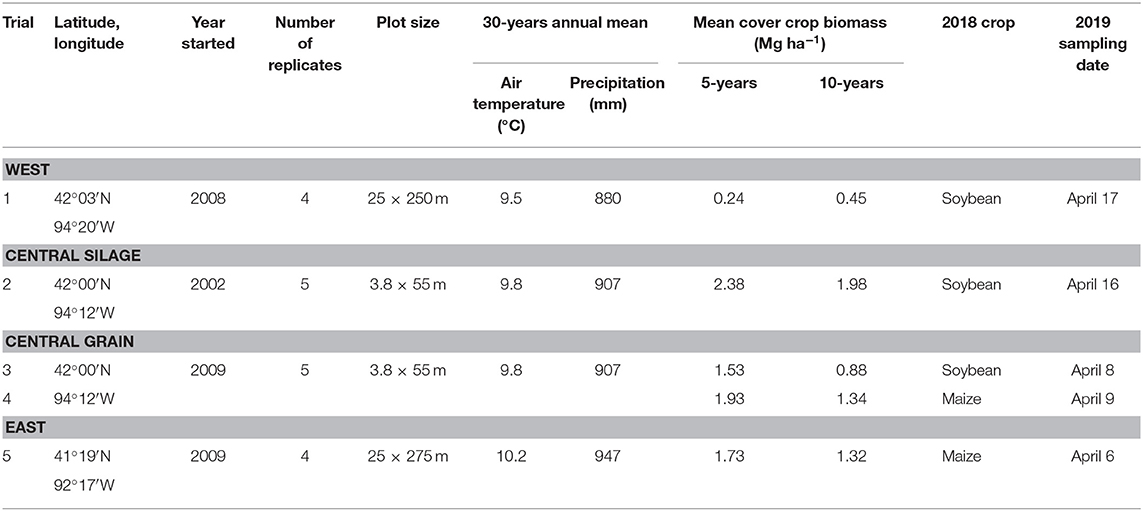
Table 1. Summary of the four trials sampled.
All trials consisted of two treatments that had been in place for at least 10 years: (1) a maize-soybean rotation (either grain- or silage-based) with a winter rye cover crop planted in the fall following cash crop harvest and terminated in the spring, and (2) the same rotation without a cover crop. Every trial was arranged in a randomized complete block design with four (West and East) or five (Central) replicates. More detailed accounts of agronomic management at the Central site have been published elsewhere (Moore et al., 2014). None of the studies were originally set-up with the goal of assessing weed dynamics; as such there are unfortunately no baseline measurements of the weed seedbank available.
The plots within each trial were managed identically save for the planting of the cover crop in the fall. All sites applied herbicide 1–2 weeks before maize or soybean planting to all plots and in certain years an additional herbicide application shortly after cash crop planting (Table 2). The exact herbicide and nutrient programs varied by site, reflective of their particular managers and contexts (Supplementary Material). All sites had sub-surface tile drainage and were managed without tillage since initiation of the trials.
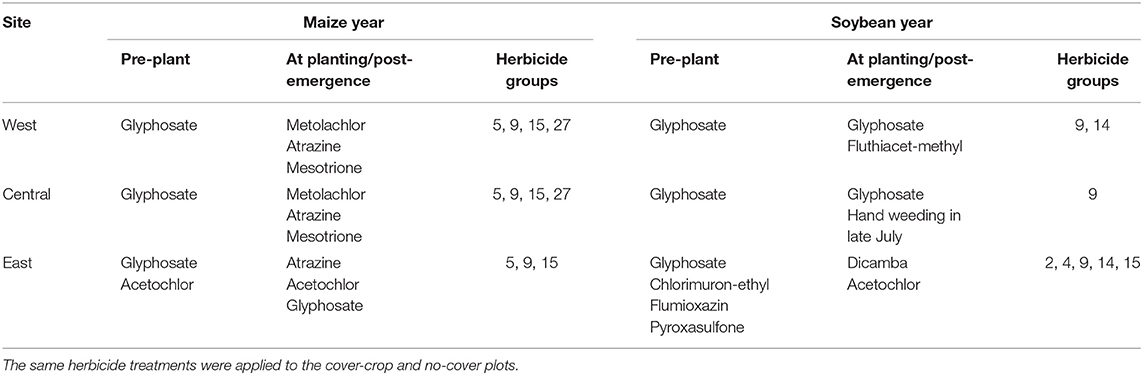
Table 2. Summary of herbicide active ingredients applied at each site during 2017–2019 growing seasons.
Weed Seedbank Sampling
Midwestern row crop production fields typically have early spring seedbank densities well-above 500 seed m−2 in the top 10 cm of the soil profile (Forcella et al., 1992; Felix and Owen, 2001). For these expected values, 20 soil samples 5 cm in diameter are expected to provide a high level of precision when estimating seedbank densities (Dessaint et al., 1996; Forcella et al., 2003). We used these estimates to guide our sampling protocol.
A soil sampler was constructed using PVC pipe with an inner diameter of 5.25 cm and a line indicating 10 cm sampling depth to extract a total of 52.5 cm3 of soil per core. In no-till systems, this represents a generous depth from which most midwestern US weed seedlings can emerge (Mohler, 1993), so we assumed our sampling efforts accurately recovered seeds with the potential to contribute to weed infestations in maize and soybean crops.
Sampling was done in April 2019 at all locations. Each plot was divided longitudinally into five sampling areas. Within each sampling area, four cores were taken. The East and West locations' plots were wide, so the cores were taken randomly within each of the five sampling areas. For the Central sites, which had narrower plots, the cores were taken from the middle of the sampling area to minimize edge effects. Within each sampling area, four cores were taken and the soil was emptied into a bucket, thoroughly mixed, then placed in a sealed polyethylene bag and stored for a maximum of 5 h in a cooler for transportation. Each plot had a total of 1,050 cm3 of soil sampled (20 cores, each 52.5 cm3). Sampling occurred before maize (West, Central-grain) or soybean (East, Central-grain, Central-silage) planting at each site. At the Central site, both phases of the grain rotation were sampled, while only one phase of the silage rotation was sampled due to time constraints (Table 1).
Germinable Seedbank Measurements
The germinable seedbank method was chosen over the extractable seedbank method based on practicality, and its applicability for assessing treatment differences (Reinhardt and Leon, 2018). Soil processing, as described below, occurred on the same day as collection.
The field-wet soil was weighed to ensure each plot had approximately the same mass of soil sampled (Supplementary Material). The soil from each plot's five sampling points was then combined and sieved through a 5 mm wire mesh screen into a bucket and transported to a greenhouse.
Plastic 25 × 50 cm trays with drainage holes were filled with vermiculite to a depth of 1 cm (Greenhouse Megastore, Danville, Illinois, US). The bulked soil from each plot was evenly distributed into three trays, creating a 1 cm soil layer covering the vermiculite. The soil was saturated using a three-hole fine-mist brass nozzle (Greenhouse Megastore). The greenhouse area had no artificial lighting and was maintained near 28°C. Germination from soil samples occurred between April and July, during a period with 13–15 h of daylight.
Trays were checked 1–3 times per day to ensure proper germination conditions. Weed seedlings were identified, counted, and pulled daily, after which the trays were randomly relocated within the greenhouse to avoid the effects of micro-environments on germination. When no new seedlings appeared for at least 3 days, the tray was allowed to dry in order to avoid conditions that would promote decay of un-germinated seeds. Once all trays were dried (~2 months after sampling), each tray's soil was recollected, re-sieved, redistributed into the same tray, and again saturated. This process was repeated twice, and after the second soil re-sieving no seedlings emerged. The total number of emerged seedlings was reported as the seedbank density.
Cover Crop Biomass Sampling
Cover crop biomass was sampled in each trial since initiation. For the East and West experiments, four 76 × 48 cm quadrats were collected per plot before cover crop termination. For the Central experiments, cover crop biomass was sampled before cover crop termination using an 81 × 30 cm quadrat, with two quadrat samples per plot. Only two quadrats were used at this site because the plots were small and removing more biomass could affect the long-term plots' integrity. Biomass from all sites was dried at 60°C for at least 48 h and then weighed. Carbon-to-nitrogen ratios of the biomass were collected in select years, but due to the inconsistency of data collection those results are not presented here. No other cover crop metrics were collected (e.g., height, stand count, stage). Mean values at each trial for each year are available in Supplementary Material and in the published dataset (Nichols et al., 2020b).
Data Analysis
The raw dataset is available on Iowa State University's DataShare platform (Nichols et al., 2020b) and as an R package available on github (https://github.com/vanichols/PFIweeds2020). All data management, visualization, and statistical analyses were conducted using R version 3.6.1 (R Core Team, 2016); all code is publicly available (https://github.com/vanichols/PFIweeds2020_analysis). The tidyverse meta package (Wickham et al., 2019) was used for data manipulation and visualization, in addition to several other packages (Becker et al., 2018; Wickham and Bryan, 2018; Wilke, 2019). All packages used for statistical analyses are cited below.
Seedbank Size
The number of emerged seedlings was assumed to represent the seedbank density. The distribution of measured seedbank densities exhibited a high right-skewness and over-dispersion typical of count data. Several candidate statistical models were evaluated, and the detailed exploration process can be found in an online format (https://lydiae.com/2020/04/22/many-models/). We chose to use a generalized linear mixed-effect model (McCulloch and Neuhaus, 2005) using a log-linked Poisson distribution and observation-level random effects to account for overdispersion (Harrison, 2014), fit using the glmer function from the lme4 package (Bates et al., 2015). We used the trial as a fixed effect, which had five levels (West, Central-grain/soybean, Central-grain/maize, Central-silage/soybean, East). Additionally, the cover crop treatment (cover, no-cover) and its interaction with the trial were included as fixed effects. In addition to the random intercept for each observation to address overdispersion, we included a random intercept term for the blocks nested within the trial. All pair-wise comparisons were conducted using the emmeans package (Lenth et al., 2018), which calculates the least-squares means and computes contrasts. Raw seedling counts were converted to seeds m−2 based on the PVC sampling tube diameter.
We ran a leave-one-out sensitivity analysis wherein the statistical model was run on datasets with one observation removed to explore the sensitivity of our results to any single experimental unit. One cover-cropped plot in the West location had a waterhemp [Amaranthus tuberculatus (Moq.)] seed count of more than 16,000 seeds m−2, while the plot with the next highest observed waterhemp density at that site (a no-cover plot) was <10,000 seeds m−2. We ran all models both with and without the outlier (Supplementary Material), and found it did affect the magnitude of the cover crop treatment effect in that experiment, but not the direction of the effect. We felt this large value may not be a realistic representation of the actual seed density in the plot, as the producer did not recall that plot having twice the weed biomass of other plots (personal comm). Due to the mixing of individual soil cores that was done in the field, it is not possible to isolate whether this large value was caused by a single core. Waterhemp plants grown in highly competitive environments can still produce 10,000 seeds (Schwartz et al., 2016), so it is conceivable we captured the seed rain from a single plant. We chose to present the results with the outlier removed as we felt it was more representative, but note the effect of the outlier when relevant throughout the results.
We used a first- and second-order stochastic dominance analysis to compare the cumulative distribution curves of seedbank size for no-cover and cover-cropped production systems (Levy, 1992). Stochastic dominance is a tool commonly used in risk-assessments to identify scenarios with a higher probability of favorable outcomes (e.g., Goplen et al., 2018). We assumed producers want to minimize the size of the weed seedbank, and therefore used the inverse of the cumulative probability distributions to assess outcomes from using a cover crop compared to no cover crop. Comparing the cumulative distributions at a given value of weed seedbank densities provides information concerning outcomes of a practice (first-order), while comparing the area under the cumulative probability curves provides information about the risk associated with a particular practice (second-order).
To quantify cover crop biomass production for each trial, we calculated different metrics to capture varying functional aspects of the cover crop that might affect weed seedbanks. Using cover crop biomass data from 2009 through 2019, we calculated the following metrics using both the previous 10 years of data and only the previous 5 years: (1) mean biomass production, (2) variance in biomass production, (3) maximum biomass production, (4) number of years with >1 Mg ha−1 production, (5) number of years with >2 Mg ha−1 production, (6) mean-to-standard-deviation ratio of biomass production (stability), and (7) biomass production the year of sampling, as well as the year prior.
We used non-parametric Spearman rank correlations to assess the association between the metrics listed above and cover crop effect on seedbank densities (relative and absolute).
Seedbank community composition
Changes in the weed seedbank community were assessed using both uni- and multivariate approaches. For the univariate approach, linear mixed-effect models with trial, cover crop treatment, and their interaction as fixed effects and random intercepts for nested blocks were used to assess the impact of cover cropping on seedbank diversity metrics. Our diversity metrics included species richness, Shannon Hill diversity and evenness (Jost, 2006) for each experimental unit (a plot) using the raw seedling counts and the following equations:
Where
Evenness describes how a given species richness is distributed and ranges from 0 to 1, with 1 signifying all species are equally present. Shannon Hill diversity can be interpreted as the “effective” number of species; when evenness is 1, Shannon Hill diversity is equal to species richness.
For the multivariate approach, species composition was compared across trials and cover crop treatments using non-metric multidimensional scaling (NMDS) implemented through the vegan package (Oksanen et al., 2019). NMDS assists in visualizing and analyzing similarities between groups of individuals (Prentice, 1977). The removal of rare species from multi-variate analyses can impact interpretations (Poos and Jackson, 2012), so we performed all analyses on both the full dataset and on a dataset containing only the species comprising more than 5% of the observations and found the results did not change. Bray-Curtis dissimilarities were calculated on raw seed counts. Variation in distance matrices were partitioned into trial and cover crop contributions using permutations implemented through the adonis function of the vegan package. The adonis function works by creating permutations of the raw data wherein data is randomly assigned to a group. It finds the centroids and squared-deviations for each permutation, and by comparing those values to the raw data, the significance tests reflect the probability of observing the true data assuming no group structure exists.
Results
Weed Seedbank Size
The West (previous crop of soybean) trial had the largest estimated mean seedbank size (5,647 seeds m−2), followed by the Central-silage (previously soybean; 935 seeds m−2), with the Central-grain (previously maize, soybean) and East (previously maize) locations having similarly low mean densities (382–482 seeds m−2; Figure 1). Due to a significant interaction between trial and cover crop treatment, all results are reported on a per-trial basis.
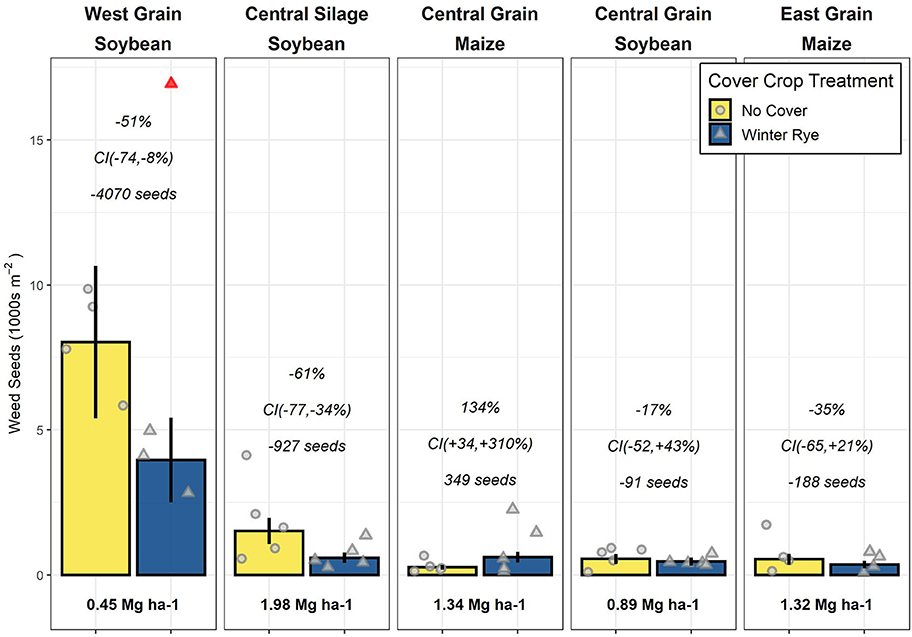
Figure 1. Weed seed densities for no-cover and winter rye (Secale cereale) cover crop plots (points jittered for ease of viewing) with a removed outlier indicated in red; panel titles present the trial location, cropping system type, and previous year's cash crop; bars represent mean seed densities with standard errors of the means indicated by the vertical lines; italicized text presents the (top) estimated change from no-cover to cover treatments within a trial on a relative scale, (middle) 90% confidence intervals (CIs) of the relative change, and (bottom) the absolute difference in seeds per m−2. Bold text below bars presents the 10-years mean cover crop biomass production for that trial.
In the three trials with a soybean crop the preceding year, the seedbank density was lower in the cover crop treatment compared to the no-cover treatment by 91 (Central-grain), 927 (Central-silage), and 4,070 (West) seeds m−2, respectively, corresponding to a 17, 61, and 51% reduction. The magnitude of the West results were sensitive to the inclusion of the outlier (Supplementary Material), but the direction of the effect was not. In the trials previously planted to maize, seedbank densities in cover cropped plots were lower in one trial (East; reduced by 188 seeds m−2, 35%) and increased in another (Central-grain; increased by 349 seeds m−2, 134%).
Neither the absolute nor relative differences between the cover crop and control treatments were meaningfully related to any of the cover crop biomass metrics we calculated (Supplementary Material).
Weed Seedbank Community
A total of 4,677 seedlings were counted, consisting of 16 identified species (Table 3). Seven seedlings were identified as belonging to the Setaria genus, but the species was unclear. The species common to the Midwest, Setaria faberi Herrm., Setaria viridis (L.) P. Beauv, and Setaria pumila (Poir.) Roem. & Schult., for this reason we combined the Setaria seedlings into one category for reporting and analysis. Unidentified dicotyledon seedlings were classified as “unknown dicotyledon (UD)” and accounted for 8 of the seedlings, respectively, representing <0.2% of the data (Table 3). Because they made up such a small contribution to the overall community we left them in the analysis, but labeled as unknown.
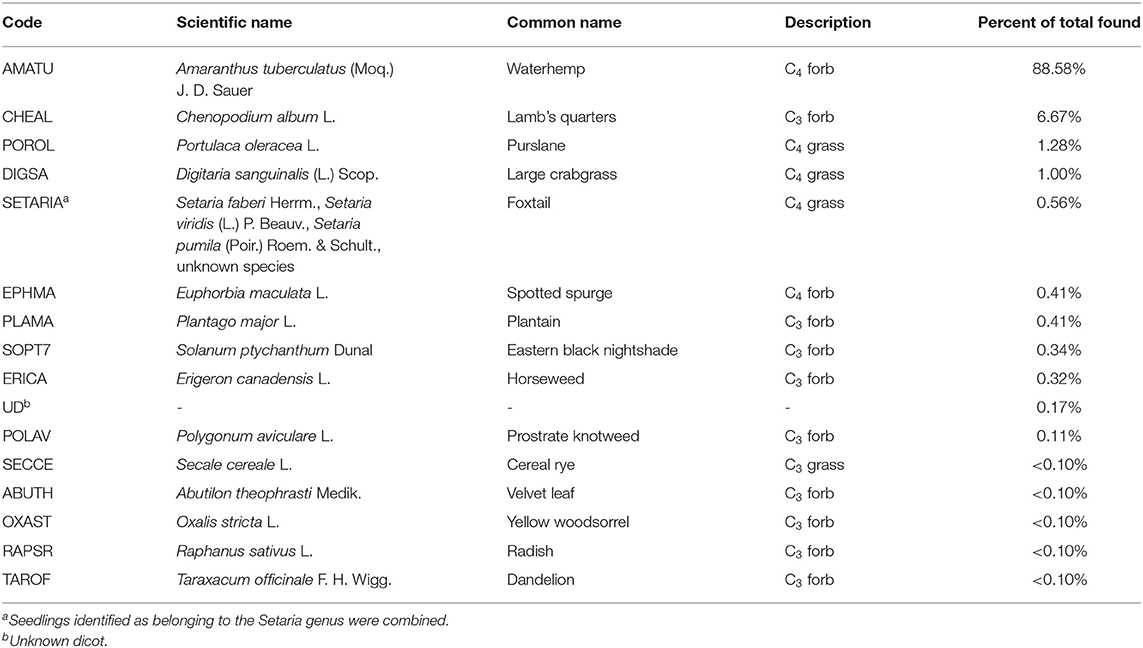
Table 3. Summary of weed species identified in this study in order of prevalence.
We note that using the germination-method is known to cause varying underestimation of species. The method can bias counts toward species responsive to the particular conditions used, for example by specifically underestimating species with long seed dormancies or seeds that were not sufficiently stratified the previous winter (Gross, 1990).
The changes in seedbanks were driven by changes in the number of waterhemp (Amaranthus tuberculatus, AMATU) seeds (Figure 2).
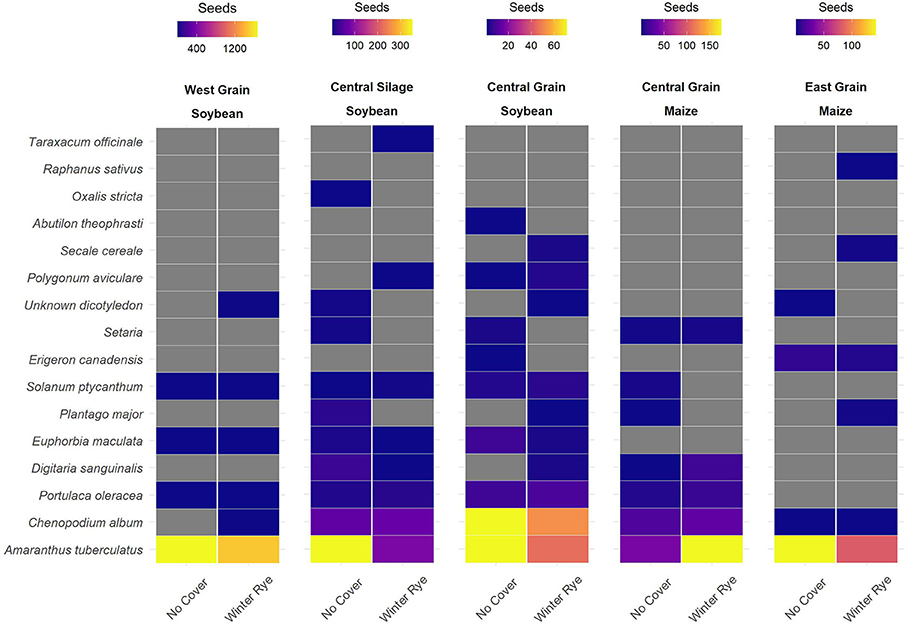
Figure 2. Differences in winter rye (Secale cereal) cover crop and no-cover treatments were mainly observed in common waterhemp (Amaranthus tuberculatus [Moq.]), with the cover crop treatment having lower numbers of waterhemp seeds in four of the five trials sampled.
Differences in seedbank composition were strongest at the trial level (p < 0.01) and were not statistically significant for cover crop treatment. In the trials with significant cover cropping effects, community changes were again driven mainly by a decrease in waterhemp (Figures 2, 3) which resulted in a slight shift toward a more grass-dominated community, but the effect was not strong. Community shifts were not consistently associated with an increase in the Shannon-Hill diversity index, species evenness, nor species richness (Table 4), but these results must be taken in context of the herbicide programs (Table 2).
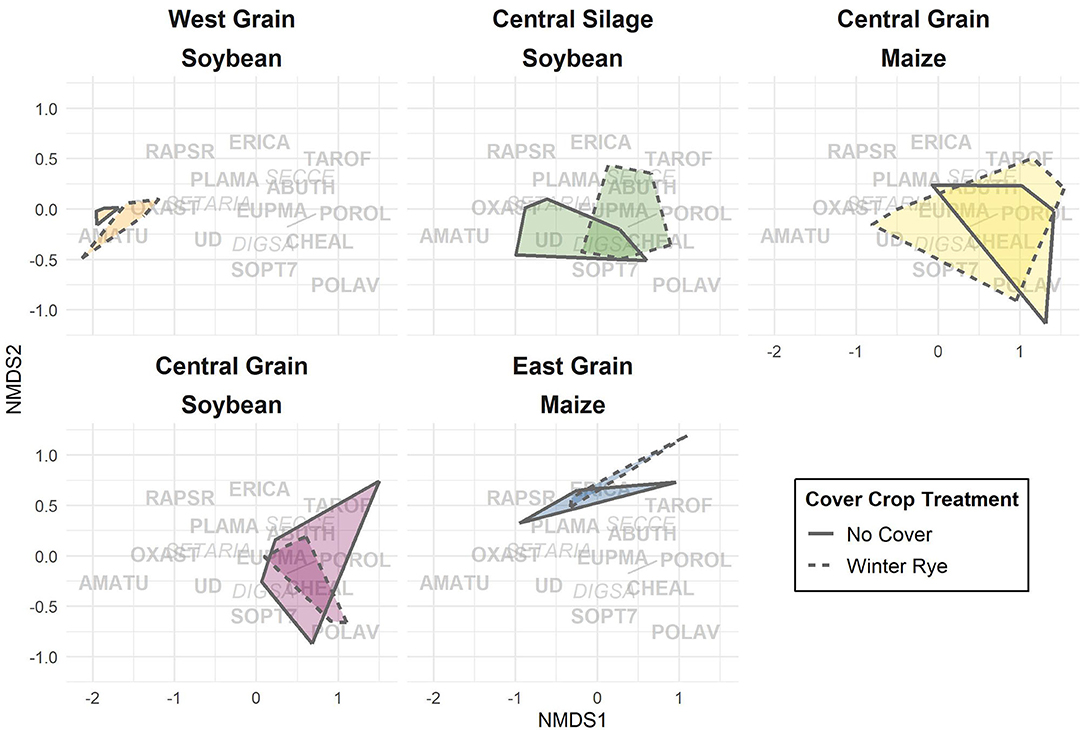
Figure 3. Non-metric multidimensional scaling (NMDS, stress = 0.102) applied to weed seedbank communities. Overlap of regions indicates degree of similarity between communities. Text represents Bayer weed codes (italics: monocots, bold: dicots; Table 3) and their NMDS component weightings. Trials are separated for ease of viewing.
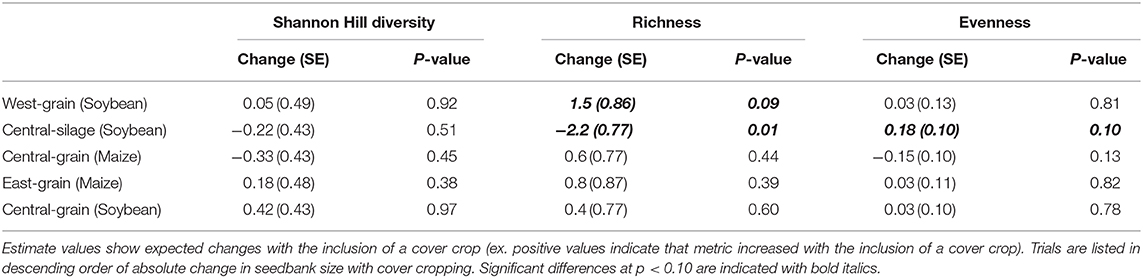
Table 4. Estimated changes, standard errors (SE), and p-values for models of changes in diversity, richness, and evenness for each trial.
Risk of Increasing Seedbanks
Results from the stochastic dominance analysis indicate that at low weed seedbank densities (<300 seeds m−2), cover cropping and control treatments did not differ, whereas at higher weed seedbank densities (>300 seeds m−2), cover cropping consistently exhibited lower densities than the no-cover treatments (Figure 4).
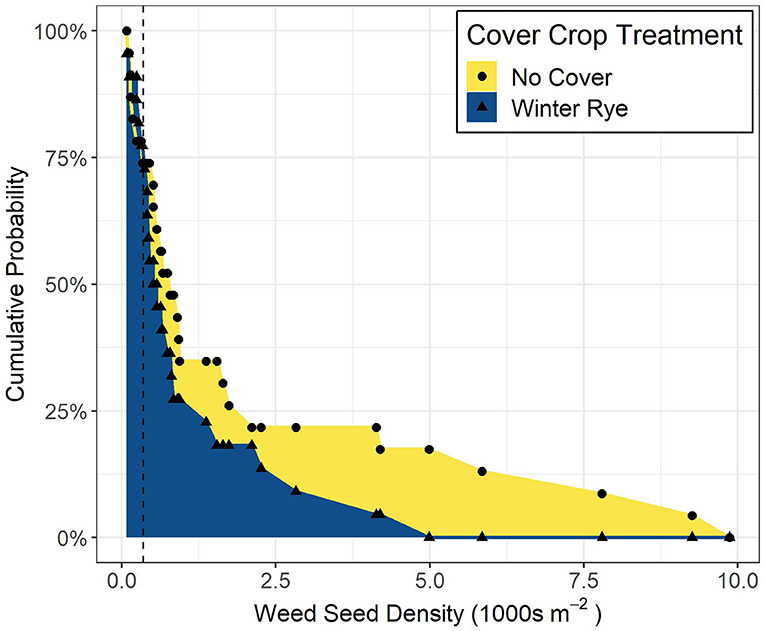
Figure 4. Each point represents the cumulative probability of having a weed seedbank of that density or higher; as seedbank densities increase above 300 seeds m−2 (dashed line), the probability of having a larger seedbank is higher for no-cover systems compared to cover-cropped systems; the area under the curve is proportional to the risk of increasing weed seedbank densities.
Discussion
Cover Crop Interactions With Waterhemp
As is the case in many midwestern maize and soybean fields, waterhemp was the driver weed species in the locations sampled in this study (van Wychen, 2017, 2019). Due to the dominance of waterhemp in the weed communities of this study, the herbicide programs implemented at each trial may have provided contexts where cover crop effects on weeds would vary. Waterhemp populations with resistance to seven herbicide groups have been identified (Tranel, 2020), with populations resistant to one or more are prevalent in the midwest (Patzoldt et al., 2005; Chatham et al., 2015; Oliveira et al., 2017). While we did not measure the presence of resistance genes, resistances to herbicide groups 5, 9, 14, and 27 were likely present (Owen, 2017) with possible resistances to group 15 (Hager, 2019). The varying levels of waterhemp control via herbicides and the use of residuals in the different trials may have rendered cover cropping more or less effective (Table 2). The West site, where the largest absolute reduction in waterhemp with the use of cover cropping was observed (Figure 1), did not utilize chemistries that would reliably kill resistant waterhemp plants that had already emerged, nor a residual herbicide to suppress future waterhemp emergence. Of the sites included in this study, the West site was therefore most susceptible to waterhemp living and setting seed, and therefore may have provided the biggest opportunities for cover cropping effects to manifest. The Central trials utilized hand-weeding in soybean phases late in the season, which may have reduced the opportunities for cover crops effects to be expressed. The East site, which had the lowest average seedbank densities observed in this study, utilized a herbicide program that would control resistant waterhemp biotypes and included residual herbicide that would also reduce/delay waterhemp emergence, perhaps leaving little room for cover cropping effects. While the previous crop of the individual trials may also play a role in dictating the weed responses to cover cropping, in the present study the previous crop is confounded with site effects, so it is difficult to draw conclusions from what may be spurious associations.
Regardless of the mechanisms involved, we believe our results regarding reductions in waterhemp seed densities are robust. Under no-till management and in the absence of new inputs to the seedbank, waterhemp seed densities can decline >99% after 5 years (Steckel et al., 2007). Our plots have been in place long enough (>10 years) for treatment effects to be detected despite possible legacy effects of the original seedbanks.
Cover Crop Mechanisms of Weed Suppression
Previous research indicates a cover crop's potential for in-season weed suppression is strongly related to the cover crop's biomass production (Baraibar et al., 2018; MacLaren et al., 2019; Nichols et al., 2020a; Smith et al., 2020). Cover crops might reduce weed seedbank densities via several mechanisms, all of which could conceivably be intensified with increases in the quantity of cover crop biomass produced. It is thus surprising that in the present study neither the absolute nor relative effects of cover cropping on the weed seedbank was related to any of the cover crop biomass production metrics we evaluated. For example, while the West trial consistently produced <1 Mg ha−1 of cover crop biomass, it exhibited the largest absolute decreases in weed seedbank size from cover cropping (Figure 1). Even considering the herbicide program, it is surprising such small amounts of cover crop biomass could have meaningful effects on the weed seedbank.
The pattern in the present study might also be related to the emergence timing of waterhemp, which can extend well-beyond the time the cover crop is killed while maintaining high reproductive success (Wu and Owen, 2014). In other studies, weed communities may not have been dominated by late germinating weed species such as waterhemp, and the communities might have therefore been more directly responsive to cover crop biomass.
It is also possible cover crops affected weeds in ways less directly dependent upon the amount of cover crop biomass produced. The act of planting the cover crop itself may have provided some weed control. Additionally, even modest amounts of biomass present over the winter may provide enough ground cover to promote seed mortality through granivore activity (Carmona and Landis, 1999; Heggenstaller et al., 2006), and in the spring cover crop mulch can provide habitat for seed-eating invertebrates (Pullaro et al., 2006). Allelopathic compounds from rye residue may catalyze pathogen attack on seeds and reduce the vigor of germinated seeds (Barnes and Putnam, 1983; Mohler et al., 2012), and production of these compounds may be more dependent upon growing conditions compared to rye biomass production per se (Mwaja et al., 1995). While our study did not test these effects directly, our data suggest these mechanisms should be considered when assessing the effects of cover cropping on weed communities.
We note that with endpoint sampling, as we did in the present study, it is difficult to link the cumulative effect of 10 years of biomass production with one season's weed seedbank. Sampling weed seedbanks yearly would enable a more direct connection to be drawn between cover crop biomass production and seedbank densities. However, our data show that in the contexts we sampled, the weed suppressive potential of cover crops in the long-term was not directly related to cover crop biomass production.
Cover Crop Effects on Weed Seed Communities
The lack of a consistent and significant effect of cover cropping on the structure of the weed seed communities in the present study is consistent with the findings of other studies (Moonen and Bàrberi, 2004; Smith et al., 2015; Alonso-Ayuso et al., 2018). It is unsurprising that an over-wintering cover crop would be a weak filter in systems dominated by summer annuals that are well-adapted for regeneration in maize-soybean rotations (Tranel, 2020). In systems with more diverse cropping systems or seedbanks, cover crops might create more marked shifts in weed communities.
While the germination method may have failed to identify or underestimated weed species resulting in an underestimation of weed species richness, the number of weed species found in each plot (ranging from 1 to 8) matches field-based observations of maize-soybean rotations (Hirsh et al., 2013). Additionally, the dominance of common waterhemp rendered the Shannon Hill diversity and evenness metrics insensitive to small contributions by other species. Accordingly, our results may be due to the already-simplified nature of the communities, where random variation easily obscures subtle signals in the less prevalent species.
Conclusions
Our study is the first we are aware of that quantifies the long-term impacts of cover cropping on weeds in the midwestern United States. We found evidence that cover cropping can meaningfully reduce the size of the weed seedbank compared to a no-cover control in certain contexts. More research in long-term plots comparing cover crop effects in various cropping systems and management regimes is needed to identify conditions in which cover crops are most effective at reducing and/or preventing weed seed deposits. Endpoint sampling, used in our study, is useful in assessing whether systems merit more attention, but longitudinal samplings of weed seedbanks in long-term studies are needed to better assess the seedbank trajectories of these systems.
Changes in seedbanks were driven by change in densities of common waterhemp, a weed resistant to multiple herbicide modes of actions. We found that when weed seed densities are above 300 seeds m−2, cover cropping exhibits no risk of enlarging weed seedbanks compared to no-cover systems.
In the production contexts examined, the amount of cover crop biomass produced was not associated with the magnitude of cover crop effects on weed seedbanks. The lack of relationship suggests cover crop biomass may not be the best metric for predicting long-term impacts of cover-cropping on weeds in all systems, particularly those dominated by late-germinating species such as waterhemp. Cover crops may suppress weeds through a combination of mechanisms, and the relative contribution likely varies by site and/or year. Parsing out these effects could aid in the design of systems better able to take advantage of cover crop weed suppression.
Data Availability Statement
The datasets presented in this study can be found in csv format in on online repository accessed via https://doi.org/10.25380/iastate.12762011.v1 and as an R package at https://github.com/vanichols/PFIweeds2020.
Author Contributions
VN, ML, and SC designed the study. SG and SC contributed data and project management. VN facilitated data collection and wrote the original draft of the manuscript. VN, ML, and LE analyzed the data. All authors contributed to editing of the final manuscript. All authors contributed to the article and approved the submitted version.
Funding
This material is based upon work supported by the National Science Foundation (Grant No. DGE-1828942), the North Central Region Sustainable Research and Education Program (Grant No. 2017-38640-26916), and endowment funds for the Henry A. Wallace Chair for Sustainable Agriculture at Iowa State University.
Conflict of Interest
The authors declare that the research was conducted in the absence of any commercial or financial relationships that could be construed as a potential conflict of interest.
Acknowledgments
We are grateful to the Iowa Learning Farms, Practical Farmers of Iowa, and Keith Kohler with the USDA-ARS for coordinating research plots. We would like to sincerely thank Katherine Goode for her patience and statistical advice, Wyatt Westfall, Mickala Stallman, Elizabeth Oys, Patrick Galland, and David DeLaney for watering and identifying weed seedlings, and of course the producers who graciously accommodated our sampling efforts during the busy planting season. Lastly we thank the three reviewers for their insightful comments that greatly improved this manuscript.
Supplementary Material
The Supplementary Material for this article can be found online at: https://www.frontiersin.org/articles/10.3389/fagro.2020.591091/full#supplementary-material
References
Abendroth, L., Elmore, R., Boyer, M., and Marlay, S. (2011). Corn Growth and Development. Available online at: https://www.researchgate.net/profile/Lori_Abendroth/publication/280092215_In_Corn_Growth_and_Development/links/5a984384a6fdccecff0d2320/In-Corn-Growth-and-Development.pdf (accessed July 20, 2020).
Adeux, G., Vieren, E., Carlesi, S., Bàrberi, P., Munier-Jolain, N., and Cordeau, S. (2019). Mitigating crop yield losses through weed diversity. Nat. Sustain. 211, 1018–1026. doi: 10.1038/s41893-019-0415-y
Alonso-Ayuso, M., Gabriel, J. L., García-González, I., Del Monte, J. P., and Quemada, M. (2018). Weed density and diversity in a long-term cover crop experiment background. Crop Prot. 112, 103–111. doi: 10.1016/j.cropro.2018.04.012
Arbuckle, J. G., and Lasley, P. (2013). Iowa Farm and Rural Life Poll: 2013, Summary Report. Ames, IA: Iowa State University Extension and Outreach.
Baraibar, B., Mortensen, D. A., Hunter, M. C., Barbercheck, M. E., Kaye, J. P., Finney, D. M., et al. (2018). Growing degree days and cover crop type explain weed biomass in winter cover crops. Agron. Sustain. Dev. 38:65. doi: 10.1007/s13593-018-0543-1
Barnes, J. P., and Putnam, A. R. (1983). Rye residues contribute weed suppression in no-tillage cropping systems. J. Chem. Ecol. 9, 1045–1057. doi: 10.1007/BF00982210
Basche, A. D., Archontoulis, S. V., Kaspar, T. C., Jaynes, D. B., Parkin, T. B., and Miguez, F. E. (2016a). Simulating long-term impacts of cover crops and climate change on crop production and environmental outcomes in the Midwestern United States. Agric. Ecosyst. Environ. 218, 95–106. doi: 10.1016/j.agee.2015.11.011
Basche, A. D., Kaspar, T. C., Archontoulis, S. V., Jaynes, D. B., Sauer, T. J., Parkin, T. B., et al. (2016b). Soil water improvements with the long-term use of a winter rye cover crop. Agric. Water Manag. 172, 40–50. doi: 10.1016/j.agwat.2016.04.006
Bates, D., Mächler, M., Bolker, B., and Walker, S. (2015). Fitting linear mixed-effects models using lme4. J. Stat. Softw. 67, 1–48. doi: 10.18637/jss.v067.i01
Becker, R. A., Wilks, A. R., Brownrigg, R., Minka, T. P., and Deckmyn, A. (2018). maps: Draw Geographical Maps. Available online at: https://rdrr.io/cran/maps/man/map.html (accessed October 2020).
Bunchek, J. M., Wallace, J. M., Curran, W. S., Mortensen, D. A., vanGessel, M. J., and Scott, B. A. (2020). Alternative performance targets for integrating cover crops as a proactive herbicide-resistance management tool. Weed Sci. 68, 534–544. doi: 10.1017/wsc.2020.49
Carmona, D. M., and Landis, D. A. (1999). Influence of refuge habitats and cover crops on seasonal activity-density of ground beetles (Coleoptera: Carabidae) in field crops. Environ. Entomol. 28, 1145–1153. doi: 10.1093/ee/28.6.1145
Chatham, L. A., Bradley, K. W., Kruger, G. R., Martin, J. R., Owen, M. D. K., Peterson, D. E., et al. (2015). A multistate study of the association between glyphosate resistance and EPSPS gene amplification in waterhemp (Amaranthus tuberculatus). Weed Sci. 63, 569–577. doi: 10.1614/WS-D-14-00149.1
Cholette, T. B., Soltani, N., Hooker, D. C., Robinson, D. E., and Sikkema, P. H. (2018). Suppression of glyphosate-resistant Canada fleabane (Conyza canadensis) in corn with cover crops seeded after wheat harvest the previous year. Weed Technol. 32, 244–250. doi: 10.1017/wet.2018.19
Davis, A. S. (2006). When does it make sense to target the weed seed bank? Weed Sci. 54, 558–565. doi: 10.1614/WS-05-058R.1
Dessaint, F., Barralis, G., Caixinhas, M. L., Mayor, J. P., Recasens, J., and Zanin, G. (1996). Precision of soil seedbank sampling: how many soil cores? Weed Res. 36, 143–151. doi: 10.1111/j.1365-3180.1996.tb01810.x
Dold, C., Sauer, T. J., Hatfield, J. L., Prueger, J. H., and Wacha, K. M. (2017). “Changes in soil carbon in a continuous corn-soybean rotation in the Midwest, 2005–2016,” in Proceedings of ASA-CSSA-SSSA Annual Meeting (Tampa, FL).
Felix, J., and Owen, M. D. K. (2001). Weed seedbank dynamics in post conservation reserve program land. Weed Sci. 49, 780–787. doi: 10.1614/0043-1745(2001)0490780:WSDIPC2.0.CO;2
Food and Agriculture Organization of the United Nations. FAOSTAT Statistical Database. Rome: FAO (2020).
Forcella, F., Webster, T.M., and Cardina, J. (2003). “Protocols for weed seedbank determination in agroecosystems,” in Addendum to Weed Management for Developing Countries, Vol. 120, ed R. Labrada (Rome: FAO), 3–18.
Forcella, F., Wilson, R. G., Renner, K. A., Dekker, J., Harvey, R. G., Alm, D. A., et al. (1992). Weed seedbanks of the U.S. Corn Belt: magnitude, variation, emergence, and application. Weed Sci. 40, 636–644. doi: 10.1017/S0043174500058240
Goplen, J. J., Coulter, J. A., Sheaffer, C. C., Becker, R. L., Breitenbach, F. R., Behnken, L. M., et al. (2018). Economic performance of crop rotations in the presence of herbicide-resistant giant ragweed. Agron. J. 110, 260–268. doi: 10.2134/agronj2016.09.0536
Gross, K. L. (1990). A comparison of methods for estimating seed numbers in the soil. J. Ecol. 78, 1079–1093. doi: 10.2307/2260953
Hager, A. (2019) Waterhemp Resistance to Group 15 Herbicides. Department of Crop Sciences, University of Illinois at Urbana-Champaign. Available online at: https://farmdoc.illinois.edu/field-crop-production/weeds/waterhemp-resistance-to-group-15-herbicides.html (accessed October 2020).
Harrison, X. A. (2014). Using observation-level random effects to model overdispersion in count data in ecology and evolution. PeerJ 2:e616. doi: 10.7717/peerj.616
Heggenstaller, A. H., Menalled, F. D., Liebman, M., and Westerman, P. R. (2006). Seasonal patterns in post-dispersal seed predation of Abutilon theophrasti and Setaria faberi in three cropping systems. J. Appl. Ecol. 43, 999–1010. doi: 10.1111/j.1365-2664.2006.01198.x
Hirsh, S. M., Mabry, C. M., Schulte, L. A., and Liebman, M. (2013). Diversifying agricultural catchments by incorporating tallgrass prairie buffer strips. Ecol. Restor. 31, 201–211. doi: 10.3368/er.31.2.201
Jones, C. S., Nielsen, J. K., Schilling, K. E., and Weber, L. J. (2018). Iowa stream nitrate and the Gulf of Mexico. PLoS ONE 13:e0195930. doi: 10.1371/journal.pone.0195930
Kaspar, T., and Singer, J. (2011). The Use of Cover Crops to Manage Soil. Lincoln, NE: University of Nebraska - Lincoln. doi: 10.2136/2011.soilmanagement.c21
Kaspar, T. C., Jaynes, D. B., Parkin, T. B., and Moorman, T. B. (2007). Rye cover crop and gamagrass strip effects on NO3 concentration and load in tile drainage. J. Environ. Qual. 36, 1503–1511. doi: 10.2134/jeq2006.0468
Kaspar, T. C., Jaynes, D. B., Parkin, T. B., Moorman, T. B., and Singer, J. W. (2012). Effectiveness of oat and rye cover crops in reducing nitrate losses in drainage water. Agric. Water Manag. 110, 25–33. doi: 10.1016/j.agwat.2012.03.010
Lenth, R., Singmann, H., and Love, J. (2018). Emmeans: Estimated Maringal means, Aka Least-Squares Means. Available online at: https://rdrr.io/cran/emmeans/ (accessed October 2020).
Levy, H. (1992). Stochastic dominance and expected utility: survey and analysis. Manage. Sci. 38, 555–593. doi: 10.1287/mnsc.38.4.555
MacLaren, C., Storkey, J., Menegat, A., Metcalfe, H., and Dehnen-Schmutz, K. (2020). An ecological future for weed science to sustain crop production and the environment. A review. Agron. Sustain. Dev. 40:24. doi: 10.1007/s13593-020-00631-6
MacLaren, C., Swanepoel, P., Bennett, J., Wright, J., and Dehnen-Schmutz, K. (2019). Cover crop biomass production is more important than diversity for weed suppression. Crop Sci. 59, 733–748. doi: 10.2135/cropsci2018.05.0329
McCulloch, C. E., and Neuhaus, J. M. (2005). Generalized Linear Mixed Models. Encyclopedia of Biostatistics. Chichester, UK: John Wiley & Sons, Ltd. doi: 10.1002/0470011815.b2a10021
Mirsky, S. B., Gallandt, E. R., Mortensen, D. A., Curran, W. S., and Shumway, D. L. (2010). Reducing the germinable weed seedbank with soil disturbance and cover crops. Weed Res. 50, 341–352. doi: 10.1111/j.1365-3180.2010.00792.x
Mohler, C. L. (1993). A model of the effects of tillage on emergence of weed seedlings. Ecol. Appl. 3, 53–73. doi: 10.2307/1941792
Mohler, C. L., Dykeman, C., Nelson, E. B., and Ditommaso, A. (2012). Reduction in weed seedling emergence by pathogens following the incorporation of green crop residue. Weed Res. 52, 467–477. doi: 10.1111/j.1365-3180.2012.00940.x
Moonen, A. C., and Bàrberi, P. (2004). Size and composition of the weed seedbank after 7 years of different cover-crop-maize management systems. Weed Res. 44, 163–177. doi: 10.1111/j.1365-3180.2004.00388.x
Moore, E. B., Wiedenhoeft, M. H., Kaspar, T. C., and Cambardella, C. A. (2014). Rye cover crop effects on soil quality in no-till corn silage-soybean cropping systems. Soil Sci. Soc. Am. J. 78, 968–976. doi: 10.2136/sssaj2013.09.0401
Mwaja, V. N., Masiunas, J. B., and Weston, L. A. (1995). Effects of fertility on biomass, phytotoxicity, and allelochemical content of cereal rye. J. Chem. Ecol. 21, 81–96. doi: 10.1007/BF02033664
Nearing, M. A., Xie, Y., Liu, B., and Ye, Y. (2017). Natural and anthropogenic rates of soil erosion. Int. Soil Water Conserv. Res. 5, 77–84. doi: 10.1016/j.iswcr.2017.04.001
Nichols, V., English, L. E., and Liebman, M. (2020b). Long Term Cover Cropping Effects on Weed Seedbanks [Dataset]. Iowa State University. doi: 10.25380/iastate.12762011.v1
Nichols, V., Martinez-Feria, R., Weisberger, D., Carlson, S., Basso, B., and Basche, A. (2020a). Cover crops and weed suppression in the U.S. Midwest: a meta-analysis and modeling study. Agric. Environ. Lett. 5:e20022. doi: 10.1002/ael2.20022
Oksanen, J., Blanchet, F. G., Friendly, M., Kindt, R., Legendre, P., McGline, D., et al. (2019). vegan: Community Ecology Package. Available online at: https://cran.r-project.org/package=vegan (accessed October 2020).
Oliveira, M. C., Jhala, A. J., Gaines, T., Irmak, S., Amundsen, K., Scott, J. E., et al. (2017). Confirmation and control of HPPD-inhibiting herbicide–resistant waterhemp (Amaranthus tuberculatus) in Nebraska. Weed Tech. 31, 67–79. doi: 10.1017/wet.2016.4
O'Neal, M. R., Nearing, M. A., Vining, R. C., Southworth, J., and Pfeifer, R. A. (2005). Climate change impacts on soil erosion in Midwest United States with changes in crop management. Catena 61, 165–184. doi: 10.1016/j.catena.2005.03.003
Owen, M. D. (2017). “Weed management update for 2018 and beyond: the more things change,” in Proceedings of the 29th Annual Integrated Crop Management Conference (Ames, IA: Iowa State University). doi: 10.31274/icm-180809-242
Patzoldt, W. L., Tranel, P. J., and Hager, A. G. (2005). A waterhemp (Amaranthus tuberculatus) biotype with multiple resistance across three herbicide sites of action. Weed Sci. 53, 30–36. doi: 10.1614/WS-04-087R
Poos, M. S., Jackson, D. A. (2012). Addressing the removal of rare species in multivariate bioassessments: the impact of methodological choices. Ecol. Ind. 18, 82–90. doi: 10.1016/j.ecolind.2011.10.008
Prentice, I. C. (1977). Non-metric ordination methods in ecology. J. Ecol. 85–94. doi: 10.2307/2259064
Price, A. J., Balkcom, K. S., Culpepper, S. A., Kelton, J. A., Nichols, R. L., and Schomberg, H. (2011). Glyphosate-resistant Palmer amaranth: a threat to conservation tillage. J. Soil Water Conserv. 66, 265–275. doi: 10.2489/jswc.66.4.265
Pullaro, T. C., Marino, P. C., Jackson, D. M., Harrison, H. F., and Keinath, A. P. (2006). Effects of killed cover crop mulch on weeds, weed seeds, and herbivores. Agric. Ecosyst. Environ. 115, 97–104. doi: 10.1016/j.agee.2005.12.021
R Core Team (2016). R: A Language and environment for statistical computing, Vienna, Austria. Available online at: https://www.R-project.org/ (accessed October 2020).
Reinhardt, T., and Leon, R. G. (2018). Extractable and germinable seedbank methods provide different quantifications of weed communities. Weed Sci. 66, 715–720. doi: 10.1017/wsc.2018.56
Ryan, M. R., Smith, R. G., Mirsky, S. B., Mortensen, D. A., and Seidel, R. (2010). Management filters and species traits: weed community assembly in long-term organic and conventional systems. Weed Sci. 58, 265–277. doi: 10.1614/WS-D-09-00054.1
Schwartz, L. M., Norsworthy, J. K., Young, B. G., Bradley, K. W., Kruger, G. R., Davis, V. M., et al. (2016). Tall waterhemp (Amaranthus tuberculatus) and Palmer amaranth (Amaranthus palmeri) seed production and retention at soybean maturity. Weed Technol. 30, 284–290. doi: 10.1614/WT-D-15-00130.1
Smith, R. G., Atwood, L. W., Pollnac, F. W., and Warren, N. D. (2015). Cover-crop species as distinct biotic filters in weed community assembly. Weed Sci. 63, 282–295. doi: 10.1614/WS-D-14-00071.1
Smith, R. G., Warren, N. D., and Cordeau, S. (2020). Are cover crop mixtures better at suppressing weeds than cover crop monocultures? Weed Sci. 68, 186–194. doi: 10.1017/wsc.2020.12
Steckel, L. E., Sprague, C. L., Stoller, E. W., Wax, L. M., and Simmons, F. W. (2007). Tillage, cropping system, and soil depth effects on common waterhemp (Amaranthus rudis) seed-bank persistence. Weed Sci. 55, 235–239. doi: 10.1614/WS-06-198
Storkey, J., and Neve, P. (2018). What good is weed diversity? Weed Res. 58, 239–243. doi: 10.1111/wre.12310
Strock, J. S., Porter, P. M., and Russelle, M. P. (2004). Cover cropping to reduce nitrate loss through subsurface drainage in the northern US Corn Belt. J. Environ. Qual. 33, 1010–1016. doi: 10.2134/jeq2004.1010
Teasdale, J. R., Mirsky, S. B., and Cavigelli, M. A. (2018). Meteorological and management factors influencing weed abundance during 18 years of organic crop rotations. Weed Sci. 66, 477–484. doi: 10.1017/wsc.2018.15
USDA. (2020a). National Agricultural Statistics Service Cropland Data Layer. Published crop-specific data layer [Online]. Washington, DC: USDA-NASS. Available online at: https://nassgeodata.gmu.edu/CropScape/ (accessed September 2020).
USDA. (2020b). National Agricultural Statistics Service. NASS - Quick Stats. USDA National Agricultural Statistics Service. Washington, DC: USAD-NASS. (accessed September 2020).
van Wychen, L. (2017) Survey of the most common and troublesome weeds in grass crops, pasture and turf in the United States and Canada. Weed Science Society of America National Weed Survey Dataset. Available online at: http://wssa.net/wp-content/uploads/2017-Weed-Survey_Grass-crops.xlsx (accessed October 2020).
van Wychen, L. (2019). WSSA Survey Ranks Most Common and Most Troublesome Weeds in Broadleaf Crops, Fruits and Vegetables. Available online at: http://wssa.net/wp-content/uploads/2019-Weed-Survey_broadleaf-crops.xlsx (accessed October 2020).
Wallace, J. M., Curran, W. S., and Mortensen, D. A. (2019). Cover crop effects on horseweed (Erigeron canadensis) density and size inequality at the time of herbicide exposure. Weed Sci. 67, 327–338. doi: 10.1017/wsc.2019.3
Wickham, H., Averick, M., Bryan, J., Chang, W., McGowan, L., Francois, R., et al. (2019). Welcome to the Tidyverse. J. Open Source Softw. 4:1686. doi: 10.21105/joss.01686
Wickham, H., and Bryan, J. (2018). readxl: Read Excel Files. Available online at: https://cran.r-project.org/package=readxl (accessed October 2020).
Wilke, C. (2019). cowplot: Streamlined Plot Theme and Plot Annotations for “ggplot2”. Available online at: https://rdrr.io/github/wilkelab/cowplot/man/cowplot.html (accessed October 2020).
Keywords: maize (Zea mays L.), cover crop, sustainable weed management, corn belt, waterhemp [Amaranthus tuberculatus (Moq.) J. D. Sauer], germinable seed bank
Citation: Nichols V, English L, Carlson S, Gailans S and Liebman M (2020) Effects of Long-Term Cover Cropping on Weed Seedbanks. Front. Agron. 2:591091. doi: 10.3389/fagro.2020.591091
Received: 03 August 2020; Accepted: 19 October 2020;
Published: 23 November 2020.
Edited by:
Lauren M. Lazaro, Louisiana State University Agricultural Center, United StatesReviewed by:
Mandy Bish, University of Missouri, United StatesJohn Wallace, Pennsylvania State University (PSU), United States
Rodrigo Werle, University of Wisconsin-Madison, United States
Copyright © 2020 Nichols, English, Carlson, Gailans and Liebman. This is an open-access article distributed under the terms of the Creative Commons Attribution License (CC BY). The use, distribution or reproduction in other forums is permitted, provided the original author(s) and the copyright owner(s) are credited and that the original publication in this journal is cited, in accordance with accepted academic practice. No use, distribution or reproduction is permitted which does not comply with these terms.
*Correspondence: Virginia Nichols, dm5pY2hvbHNAaWFzdGF0ZS5lZHU=