 Guillaume Adeux†
 Maé Guinet
 Nicolas Munier-Jolain
 Stéphane Cordeau
- Agroécologie, INRAE, Institut Agro, Univ. Bourgogne, Univ. Bourgogne Franche-Comté, Dijon, France
Conservation agriculture (CA) relies on three fundamental and inseparable pillars: no soil disturbance, diversified crop rotations, and permanent soil cover. Nevertheless, few studies have evaluated the interactive effect of these three fundamental pillars on a multicriteria basis. Here, we mobilize data from the French AGROSYST database, which gathers all farming practices and performances of the 3000 farms involved in the French DEPHY farmers’ network. Linear mixed effect models were used to compare the performance (13 indicators) of CA (CAs, N=36) and pseudo-CA systems (pseudo-CAs, N=19, allowing one occasional superficial tillage) to conventional tillage (plowed, CTs, N=135) and superficial tillage (STs, N=90) based systems in similar production situations (climate, soil type, presence of livestock or irrigation, etc.). CAs required (compared to STs and CTs, respectively) more herbicides (+27 and +90%) but slightly less insecticides (-64 and -50%, non-significant), decreased time of traction/ha/year (-25 and -32%), fuel consumption (-21 and -39%), as well as mechanization costs (-20 and -26%), tended to slightly decrease profitability/ha (-7 and -19%, non-significant) due to slightly lower productivity (-19% and -25%) but resulted in better profitability per hour of field traction (+23% and +18%). Pseudo-CAs did not implement the three CA principles since crop rotation were as diverse and cover crop as frequent as in STs and CTs, and tillage occurred, albeit rarely. However, pseudo-CAs used less insecticides (-92 and -83% compared to STs and CTs, respectively), decreased fuel consumption (-25% compared to CTs), and resulted in similar productivity and economic profitability (per hectare and per hour of field traction). Further investigation is required to identify the diversity of responses across production situations, the determinants of multi-performance in given production situations, and to track down the rare innovative systems optimizing multiple performances and solving apparent trade-offs.
1 Introduction
Agriculture must meet the challenges of producing in quantity and quality, without harmful effects on the environment and human health, while providing suitable revenues for farmers. Agroecological systems aim to reach these objectives through the enhanced mobilization of biological and ecological processes that contribute to crop production (Gliessman et al., 1998; Wezel et al., 2009). Among these agroecological systems, conservation agriculture (CA) places strong emphasis on no-till, permanent soil cover, and diversified crop rotations. The simultaneous implantation of these three pillars of CA contributes to the delivery of multiple ecosystem services (Hobbs et al., 2008; Chabert and Sarthou, 2020). Initiated in the United States in the 1950s, in Europe in the 1960s, then in Latin America in the 1970s (Derpsch, 1998), soil conservation techniques rapidly evolved towards CA with the development of direct seed drills and non-selective, effective and cheap foliar herbicides (aminotriazole, paraquat, glyphosate and glufosinate). Decades after its development by pioneer farmers, CA acreage is increasing exponentially worldwide (Kassam et al., 2019), although very few studies have assessed its performances on a multicriteria basis, including environmental, economic and societal aspects (Craheix et al., 2016). According to Kassam et al. (2019), the adoption of CA has increased because farmers are seeking for a new paradigm to sustainably intensify crop production. They also report that the major drivers which explain the adoption of CA continue to be “the need to increase input factor productivity, yield and total farm output, improved sustainability of production and farm land, better incomes, timeliness of cropping practices, ease of farming and reduction in drudgery, and improved ecosystem services such as clean water, control of erosion and land degradation, carbon sequestration, cleaner atmosphere and the rehabilitation of degraded agricultural lands”. Although some ecosystem services are targeted by farmers adopting CA, they remain to be assessed and quantified. Our systematic review of the scientific literature revealed the existence of 9 meta-analyses where CA systems (i.e. implementing simultaneously the three pillars) were compared to reference systems – the latter being different according to studies. These meta-analyses concerned yield (Rusinamhodzi, 2015; Corbeels et al., 2020; Jat et al., 2020; Reich et al., 2021), water use efficiency (Jat et al., 2020), economic sustainability (Jat et al., 2020; Reich et al., 2021), food security (Reich et al., 2021), carbon sequestration (Powlson et al., 2016; Mondal et al., 2020; Dong et al., 2021; Nicoloso and Rice, 2021; Reich et al., 2021), greenhouse gas emission (Zhao et al., 2016; Jat et al., 2020) and soil quality and fertility (Mondal et al., 2020; Nicoloso and Rice, 2021; Reich et al., 2021). They highlight that the effects of CA systems on crop productivity and soil health (carbon sequestration, soil quality, soil structure, soil biological activity) were extensively studied at the expense of other dimensions of cropping system sustainability.
CA systems combine a diverse set of farming practices, which may evolve as the system matures (Derrouch et al., 2020). Stopping tillage (both primary and secondary tillage operations, such as plowing, stubble cultivation, false seed bed practices, mechanical weeding, etc.) reduces traction time and fuel consumption (West and Marland, 2002; Kertész and Madarász, 2014). However, not all crops are suitable for direct seeding (e.g. industrial crops such as sugar beet or potato), still requiring shallow tillage for their establishment (e.g. ridging), and their abandonment may have severe economic consequences for farmers. Moreover, the implementation of the three pillars of CA and in particular stopping tillage can have negative consequences on crop productivity (Pittelkow et al., 2015), at least in the short term, when cash crop sowing dates/rates, fertilization, and herbicides are not optimized for untilled soil conditions (El-Gizawy, 2009). Nevertheless, the relative performance of CA systems, compared to tillage-based systems, could vary across production situations as studies have also reported positive effects on crop productivity (Scopel et al., 2013; Jat et al., 2020).
In addition, CA systems also face problems in managing weeds (Derrouch et al., 2020), which are no longer regulated by tillage. The set of non-chemical weed management tools is more limited in CA than in tillage-based systems and this is usually reflected by an increase in herbicide use after adoption of CA (Adeux et al., 2019; Derrouch et al., 2020). No-till is expected to reduce weed abundance because weed seeds are maintained on the soil surface, a condition deemed unfavorable to weed seed germination, but this appears to be true only for a restricted set of species (Cordeau et al., 2015). On the other hand, cover crops can suppress weeds through enhanced competition (Osipitan et al., 2019; Smith et al., 2020) and crop diversification can reduce weed abundance through a diversification of selection pressures (Weisberger et al., 2019). CA farmers often claim a decrease in insecticide use in CA, which they explain by the diversity of crops in the rotation and the use of companion plants to limit insect damages (Cadoux et al., 2015). They also report a decrease in fungicide use, which could be explained by the presence of mulch on the soil surface. According to Mulumba and Lal (2008), mulch increases soil water capacity by 18-35% and soil moisture retention from 29 to 70%, conditions deemed to enhance growth and spore germination of fungi. However, mulch also prevents soil particles from being splashed on the crop when rainfall occurs (McCalla and Army, 1961), and hence limits the splash dispersal of inoculum responsible for initial contamination (Teasdale et al., 2002).
Numerous studies have quantified the effect of one of the three pillars of CA, e.g. on soil properties (Blanco-Canqui and Wortmann, 2020), carbon sequestration (Powlson et al., 2014), greenhouse gas emissions (Rochette, 2008), belowground diversity and activity (Rincon-Florez et al., 2016) or crop productivity (Pittelkow et al., 2015; Jat et al., 2020). Some studies assessed cropping systems when conservation-agriculture component practices were implemented either separately or in tandem (Craheix et al., 2016; Jat et al., 2020). However, very few studies have evaluated, on a multi-criteria basis, CA systems implementing simultaneously the three fundamental pillars, (Craheix et al., 2016; Chabert and Sarthou, 2020; Jat et al., 2020) when they are combined into a true CA system (Reicosky, 2015; FAO, 2021). A study using the MASC multi-criteria evaluation tool showed that reducing tillage tended to reduce overall cropping system performance, unless it was combined with crop diversification (Craheix et al., 2016). Such results demonstrate that CA must be seen, studied and quantified as a system that jointly and simultaneously implements the three pillars (Reicosky, 2015). A recent study compared direct seeding systems (CA) to conventional- and reduced-tillage systems and concluded that, despite a high variability in the expression of ecosystem services, provisioning of ecosystem services remained high in CA and that time since conversion drove the delivery of many services (Chabert and Sarthou, 2020). Time since conversion drove performances because farmers take time before finding their own locally adapted combination of practices within the framework of CA and its three pillars (Derrouch et al., 2020). For instance, time is needed to adapt the crop rotation (cash crops, companion crops, cover crops, intercropping, relay-cropping, etc.) and to strictly stop tillage, which may result in occasional shallow tillage operations. In addition, it is not excluded that CA farmers may face high pest pressures such as slugs (Scaccini et al., 2020), voles (Ruscoe et al., 2022) and/or weeds (Derrouch et al., 2021), forcing them to contain these issues with occasional shallow tillage operations, hereafter called pseudo-CA. Therefore, the performances of CA and pseudo-CA systems, relative to reference systems which rely on conventional (i.e. plowing) or superficial tillage in the same production context and from a multi-criteria perspective, remains unclear.
The objective of this study is to assess the economic and environmental performances of CA and pseudo-CA systems, using data from the French DEPHY farm network, a network set up in the early 2010s and made up of 3000 volunteer farmers motivated about pesticide reduction (Lechenet et al., 2016; Lechenet et al., 2017b), albeit without negatively impacting their income. Based on detailed descriptions of the farmers’ cropping systems, we identified 36 CA and 19 pseudo-CA systems (named hereafter CAs and pseudo-CAs, respectively) and assessed their multiperformance (13 indicators). They were compared to conventional- and superficial tillage-based systems (named hereafter CTs and STs, respectively) located in the same production situation (defined by similar climate, soil type characteristics and the presence of livestock or irrigation).
2 Material and methods
2.1 The DEPHY network and available data
The DEPHY farm network was set up as part of the ECOPHYTO national action plan in 2010. Two years later, the network gathered 1900 farms and a new extension phase in 2016 allowed to reach a total of 3000 farms, with over half represented by arable crops or arable crops and livestock. The network is made up of volunteer farmers who are motivated in reducing pesticide use, albeit without negative financial consequences. The network is structured in groups of 10 to 15 farms, geographically close to each other, and led by a crop advisor whom assists farmers in redesigning their pest management strategies. The farming practices are monitored and gathered in the AGROSYST database (Ancelet et al., 2014), and include crop rotation and detailed practices implemented in each crop. The description of farming practices is done either at the plot level with multiple plots per combination of cropping system and farm, or in a more synthetic way. For the latter, the description of the crop rotation and management practices associated to each of its component represents an average of several plots (for a given year or across multiple years), obtained by farmers’ questionnaires. Such descriptions are hence supposed to incorporate temporal and spatial variability of farming practices.
For this work, both data sources were used (i.e. plot and synthetic descriptions) to characterize cropping systems (see details in Supplementary Tables S1, S2), and compute multiple indicators of performance at the cropping system level, hence considering all the plots of the cropping system whatever the data source – plot or synthetic description – therefore avoiding any bias due to the data source in the computed indicators. The computation of the indicators was done over a three-year period to smoothen potential inter-annual variability due to climatic conditions. In rare cases, a cropping system was described with data collected a given year, but multiple fields were described to ensure the description of the whole cropping system (i.e. 6 fields a given year to describe a 6-year rotation). Moreover, CAs and pseudo-CAs were compared with their reference CTs and STs (see section 2.3) over the same time frame (to the best of our ability, see details in Supplementary Tables S1, S2, and at the end of section 2.3), because annual weather conditions influence both pest pressure and crop productivity.
2.2 Identification of CA and pseudo-CA systems
Preliminary analysis of tillage practices identified 36 strict no-till cropping systems (CAs), i.e. without any tillage intervention in three successive years on all corresponding plots, and 19 cropping systems with no deep tillage intervention and maximum one shallow tillage (i.e. <10cm depth) intervention per plot (or set of plots for the synthetic description) per year across the three-year period (pseudo-CAs). Rolling interventions (regardless of the type of roller) were not considered as tillage interventions. When cropping systems were described over periods longer than 3 years and no change in tillage strategy was identified, only the three most recent years were retained for analysis, in order to maximize the chances of characterizing systems that passed the initial transition phase, during which practices are known not to be optimal (Derrouch et al., 2020).
The CAs identified were mainly located in the regions Poitou-Charentes, Centre, Bourgogne Franche-Comté and Lorraine, i.e. regions with mainly shallow calcareous-clay soils and limited yield potential (Schauberger et al., 2018; Schils et al., 2018), and a few systems in the deeper soils of the Paris basin, Normandy and the South-West (Figure 1). Pseudo-CAs were in the same regions, with the addition of three systems in the South East of France. These systems were located in the major arable regions of France where CA is practiced (Laurent, 2015).
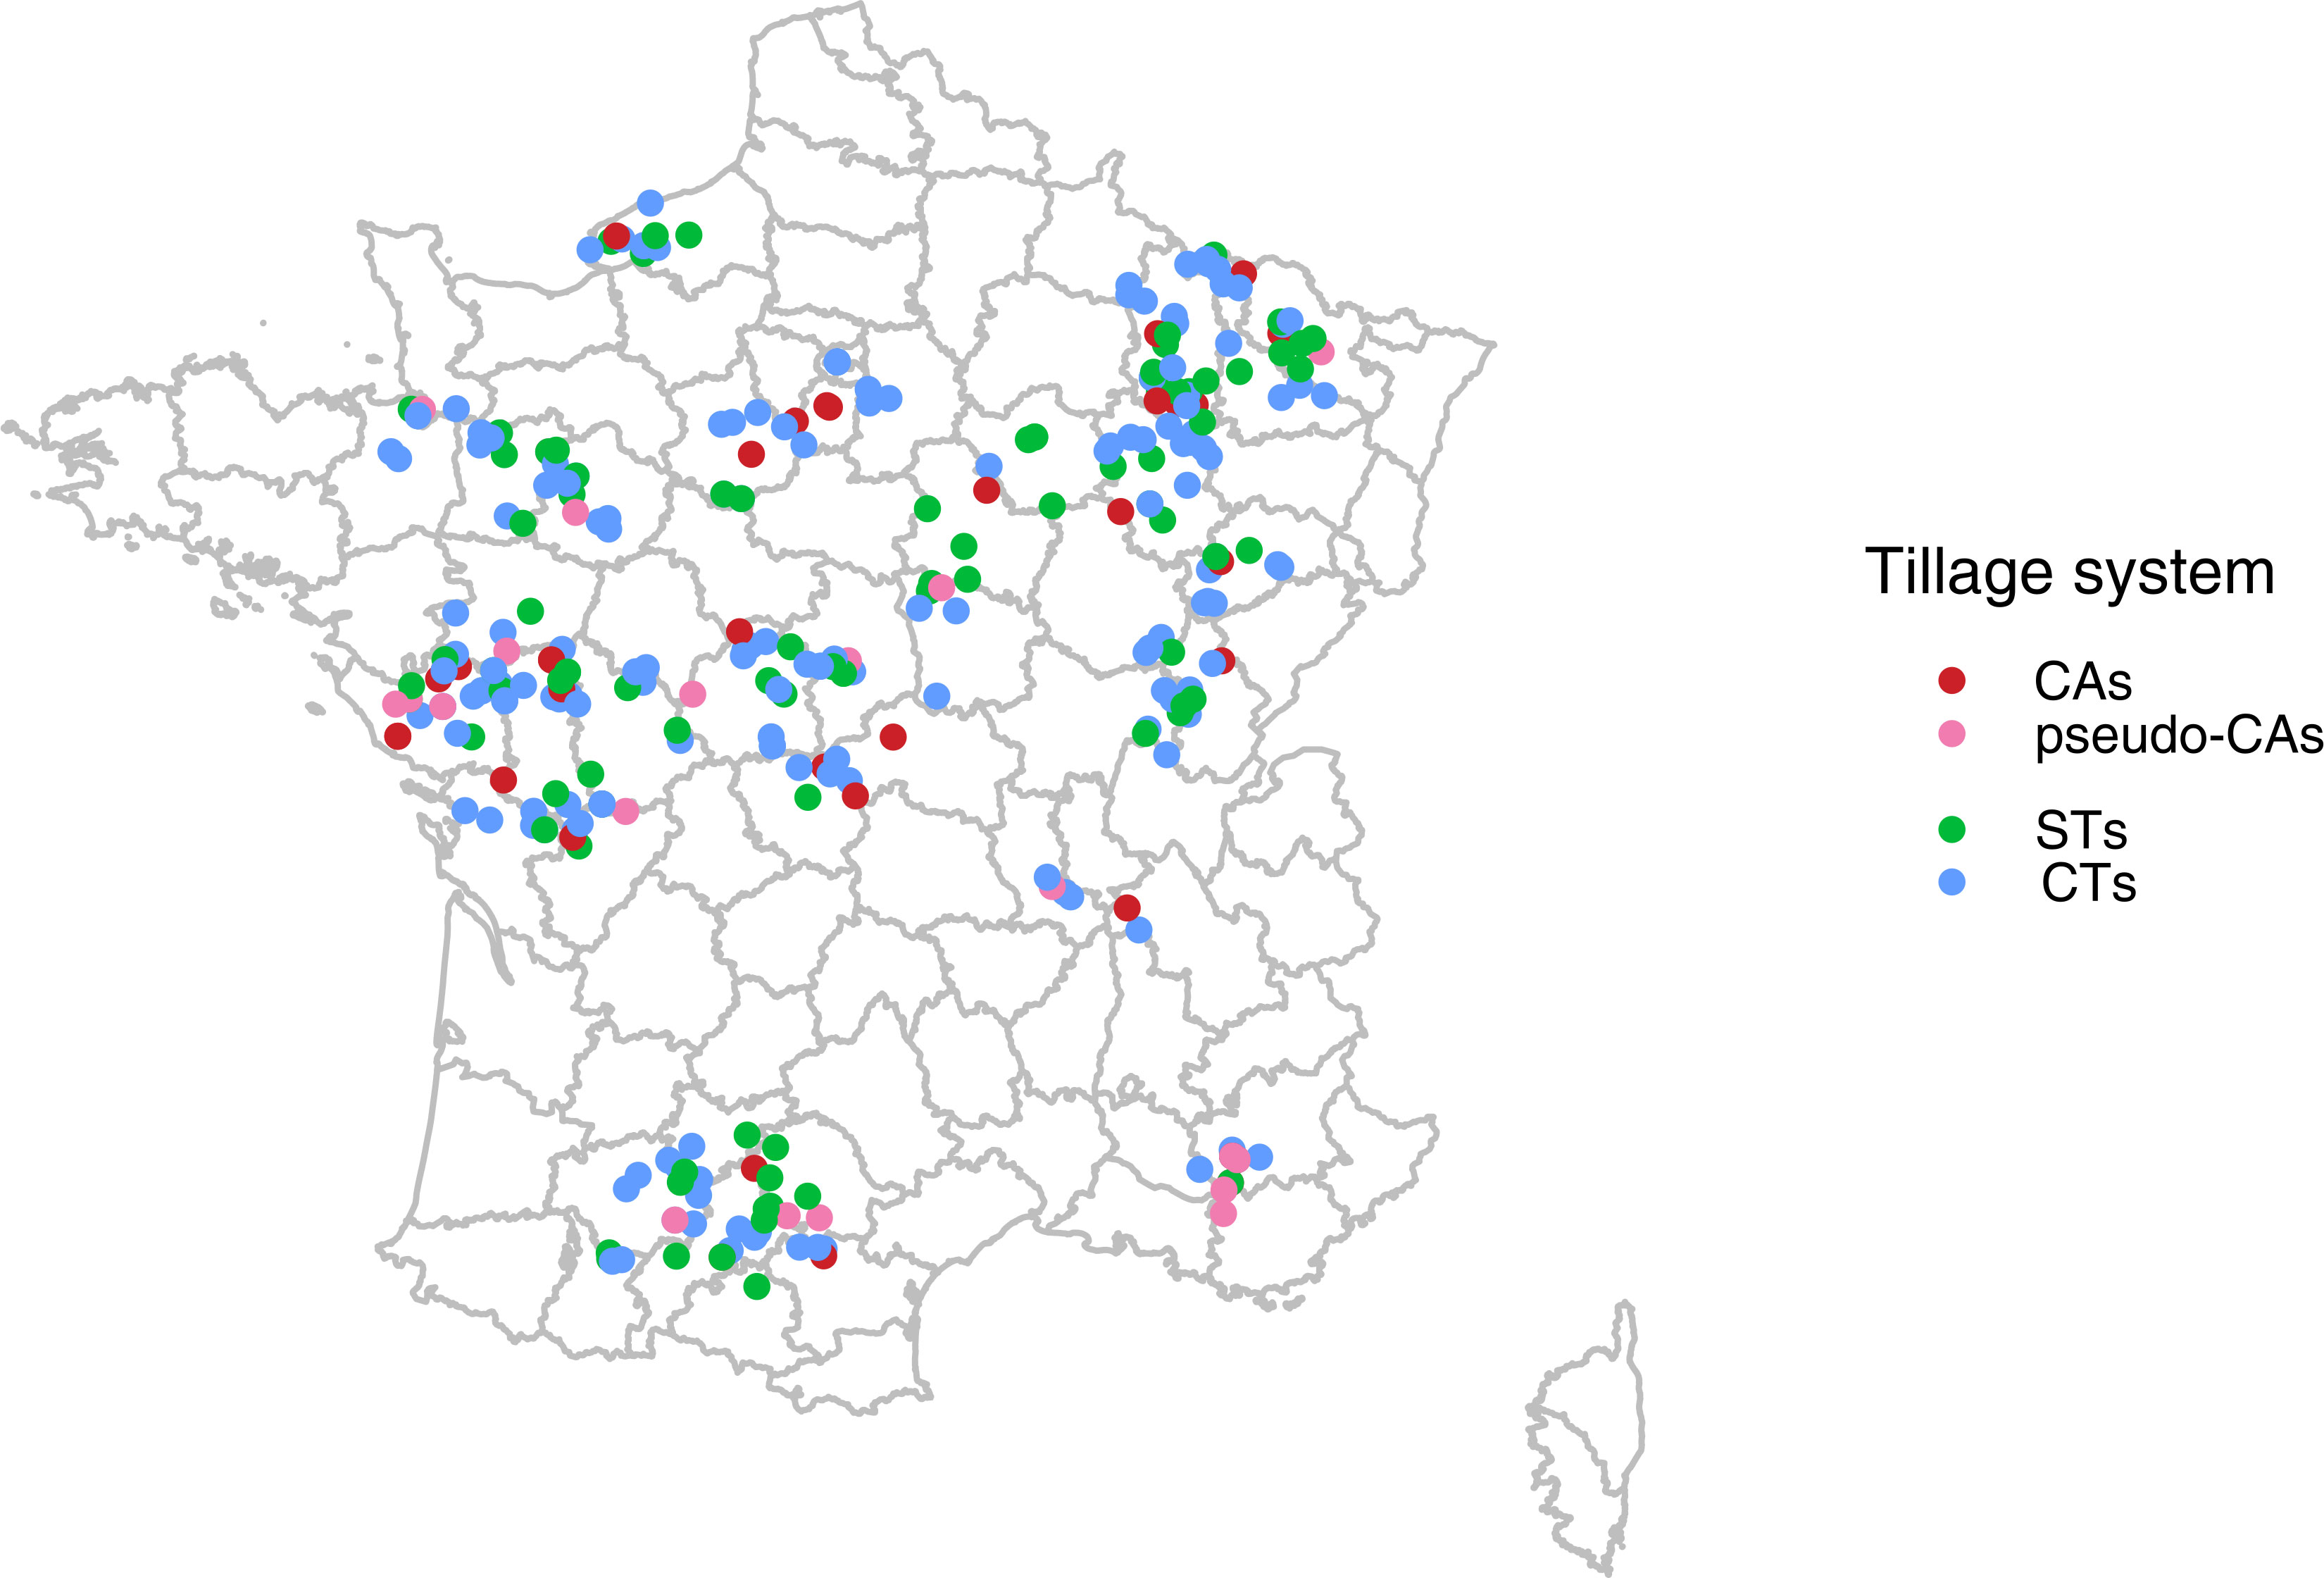
Figure 1 Geographical location of conservation agriculture (CAs, N=36), pseudo-CAs (N=19), and their reference conventional tillage (CTs, N=135) and superficial tillage (STs, N=90) based systems, all being part of the French DEPHY farm network.
2.3 Identification of reference systems
In order to optimize the comparison of systems in similar production situations (i.e. pedo-climatic and economic constraints which go beyond farmers’ strategic decisions), reference CTs and STs were searched according to the following rules:
- Similar climate: for each focus CAs or pseudo-CAs, we searched for CTs and STs within a geographical radius of 50 km. This rule not only ensured that the systems were compared in a rather similar climate, even if it is known that rainfall can be more localized, but also maximized the probability of the same socio-technical context (e.g. proximity to a sugar factory or other industry offering outlets for specific crops: beet, field vegetables, etc.).
- Similar soil type: as information on soil type is poorly informed in the AGROSYST database, we approximated soil type of each system on the basis of the French soil map (Inra, 2018). This French soil database indicates soil typological units (STU) that can be mapped. By intersecting the geographical positions of the systems and the map of soils on a GIS tool, we assigned to each cropping system the most frequent soil type of the city where the farm is located. Only CTs and STs sharing similar soil types with each focus CAs or pseudo-CAs were retained (within the previously established 50km radius).
- Similar years: the same three years were used to describe the focus CAs and pseudo-CAs and their reference CTs and STs (to the best of our ability, see details in Supplementary Tables S1, S2), to maximize the chances that climatic conditions and pest pressures were similar.
- As the presence of livestock on the farm greatly determines practices (Lechenet et al., 2016), focus CAs and pseudo-CAs were only compared with CTs and STs in similar farming contexts (grain-based only or grain-based/livestock mixed farming).
- As access to irrigation is a major driver of performance (e.g. increased productivity and/or production costs, possibility to grow certain crops), only CTs and STs with similar access to irrigation (yes/no) to the focus CAs or pseudo-CAs were retained.
- When possible, i.e. number of CTs or STs > 6 in the same production situation of the focus CAs or pseudo-CAs, a second filter based on distance was applied in order to keep only the six closest CTs and STs meeting all the other previous conditions.
On the basis of these context variables, we identified clusters of cropping systems sharing the same production situation, with each cluster being composed of a focus CAs or pseudo-CAs and their reference CTs and STs (i.e. similar climate, soil type, time frame of description, livestock context, access to irrigation). In a few rare cases, CAs or pseudo-CAs were geographically close and therefore were compared to the same CTs and STs. Each ‘cluster’ therefore comprises one to two CAs (number of clusters with 2 CAs = 3) or pseudo-CAs (number of clusters with 2 pseudo-CAs = 1) and from 0 to 6 reference CTs (on average 3.3 for the comparison with CAs and 3.7 for the comparison with pseudo-CAs) and from 0 to 6 STs (on average 1.8 for the comparison with CAs and 1.9 for the comparison with pseudo-CAs). Thus, a total of 36 CAs or 19 pseudo-CAs were compared to a total 135 CTs and 90 STs, split into 33 and 18 clusters for CAs and pseudo-CAs, respectively (Supplementary Tables 1, 2). The statistical analysis (see details below) allowed us to distinguish the “cluster” effect (i.e. effect of soil, climate and socio-technical context) from the effect of farming strategy (i.e. CTs, STs, CAs and pseudo-CAs) on each of the indicators considered.
A sub dataset comprising only cropping systems described across common years in a given cluster was also created to explore whether the results were sensible to the inclusion of reference cropping systems described over a slightly different time period.
2.4 Indicators of cropping systems’ performances
Data was extracted from the AGROSYST database, which provides information on crop identity and their order of succession, the sequence of interventions associated to each crop (from harvest of the previous crop to harvest of the studied crop), equipment, inputs (pesticide, fertilizer, seeds, irrigation etc.), dates and doses of application, and crop yield. Then, AGROSYST automatically computes several indicators of performance. In this study, we focused on two types of indicators:
- Indicators which aimed at verifying whether CA and pseudo-CA systems, initially identified based on tillage strategy, actually implemented the other two pillars of CA, i.e. crop diversification and permanent soil cover. For each system (CAs, pseudo-CAs, CTs, STs), we calculated the number of different crops in the rotation (two crops grown and harvested one after another in a given year were counted as 2) and the frequency of summer fallow cover crops. When cropping systems were described through the plot approach, these two indicators were calculated as the average described over the three years of monitoring and for all plots. When the number of plots:years was less than 9 (i.e. less than 3 plots described each year), the indicators were not calculated.
- Technical-economic and environmental performance indicators, calculated at the cropping system scale (average of each component of crop rotation). The indicators calculated by AGROSYST were:
The Treatment Frequency Index [TFI, average number of doses at the recommended dose per ha (Gravesen, 2003)], and its different components: total TFI (including seed treatment), Herbicide-TFI, Fungicide-TFI and Insecticide-TFI. It is commonly used in Europe to assess cropping system reliance to pesticides (OECD, 2001; Strehlow et al., 2020). A pesticide application at the reference dose over the whole plot surface yields a value of 1. AGROSYST computes TFI using two different methods: TFI “at crop” for which the reference dose is defined for each combination of commercial product and crop, and TFI “at pest target” for which the reference dose is defined for each combination of commercial product, crop and pest target. For instance, glyphosate is an active ingredient present in many herbicides whose homologated doses depend on the target weed (either annual or perennial weed species). Pearson’s product moment correlation between TFI resulting from both methods were tested (Supplementary Table S3). Furthermore, herbicide TFI was partitioned into glyphosate TFI and herbicide TFI without glyphosate, using the open database of the French E-Phy catalog of plant protection products (ANSES, 2021) to quantify the reliance of systems to this active compound (Antier et al., 2020).
Mechanized work time (h/ha/year), was calculated by AGROSYST using a national reference database (Walter, 2020), according to the work rate of the tools used for each mechanized intervention listed in a given cropping system, accounting for combined operations.
Fuel consumption (L/ha/year), was computed by AGROSYST using a national reference database (Walter, 2020), as a function of the work rate of the equipment, but also of the traction power and the load rate, according to the method recommended by the APCA – Chambres d’Agriculture France (2020).
Economic indicators were also computed: gross product (€/ha/year), operating costs (€/ha/year), mechanization costs (€/ha/year), semi-net margin (€/ha/year, calculated as gross product – operating costs – mechanization costs) and semi-net margin per hour of field traction (€/h/ha/year). Crop productivity was compared based on winter wheat grain yield (t/ha) as winter wheat was a crop shared by the vast majority of cropping systems. These indicators were calculated by AGROSYST on the basis of 10 price scenarios reflecting price volatility (agricultural products, fertilizers and fuels) between 2005 and 2017. The indicators were calculated for each price scenario and then averaged, which makes it possible to compare the economic performance of cropping systems that were not characterized over the same years.
2.5 Statistical analysis
All response variables presented above were analysed for the four datasets separately (CAs and pseudo-CAs, full dataset or sub dataset comprising only cropping systems described across the exact same time frame within a cluster) with linear mixed models, using the lme() function of the R package {nlme} (Pinheiro et al., 2017). These models integrated a fixed part (farming strategy, a 3-level factor, i.e. CAs/CTs/STs or pseudo-CAs/CTs/STs) and a random part that accounted for the structure of the data (the cluster effect accounting for the production situation effect). This procedure amounts to generalizing a paired t-test (intra cluster comparison) for more than 2 groups, with data for each combination of cluster:farming strategy averaged at the cluster level.
To account for intrinsic variability of performances within each farming strategy and meet one the prerequisites of ANOVA (i.e. homoscedasticity of residuals), variance structures were added to the model when required (Pinheiro and Bates, 2006; Zuur et al., 2009). Models with farming strategy as fixed factor and cluster as random effect, differing only by the inclusion or not of a variance structure (i.e. weights=varIdent(form=~1|farming_strategy)), were compared via a likelihood ratio test. The most likely model was retained, re-fitted by restricted maximum likelihood, and then subjected to an analysis of variance in order to test the ‘farming strategy’ fixed effect (F-test).
Contrasts between farming strategies were adjusted using the {emmeans} package (Lenth, 2019). The marginal effect of farming strategy is highlighted by least squares means. The coefficient of determination (R²), indicating the proportion of variance explained by the statistical model, is also presented as a diagnostic tool. For mixed models, it is divided into R²m (the proportion of variance explained by the fixed effects, farming strategy), and R²c (the proportion of variance explained by the whole model, fixed + random effects). All variables (except for intercrop frequency and semi-net margin) were log transformed.
3 Results
3.1 Multicriteria performance of CA systems
3.1.1 Compliance with CA pillars
With an average of 5.1 crops in the rotation (Table 1; Figure 2), CAs were significantly more diversified than their reference CTs (4.3) or STs (4.4). However, only the difference between CAs and CTs remained significant when the sub dataset comprising only common years was used (Supplementary Table S4). Frequency of fallow cover crops was also significantly greater in CAs than in reference systems (Table 1; Figure 2). Focusing on the sub dataset comprising only common years yielded a similar ranking among farming strategies but no significant farming strategy effect or significant differences between treatments were revealed (Supplementary Table S4). Overall, strict no-till was accompanied by the implementation of the other two CA pillars (Table 1), i.e. crop diversification and soil cover, although some systems deviated from this general trend, with less crops and/or cover crops than CTs and STs of the same cluster (Figure 2).
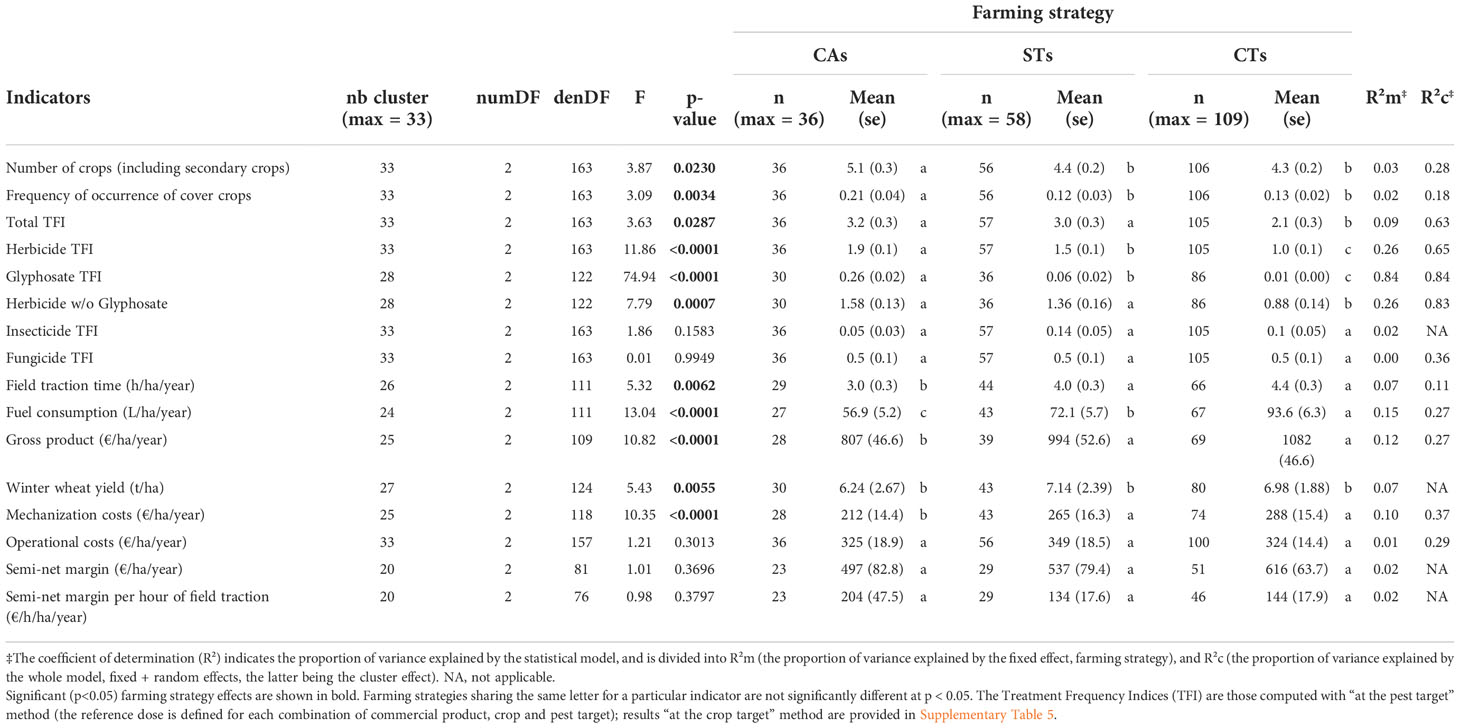
Table 1 Comparison of indicators between conservation agriculture systems (CAs) and their reference conventional tillage (CTs) and superficial tillage (STs) based systems, while accounting for production situation effects.
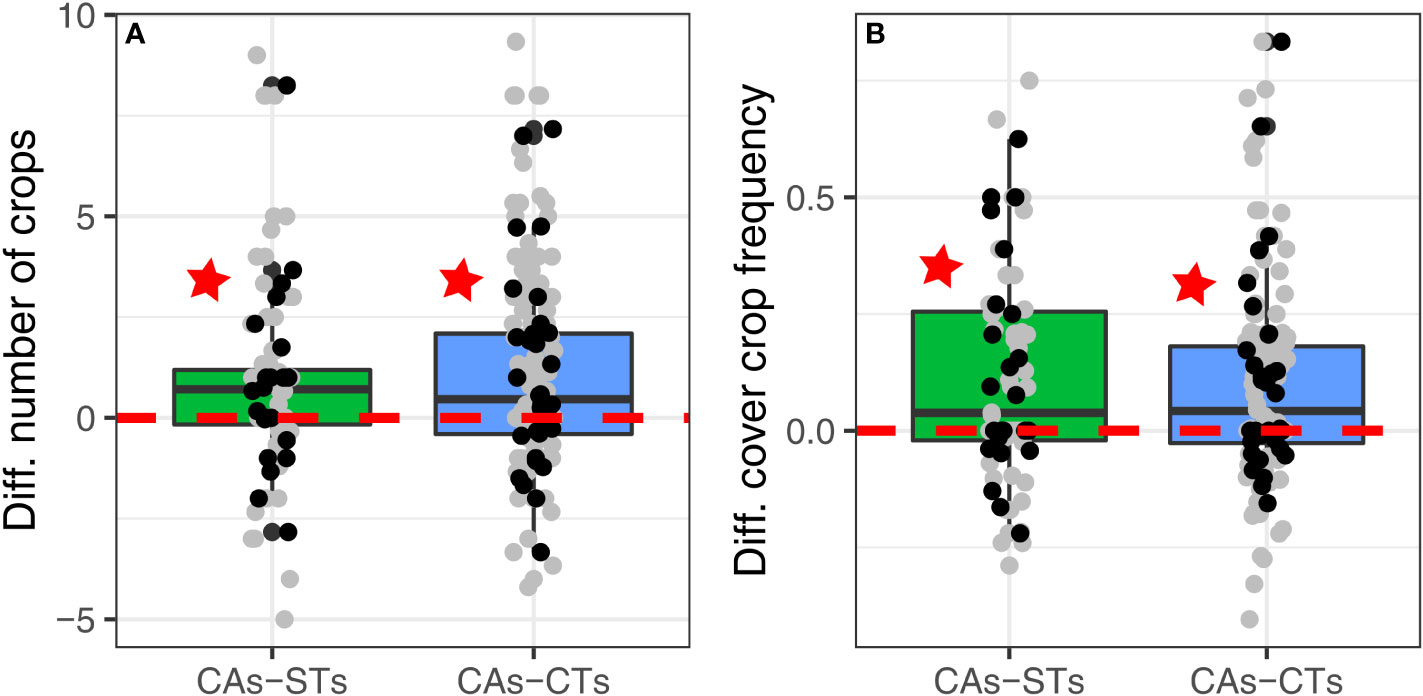
Figure 2 Distributions of the differences in response variables between conservation agriculture systems (CAs) and their reference conventional tillage (CTs, blue boxplots) and superficial tillage (STs, green boxplots) based systems for: the number of crops (A) and the frequency of fallow cover crops (B). Grey dots represent individual differences between systems. Black dots represent average differences per cluster. Red stars indicate significant differences between CAs and its reference system (either CTs or STs) at p<0.05, cluster accounting for the production situation included as a random effect in the model (see details in Table 1).
3.1.2 Pesticide use
Results were very similar whether TFI was computed using the “at crop” or “at pest target” methods (see Table 1 for values “at pest target”, Supplementary Table S5 for values “at the crop” method, and Supplementary Table 3 for correlations between both methods). Total TFI (Figure 3) of CAs was not different from that of STs, but higher (significant difference, +52% ‘at the pest target’ TFI method) than that of CTs (Table 1). However, only the difference between CAs and CTs remained significant when focusing on the sub dataset comprising only common years (Supplementary Table S4). The difference was mainly explained by higher herbicide use in CAs than CTs (+0.9 herbicide TFI point, +90%, Table 1 and Figure 3) and STs (+0.4 herbicide TFI point, +27%, only in the case of the full dataset, Supplementary Table S4). Few CAs resorted to less herbicides than STs (up to -2 herbicide TFI points) and CTs (up to -0.8 herbicide TFI points) of the same cluster. CAs relied more on the use of glyphosate (0.26 glyphosate TFI point, Table 1) than STs and CTs, but glyphosate use was overall low (Figure 3). Herbicide TFI without glyphosate was similar in CAs and STs but higher than in CTs (Table 1 and Figure 3). However, only the difference between CAs and CTs remained significant when focusing on the sub dataset comprising only common years (Supplementary Table S4). There was a trend towards lower insecticide use in CAs (Figure 3) compared to STs (-64%) and CTs (-50%), but the difference was not significant (Table 1). Fungicide use was similar between the three types of systems (Table 1 and Figure 3).
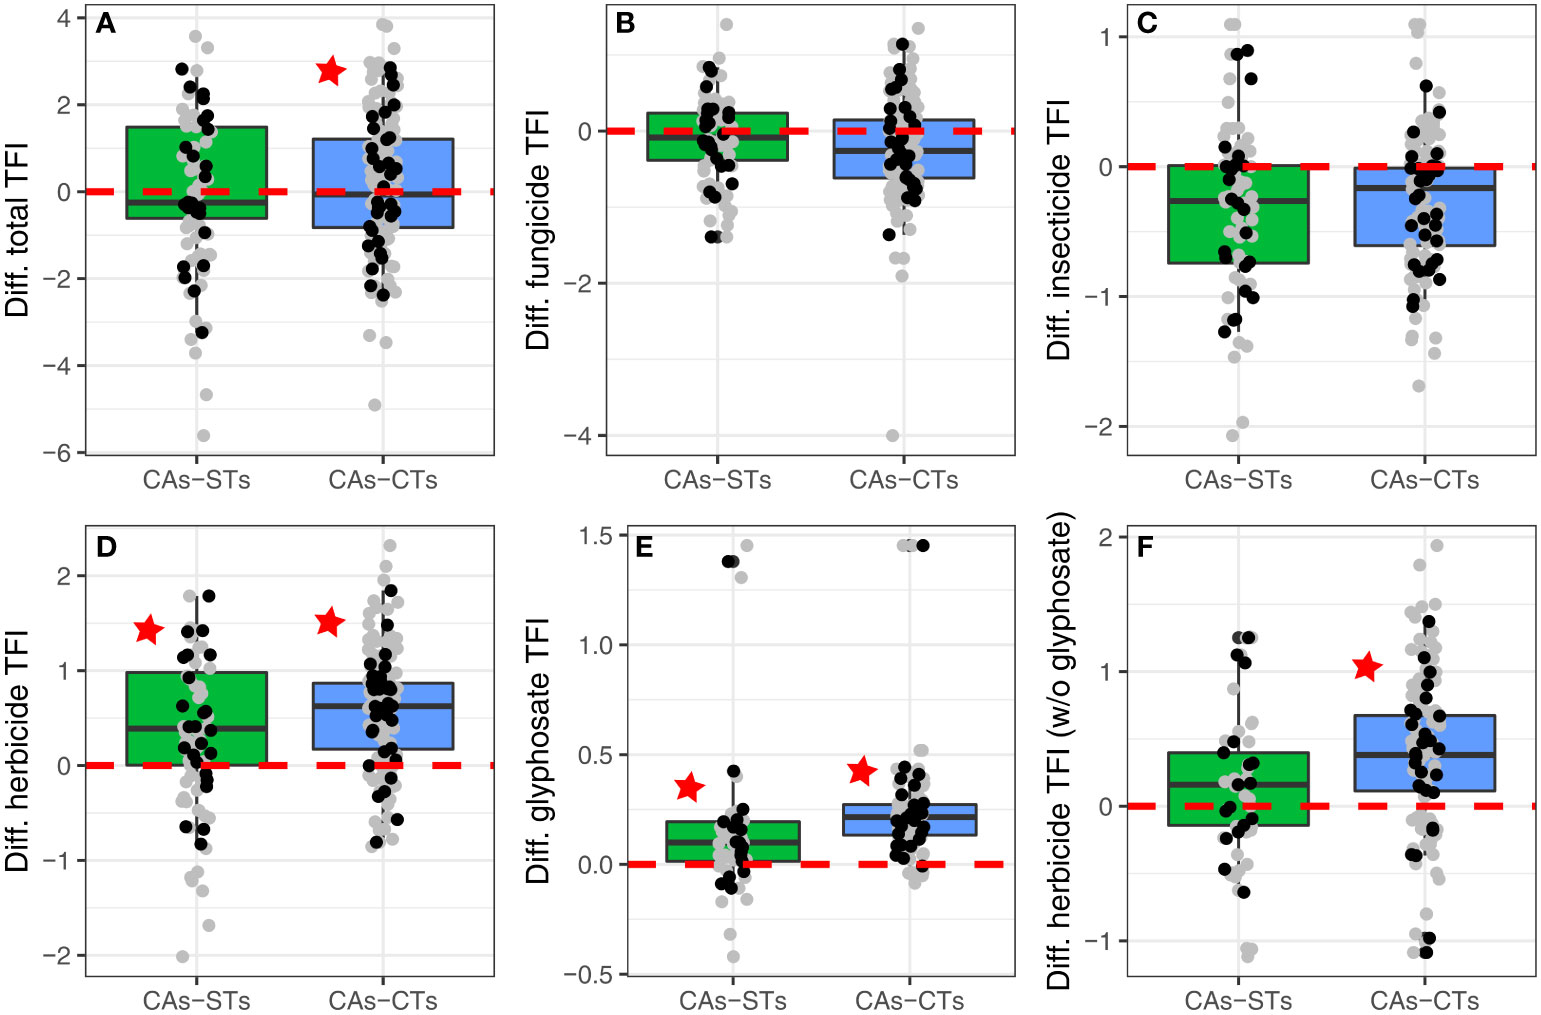
Figure 3 Pesticide use in conservation agriculture (CAs). Distributions of the differences in response variables between conservation agriculture systems (CAs) and their reference conventional tillage (CTs, blue boxplots) and superficial tillage (STs, green boxplots) based systems for: total treatment frequency index (total TFI including seed treatments, A), fungicide TFI (B), insecticides TFI (C), herbicide TFI (D), glyphosate-based herbicide TFI (E), and herbicide TFI without glyphosate (F). The TFI are those computed with “at the pest target” method. Grey dots represent individual differences between systems. Black dots represent average differences per cluster. Red stars indicate significant differences between CAs and its reference system (either CTs or STs) at p<0.05. Cluster was included as a random effect in the statistical models to account for production situation effects (see details in Table 1).
3.1.3 Technical and economic indicators
With respectively 3 h/ha/year and 57 L/ha/year on average (Table 1), traction time and fuel consumption were clearly reduced in CAs compared to STs (-25 and -21%, respectively) and CTs (-32 and -39%, respectively, Figure 4). Nevertheless, the differences between CAs and STs were less obvious for both variables when focusing on the sub dataset comprising only common years (Supplementary Table S4). Gross product was 19% and 25% significantly lower in CAs than in STs and CTs, respectively (Table 1 and Figure 4). Focusing on the sub dataset comprising only common years yielded a similar ranking among farming strategies but no significant farming strategy effect or significant differences between treatments were revealed (Supplementary Table S4). The lower gross margin was partly compensated by significantly lower mechanization costs in CAs compared to STs (-20%, only in the case of the full dataset, Table 1 and Figure 4) and CTs (-36%). However, lower mechanization cost was sufficient to compensate for the loss of gross products, as the semi-net margin did not differ (Table 1) between strategies (Figure 4). Winter wheat productivity was lower in CAs than STs (-13%) and CTs (-11%) indicating that reduced gross product was partly due to reduced yield of some crops (Table 1). The semi-net margin per hour of mechanized work did not significantly differ between the three strategies (Table 1 and Figure 4) despite a clear advantage of CAs over STs (+52%) and CTs (+42%).
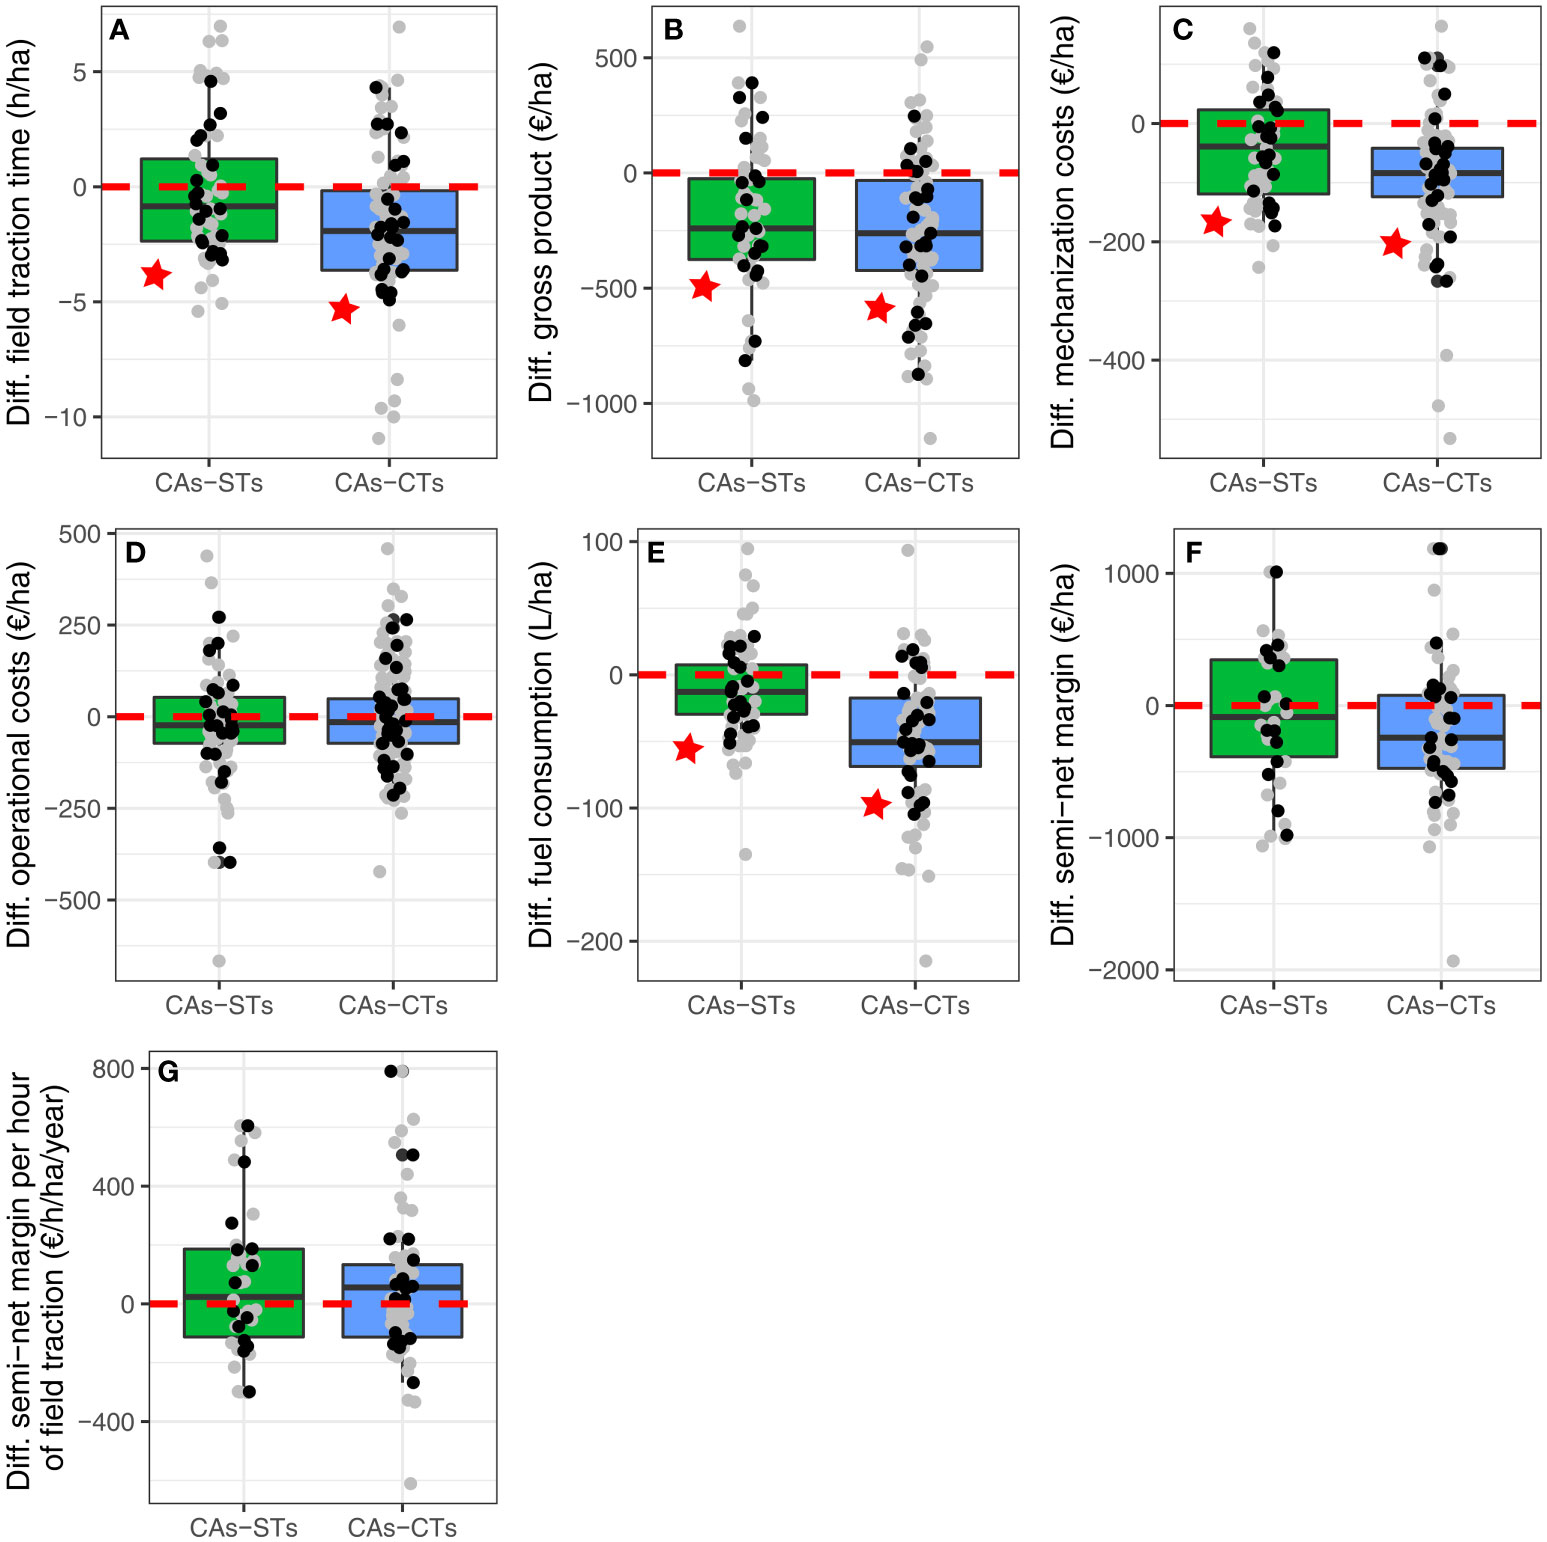
Figure 4 Technical and economic performances of conservation agriculture systems (CAs). Distributions of the differences in response variables between CAs and their reference conventional tillage (CTs, blue boxplots) and superficial tillage (STs, green boxplots) based systems for mechanized work time (h/ha/year, A), gross product (€/ha/year, B), mechanization costs (€/ha/year, C), operating costs (€/ha/year, D), fuel consumption (L/ha/year, E), semi-net margin (€/ha/year, F) and semi-net margin per hour of field traction (€/h/ha/year, G). Grey dots represent individual differences between systems. Black dots represent average differences per cluster. Red stars indicate significant differences between CAs and its reference system (either CTs or STs) at p<0.05. Cluster was included as a random effect in the statistical models to account for production situation effects (see details in Table 1).
3.2 Multicriteria performance of pseudo-CA systems
3.2.1 Compliance with CA pillars
Pseudo-CAs did not resort to a more diversified crop rotation than the reference systems (Table 2 and Figure 5). The frequency of fallow cover crops was higher in pseudo-CAs than in the reference systems, but these differences were again not significant (Table 2 and Figure 5). Hence, pseudo-CAs tended to implement the two other pillars of CA but the difference with their CTs and STs counterparts was not as clear as with CAs (section 3.1.1).
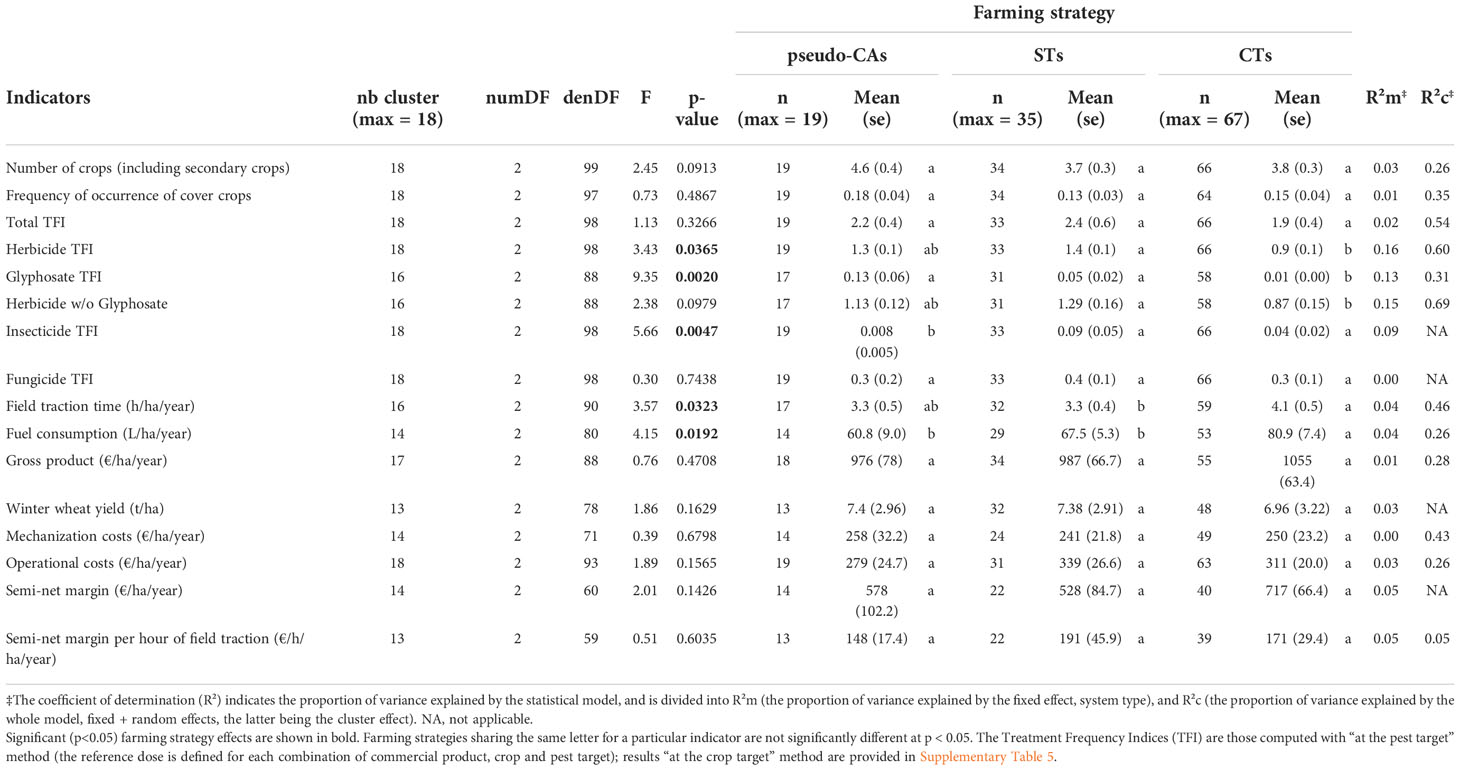
Table 2 Comparison of indicators between pseudo-conservation agriculture systems (pseudo-CAs) and their reference conventional tillage (CTs) and superficial tillage (STs) based systems, while accounting for production situation effects.
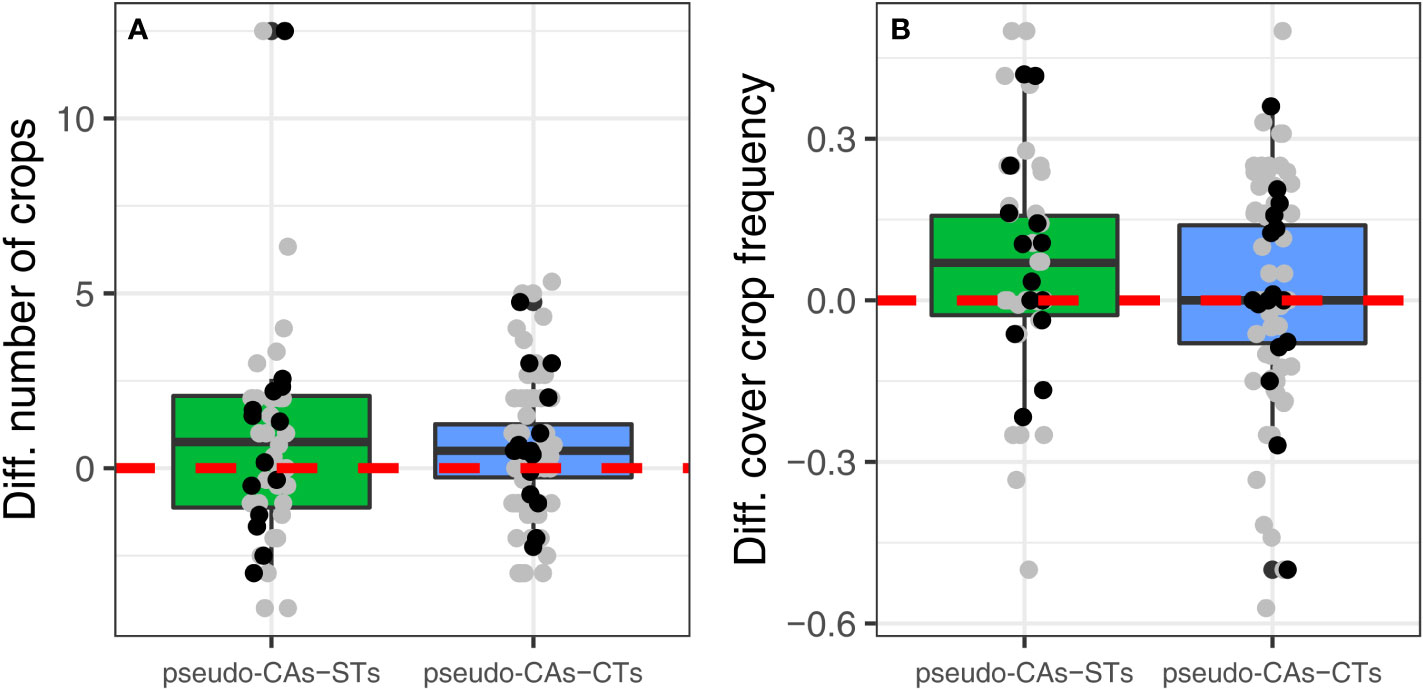
Figure 5 Distributions of the differences in response variables between pseudo-conservation agriculture systems (pseudo-CAs) and their reference conventional tillage (CTs, blue boxplots) and superficial tillage (STs, green boxplots) based systems for: the number of crops (A) and the frequency of summer fallow cover crops (B). Grey dots represent individual differences between systems. Black dots represent average differences per cluster. Red stars indicate significant differences between pseudo-CAs and its reference system (either CTs or STs) at p<0.05, cluster accounting for the production situation included as a random effect in the model (see details in Table 2).
3.2.2 Pesticide use
Overall, herbicide and insecticide use varied between farming strategies but pseudo-CAs showed significant differences with the reference systems only for insecticide use (-91 and -80% compared to STs and CTs, Table 2 and Figure 6). As observed for CAs, results were very similar when using TFI calculated with the TFI ‘at crop’ and ‘at pest target’ methods (see Table 2 for “at pest target” values, Supplementary Table S5 for “at crop values”, and Supplementary Table 3 for correlations between both methods). Total TFI of pseudo-CAs (Figure 6) was intermediate between STs (highest) and CTs (lowest), but was not significantly different (Table 2). Nevertheless, focusing on the sub dataset comprising only common years yielded a significant difference between STs and CTs only (Supplementary Table S6). The differences were again mainly due to herbicides (Table 2 and Figure 6), with herbicide TFI in pseudo-CAs being lower than in STs (-7%) and higher than in CTs (+40%), but no significant differences were observed. However, focusing on the sub dataset comprising only common years revealed significantly higher herbicide use in pseudo-CAs and STs than in CTs (Supplementary Table S6). Pseudo-CAs and STs relied similarly on the use of glyphosate but more than CTs, although glyphosate use was overall low (Table 2 and Figure 6). Interestingly, herbicide TFI without glyphosate in CAs was not significantly different from either STs or CTs, though it was respectively higher and lower for the case of CAs. (Table 2 and Figure 6). Significantly higher herbicide TFI without glyphosate in pseudo-CAs and STs than in CTs was nevertheless identified when focusing on the sub dataset comprising only common years (Supplementary Table S6). Insecticide TFI (Figure 6) in pseudo-CAs was extremely low, close to 0, and significantly lower than those of the reference systems (Table 2). Fungicide TFI were about 0.3 and not significantly different between farming strategies (Table 2, Figure 6). Focusing on the sub dataset comprising only common years highlighted a significant difference between pseudo-CAs and CTs (Supplementary Table S6).
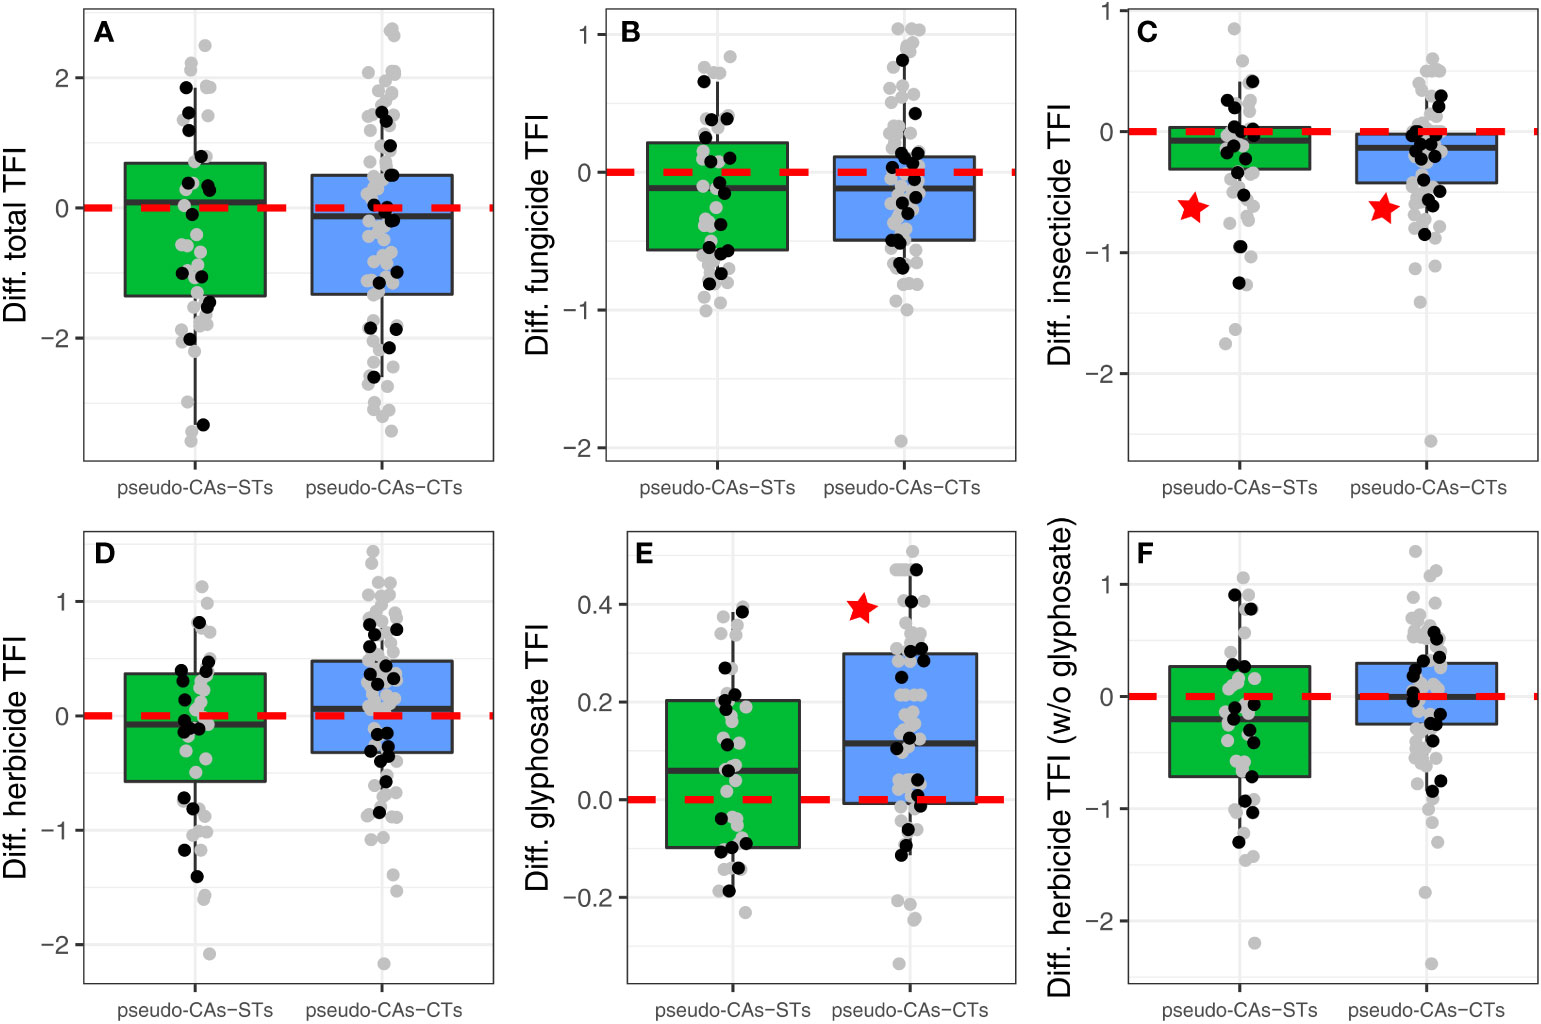
Figure 6 Pesticide use in pseudo-conservation agriculture (pseudo-CAs). Distributions of the differences in response variables between pseudo-CAs and their reference conventional tillage (CTs, blue boxplots) and superficial tillage (STs, green boxplots) based systems for: total treatment frequency index (total TFI including seed treatments, (A), fungicide TFI (B), insecticide TFI (C), herbicide TFI (D), glyphosate-based herbicide TFI (E), and herbicide TFI without glyphosate (F). The TFI are those computed with “at the pest target” method. Grey dots represent individual differences between systems. Black dots represent average differences per cluster. Red stars indicate significant differences between pseudo-CAs and its reference system (either CTs or STs) at p<0.05, cluster accounting for the production situation included as a random effect in the model (see details in Table 2).
3.2.3 Technical and economic indicators
There were no differences between pseudo-CAs and STs for any of the technico-economic indicators studied (Table 2). However, fuel consumption in pseudo-CAs (-25%) and STs (-17%) was significantly lower than for CTs (Table 2 and Figure 7). Only the difference between pseudo-CAs and CTs remained significant when focusing on the sub dataset comprising only common years (Supplementary Table S6). Gross product, winter wheat yield, operating costs and semi-net margin (per hour of mechanized work or not) did not vary by farming strategy, for the full as well as the reduced dataset (Table 2; Figure 7 and Supplementary Table S6).
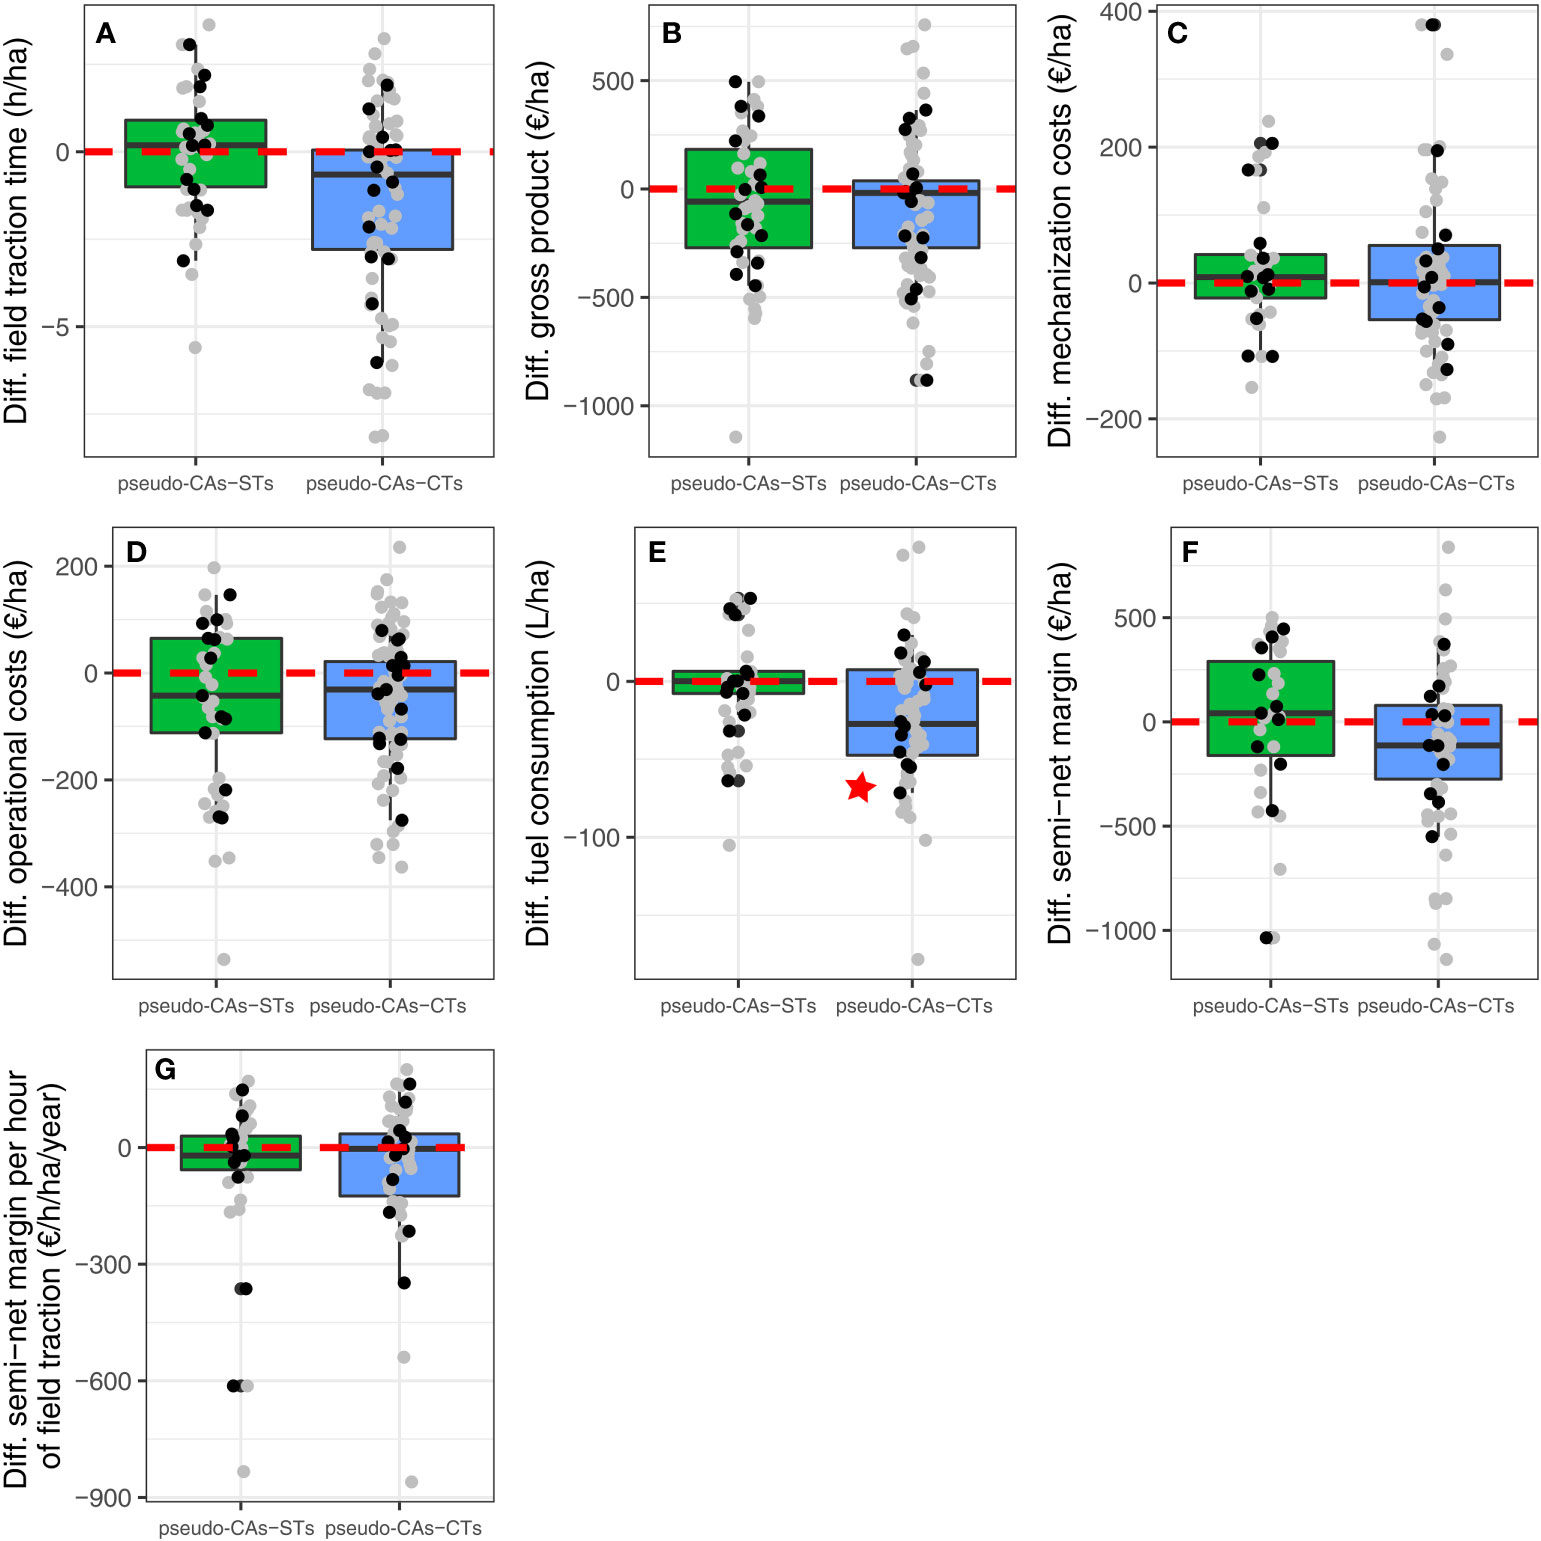
Figure 7 Technical and economic performances of pseudo-conservation agriculture systems (pseudo-CAs). Distributions of the differences in response variables between pseudo-CAs and their reference conventional tillage (CTs, blue boxplots) and superficial tillage (STs, green boxplots) based systems for mechanized work time (h/ha/year, A), gross product (€/ha/year, B), mechanization costs (€/ha/year, C), operating costs (€/ha/year, D), fuel consumption (L/ha/year, E), semi-net margin (€/ha/year, F) and semi-net margin per hour of field traction (€/h/ha/year, G). Grey dots represent individual differences between systems. Black dots represent average differences per cluster. Red stars indicate significant differences between pseudo-CA and its reference system (either CTs or STs) at p<0.05. Clusters were accounted for as random effects in the model, cluster accounting for the production situation included as a random effect in the model (see details in Table 2).
4 Discussion
4.1 Multicriteria performances of CA and pseudo-CA
The study confirmed and quantified assumptions often made about CA, usually backed up by farmers’ observations. Our study is original with respect to the rare studies assessing CA based on multiple indicator of performances conducted in France (Craheix et al., 2016; Chabert and Sarthou, 2020). Indeed, Craheix et al. (2016) included systems implementing occasional superficial tillage in their definition of CA, which we describe here as pseudo-CA following the classification of tillage types of Reicosky (2015). In addition, Craheix et al. (2016), identified and classified systems based on tillage strategy as we did, but did not check the implementation of the third CA pillar, i.e. permanent soil cover, often considered by pioneers as the first to be implemented in the system. Contrary to Craheix et al. (2016), which indicated that crop rotation in CA helped in controlling weeds but not insect pests and diseases, our results showed that CAs resorted to more herbicides, whether glyphosate-based or not, but slightly less insecticides than the reference superficial (STs) and conventional (CTs) tillage based systems. Tillage, even superficial, remains a major weed management tool, although it shows the disadvantage of stimulating new cohorts after the destruction of the initial community (Teasdale et al., 1991; Cordeau et al., 2017). This could explain why non-glyphosate based herbicide TFI was similar in CAs and STs and slightly higher (even though not significantly) in STs than in pseudo-CAs in our study. However, CAs relied more on glyphosate than STs and CTs because even under no-tillage, perennial and even annual weeds still emerge and maintain populations over time (Trichard et al., 2013) and remain a main concern for CA farmers (Derrouch et al., 2020). Overall, the use of glyphosate-based herbicide was low (i.e. 0.26 and 0.13 TFI points for CAs and pseudo-CAs, respectively), corresponding to a reference dose applied every four years or a fourth of the reference dose applied each year on all plots of a given cropping system for CAs.
Our results also showed that stopping tillage in CA allows to decrease time of traction/ha/year, fuel consumption, as well as mechanization costs. It tended to slightly decrease profitability per hectare (due to slightly lower productivity), as also observed worldwide (Pittelkow et al., 2015). However, the ranking of systems was reversed when focusing on profitability per hour of field traction. CA was as profitable per hours of field traction as the other systems. CA is an innovative type of agriculture, at odds with some of the traditional pillars of farming, and thus requires training, field observations, a new organization of the work time, a more in depth selection of seeds and suppliers, management of seed stocks, etc., which is not accounted for in field traction time.
These conclusions draw general lessons based on averages across different production situations, but mask a great diversity of interactions between farming strategy and cluster (a “unique” production situation). It is sometimes in particularities that we observe more nourishing lessons (Verret et al., 2020; Salembier et al., 2021). For example, our results showed that few CAs used less herbicides (herbicide TFI) than their reference CTs and STs located in the same production situation. We hypothesize that specific elements of the production situation (region, soil type, market outlet) and/or differences in initial pest pressure could explain the large variability of responses across clusters, but argue that our dataset was not designed to investigate these hypotheses compared to other studies [e.g. see Lechenet et al. (2017a)]. For example, stopping tillage represents a strong disturbance of the ecological habitat for weeds and it is only after a transition phase estimated by some studies at 5-6 years that weed management becomes optimal, when CA farmers optimized their choices of crops and cover crops (Derrouch et al., 2020). Finally, it is possible that the economic profitability per hectare (and/or per hour of work) is more favorable to CAs in areas of low to intermediate productivity, on shallow clay-limestone soils with limited yield potential. Our analysis highlighted lower winter wheat productivity for CAs than reference systems in the same production situation, as shown by Pittelkow et al. (2015), and may partly explain why gross products were lower in CAs. However, this conclusion cannot be drawn for all crops in all production situation and an in-depth analysis of the differences between the clusters, i.e. the production situation, would allow to verify this hypothesis, but even larger datasets would be required (Munier-Jolain and Lechenet, 2020).
4.2 Values of exploring big data sets
CAs and pseudo-CAs were here initially selected according to their tillage strategy (no-till in CAs and less than one superficial tillage per year across the 3-year period for pseudo-CAs). However, our analysis showed that CAs, contrary to pseudo-CAs, implemented the principles of crop diversification and soil coverage, two of the three pillars of CA (Reicosky, 2015; Kassam et al., 2019; FAO, 2021), and often considered as those implemented first during the transition phase (Derrouch et al., 2020). Pseudo-CAs did not implement the three CA principles since crop rotation were as diverse and cover crop as frequent as in STs and CTs, and tillage occurred, albeit rarely. The present study demonstrates once again the great value of large datasets documenting detailed agricultural practices implemented across a wide array of production situations (Larsen and Noack, 2017; Lechenet et al., 2017a; Munier-Jolain and Lechenet, 2020). Their analysis makes it possible to produce agronomic knowledge that is primordial for supporting farmers’ agro-ecological transition, i.e. the adaptation of practices to increase cropping system multi-performance (Munier-Jolain and Lechenet, 2020). The method developed here is original, different from the data mining approaches (CART, Random Forest) that are becoming common for the analysis of large agronomic datasets (Tittonell et al., 2008; Williams et al., 2009). We studied differences in indicators of performance between systems within the same production situations, with reference systems neighboring the targeted CAs and pseudo-CAs. As all the systems in the same cluster share the same production context [type of soil, type of climate, technical-economic context, etc., i.e. all the elements of the context that are undergone by farmers and which cannot be modified by their farming strategy (Lechenet et al., 2017a)], the approach allows to compare systems without confounding effect of the production situation, ensuring to highlight the effect of farmers’ strategies.
4.3 Avenues for future research on multicriteria assessment of conservation agriculture
It was not possible in this study to refine the analyses by increasing the range of available indicators. For example, and despite an increasing interest in this question (Dang et al., 2015; Blanco-Canqui and Wortmann, 2020; Cordeau et al., 2020), the use of strategic tillage in fields implementing CA principles for years remains to be assessed from a multicriteria perspective. Pseudo-CAs consists of the implementation of superficial occasional tillage either for strategic (planting root crops such as sugar beet or potato, which require tillage) or tactical reasons (contain pest issues such as slugs, voles and/or weeds). However, implementing superficial tillage after a no-till phase is generally considered to be risky for weed management since the no-till phase of the rotation concentrates the weed seedbank in the top soil layer (Swanton et al., 2000) and then shallow tillage stimulates germination, leading to high infestations (Cordeau et al., 2020). This is not the case for the ‘rotational no-till’ strategies, which alternate long no-till phases with plowing (Mirsky et al., 2013), but whose performance on a wide range of indicators, as we did here, remain unknown (Cordeau et al., 2020).
Finally, this study compared cropping systems based on performances averaged over multiple plot and years. The DEPHY Farm network was set up in the early 2010s and is made up of volunteer farmers who are motivated in reducing pesticide use, albeit without negative financial consequences, and are thus engaged in changing their farming practices. Thus, performances are expected to change over time as farmers optimize new practices aiming at reducing pesticide use, even in CA and pseudo-CA. It would therefore be interesting to analyze the trajectories of performances to identify pathways allowing farmers to achieve multi-performance as fast as possible. CA remains a new and evolving form of agriculture in France as it is worldwide, constantly innovating, and already very different from how it was implemented by pioneers several decades ago (Laurent, 2015). Ensuring the continuation of the DEPHY farmers’ network will allow future research to dig into performance trajectories, instead of averaged performances of moving strategies.
5 Conclusion
Based on the analysis of 13 indicators of technical, economic and environmental performances, computed on 280 cropping systems implementing conservation agriculture (CAs), pseudo-CAs (implementing occasional shallow tillage operations), conventional tillage (CTs, i.e. plowing-based) and superficial tillage (STs) based strategies, we found that CAs (i) require more herbicides but slightly less insecticides, (ii) decrease time of traction/ha/year, fuel consumption, as well as mechanization costs, (iii) tend to slightly decrease profitability per hectare (due to slightly lower productivity) but similar profitability per hour of field traction. Further analysis is needed to identify the determinants of multi-performance in a given production situations and track down innovative systems optimizing multiple performances and solving apparent trade-offs, such as tillage intensity and herbicide use and/or limited productivity.
Data availability statement
The raw data supporting the conclusions of this article will be made available by the authors, upon request.
Author contributions
GA, SC, NM-J designed the study. SC and NM-J funded the study. GA and NM-J requested the data from the DEPHY Network. GA, MG, SL, and EC coded different functions necessary for data analysis. GA prepared the data and performed all preliminary and final analyses, with help of MG. All authors were involved in the interpretation of the results and contributed to writing the original version of the manuscript and improving the subsequent ones.
Funding
The authors wish to acknowledge financial support from the Casdar ENGAGED (“Weed Management in conservation agriculture without glyphosate”), which was financed by the French Ministry in charge of Agriculture and Food (Ministère de l’Agriculture et de l’Alimentation), with financial contributions from the special purpose account “Développement agricole et rural”. The authors also wish to acknowledge financial support from INRAE, ANR PPR SPECIFICS project (ANR-20-PCPA-0008), and the European Union’s Horizon 2020 research and innovation program under grant agreement (no. 727321- IWM PRAISE).
Acknowledgments
We thank the farmers and farm advisors from the DEPHY network, and thanks the CAN (the national coordination unit of the DEPHY Network) for accepting our request to use the network data.
Conflict of interest
The authors declare that the research was conducted in the absence of any commercial or financial relationships that could be construed as a potential conflict of interest.
Publisher’s note
All claims expressed in this article are solely those of the authors and do not necessarily represent those of their affiliated organizations, or those of the publisher, the editors and the reviewers. Any product that may be evaluated in this article, or claim that may be made by its manufacturer, is not guaranteed or endorsed by the publisher.
Supplementary material
The Supplementary Material for this article can be found online at: https://www.frontiersin.org/articles/10.3389/fagro.2022.999960/full#supplementary-material
References
Adeux G., Munier-Jolain N., Meunier D., Farcy P., Carlesi S., Barberi P., et al. (2019). Diversified grain-based cropping systems provide long-term weed control while limiting herbicide use and yield losses. Agron. Sustain. Dev. 39, 42. doi: 10.1007/s13593-019-0587-x
Ancelet E., Schellenberger A., Jolys O., Munier-Jolain N., Cadoux S. (2014). Système d'Information agrosyst. (Paris: INRAE).
ANSES (2021). Données ouvertes du catalogue e-phy des produits phytopharmaceutiques, matières fertilisantes et supports de culture, adjuvants, produits mixtes et mélanges (Paris, France: Agence Nationale De Sécurité Sanitaire De L'alimentation De L'environnement Et Du Travail (Anses). Available at: https://www.data.gouv.fr/fr/datasets/donnees-ouvertes-du-catalogue-e-phy-des-produits-phytopharmaceutiques-matieres-fertilisantes-et-supports-de-culture-adjuvants-produits-mixtes-et-melanges/.
Antier C., Andersson R., Auskalnienė O., Barić K., Baret P., Besenhofer G., et al. (2020). A survey on the uses of glyphosate in European countries (INRAE). doi: 10.15454/A30K-D531
APCA - Chambres d'Agriculture France (2020). Matériels agricoles: Coûts des opérations culturales - un référentiel pour le calculdes coûts de productionet le barème d’entraide, (Paris: APCA) Vol. 78.
Blanco-Canqui H., Wortmann C. S. (2020). Does occasional tillage undo the ecosystem services gained with no-till? a review. Soil Tillage Res. 198, 104534. doi: 10.1016/j.still.2019.104534
Cadoux S., Sauzet G., Morison M. V., Pontet C., Champolivier L., Robert C., et al. (2015). Intercropping frost-sensitive legume crops with winter oilseed rape reduces weed competition, insect damage, and improves nitrogen use efficiency. OCL Oilseeds fats Crops Lipids 22. doi: 10.1051/ocl/2015014
Chabert A., Sarthou J.-P. (2020). Conservation agriculture as a promising trade-off between conventional and organic agriculture in bundling ecosystem services. Agric. Ecosyst. Environ. 292, 106815. doi: 10.1016/j.agee.2019.106815
Corbeels M., Naudin K., Whitbread A. M., Kühne R., Letourmy P. (2020). Limits of conservation agriculture to overcome low crop yields in sub-Saharan Africa. Nat. Food 1, 447–454. doi: 10.1038/s43016-020-0114-x
Cordeau S., Baudron A., Adeux G. (2020). Is tillage a suitable option for weed management in conservation agriculture? Agronomy 10. 1746, doi: 10.3390/agronomy10111746
Cordeau S., Guillemin J. P., Reibel C., Chauvel B. (2015). Weed species differ in their ability to emerge in no-till systems that include cover crops. Ann. Appl. Biol. 166, 444–455. doi: 10.1111/aab.12195
Cordeau S., Smith R. G., Gallandt E. R., Brown B., Salon P., Ditommaso A., et al. (2017). Timing of tillage as a driver of weed communities. Weed Sci. 65, 504–514. doi: 10.1017/wsc.2017.26
Craheix D., Angevin F., Doré T., De Tourdonnet S. (2016). Using a multicriteria assessment model to evaluate the sustainability of conservation agriculture at the cropping system level in France. Eur. J. Agron. 76, 75–86. doi: 10.1016/j.eja.2016.02.002
Dang Y., Moody P., Bell M., Seymour N. P., Dalal R., Freebairn D., et al. (2015). Strategic tillage in no-till farming systems in australia’s northern grains-growing regions: II. implications for agronomy, soil and environment. Soil Tillage Res. 152, 115–123. doi: 10.1016/j.still.2014.12.013
Derpsch R. (1998). “Historical review of no-tillage cultivation of crops,” in Historical review of no-tillage cultivation of crops (Harare: Proceedings from an International Workshop), 22–27.
Derrouch D., Chauvel B., Cordeau S., Dessaint F. (2021). Functional shifts in weed community composition following adoption of conservation agriculture. Weed Res. 62, 103–112. doi: 10.1111/wre.12517
Derrouch D., Chauvel B., Felten E., Dessaint F. (2020). Weed management in the transition to conservation agriculture: Farmers’ response. Agronomy 10, 843. doi: 10.3390/agronomy10060843
Dong L., Si T., Li Y.-E., Zou X.-X. (2021). The effect of conservation tillage in managing climate change in arid and semiarid areas–a case study in Northwest China. Mitigation Adaptation Strategies Global Change 26, 1–19. doi: 10.1007/s11027-021-09956-3
El-Gizawy N. K. B. (2009). Effect of planting date and fertilizer application on yield of wheat under no till system. World J. Agric. Sci. 5, 777–783.
FAO (2021) Conservation agriculture principles. Available at: https://www.fao.org/conservation-agriculture/overview/principles-of-ca/en/ (Accessed 13th December 2021).
Gliessman S. R., Engles E., Krieger R. (1998). Agroecology: ecological processes in sustainable agriculture (London, UK:CRC press).
Gravesen L. (2003). “The treatment frequency index: an indicator for pesticide use and dependency as well as overall load on the environment,” in Pesticide action network Europe, pure conference(Copenhagen, Denmark). Available at: https://www.pan-europe.info/old/Archive/conferences/pure2003.pdf.
Hobbs P. R., Sayre K., Gupta R. (2008). The role of conservation agriculture in sustainable agriculture. Philos. Trans. R. Soc. B: Biol. Sci. 363, 543–555. doi: 10.1098/rstb.2007.2169
Inra (2018). Base de données géographique des sols de France à 1/1 000 000 version 3.2.8.0, 10/09/1998 (Paris, France:Portail Data INRAE).
Jat M. L., Chakraborty D., Ladha J. K., Rana D. S., Gathala M. K., Mcdonald A., et al. (2020). Conservation agriculture for sustainable intensification in south Asia. Nat. Sustainability 3, 336–343. doi: 10.1038/s41893-020-0500-2
Kassam A., Friedrich T., Derpsch R. (2019). Global spread of conservation agriculture. Int. J. Environ. Stud. 76, 29–51. doi: 10.1080/00207233.2018.1494927
Kertész Á., Madarász B. (2014). Conservation agriculture in Europe. Int. Soil Water Conserv. Res. 2, 91–96. doi: 10.1016/S2095-6339(15)30016-2
Larsen A. E., Noack F. (2017). Identifying the landscape drivers of agricultural insecticide use leveraging evidence from 100,000 fields. Proc. Natl. Acad. Sci. 114, 5473–5478. doi: 10.1073/pnas.1620674114
Laurent F. (2015) L’Agriculture de conservation et sa diffusion en France et dans le monde. Cybergeo: Eur. J. Geogr. doi: 10.4000/cybergeo.27284
Lechenet M., Dessaint F., Py G., Makowski D., Munier-Jolain N. (2017a). Reducing pesticide use while preserving crop productivity and profitability on arable farms. Nat. Plants 3, 17008. doi: 10.1038/nplants.2017.8
Lechenet M., Dessaint F., Py G., Makowski D., Munier-Jolain N. (2017b). Reducing pesticide use while preserving crop productivity and profitability on arable farms. Nat. Plants 3, 17008. doi: 10.1038/nplants.2017.8
Lechenet M., Makowski D., Py G., Munier-Jolain N. (2016). Profiling farming management strategies with contrasting pesticide use in France. Agric. Syst. 149, 40–53. doi: 10.1016/j.agsy.2016.1008.1005
Lenth R. (2019) Emmeans: Estimated marginal means, aka least-squares means. Available at: https://CRAN.R-project.org/package=emmeans.
McCalla T., Army T. (1961). Stubble mulch farming. Adv. Agron. 13, 125–196. doi: 10.1016/S0065-2113(08)60958-X
Mirsky S. B., Ryan M. R., Teasdale J. R., Curran W. S., Reberg-Horton C. S., Spargo J. T., et al. (2013). Overcoming weed management challenges in cover crop–based organic rotational no-till soybean production in the Eastern united states. Weed Technol. 27, 193–203. doi: 10.1614/WT-D-12-00078.1
Mondal S., Chakraborty D., Bandyopadhyay K., Aggarwal P., Rana D. S. (2020). A global analysis of the impact of zero-tillage on soil physical condition, organic carbon content, and plant root response. Land Degradation Dev. 31, 557–567. doi: 10.1002/ldr.3470
Mulumba L. N., Lal R. (2008). Mulching effects on selected soil physical properties. Soil Tillage Res. 98, 106–111. doi: 10.1016/j.still.2007.10.011
Munier-Jolain N., Lechenet M. (2020). Methodological considerations for redesigning sustainable cropping systems: the value of data-mining large and detailed farm data sets at the cropping system level. Front. Agric. Sci. Eng. 7, 21–27. doi: 10.15302/J-FASE-2019292
Nicoloso R. S., Rice C. W. (2021). Intensification of no-till agricultural systems: An opportunity for carbon sequestration. Soil Sci. Soc. America J. 85, 1395–1409. doi: 10.1002/saj2.20260
OECD (2001) Environmental indicators for agriculture, volume 3: Methods and results. Available at: www.oecd.org/tad/sustainable-agriculture/40680869.pdf (Accessed 2016 Jan. 26).
Osipitan O. A., Dille J. A., Assefa Y., Radicetti E., Ayeni A., Knezevic S. Z. (2019). Impact of cover crop management on level of weed suppression: a meta-analysis. Crop Sci. 59, 833–842. doi: 10.2135/cropsci2018.09.0589
Pinheiro J., Bates D. (2006). Mixed-effects models in s and s-PLUS (London, UK:Springer science & business media).
Pinheiro J., Bates D., Debroy S., Sarkar D., Heisterkamp S., Van Willigen B., et al. (2017). Package ‘nlme’. linear and nonlinear mixed effects models, version 3.
Pittelkow C. M., Liang X., Linquist B. A., Van Groenigen K. J., Lee J., Lundy M. E., et al. (2015). Productivity limits and potentials of the principles of conservation agriculture. Nature 517, 365–368. doi: 10.1038/nature13809
Powlson D. S., Stirling C. M., Jat M. L., Gerard B. G., Palm C. A., Sanchez P. A., et al. (2014). Limited potential of no-till agriculture for climate change mitigation. Nat. Climate Change 4, 678–683. doi: 10.1038/nclimate2292
Powlson D. S., Stirling C. M., Thierfelder C., White R. P., Jat M. L. (2016). Does conservation agriculture deliver climate change mitigation through soil carbon sequestration in tropical agro-ecosystems? Agric. Ecosyst. Environ. 220, 164–174. doi: 10.1016/j.agee.2016.01.005
Reich J., Paul S. S., Snapp S. S. (2021). Highly variable performance of sustainable intensification on smallholder farms: A systematic review. Global Food Secur. 30, 100553. doi: 10.1016/j.gfs.2021.100553
Reicosky D. C. (2015). Conservation tillage is not conservation agriculture. J. Soil Water Conserv. 70, 103A–108A. doi: 10.2489/jswc.70.5.103A
Rincon-Florez V. A., Dang Y. P., Crawford M. H., Schenk P. M., Carvalhais L. C. (2016). Occasional tillage has no effect on soil microbial biomass, activity and composition in vertisols under long-term no-till. Biol. Fertility Soils 52, 191–202. doi: 10.1007/s00374-015-1066-4
Rochette P. (2008). No-till only increases N2O emissions in poorly-aerated soils. Soil Tillage Res. 101, 97–100. doi: 10.1016/j.still.2008.07.011
Ruscoe W. A., Brown P. R., Henry S., Van De Weyer N., Robinson F., Hinds L. A., et al. (2021). Conservation agriculture practices have changed habitat use by rodent pests: Implications for management of feral house mice. J. Pest. Sci. 95(1), 493–503. doi: 10.1007/s10340-021-01370-7
Rusinamhodzi L. (2015). “Crop rotations and residue management in conservation agriculture,” in Conservation agriculture (Springer), 21–37. doi: 10.1007/978-3-319-11620-4_2
Salembier C., Segrestin B., Weil B., Jeuffroy M.-H., Cadoux S., Cros C., et al. (2021). A theoretical framework for tracking farmers’ innovations to support farming system design. Agron. Sustain. Dev. 41, 1–23. doi: 10.1007/s13593-021-00713-z
Scaccini D., Panini M., Chiesa O., Nicoli Aldini R., Tabaglio V., Mazzoni E. (2020). Slug monitoring and impacts on the ground beetle community in the frame of sustainable pest control in conventional and conservation agroecosystems. Insects 11, 380. doi: 10.3390/insects11060380
Schauberger B., Ben-Ari T., Makowski D., Kato T., Kato H., Ciais P. (2018). Yield trends, variability and stagnation analysis of major crops in France over more than a century. Sci. Rep. 8, 1–12. doi: 10.1038/s41598-018-35351-1
Schils R., Olesen J. E., Kersebaum K.-C., Rijk B., Oberforster M., Kalyada V., et al. (2018). Cereal yield gaps across Europe. Eur. J. Agron. 101, 109–120. doi: 10.1016/j.eja.2018.09.003
Scopel E., Triomphe B., Affholder F., Da Silva F. A. M., Corbeels M., Xavier J. H. V., et al. (2013). Conservation agriculture cropping systems in temperate and tropical conditions, performances and impacts. a review. Agron. Sustain. Dev. 33, 113–130. doi: 10.1007/s13593-012-0106-9
Smith R. G., Warren N. D., Cordeau S. (2020). Are cover crop mixtures better at suppressing weeds than cover crop monocultures? Weed Sci. 68, 186–194. doi: 10.1017/wsc.2020.12
Strehlow B., De Mol F., Gerowitt B. (2020). Herbicide intensity depends on cropping system and weed control target: unraveling the effects in field experiments. Crop Prot. 129, 105011. doi: 10.1016/j.cropro.2019.105011
Swanton C. J., Shrestha A., Knezevic S. Z., Roy R. C., Ball-Coelho B. R. (2000). Influence of tillage type on vertical weed seedbank distribution in a sandy soil. Can. J. Plant Sci. 80, 455–457. doi: 10.4141/P99-020
Teasdale J. R., Abdul-Baki A. A., Mill D., Thorpe K. W. (2002). “Enhanced pest management with cover crop mulches,” in XXVI international horticultural congress: Sustainability of horticultural systems in the 21st century 638, 135–140.
Teasdale J. R., Beste C. E., Potts W. E. (1991). Response of weeds to tillage and cover crop residue. Weed Sci. 39, 195–199. doi: 10.1017/S0043174500071460
Tittonell P., Shepherd K. D., Vanlauwe B., Giller K. E. (2008). Unravelling the effects of soil and crop management on maize productivity in smallholder agricultural systems of western Kenya–an application of classification and regression tree analysis. Agric. Ecosyst. Environ. 123, 137–150. doi: 10.1016/j.agee.2007.05.005
Trichard A., Alignier A., Chauvel B., Petit S. (2013). Identification of weed community traits response to conservation agriculture. Agric. Ecosyst. Environ. 179, 179–186. doi: 10.1016/j.agee.2013.08.012
Verret V., Pelzer E., Bedoussac L., Jeuffroy M.-H. (2020). Tracking on-farm innovative practices to support crop mixture design: The case of annual mixtures including a legume crop. Eur. J. Agron. 115, 126018. doi: 10.1016/j.eja.2020.126018
Walter N. (2020). Matériel agricoles : coûts des opérations culturales 2020 (Paris, France:APCA). Available at: https://chambres-agriculture.fr/publications/toutes-les-publications/la-publication-en-detail/actualites/couts-des-operations-culturales-2020-des-materiels-agricoles/.
Weisberger D., Nichols V., Liebman M. (2019). Does diversifying crop rotations suppress weeds? a meta-analysis. PloS One 14, e0219847. doi: 10.1371/journal.pone.0219847
West T., Marland G. (2002). Net carbon flux from agricultural ecosystems: methodology for full carbon cycle analyses. Environ. Pollut. 116, 439–444. doi: 10.1016/S0269-7491(01)00221-4
Wezel A., Bellon S., Doré T., Francis C., Vallod D., David C. (2009). Agroecology as a science, a movement and a practice. a review. Agron. Sustain. Dev. 29, 503–515. doi: 10.1051/agro/2009004
Williams M. M. II, Davis A. S., Rabaey T. L., Boerboom C. M. (2009). Linkages among agronomic, environmental and weed management characteristics in north American sweet corn. Field Crops Res. 113, 161–169. doi: 10.1016/j.fcr.2009.05.005
Zhao X., Liu S. L., Pu C., Zhang X. Q., Xue J. F., Zhang R., et al. (2016). Methane and nitrous oxide emissions under no-till farming in China: a meta-analysis. Global Change Biol. 22, 1372–1384. doi: 10.1111/gcb.13185
Keywords: no-till, direct seeding, cover crop, tillage, crop diversification, cropping system, pesticide use, sustainability
Citation: Adeux G, Guinet M, Courson E, Lecaulle S, Munier-Jolain N and Cordeau S (2022) Multicriteria assessment of conservation agriculture systems. Front. Agron. 4:999960. doi: 10.3389/fagro.2022.999960
Received: 21 July 2022; Accepted: 02 November 2022;
Published: 01 December 2022.
Edited by:
Eric Justes, Centre de Coopération Internationale en Recherche Agronomique pour le Développement (CIRAD), FranceReviewed by:
Luca Bragazza, Agroscope, SwitzerlandAntoine Couëdel, Institut National de la Reche, France
Copyright © 2022 Adeux, Guinet, Courson, Lecaulle, Munier-Jolain and Cordeau. This is an open-access article distributed under the terms of the Creative Commons Attribution License (CC BY). The use, distribution or reproduction in other forums is permitted, provided the original author(s) and the copyright owner(s) are credited and that the original publication in this journal is cited, in accordance with accepted academic practice. No use, distribution or reproduction is permitted which does not comply with these terms.
*Correspondence: Stéphane Cordeau, c3RlcGhhbmUuY29yZGVhdUBpbnJhZS5mcg==
†ORCID: Guillaume Adeux, orcid.org/0000-0003-0903-391X
Maé Guinet, orcid.org/0000-0001-9904-4692
Nicolas Munier-Jolain, orcid.org/0000-0002-0871-3692
Stéphane Cordeau, orcid.org/0000-0003-1069-8388