 Sajid Rehman
 Muamar Al-Jaboobi
 Ramesh Pal Singh Verma
 Miguel Sanchez Garcia
 Andrea Visioni
- 1Biodiversity and Crop Improvement Program, International Center for Agricultural Research in the Dry Areas (ICARDA), Rabat, Morocco
- 2Western Crop Innovations, Lacombe, AB, Canada
- 3Indian Institute of Wheat and Barley Research (IIWBR), Karnal, India
Net form net blotch (NFNB) caused by Pyrenophora teres f. sp. teres (Ptt) is an emerging barley disease in several countries. It causes severe yield and quality losses due to infection of leaves, kernels, and stems. Owing to the inherent genetic diversity of Ptt, the incorporation of qualitative and quantitative resistance is important to obtain barley cultivars with durable resistance to NFNB. For this purpose, an association mapping panel named HI-AM (high-input association mapping panel) was screened for resistance to NFNB at the seedling stage with two virulent Moroccan Ptt isolates (Ptt40–3 and Ptt45-3) under controlled conditions, and at the adult plant stage at four hot spot locations in Morocco during different cropping seasons (2016–17 and 2017–18). Genome-wide association mapping (GWAM) was conducted using 13,182 PAV (presence or absence variations) and 6,311 single-nucleotide polymorphism (SNP) markers for mapping of seedling and adult plant resistance quantitative trait loci (QTLs). GWAM analysis revealed 19 QTLs for the seedling stage and 35 QTLs for the adult plant stage resistance. Of the 54 QTLs detected, 38 QTLs from this study overlapped with previously reported QTLs, while 16 QTLs were novel. Furthermore, two common seedling stage resistance and six common adult plant stage QTLs were detected, while only three QTLs overlapped for both growth stages. Seedling stage QTLs together explained 40% of the genetic variance for seedling resistance to Ptt isolate Ptt40-3, and 69% for isolate Ptt45-3, whereas the genetic variance of the QTLs for adult plant stage resistance ranged from 35% to 85%. This panel was previously used for other GWAM studies, including resistance to spot blotch and stripe rust of barley. By mapping of significant markers for three different diseases on the Morex genome version 3.0, we have identified 13 common QTLs associated with resistance to net blotch and spot blotch, and three QTLs associated with resistance to all three diseases. The identification and introgression of common QTLs conditioning resistance to three pathogens could help in attaining durable disease-resistance in barley in North Africa.
Introduction
Barley (Hordeum vulgare L.) has the remarkable ability to grow under harsh growing conditions of low rainfall and fluctuating temperatures. It ranks as the second cereal crop of Morocco in terms of acreage after wheat, where it is primarily used for animal feed, followed by food and beverage purposes. In 2021, barley was grown on an area of 1.48 million hectares (ha) with an average grain yield of 1.86 tons per ha, which was significantly lower than the average grain yield of 3.96 t/ha in Europe. Due to its high demand, Morocco imported barley from Germany, the United Kingdom, Ukraine, Estonia, and Lithuania, worth $93.5 m in 2021 (FAO (Food and Agriculture Organization of the United Nations), 2021).
In addition to unpredictable abiotic factors, biotic stresses such as net form net blotch (NFNB), powdery mildew, scald, and leaf rust limit barley grain and straw yields in Morocco. During the disease surveys of 2015 to 2018 in Morocco, net blotch incidence of 100% and the percent leaf area disease (PLAD) ranged from 40% to 80%, making it unarguably the most destructive barley disease (Rehman et al. unpublished data). Furthermore, Yousfi and Ezzahiri (2002) reported annual yield losses of 29% in barley in Morocco due to NFNB infection. In addition to quantitative losses, NFNB infection reduces feed and malt quality by reducing kernel plumpness owing to the infection of grains and production of toxins (Mathre, 1997; Grewal et al., 2008).
Net blotch exists in two forms. Pyrenophora teres f. teres (Ptt) is the causal agent of net form net blotch, and P. teres f. maculata is the causal agent of spot form net blotch (SFNB) (Tekauz, 1990). For both forms of net blotch, the infection starts initially as a small circular to elliptical brownish lesion. NFNB lesions expand into longitudinal necrotic streaks and produce a net-type pattern surrounded by chlorotic tissue on susceptible genotypes. In contrast, SFNB inflicts circular to elliptical lesions surrounded by chlorosis. However, different lesion types may be observed due to the interaction between barley genotype and net blotch isolate (McDonald, 1967; Smedegård-Petersen, 1971; Mathre, 1997). It is sometimes difficult to distinguish between the forms under field conditions, but they can easily be discriminated by molecular markers (Liu et al., 2012). Great virulence diversity within P. teres f. teres isolates exists globally due to its ability to reproduce sexually and asexually (Khan and Boyd, 1969; Tekauz, 1990; Steffenson and Webster, 1992; Mathre, 1997; Serenius et al., 2005; Liu et al., 2011). Anisimova et al. (2017) identified 153 pathotypes after screening 1,162 Ptt isolates from Europe, Syria, and Canada. Likewise, Jebbouj and El Yousfi (2010) classified 61 Ptt isolates from Morocco into 10 pathotypes. Later, Taibi et al. (2016) also reported eight Ptt pathotypes after a virulence study of 15 Ptt isolates from Morocco. The Moroccan barley cultivar Rabat 071 was released in 1956, and it displayed stable resistance to Ptt for almost 50 years (Jonsson et al., 1997; Jebbouj and El Yousfi, 2010). However, more recently, Rabat 071 has displayed susceptibility to Moroccan Ptt isolates (Taibi et al., 2016).
The deployment of net blotch-resistant cultivars can curb the inflicted yield losses. Though net blotch can be controlled effectively with the judicious use of fungicides, it can increase the cost of production substantially. Additionally, there is a risk of the pathogen population developing fungicide resistance. Barley is a low-input crop in Morocco, and the most cost-effective and environmentally friendly way to ensure yield stability is to introduce barley varieties resistant to net blotch. The importance of the use of net blotch-resistant varieties was experimentally proven by Yousfi and Ezzahiri (2002), where the resistant varieties of barley outyielded the susceptible varieties by 39% without the use of fungicides and by 56% with the use of fungicides.
The identification and deployment of new sources of net blotch resistance into the elite barley germplasm by marker-assisted selection (MAS) is pivotal for the stable production of barley. Although no NFNB resistance gene has been cloned, the resistance and/or susceptibility loci from the barley genome have been reported against Ptt (Liu et al., 2011; Clare et al., 2020). Different reported Ptt resistant loci include Rpt1 on chromosome 3H (Bockelman et al., 1977), Rpt2 on chromosome 1H (Bockelman et al., 1977), Rpt3 on the chromosome 2H (Bockelman et al., 1977), Rpt4 on the chromosome 7H (Williams et al., 1999, 2003), Rpt5 on the chromosome 6H (Manninen et al., 2006; Richards et al., 2016), Rpt6 on the chromosome 5H (Manninen et al., 2006), and Rpt7 on the chromosome 4H (Franckowiak and Platz, 2013). The use of bi-parental mapping populations coupled with genotyping has shown their efficacy in identifying both the resistance and/or susceptibility Ptt loci from the barley genome (Steffenson et al., 1996; Cakir et al., 2003; Ma et al., 2004; Friesen et al., 2006; Manninen et al., 2006; Lehmensiek et al., 2007; Grewal et al., 2008; St. Pierre et al., 2010). More frequently, these studies identified resistance/susceptibility quantitative trait loci (QTLs) near the centromere of chromosome 6H. Although map-based cloning approaches have been highly successful, their mapping resolution was often poor due to low allelic diversity and recombination events (Zhu et al., 2008). Moreover, the identified QTLs are population-specific, and their segregation pattern, expression, and effectiveness can be variable depending upon the environment (Sneller et al., 2009). Recently, association mapping has successfully identified resistance/susceptibility loci against Ptt from all barley chromosomes using diverse germplasm collections (Richards et al., 2017; Vatter et al., 2017; Wonneberger et al., 2017; Amezrou et al., 2018; Adhikari et al., 2019; Daba et al., 2019; Novakazi et al., 2019; Rozanova et al., 2019). In association mapping (AM) or linkage disequilibrium (LD) mapping, statistical assessments infer associations between genotypes and traits of interest based on molecular markers. Without any restriction on the type of germplasm (breeding lines, land races, wild progenitors), high mapping resolution can be achieved due to large allelic diversity and enrichment of polymorphic markers. Furthermore, AM is quite efficient, as in addition to the underlying QTLs, it may elucidate the causal polymorphism in the candidate gene itself or in its proximity, depending on the LD decay (Meuwissen and Goddard, 2000; Cockram et al., 2010).
Considering the epidemic nature and the inherent virulence diversity of net blotch, there is a huge gap in terms of sources of resistance and the use of genomic resources for developing resistant barley varieties in Morocco by pyramiding net blotch resistance genes. This study was intended to identify barley accessions resistant to net form net blotch in the high-input association mapping (HI-AM) panel, and to identify genomic regions implicated in disease resistance/susceptibility using genome-wide association mapping (GWAM) at the seedling and adult plant stages.
Materials and methods
Plant material
A HI-AM panel of 261 barley genotypes was used in this study (Visioni et al., 2018). There were 172 two-row type and 89 six-row type genotypes included in this panel, representing 124 genotypes from the International Center for Agriculture Research in the Dry Area’s (ICARDA) barley breeding program destined for high-input or optimum management conditions, 32 genotypes from Europe, 34 genotypes from North America, 67 genotypes from South America, and 4 genotypes from Australia. The full list of barley genotypes has been presented in Supplementary Table S1.
Seedling screening with the Moroccan P. teres f. sp. teres isolates
The Ptt isolates (Ptt40–3 and Ptt45-3) used in this study were isolated from infected barley leaf samples collected from farmers’ fields during disease surveys from 2015 to 2018 in Morocco. These surveys were conducted in mid-to-late April at the head emergence to hard dough stages. All of the fields were sampled in a diamond pattern from five points that were at least 25 meters apart. From each sampling point, five penultimate leaves were collected, and the PLAD was estimated as an average of 25 leaf samples.
Two Moroccan Ptt isolates were used for the seedling resistance test (SRT). The Ptt isolate Ptt40–3 was isolated from the barley cultivar Rabat 071, collected from a farmer’s field in the Abda region (latitude: 32° 17’ 3.876”, longitude -9° 8’ 9.168”), whereas the other Ptt isolate Ptt45–3 was isolated from Rabat 071 from a farmer’s field in the Dokhala region (latitude: 32° 39’ 16.956”, longitude -8° 39’ 41.8314”) of Morocco during the disease survey in 2016. Both of the Ptt isolates displayed a virulent reaction on the barley cultivar Rabat 071. Furthermore, their virulence spectrum was checked on 31 differential cultivars of barley under controlled conditions (Supplementary Table S2).
For the preparation of pure isolates, the infected barley tissue was cut into small pieces of 0.2–0.5 cm, followed by incubation in 50% ethanol for 30 sec and then in 0.5% commercial bleach solution for 90 sec. The leaf segments were then washed three times with sterile water for 5 minutes and dried in two layers of sterile Whatman filter paper under aseptic conditions. Finally, the surface-sterilized leaf segments were incubated on PDA (potato dextrose agar) for 2–3 days. Single conidia were picked under the stereomicroscope with 40x magnification, followed by incubation on V8PDA plates (150 mL of V8 juice, 1.5% agarose, 3 g of CaCO3, and 850 mL of de-ionized water). The Ptt isolates were preserved at -80°C as dried agar plugs, and the inoculum was prepared as described by Friesen et al. (2006). Briefly, individual dry agar plugs from -80°C were incubated on V8PDA plates, which were incubated in the dark at 21°C for 5 days. Then the plates were exposed to light for 24 hours at 21°C to induce conidiophore formation. Eventually, the plates were incubated in the dark for 24 hours at 15°C to induce conidiation. Finally, the plates were flooded with sterile water and the surface of the agar was scraped with a sterile glass slide, followed by filtration through a sterile cheesecloth. The inoculum conc. was adjusted to 3,000 conidia per mL, and 0.01% of Tween 20 was added just before inoculation.
Four to five seeds of each barley genotype were sown in peat moss supplemented with NPK fertilizer (14-14-14) in cone-tainers (Steuwe & Sons, Inc., Tangent, OR, USA), measuring 14 cm in length and 3.8 cm in diameter. Each tray had 98 cone-tainers and each trial had three replications. Two barley cultivars, Rihan 03 and Annoucer, were used as susceptible checks and Taffa was used as a resistant check. The seedlings were sown and raised in the growth chamber (Model MC1750; Snijder Scientific, Tilberg, Netherlands) with a photoperiod regime of 16 h light and 8 h dark at 20 ± 1°C at ICARDA, Rabat, Morocco. Approximately 10- to 12-day-old seedlings with their second leaf fully extended were inoculated with hand-held sprayers until runoff, followed by incubation in 100% relative humidity in the dark in a growth chamber at 20 ± 1°C. Then, the plants were kept in the growth chamber with the photoperiod and temperature regime described above. Seven days after inoculation, net blotch severity was assessed from the second leaf on a scale of 0 to 10, with 1 being highly resistant and 10 being highly susceptible as described by Tekauz (1985). The mean disease score from three independent replications was used for further genetic analysis.
Adult plant stage screening for net blotch resistance
The net blotch resistance of HI-AM barley genotypes at the adult plant stage was assessed at three research stations of the National Institute for Agricultural Research (INRA) of Morocco. The field trials were conducted at Sidi Allal Tazi (34˚ 52′ N, 6˚32′ W) in 2016–17 (SAT17), in 2017–18 (SAT18) at Jemaa Shaim (32˚24′ N 8˚46′ W) in 2017-18 (JS18), and at Marchouch (33˚56′ N, 6˚63′ W) in 2017–18 (MCH18). The planting was done in December at all field locations except at JS17, where the planting was done in November. For each field trial, each genotype was sown as a paired row of 1 meter in an augmented design, with each block consisting of 20 test genotypes. Two susceptible checks (Rihan-03 and Annoucer) and one resistant check were repeated after every 10 test genotypes. Furthermore, each block was surrounded by a border composed of a mixture of net blotch susceptible barley cultivars.
All three field trials were artificially inoculated with net form net blotch except JS18, which was only inoculated with infested straw. Initially, net blotch-infested straw from the previous cropping season was spread in the field at the growth stage at GS30 (Zadoks et al., 1974). For artificial inoculations (SAT17, SAT18, MCH18), an inoculum composed of 10 net form net blotch isolates originating from diverse regions of Morocco was used to inoculate the trials twice. The first inoculation was done at GS30 (beginning of stem elongation), and the second inoculation was done after 15 days. Furthermore, the disease establishment was encouraged using sprinkler irrigation daily in the late afternoon. An average net blotch severity was estimated from 10–15 randomly chosen plants of each genotype at GS 73–75 using a 0–9 scale (Saari and Prescott, 1975), and the barley genotypes were classified into either resistant (R; 0–2), moderately resistant (MR; 3–4), moderately susceptible (MS; 5–6), and susceptible (S; 7–9).
Genotyping, population structure, and linkage disequilibrium of HI-AM
The HI-AM barley panel was genotyped with DArT-Seq technology (Diversity Array Technology Pty Ltd., DArT P/L), and 13,182 PAV (presence or absence variation) and 6,311 SNP (single-nucleotide polymorphism) markers were used after quality control where heterozygous and mono-morphic markers, markers with minor allele frequency (MAF) of < 5%, and markers with missing data > 10% were removed from further analysis.
STRUCTURE software version 2.3.4 (Pritchard et al., 2000) was employed to determine the population structure, and the number of probable sub-groups was confirmed further by using the Bayesian information criterion (BIC), which was generated in R using the adegenet package (The R Development Core Team). In addition, genotypes were assigned to their respective sub-groups with an 80% membership criterion, otherwise, they were considered admixture. Likewise, the LD for all pairs of loci was calculated in TASSEL version 5.0 and the squared allele frequency correlations (r2) were computed with the nlstools package for R (The R Development Core Team) using non-linear regression with a threshold of 0.2 (Hill and Weir, 1988; Remington et al., 2001). More details about genotyping, population structure, and LD analysis have been reported previously in Visioni et al. (2018) and Visioni et al. (2020).
Genome-wide association mapping of net blotch resistance
The seedling and adult plant stage disease assessments were combined with the genotypic data in TASSEL version 5.0 using a general linear model (GLM) and mixed linear model (MLM). The genome-wide association mapping (GWAM) using the GLM model incorporated the Q-matrix from STRUCTURE software (GLM + Q) or the principal component analysis (GLM + PCA) to circumvent type I error. The MLM, however, accounted for the familiar relatedness or kinship (K-matrix derived from TASSEL v. 5.0 using the complete set of markers) in addition to the Q-matrix (MLM + K + Q) and PCA (MLM + K + PCA). After testing multiple models, MLM + K + Q and MLM + K + PCA were identified as the best models (Supplementary Figure S1). A marker-trait association (MTA) was considered significant at p = 0.001 [−log(p) = 3]. Furthermore, LD-adjusted Bonferroni correction was determined and was set to 3.68 -log(p) (p < 0.05) for the HI-AM panel to give more confidence to identified significant markers as described by Duggal et al. (2008) and Visioni et al. (2020). In the output, R2 represents the phenotypic variation explained by the associated significant marker (%), and a positive and negative value in marker effect implicates it either in susceptibility or resistance to net blotch. All of the identified significant MTAs located within a physical distance of 10 mega bases (Mb) were considered to be associated with the same QTL, and the marker with the lowest p-value and the highest R2 represented that QTL.
QTL alignment and candidate genes
For QTL alignment, the sequences of significant markers from this study, and the sequences of the peak markers of QTLs associated with net blotch resistance from previously published studies were mapped on the Morex genome v3 pseudomolecules (2021) using GrainGenes (https://wheat.pw.usda.gov/blast/) and the Barleymap pipeline (Cantalapiedra et al., 2015). Likewise, the marker sequences were used as a query in the built-in BLAST (Basic Alignment Search Tool) search tool in GrainGenes (https://wheat.pw.usda.gov/blast/), and homology-based search using BLAST suit of NCBI (https://blast.ncbi.nlm.nih.gov/Blast.cgi) to identify candidate genes (CGs) in a span of 5 Mb (2.5 Mb left and 2.5 Mb right) of the significant markers at the QTL peak. A highly stringent criteria of sequence identity of 90% to 100% and an expected value of 0 to 1–40 were used while searching for CGs, and it was primarily focused on gene annotations with functional domains implicated in disease resistance in plants.
Results
Seedling resistance to P. teres f. sp. teres
Both Moroccan net form net blotch isolates Ptt40–3 and Ptt45–3 produced uniform infection responses (IRs) in the growth chamber (Supplementary Table S2). The frequency distribution of the infection responses of the HI-AM panel to both Moroccan net form net blotch isolates has been presented in Figure 1A. None of the barley genotypes were immune to both Ptt isolates, while 101 (38.7%) genotypes were resistant to the Ptt isolate Ptt40-3 and 21 (8.0%) genotypes were resistant to the Ptt isolate Ptt45-3. The Ptt isolate Ptt45–3 was more virulent with an average IR of 5.2 compared to Ptt40–3 with an IR of 4.0. Furthermore, 77 (29.5%) and 90 (34.5%) barley genotypes were moderately resistant to the Ptt isolates Ptt40–3 and Ptt45-3, respectively (Figure 1A; Supplementary Table S2).
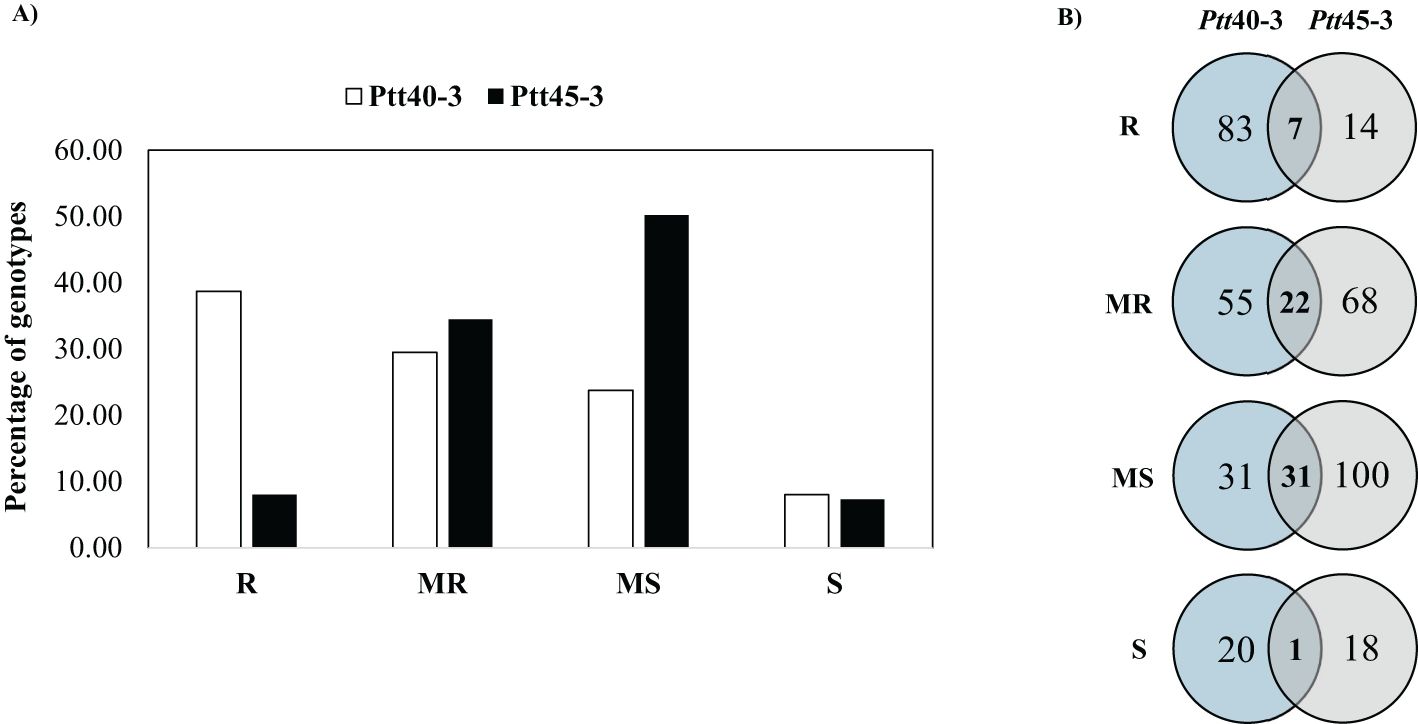
Figure 1. (A) Frequency distribution of net form net blotch resistance in 261 barley genotypes of the HI-AM mapping panel at the seedling stage for Moroccan Pyrenophora teres f. sp. teres isolates Ptt40–3 and Ptt45-3. (B) Venn diagram of infection responses at the seedling stage of 261 barley genotypes of the HI-AM panel to two net form net blotch isolates under controlled conditions. R, resistant; MR, moderately resistant; MS, moderately susceptible; S, susceptible.
Among the tested genotypes, eight genotypes were resistant to both Ptt isolates; three six-row barley genotypes, namely Ciruelo, Zig Zig, and CALI92/ROBUST//PENCO/CHEVRON-IRBAR/3/SLLO/ROBUST//QUINA, and five two-row barley genotypes, namely Kenia, MSEL//CLI18/E.QUEBRACHO, BR2/CANELA, ACUARIO T95, Carina/Moroc9-75, and Shishai. In addition, 22 barley genotypes were moderately resistant to both of Ptt isolates (Figure 1B). Slight differences in IR between two- and six-row barley genotypes were observed for both Ptt isolates. For Ptt40-3, an average IR of 4.1 and 3.8 was observed for the two- and six-row barley genotypes, respectively, whereas, for Ptt45-3, an average IR of 5.2 and 5.0 was observed for the two- and six-row barley genotypes, respectively.
Screening for adult plant stage resistance
The frequency distribution of net blotch disease severity in the HI-AM panel for four field locations, i.e., Marchouch (MCH18), Jemaa Shiam (JS18), and Sidi Allal Tazi (SAT17 and SAT18), has been presented in Figure 2, and the disease severity of all the genotypes has been presented in Supplementary Table S1. An average disease severity of 4.3 ± 1.1, 5.2 ± 1.2, and 5.2 ± 1.2 was observed for SAT17, SAT18, and MCH18, respectively. However, for the naturally infected trial at Jemaa Shiam (JS18), a disease severity of 3.3 ± 1.1 was observed. No significant differences were observed between the disease severity of two- and six-row barley genotypes, and none of the genotypes were resistant at all locations. Furthermore, 32 barley genotypes (23 two-row and 9 six-row genotypes) were resistant/moderately resistant at all four field locations (Table 1), and five barley genotypes were R/MR at both the SRT and APS: ND18919/ND19119-1, Multum, Gobernadora (two-row), Sen, and Misratch (six-row).
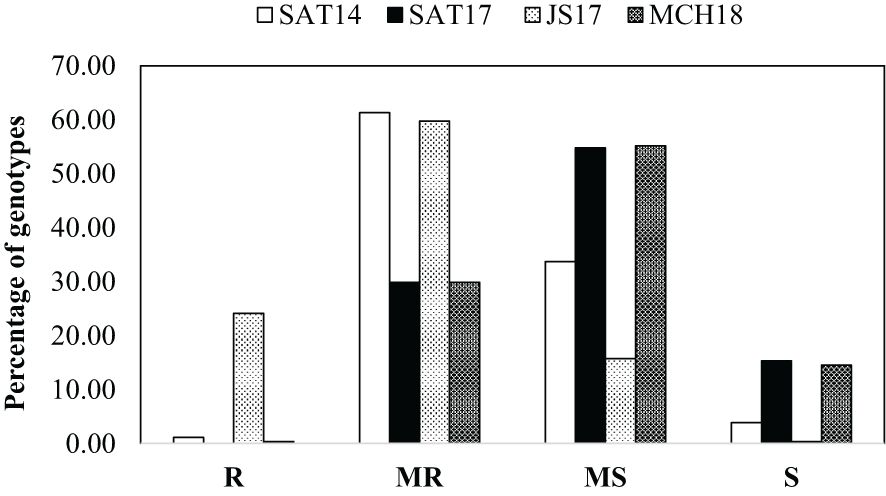
Figure 2. Frequency distribution of net form net blotch resistance in 261 barley genotypes of the HI-AM mapping panel at the adult plant stage at the National Institute for Agricultural Research stations at Sidi Allal Tazi in 2016–17 (SAT17) and 2017–18 (SAT18), at Jemaa Shaim in 2017–18 (JS18), and at Marchouch in 2017–18 (MCH18). R, resistant; MR, moderately resistant; MS, moderately susceptible; S, susceptible.
Table 1. Resistant (R) and moderately resistant (MR) barley genotypes in the HI-AM panel at the adult plant stage at four field locations in Morocco at Sidi Allal Tazi in 2016–17 (SAT17) and 2017–18 (SAT18), at Jemaa Shaim in 2017–18 (JS18), and at Marchouch in 2017–18 (MCH18).
Population structure and linkage disequilibrium
After quality control, the final set of 19,493 markers (13,182 PAVs and 6,311 SNPs) was used for determining population structure, which revealed the presence of three sub-populations (Figure 3A) on the basis of the STRUCTURE software (Pritchard et al., 2000) output and delta-k (Evanno et al., 2005) analysis, as described previously by Visioni et al. (2018). The presence of three sub-populations was further confirmed by the BIC estimate in R Statistical Software (The R Development Core Team). Based on the intra-chromosomal squared allele frequency correlations (r2) of paired loci, the LD of the HI-AM panel was estimated to be 4 cM (Figure 3B), which corresponded with 4.3 Mb, indicating that this association panel interrogated the 987.65 cM of our association mapping panel via 246 “loci hypotheses,” and hence the Bonferroni correction for this panel was set to 3.68 −log(p) (p < 0.05) (Visioni et al., 2020).
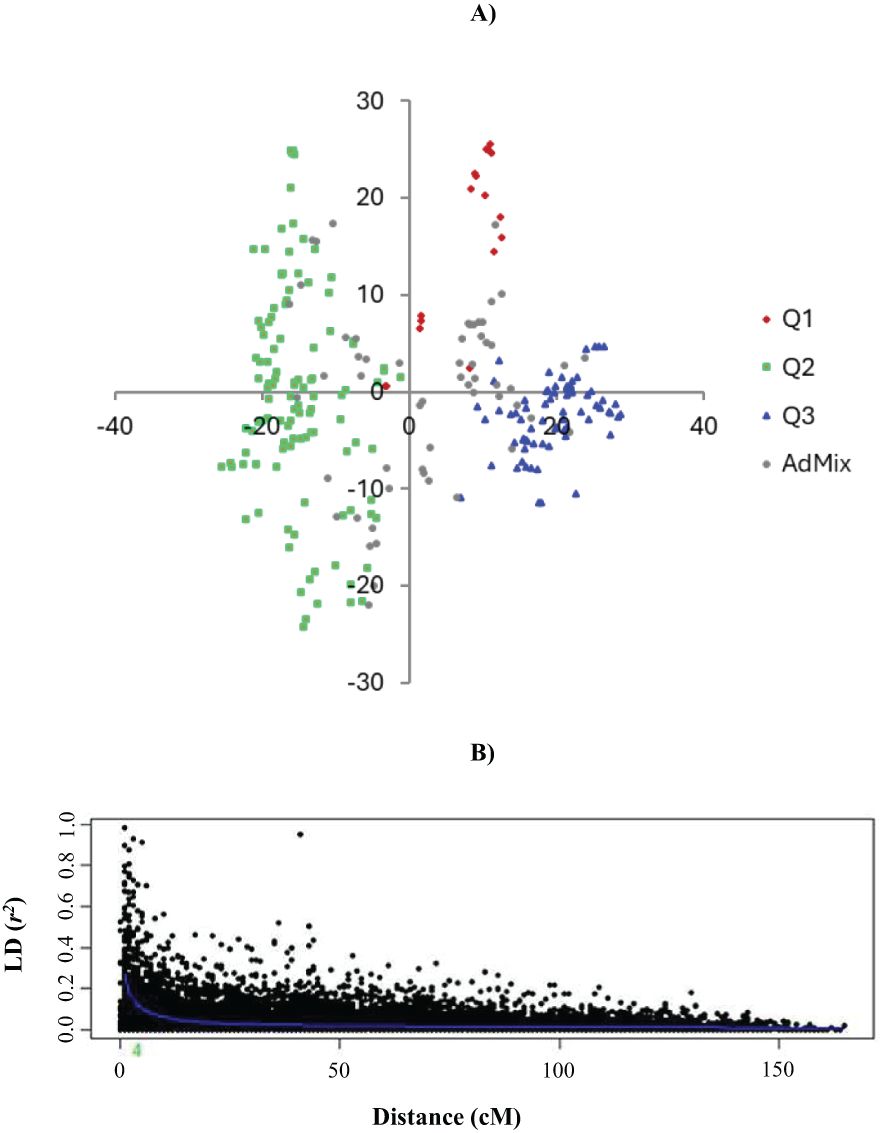
Figure 3. Population structure and linkage disequilibrium (LD). (A) Principal component analysis of the HI-AM panel and (B) LD of the whole barley genome.
Genome-wide association mapping of net blotch resistance at the seedling stage
At the seedling stage, MLM models with kinship (K) and population structure (Q) or PCA (MLM + K + Q and MLM + K + PCA) produced identical outputs and hence were identified as the best models for the GWAS in TASSEL version 5.0. The Q-Q plots of different tested models have been included as Supplementary Materials (Supplementary Figures S1, S2). Overall, 38 MTAs corresponded to 19 QTLs at the seedling stage on all barley chromosomes (Table 2).
Table 2. Summary of QTLs associated with the seedling stage resistance against two Moroccan Pyrenophora teres f. teres isolates Ptt40-3 and Ptt45-3.
For the seedling stage, our GWAM analysis detected 19 QTLs for Ptt isolates Ptt40–3 and Ptt45-3 (Figure 4, Table 2). In the case of the Ptt isolate Ptt40-3, 8 QTLs were deduced from 11 MTAs detected on chromosomes 2, 3, 4, and 6H. The markers’ R2 ranged from 4.2% to 6.2%, explaining a total of 40.1% of the total phenotypic variance, while the marker effect ranged from 1.94 to -1.29. Furthermore, the greatest phenotypic variation of 6.2% was caused by the peak DaRT marker DaRT3896 associated with the QTL SRT-QPtt40–8 on the chromosome 2H (654.63 Mb), and the largest reduction in disease severity of 12.9% was caused by the SNP marker SNP1539 associated with the QTL SRT-QPtt40–1 on 3H (13.85 Mb). Interestingly, of the eight QTLs, seven have been reported in previous studies, and one QTL was novel.
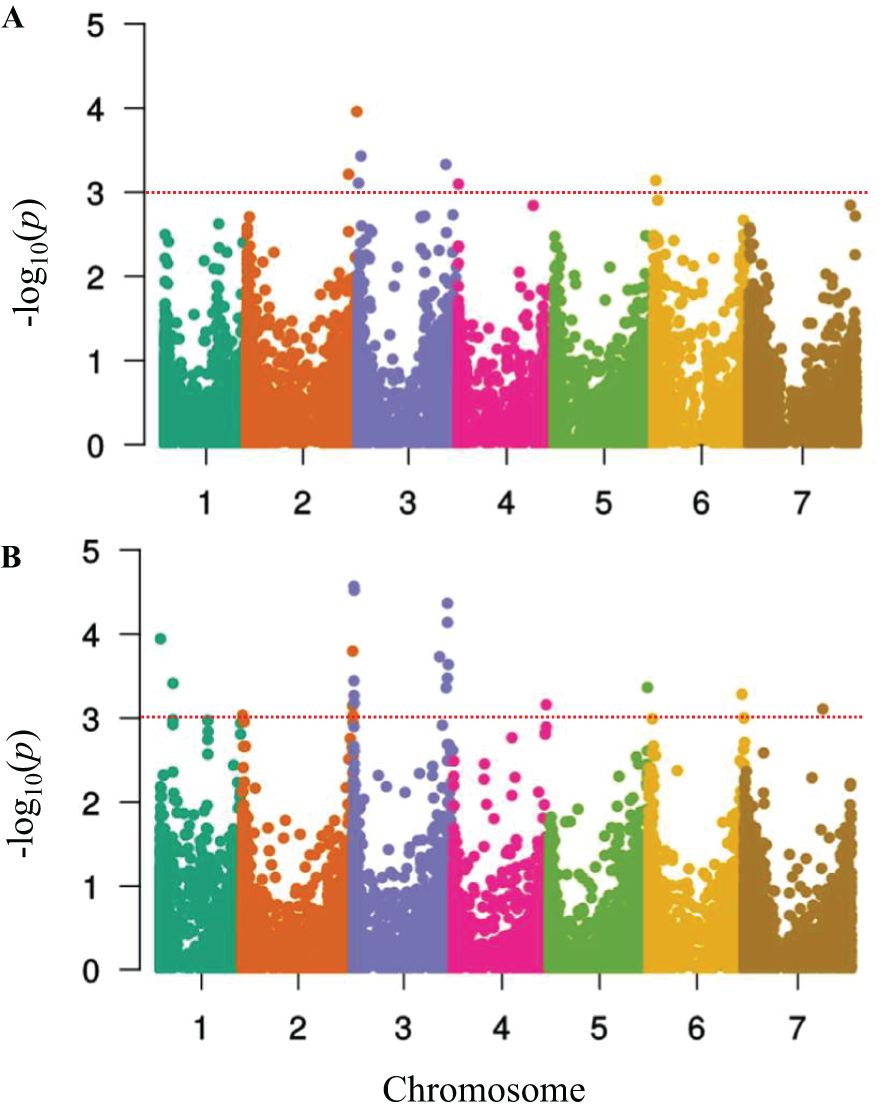
Figure 4. Manhattan plots showing –log10 of p-values from genome-wide association mapping against the positions of SNP and DaRT markers on all chromosomes of barley in the HI-AM panel at the seedling stage. (A) Pyrenophora teres f. sp. teres isolate Ptt45-3 and (B) Pyrenophora teres f. sp. teres isolate Ptt40-3. The p-value threshold (-log10 p-value (0.0005) ≥ 3.68) was used to declare a significant MTA.
Similarly, for the Ptt isolate Ptt45-3, 11 QTLs were deduced from 27 MTAs on all chromosomes of barley (Table 2). The markers’ R2 ranged from 4.4% to 7.5%, explaining a total of 69.1% of phenotypic variance, and the effects ranged from -0.85 to 1.53. Furthermore, the greatest phenotypic variation of 7.5% was caused by the peak SNP marker SNP211 associated with the QTL SRT-QPtt45–6 on the chromosome 3H (583.20 Mb), and the largest reduction in disease severity of 8.5% was caused by the SNP marker SNP2350 associated with the QTL SRT-QPtt45–7 on 4H (22.42 Mb). Interestingly, of the 11 QTLs detected, six QTLs have been reported before, and five QTL were novel.
Genome-wide association mapping of net blotch resistance at the adult plant stage
At the adult plant stage, MLM models MLM + K + Q and MLM + K + PCA were identified as the best models for the GWAS, and the Q-Q plots of all the tested models have been included as Supplementary Materials (Supplementary Figures S1, S2). Overall, 45 MTAs corresponded to 35 QTLs at the adult plant stage on all barley chromosomes, except for chromosome 6H (Table 3).
Table 3. Summary of QTLs associated with the adult plant stage resistance against net form net blotch in Morocco.
For APR-SAT17, 10 QTLs were deduced from 12 MTAs on chromosomes 1H, 2H, 3H, 4H, 5H, and 7H (Figure 5, Table 3). The markers’ R2 ranged from 3.1% to 9.5%, with 66.9% of the total phenotypic variance explained, and the allelic effects ranged from -7.68 to 6.52. Furthermore, the greatest phenotypic variation of 9.5% was caused by the peak SNP marker SNP25 associated with the QTL QSAT17–10 on chromosome 1H (9.75 Mb), and the largest reduction in disease severity of -7.31 was caused by the DaRT marker DaRT1544 associated with the QTL APR-QSAT17–1 on 2H (1.50 Mb). For APR-SAT18, nine QTLs were deduced from 10 MTAs on chromosomes 2H, 3H, 4H, 5H, and 7H. The markers’ R2 ranged from 4.5% to 5.9%, covering 44.9% of the total phenotypic variance, while the marker effect ranged from -0.81 to 0.99. Furthermore, the greatest phenotypic variation of 5.9% was caused by the DaRT11026 marker associated with the QTL APR-QSAT18–7 on 7H (2.88 Mb), and the largest reduction in disease severity of 9% was caused by the DaRT marker DaRT12646 associated with the QTL APR-QSAT18–8 on 7H.
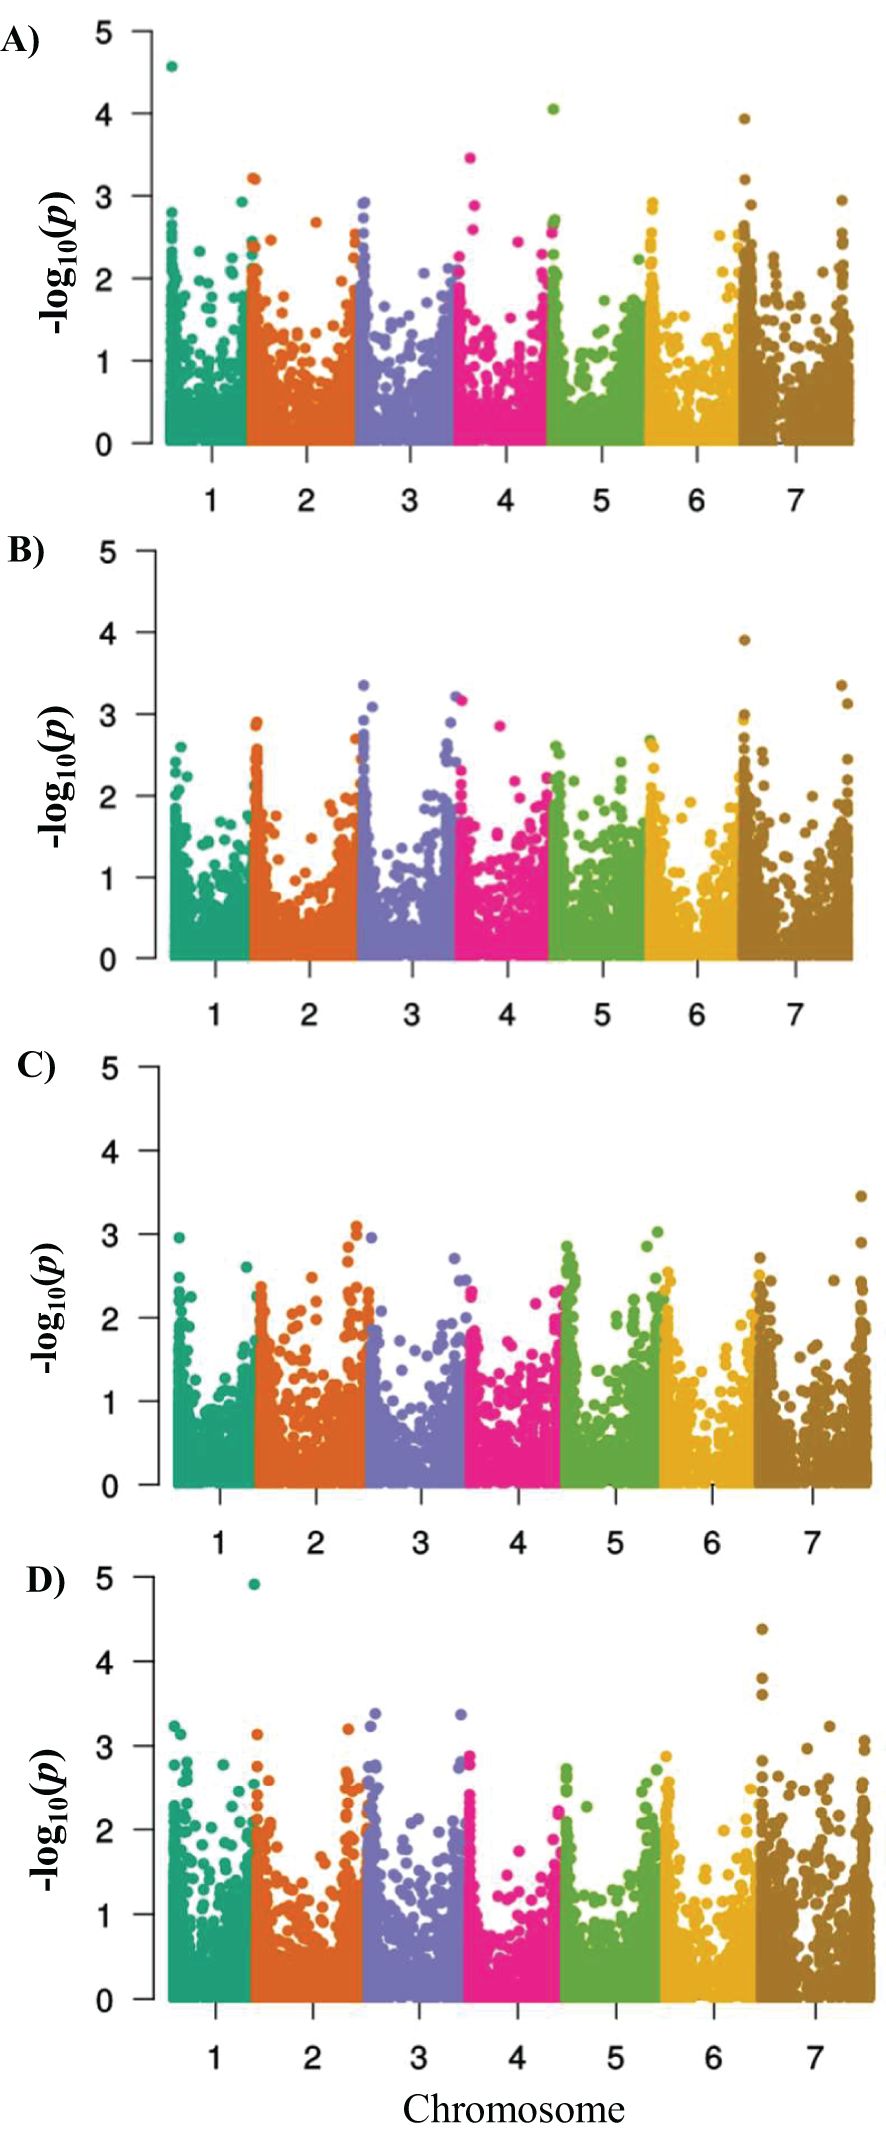
Figure 5. Manhattan plots showing –log10 of p-values from genome-wide association mapping against the positions of SNP and DaRT markers on all chromosomes of barley in the HI-AM panel at the adult plant stage. (A) Sidi Allal Tazi 2016–17 (SAT17), (B) Sidi Allal Tazi 2017–18 (SAT18), (C) Jemaa Shaim 2017–18 (JS18), and (D) Marchouch (MCH18). The p-value threshold (-log10 p-value (0.0005) ≥ 3.68) was used to declare a significant MTA.
For APR-MCH18, 11 QTLs were deduced from 16 MTAs on chromosomes 1H, 2H, 3H, and 7H (Table 3). The markers’ R2 ranged from 4.5% to 8.2%, showing the second highest phenotypic variance of 59.07%. In this case, the marker effect ranged from -0.97 to 0.65. Furthermore, the greatest phenotypic variation of 8.2% was caused by the DaRT1292 marker associated with the QTL APR-QMCH18–10 on 7H (496.71 Mb), and the largest reduction in disease severity of 11% was caused by the DaRT12210 marker associated with the QTL APR-QMCH18–10 on 7H (454.85 Mb).
In the case of APR-JS18, five QTLs were deduced from seven MTAs for APR-JS18 on chromosomes 2H, 4H, 5H, and 7H (Table 3). The markers’ R2 ranged from 4.5% to 5.1%, explaining 24.09% of the total phenotypic variance. The QTL effects ranged from -0.86 to 0.485. Furthermore, the highest phenotypic variation of 5.1% was caused by the DaRT12810 marker associated with the QTL APR-QJS18–5 on 7H (605.23 Mb), and the largest reduction in disease severity of 10% was caused by the SNP marker SNP5121 (14.16 Mb) associated with the QTL APR-QJS18–2 on 4H.
QTLs overlapped with known co-segregating loci
The GWAS of the HI-AM panel detected 54 QTLs, and 38 of them coincided with the previous studies using diverse barley germplasm and net blotch isolates/populations (Tables 2, 3). In the case of Ptt isolate Ptt40-3, seven out of eight QTLs, and for the Ptt45–3 isolate, six out of 11 QTLs were validated by our study. Similarly, for the adult plant stage, 35 out of 45 QTLs were validated. Two common SRT QTLs were detected: SRT-QPtt45–2 and SRT-QPtt40–2 on 2H (653.96–655.70 Mb), and SRT-QPtt45–5 and SRT-QPtt40–6 on 3H (542.44–553.95 Mb). In addition, six common APR QTLs were detected: APR-QMCH18–1 and APR-QSAT17–1 on 1H (9.11–9.75 Mb); APR-QMCH18-3, APR-QMCH18-4, and APR-QJS18–1 on 2H (558.72–568.90 Mb); APR-QSAT17–5 and APR-QMCH18–7 on 3H (557.37–568.42 Mb); APR-QJS18–3 and APR-QSAT18–6 on 5H (32.13–33.66 Mb); APR-QSAT18–7 and APR-QSAT17–9 on 7H (2.88–7.49 Mb); and APR-QSAT18-8, APR-QMCH18-11, and APR-QJS18–5 on 7H (598.71–605.23 Mb). Furthermore, four common QTLs were detected at the seedling and the adult plant stages (Tables 2, 3).
Candidate genes for resistance to Net blotch
Based on the GWAS of the HI-AM panel, 54 QTLs were deduced from 83 MTAs (Tables 2, 3). The sequences of 83 significant markers were queried, and the sequences of 75 markers were located within the high-confidence genes encoding functional proteins involved in diverse cellular functions, including cell signaling, transcription factors, transporters, and disease resistance (Supplementary Tables S3, S4). Among the 75 encoded proteins, 34 proteins showed sequence and functional homology with proteins involved specifically in disease resistance/plant immunity (Table 4). Out of 19 QTLs at the seedling stage, the sequences of 15 markers within the QTL intervals of 11 QTLs showed homology with proteins involved in disease resistance/plant immunity such as receptor-like kinase (HORVU.MOREX.r3.7HG0635910, HORVU.MOREX.r3.3HG0315350), leucine-rich repeat receptor-like protein kinase (HORVU.MOREX.r3.3HG0298090), GDSL esterase/lipase (HORVU.MOREX.r3.3HG0303800), cell wall invertase (HORVU.MOREX.r3.3HG0312870), glucan endo-1,3-beta-glucosidase 7-like (HORVU.MOREX.r3.4HG0338290), and catalase-1 (HORVU.MOREX.r3.4HG0409940) (Table 4; Supplementary Table S3, S4). Likewise, of the 35 QTLs at the adult plant stage, the sequences of 19 markers within the QTL intervals of 17 QTLs showed homology with proteins involved in disease resistance/plant immunity such as NBS-LRR disease resistance protein-like protein (HORVU.MOREX.r3.3HG0313740), wall-associated receptor kinase 4 (HORVU.MOREX.r3.3HG0314070), LRR receptor-like serine/threonine-protein kinase (HORVU.MOREX.r3.6HG0627340), disease resistance protein RPM1 (HORVU.MOREX.r3.6HG0631360), disease resistance protein (TIR-NBS-LRR class) family (HORVU.MOREX.r3.1HG0085940), NBS-LRR disease resistance protein-like protein (HORVU.MOREX.r3.2HG0096080), serine/threonine-protein kinase-like protein CCR4 (HORVU.MOREX.r3.7HG0706130), phosphatidylinositol-4-phosphate 5-kinase (HORVU.MOREX.r3.7HG0752890), aquaporin (HORVU.MOREX.r3.7HG0667130), and acyl transferase 15-like (HORVU.MOREX.r3.2HG0103790) (Table 4; Supplementary Tables S3, S4).
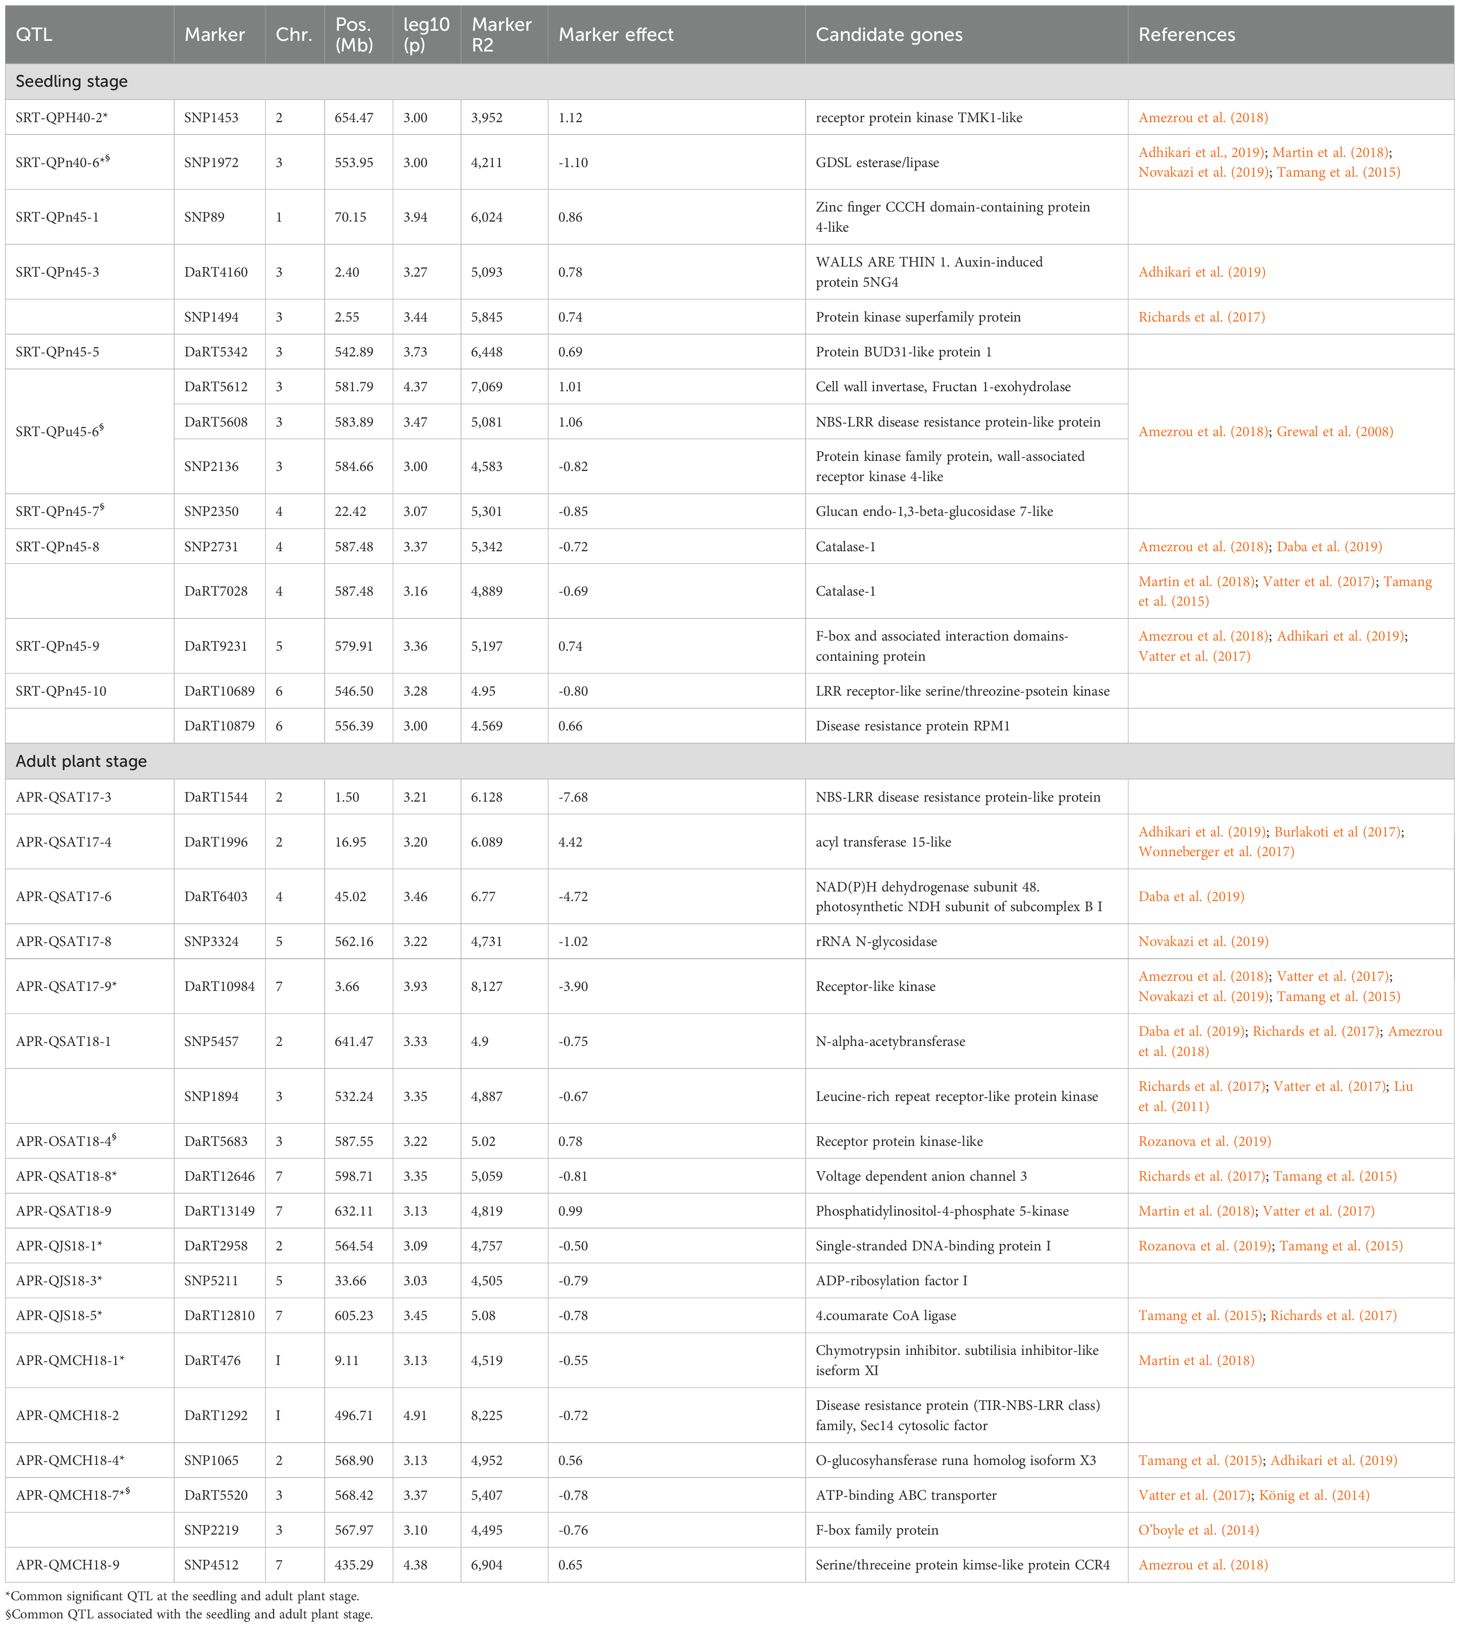
Table 4. A brief list of putative candidate genes associated with QTLs against the seedling and adult plant stage resistance/susceptibility to net blotch in Morocco.
Discussion
In the context of resistance breeding, the understanding of pathogen population virulence dynamics in the target region and the use of representative pathogen isolates for the identification of resistance sources from a collection of germplasm is crucial. The emerging knowledge of Ptt-barley interaction shows that, as a necrotrophic pathogen, Ptt produces a repertoire of toxins/necrotrophic effectors (NEs) that target dominant susceptibility gene products in barley to induce susceptibility (Liu et al., 2015; Faris and Friesen, 2020; Friesen and Faris, 2021). Various virulence loci, coding for putative NEs, have been mapped in Ptt and Ptm. This variability within NEs and their novel combinations due to sexual hybridization among Ptt isolates in nature favors the selection of virulent isolates in response to the selection pressure imposed by deployed resistance genes.
The virulence spectrum of the Moroccan Ptt isolates Ptt40–3 and Ptt45-3 used for seedling screening was studied on 31 barley differentials with an average IR of 7.4 ± 1.6 for Ptt40–3 and 6.4 ± 1.5 for Ptt45-3 (Supplementary Table S2). A differential interaction was observed on seven barley genotypes (AC Metcalf, Beecher, Canadian Lake Shore, CI5791, Hazera, Hocket, Rabat 071, and Tifang). It is important to note that Rabat 071 has been widely used as a resistant source to Ptt in barley breeding since its release in 1956, as it was highly resistant to 25 Ptt isolates in 1997 with an average IR of only 1.9 (Jonsson et al., 1997). Later, Jebbouj and El Yousfi (2010) reported an average IR of 3.4, using 61 Moroccan Ptt isolates. However, Taibi et al. (2016) reported an average IR of 5.8 from their study on 15 Ptt isolates. We have found that the isolate Ptt40–3 had an average IR of 8.7 on Rabat 071. This is a classic example of the breakdown of resistance due to the evolution and selection of Ptt genotypes when exposed to a resistant barley genotype over time. Interestingly, ~40% of the surveyed fields in Morocco in 2016 grew Rabat 071 (Rehman and El Yousfi, unpublished data). Similarly, the erosion of Ptt resistance on the chromosome 6H of barley accession CI 5791 is another well-documented example. This Ethiopian line conferred broad-spectrum resistance to a globally diverse Ptt isolate collection (Mode and Schaller, 1958; Khan and Boyd, 1969; Steffenson and Webster, 1992; Manninen et al., 2006). During 2016–17 field trials in Morocco, CI 5791 had a resistance response with an average disease severity of 3 at three experimental stations, but during 2017–18 field trials, an average disease severity of 7 was observed. Likewise, at the seedling stage, the Moroccan Ptt isolate Ptt40–3 compromised CI 5791 resistance with an average IR of 8.5. It was postulated by Mcdonald and Linde (2002) that plant pathogens with both sexual and asexual modes of reproduction can overcome the deployed genetic resistance. Due to the co-evolution of resistant Ptt populations on Rabat 071 and CI 5791, there is a clear shift in virulence, and hence, there is a greater need to diversify the resistance sources to Ptt in Morocco to avoid any future epidemics. In this study, we report that three six-row barley genotypes (Ciruelo, Zig Zig, and EGYPT4/TERAN78//P.STO/3/QUINA*2/4/CARDO/VIRDEN//ALOE) and five two-row barley genotypes (Kenia, MSEL//CLI18/E.QUEBRACHO, ACUARIO T95, Carina/Moroc9-75, and Shishai) showed stable resistance to both Ptt isolates tested. Furthermore, 32 barley genotypes (9 six-row, and 23 two-row) were R and/or MR at four testing locations at the adult plant stage (Table 1).
The interaction between Ptt and barley is very complex. From diverse bi-parental mapping populations, resistance/susceptibility loci have been reported for Ptt and Ptm on all barley chromosomes, but chromosome 1H harbored Ptt-specific loci. However, in association mapping studies, the resistance/susceptibility loci were distributed across all barley chromosomes for both Ptt and Ptm (Steffenson et al., 1996; Cakir et al., 2003; Ma et al., 2004; Friesen et al., 2006; Manninen et al., 2006; Lehmensiek et al., 2007; Grewal et al., 2008; St. Pierre et al., 2010). This difference could be attributed to much higher allelic diversity within the germplasm of different association mapping panels, whereas in bi-parental mapping populations, the diversity is restricted to the alleles present in the parents. The continuous distribution of infection responses at the seedling and adult plant stages in the HI-AM panel indicates that the resistance to Ptt is quantitative, and it is controlled by various genes with additive effects (Figures 1A, 2A). In this study, the seedling resistance of a diverse barley panel, designed for high-input conditions, was exposed to two virulent Ptt Moroccan isolates for seedling stage resistance, and the field resistance was assessed in four environments in Morocco. Our GWAS analysis identified 54 QTLs, 19 at the seedling stage, and 35 at the adult plant stage. Of the 19 SRT QTLs, 13 QTLs were reported previously, and 5 novel QTLs were detected (Table 2). At the adult plant stage, 35 QTLs were detected, and 26 of them have been reported previously, leaving 9 novel QTLs (Table 3).
The first GWAS study on net blotch resistance from Morocco was reported by Amezrou et al. (2018), where they used two American Ptt isolates (LGDPtt-19, and TD10) for seedling stage resistance assessments, and reported QTLs on chromosomes 1H, 4H, 5H, 6H, and 7H for the Ptt isolate Ptt19, and only 1 QTL on chromosome 2H for Ptt isolate TD10. We have detected QTLs for Ptt isolate Ptt40–3 on chromosomes 2H, 3H, 4H, and 7H, and for Ptt45-3 isolate, QTLs were detected on all barley chromosomes. These differences could be due to different sets of germplasm used, in addition to differences in the virulence spectrum and different geographical origin of the Ptt isolates used in these two studies. Interestingly, seven SNP markers supported the QTL SRT-QPtt40–2 and SRT-QPtt45–2 on chromosome 2H (653–655 Mb), which was detected for both Ptt isolates, and the same QTLs were also reported by Amezrou et al. (2018) and Cakir et al. (2011). Furthermore, three other SRT QTLs, i.e., SRT-QPtt45-6 (3H, 575.81–585.25 Mb), SRT-QPtt45-8 (4H, 587.48 Mb), and SRT-QPtt45-9 (5H, 579.91–580.05 Mb) were also reported by Amezrou et al. (2018); Grewal et al. (2008); König et al. (2014); Martin et al. (2018); Daba et al. (2019); Adhikari et al. (2019); Clare et al. (2021), and Vatter et al. (2017). In addition, five QTLs, SRT-QPtt45-1 (1H, 69.30–70.14 Mb), SRT-QPtt45-5 (3H, 542.89 Mb), SRT-QPtt45-7 (4H, 22.42 Mb), SRT-QPtt45-10 (6H, 546.50–556.39 Mb), and SRT-QPtt45-7 (7H, 627.94 Mb) were novel (Table 2). The largest reduction in disease severity of -1.29 units (12.9%) was detected for the SNP marker SNP1539 associated with SRT-QPtt40-3 (3H, 13.85 Mb), and the same QTL was also reported by Rozanova et al. (2019). However, the SNP marker SNP2552 associated with the QTL SRT-QPtt40-7 (4H, 514.85 Mb) promoted disease severity by 19.4%, and it was also reported by Adhikari et al. (2019). Furthermore, two common SRT QTLs were detected (Table 2): SRT-QPtt40-2 (654.47–654.63 Mb) and SRT-QPtt45-2 (653.96–655.70 Mb) on chromosome 2H (Amezrou et al., 2018; Cakir et al., 2011), SRT-QPtt40-6 (549.78 – 553.95 Mb) and SRT-QPtt45-5 (542.89 Mb) on chromosome 3H (Adhikari et al., 2019; Martin et al., 2018; Novakazi et al., 2019; Tamang et al., 2015; Clare et al., 2021).
At the adult plant stage, 45 MTAs corresponded to 35 QTLs on chromosomes 1H, 2H, 3H, 4H, 5H, and 7H. Interestingly, no QTLs were detected on chromosome 6H. This is in contrast with the previous study of Amezrou et al. (2018), where 3 APR QTLs were detected on chromosome 6H at 35.62, 49.79, and 54.89 cM, respectively. The APR QTL APR-QSAT18-1 (641.15 Mb) on chromosome 2H detected at Sidi Allal Tazi in 2018 in this study was also reported by Amezrou et al. (2018) at Sidi El Aidi in 2015 in Morocco. Similarly, two APR QTLs reported by Amezrou et al. (2018) on chromosome 5H QRPtta-5H-139.38 (139.38 cM), detected at Marchouch in 2015, and QRPtta-5H-143.4 (143.4 cM), detected at Jemma Shiam in 2015, also corresponded with the APR QTL APR-QJS18-4 (548.62 Mb) detected at Jemma Shiam in 2018. Similarly, both APR QTLs from Sidi Allal Tazi on chromosome 7, i.e., APR-QSAT17-9 (3.66 Mb) detected in 2017 and APR-QSAT18-7 (2.88 Mb) detected in 2018, were also reported previously by Amezrou et al. (2018) at Jemma Shiam in 2015. Interestingly, these three QTLs reported on chromosomes 2H, 5H, and 7H from GWASs from Morocco were novel QTLs, and these could potentially be used in a MAS to incorporate Ptt resistance into new barley cultivars in Morocco.
The largest reduction in disease severity of -7.31 and -7.86 units was caused by two SNP markers: SNP25 (APR-QSAT-1, 9.75 Mb) on chromosome 1H, and DaRT1544 (APR-QSAT17-3, 1.5 Mb) on chromosome 2H. Both of these APR QTLs were novel. We also detected six common APR QTLs in this study that were previously reported (Tables 2, 3): APR-QMCH18-1 (9.11 Mb) and APR-QSAT17-1 (9.75 Mb) on chromosome 1H (Martin et al., 2018); APR-QMCH18-3 (558.72 Mb), APR-QMCH18-4 (568.90 Mb), and APR-QJS18-1 (564.54 Mb) on chromosome 2H (Rozanova et al. (2019) and Tamang et al. (2015); APR-QSAT17-5 (557.37 Mb) and APR-QMCH18–7 on chromosome 3H (König et al., 2014; O’boyle et al., 2014; Richards et al., 2017; Vatter et al., 2017; Wonneberger et al., 2017); QJS18-3 (32.13 Mb) and APR-QSAT18-6 (32.13 Mb) on chromosome 5H, which were novel; APR-QSAT18-7 (2.88 Mb) and APR-QSAT17-9 (3.66 Mb) on chromosome 7H (Tamang et al., 2015; Vatter et al., 2017; Amezrou et al., 2018; Adhikari et al., 2019; Daba et al., 2019; Novakazi et al., 2019); and APR-QSAT18-8 (598.71 Mb), APR-QMCH18-11 (604.91 Mb), and APR-QJS18-5 (605.23 Mb) on chromosome 7H (Tamang et al., 2015; Richards et al., 2017; Clare et al., 2021). We also detected three common SRT and APR QTLs that have been reported in different studies. For example, APR-QSAT17–3 and SRT-QPtt40–5 are co-located between 532.24 and 532.44 Mb on chromosome 2H (Liu et al., 2011; Richards et al., 2017; Vatter et al., 2017). Likewise, SRT-QPtt45–6 and APR-QSAT17–4 are co-located between 585.25 and 587.55 Mb on chromosome 3H (Rozanova et al., 2019). Similarly, APR-QSAT17-9 (632.11 Mb) and SRT-Ptt45-11 (627.94 Mb) on chromosome 7H may represent the same QTL (Vatter et al., 2017; Martin et al., 2018).
The genetic and molecular understanding of plant-pathogen interactions is very important for the identification and introgression of net blotch resistance. Plants have a bi-layer immune system to fend off invaders. It comprises PTI [pathogen-associated molecular pattern (PAMP)-triggered immunity] and ETI (effector-triggered immunity) (Dodds and Rathjen, 2010). In the case of PTI, the membrane-associated pattern recognition receptors [PRRs; receptor-like proteins (RLPs), receptor-like kinases (RLKs)] perceive conserved molecules (PAMPs) and trigger host immune responses. But specialized pathogens have evolved with effector molecules that either mask the perception of PAMPs by PRRs or suppress PTI (De Jonge et al., 2010). Due to this arms race between plants and pathogens, the second immune layer, which Comprises of cytoplasmic nucleotide-binding leucine-rich receptors (NLRs), recognizes pathogen-derived effectors directly (gene-for-gene) or indirectly (guard hypothesis) to mount an efficient and potent immune response (Jones and Dangl, 2006). This ETI model holds true for the interaction between host plant and biotrophic pathogens such as barley stripe rust, but the necrotrophic pathogens such as spot blotch and net blotch have exploited this interaction in an inverse gene-for-gene interaction where necrotrophic secreted effectors are recognized by immune receptors (RLKs, RLPs, and NLRs) to mount programmed cell death. Furthermore, the effector-triggered susceptibility (ETS) is typically associated with necrotrophic pathogens, where knockout of susceptibility (S) genes may confer resistance. In contrast, ETI, predominantly mediated by NLR proteins, is more commonly observed in biotrophic interactions. As no net blotch resistance gene has been cloned, our understanding of the molecular mechanism of net blotch resistance remains elusive to date. However, homology-based searches of some of the candidate genes underlying a QTL interval may infer their putative role in net blotch-barley interaction.
In our GWAS analysis, 83 MTAs encompassed 54 QTLs that were further resolved into 38 MTAs (19 QTLs) for the seedling stage and 45 MTAs (35 QTLs) for the adult stage (Tables 2, 3). Overall, the sequences of 34 markers within different QTL intervals encoded functional proteins involved in disease resistance (Table 4). We detected four NLRs and eight RLKs among putative candidate genes at both the seedling and the adult plant stages. For example, the SNP marker SNP4512 associated with APR-QMCH19–9 [on chromosome 7H (435.29 Mb)] encodes a serine/threonine-protein kinase-like protein CCR4 (HORVU.MOREX.r3.7HG0706130). Typically, the serine/threonine protein kinases phosphorylate the OH group of serine or threonine of the target protein, which plays a crucial role in disease resistance of wheat against wheat powdery mildew (Blumeria graminis f. sp. tritici (Bgt)). A serine/threonine protein kinase (Stpk-V) from the Pm21 locus in wheat conditioned resistance to Bgt due to its transient expression in susceptible wheat cultivar Yangmati 158. Conversely, the silencing of Stpk-V in the Bgt-resistant cultivar led to it becoming susceptible to powdery mildew (Chen et al., 1995; Cao et al., 2011). Interestingly, serine/threonine kinases also condition resistance to stem rust in barley (rpg1) and in tomato against Pseudomonas syringae (Brueggeman et al., 2002; Zhou et al., 1995). Furthermore, barley leaf rust resistance gene Rph22 encodes a lectin-like kinase, and Xa21 is an RLK that conditions resistance to rice blast bacterial pathogen Xanthomonas oryzae pv. Oryzae (Song et al., 1995; Tör et al., 2004). Some of the eight RLKs identified in this study might encode pattern recognition receptors conditioning resistance against Ptt, but it will require functional validation. In addition, four DaRT markers DaRT5608 [SRT-QPtt45-6 (583.89 Mb)] on chromosome 3, DaRT10879 (SRT-QPtt45-10 (556.39 Mb)) on chromosome 6H, DaRT1544 [APR-QSAT17-3 (1.50 Mb)] on chromosome 2H, and DaRT1292 [APR-QMCH18-2 (496.71 Mb)] marker encode NLR receptors (Table 4; Supplementary Tables S3, S4). Several NLR proteins, such as Lr1, Lr21, Lr22a, Lr10, and Rph1, condition resistance against barley and wheat leaf rust (Feuillet et al., 2003; Huang et al., 2003; Cloutier et al., 2007; Chen et al., 2010; Thind et al., 2017; Dracatos et al., 2019).
Necrotrophic pathogens like Ptt have an arsenal of phytotoxic toxins that induce necrosis and chlorosis in their host plants by targeting host susceptibility targets for successful invasion. In the field, barley is exposed to field populations composed of diverse races of net blotch, and a non-race-specific resistance can be sought to fend off these invaders. A DaRT marker DaRT5520 (568.42 Mb) associated with APR-QMCH18–9 on chromosome 3H encodes an ATP-binding ABC transporter (Table 4), which is known for pumping out fungal secreted toxins outside the plant cell, such as PEN3 in Arabidopsis conditioning resistance against Botrytis cinerea (He et al., 2019). In this context, a wheat leaf rust resistance gene Lr34 encodes an ABC transporter that provides non-race-specific resistance against powdery mildew, stem rust, and stripe rust of wheat (Rinaldo et al., 2017), and against Magnoportha oryzea causing rice blast (Krattinger et al., 2016). The same candidate gene was also reported by Amouzoune et al. (2024) against leaf rust, and by Hiddar et al. (2023) against barley necrotrophic fungus Rynchosporium commune. Based on its function, a similar role of ABC transporters in net blotch resistance can be envisaged here. The functional analysis of candidate genes will help us understand the molecular mechanism underlying net blotch resistance in barley.
The HI-AM panel has been phenotyped previously for resistance to spot blotch and stripe rust of barley (Visioni et al., 2018, 2020). Necrotrophic pathogens, such as spot blotch and net blotch, and biotrophic pathogens, such as stripe rust, have conflicting life cycles. Biotrophs secrete effectors to evade the host immune system, keeping their hosts alive while redirecting the host’s cellular resources for their own reproduction and development. The necrotrophic secreted effectors, however, perturb the host’s susceptibility targets to modulate host plant defenses and to trigger host cell death. In our recent genome scan analysis, we also detected 17 overlapping QTLs for resistance/susceptibility to spot blotch and net form net blotch, and 8 overlapping QTLs were detected for resistance/susceptibility to stripe rust of barley and net form net blotch. Interestingly, 3 QTLs overlapped for resistance/susceptibility to all three economically important pathogens of barley (Table 4).
Two common SRT QTLs on chromosome 2H for both Ptt isolates SRT-QPtt40-2 (654.47-654.63 Mb) and SRT-QPtt45-2 (653.96-655.70 Mb) overlapped with the stripe rust QTL SRT_RG_2 (650.51 Mb) and with spot blotch QTL SRT_R0_2 (650.36 Mb) (Figure 6). The putative candidate genes in that QTL interval included receptor-like kinase (HORVU.MOREX.r3.2HG0213660.1), disease resistance protein (TIR-NBS-LRR class; HORVU.MOREX.r3.2HG0213360.1), and cysteine protease (HORVU.MOREX.r3.2HG0211390.1). Papain-like cysteine proteases are required for broad-spectrum resistance to a diverse class of pathogens (Misas-Villamil et al., 2016). For example, the null mutants of Arabidopsis cysteine protease RD21 displayed a susceptible reaction to the necrotrophic fungal pathogen Botrytis cinerea (Shindo et al., 2012). Similarly, tomato cysteine protease rcr3 mutants carrying Cf-2 resistance gene lost resistance to the fungal pathogen Cladosporium fulvum and to cyst nematode Globodera rostochiensis (Dixon et al., 2000; Lozano-Torres et al., 2012). Interestingly, cysteine proteases are targeted by secreted effectors of many plant pathogens to suppress resistance response (Misas-Villamil et al., 2016). For example, Phytophthoa infestans secreted effectors EpiC1 and EpiC2B to target cysteine protease C14 of tomato and potato. Likewise, C. fulvum effector Avr2, P. infestans effectors EpiC1 and EpiC2B, and cyst nematode G. rostochiensis effector Gr-VAP1 target cysteine protease Rcr3 to suppress immune responses in tomato (Rooney et al., 2005; Song et al., 2009; Kaschani et al., 2010; Lozano-Torres et al., 2012). These findings suggest the crucial role of cysteine proteases in disease resistance to diverse pathogens, which also makes them the virulence targets of many secreted effectors. A similar role of cysteine protease of barley in disease resistance to biotrophic and necrotrophic pathogens is envisaged.
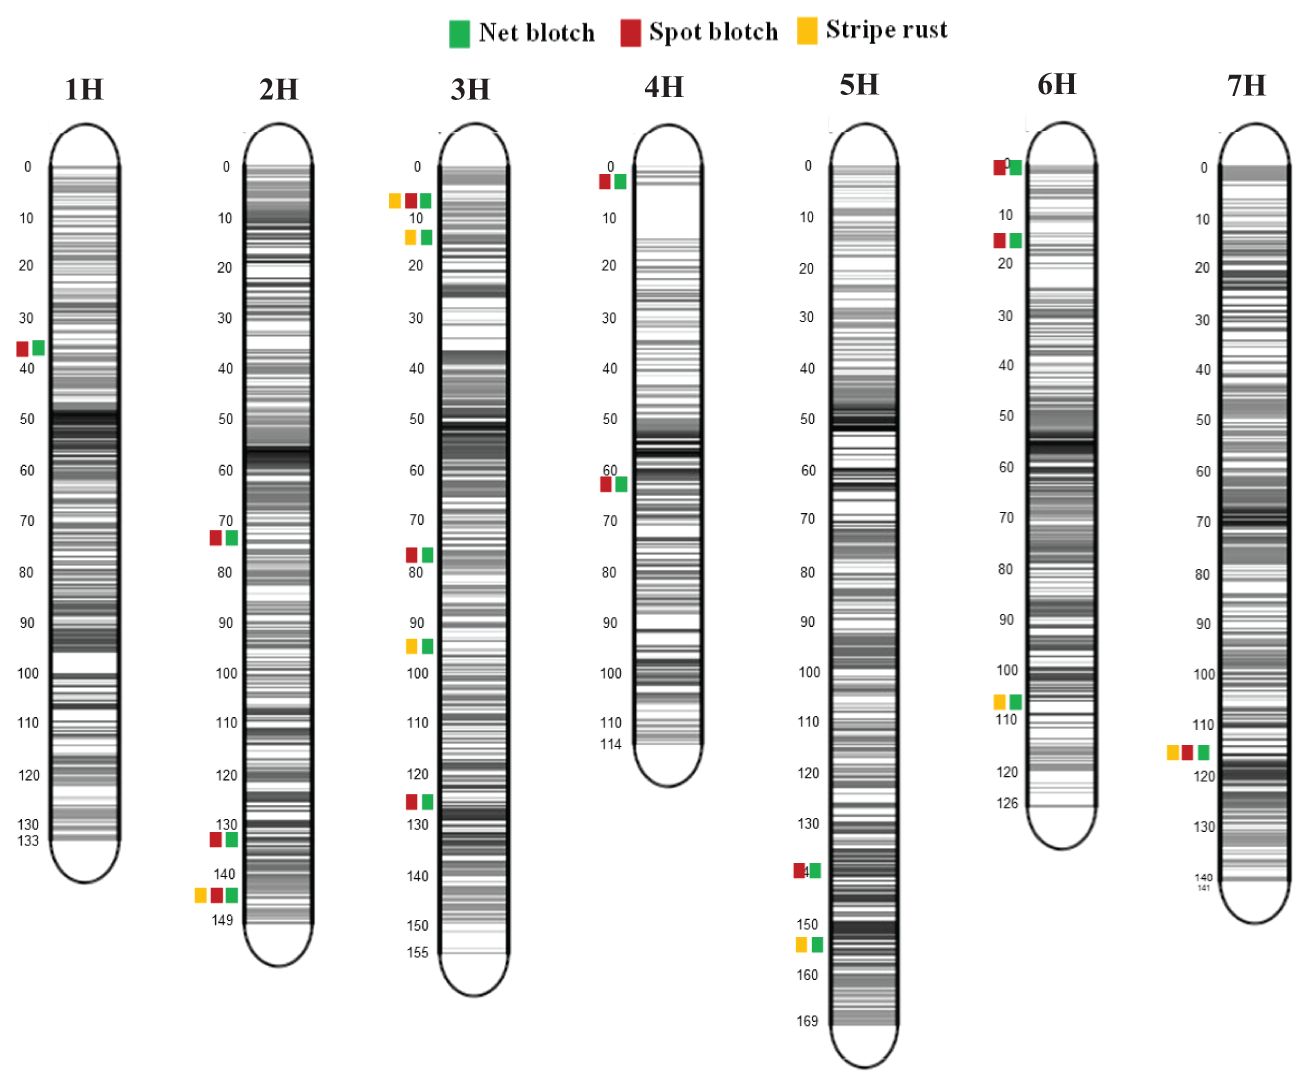
Figure 6. Marker distribution and representation of overlapping QTLs of net blotch, spot blotch, and stripe rust across seven barley chromosomes of the HI-AM panel. The grey bars show the marker density at each chromosome and the number of markers for each chromosome is indicated at the bottom. This figure was produced using the Sommer package (https://CRAN.R-project.orh/package=sommer).
Another Ptt SRT QTL SRT-Ptt45-4 (8.51 Mb) on chromosome 3H overlapped with the stripe rust QTL SRT-R24-2 (7.09 Mb) and with the spot blotch QTL SRT-ICSB3-3 (6.01 Mb) (Figure 6). The putative candidate genes in that QTL interval included receptor-like protein kinase (HORVU.MOREX.r3.3HG0221540.1), negative regulator of resistance (HORVU.MOREX.r3.3HG0221980.1), and NBS-LRR disease resistance protein (HORVU.MOREX.r3.3HG0222080.1). The third spot blotch APR QTL APR-QSAT18-8 (598.71 Mb) on chromosome 7 co-located with a stripe rust QTL SRT_RM_9 (597.28 Mb) and two spot blotch SRT QTLs SRT-SB54–8 and SRT-ICSB3-12 (598.96 Mb). The putative candidate genes in that QTL interval included a protein detoxification (HORVU.MOREX.r3.7HG0737280.1), protein kinase superfamily protein (HORVU.MOREX.r3.7HG0737080.1), receptor-kinase (HORVU.MOREX.r3.7HG0737830.1), leucine-rich repeat receptor-like protein kinase family protein (HORVU.MOREX.r3.7HG0737850.1), and a glutathione S-transferase. All of the putative candidate genes associated with the co-located QTLs have been implicated in host cell immune responses. Most of the above-mentioned common QTLs between spot blotch, net blotch, and stripe rust are linked with putative candidate genes that encode a diverse class of plant immune receptors. Different studies have implicated these immune receptors with ambivalent effects. For example, BOTRYTIS CINEREA-INDUCED KINASE 1 (BIK1) enhances resistance to necrotrophic pathogen B. cincerea. However, the inactivation of BIK1 resulted in susceptibility to necrotrophic pathogens B. cinerea and Alternaria brassicicola, but enhanced resistance to a hemi-biotroph Pseudomonas syringae (Veronese et al., 2006). Likewise, in oats, the susceptibility to victorin toxin secreted by Cochliobolus victoriae is linked with the Pc-2 gene, but it also conditions resistance to biotrophic pathogens (Wolpert et al., 2002; Lorang et al., 2012). In addition, MILDEW RESISTANCE LOCUS O (MLO) in barley is another classical example where the loss-of-function allele mlo conditions resistance to powdery mildew Blumaria graminis f. sp. hordei (Büschges et al., 1997), but promotes susceptibility to necrotrophic pathogens such as Magnaportha oryzae (Jarosch et al., 1999), Bipolaris sorokiniana (Kumar et al., 2009), and Ramularia collo-cigni (Mcgrann et al., 2014). Thus, the functional analysis of the candidate genes underlying common QTLs between biotrophic and necrotrophic pathogens will broaden our understanding of ambivalent responses of these CGs. Furthermore, the identification of host susceptibility targets of pathogen-secreted effectors will enhance our understanding of how the plant immune system perceives different invading pathogens to fine-tune its immune response.
Data availability statement
The datasets presented in this study can be found in online repositories. The names of the repository/repositories and accession number(s) can be found in the article/Supplementary Material.
Author contributions
SR: Conceptualization, Formal analysis, Investigation, Methodology, Visualization, Writing – original draft, Writing – review & editing. MA: Methodology, Writing – review & editing. RV: Conceptualization, Writing – review & editing. MS: Writing – review & editing, Resources. AV: Conceptualization, Visualization, Writing – original draft, Writing – review & editing, Funding acquisition.
Funding
The author(s) declare that financial support was received for the research and/or publication of this article. This research was supported by PRIMA Foundation (Horizon2020), PRIMA section 1 2020 Agrofood Value Chain IA Topic: 1.3.1-2020 (IA), MEDWHEALTH project grant no. 2034.
Conflict of interest
The authors declare that the research was conducted in the absence of any commercial or financial relationships that could be construed as a potential conflict of interest.
Generative AI statement
The author(s) declare that no Generative AI was used in the creation of this manuscript.
Publisher’s note
All claims expressed in this article are solely those of the authors and do not necessarily represent those of their affiliated organizations, or those of the publisher, the editors and the reviewers. Any product that may be evaluated in this article, or claim that may be made by its manufacturer, is not guaranteed or endorsed by the publisher.
Supplementary material
The Supplementary Material for this article can be found online at: https://www.frontiersin.org/articles/10.3389/fagro.2025.1525588/full#supplementary-material
Supplementary Figure 1 | Quantile-Quantile (QQ) plots of marker-trait associations for net blotch resistance at the seedling stage using Ptt isolates Ptt40–3 and Ptt45-3. (A) GLM (PCA) and (B) MLM (PCA+K) models in the HI-AM barley panel using Tassel.
Supplementary Figure 2 | Quantile-Quantile (QQ) plots of marker-trait associations for net blotch resistance at the adult plant stage at field locations of Sidi Allal Tazi 2016–17 (SAT17), (B) Sidi Allal Tazi 2017–18 (SAT18), (C) Jemaa Shaim 2017–18 (JS18), and (D) Marchouch (MCH18) using (A) GLM (PCA) and (B) MLM (PCA+K) models in the HI-AM barley panel using Tassel.
Supplementary Table 1 | The full list of barley genotypes included in the HI-AM panel.
Supplementary Table 2 | Virulence spectrum of Ptt isolates Ptt40–3 and Ptt45–3 on 31 differential cultivars of barley under controlled conditions.
Supplementary Table 3 | List of putative candidate genes associated with seedling stage resistance/susceptibility QTL against net blotch in Morocco.
Supplementary Table 4 | List of putative candidate genes associated with adult plant stage resistance/susceptibility QTL against net blotch in Morocco.
References
Adhikari A., Steffenson B. J., Smith M. J., and Dill-Macky R. (2019). Genome-wide association mapping of seedling net form net blotch resistance in an Ethiopian and Eritrean barley collection. Crop Sci. 59, 1625–1638. doi: 10.2135/cropsci2019.01.0003
Afanasenko O. S., Hartleb H., Guseva N. N., Minarikova V., and Janosheva M. (1995). A set of differentials to characterize populations of Pyrenophora teres Drechs. for international use. J. Phytopathol. 143, 501–507. doi: 10.1111/j.1439-0434.1995.tb04562.x
Amezrou R., Verma R. P. S., Chao S., Brueggeman R. S., Belqadi L., Arbaoui M., et al. (2018). Genome-wide association studies of net form of net blotch resistance at seedling and adult plant stages in spring barley collection. Mol. Breed. 38, 1–14. doi: 10.1007/s11032-018-0813-2
Amouzoune M., Rehman S., Benkirane R., Udupa S., Mamidi S., Kehel Z., et al. (2024). Genome wide association study of seedling and adult plant leaf rust resistance in two subsets of barley genetic resources. Sci. Rep. 14, 15428. doi: 10.1038/s41598-024-53149-2
Anisimova A., Novikova L. Y., Novakazi F., Kopahnke D., Zubkovich A., and Afanasenko O. (2017). Polymorphism on virulence and specifity of microevolution processes in populations of causal agent of barley net blotch Pyrenophora teres f. teres. Mikologiya I Fitopatologiya 51, 229–240.
Bockelman H. E., Sharp E. L., and Eslick R. F. (1977). Trisomic analysis of genes for resistance to scald and net blotch in several barley cultivars. Can. J. Bot. 55, 2142–2148. doi: 10.1139/b77-24
Brueggeman R., Rostoks N., Kudrna D., Kilian A., Han F., Chen J., et al. (2002). The barley stem rust-resistance gene Rpg1 is a novel disease-resistance gene with homology to receptor kinases. Proc. Natl. Acad. Sci. 99, 9328–9333. doi: 10.1073/pnas.142284999
Burlakoti R. R., Gyawali S., Chao S., Smith K. P., Horsley R. D., Cooper B., et al (2017). Genome-wide association study of spot form of net blotch resistance in the Upper Midwest barley breeding programs. Phytopathology 107, 100–108. doi: 10.1094/PHYTO-03-16-0136-R
Büschges R., Hollricher K., Panstruga R., Simons G., Wolter M., Frijters A., et al. (1997). The barley Mlo gene: a novel control element of plant pathogen resistance. Cell 88, 695–705. doi: 10.1016/S0092-8674(00)81912-1
Cakir M., Gupta S., Li C., Hayden M., Mather D. E., Ablett G. A., et al. (2011). Genetic mapping and QTL analysis of disease resistance traits in the barley population Baudin× AC Metcalfe. Crop Pasture Sci. 62, 152–161. doi: 10.1071/CP10154
Cakir M., Gupta S., Platz G., Ablett G. A., Loughman R., Emebiri L., et al. (2003). Mapping and validation of the genes for resistance to Pyrenophora teres f. teres in barley (Hordeum vulgare L.). Aust. J. Agric. Res. 54, 1369–1377. doi: 10.1071/AR02229
Cantalapiedra C. P., Boudiar R., Casas A. M., Igartua E., and Contreras-Moreira B. (2015). BARLEYMAP: physical and genetic mapping of nucleotide sequences and annotation of surrounding loci in barley. Mol. Breed. 35, 1–11. doi: 10.1007/s11032-015-0253-1
Cao A., Xing L., Wang X., Yang X., Wang W., Sun Y., et al. (2011). Serine/threonine kinase gene Stpk-V, a key member of powdery mildew resistance gene Pm21, confers powdery mildew resistance in wheat. Proc. Natl. Acad. Sci. 108, 7727–7732. doi: 10.1073/pnas.1016981108
Chen X., Hackett C. A., Niks R. E., Hedley P. E., Booth C., Booth C., et al. (2010). An eQTL Analysis of Partial Resistance to Puccinia hordei in Barley. PloS One 5, e8598. doi: 10.1371/journal.pone.0008598
Chen P. D., Qi L. L., Zhou B., Zhang S. Z., and Liu D. J. (1995). Development and molecular cytogenetic analysis of wheat-Haynaldia villosa 6VS/6AL translocation lines specifying resistance to powdery mildew. Theor. Appl. Genet. 91, 1125–1128. doi: 10.1007/BF00223930
Clare S. J., Çelik Oğuz A., Effertz K., Sharma Poudel R., See D., Karakaya A., et al. (2021). Genome-wide association mapping of Pyrenophora teres f. maculata and Pyrenophora teres f. teres resistance loci utilizing natural Turkish wild and landrace barley populations. G3 Genes|Genomes|Genetics 11 (11). doi: 10.1093/g3journal/jkab269
Clare S. J., Wyatt N. A., Brueggeman R. S., and Friesen T. L. (2020). Research advances in the Pyrenophora teres–barley interaction. Mol. Plant Pathol. 21, 272–288. doi: 10.1111/mpp.12896
Cloutier S., McCallum B. D., Loutre C., Banks T. W., Wicker T., Feuillet C., et al. (2007). Leaf rust resistance gene Lr1, isolated from bread wheat (Triticum aestivum L.) is a member of the large psr567 gene family. Plant Mol. Biol. 65, 93–106. doi: 10.1007/s11103-007-9201-8
Cockram J., White J., Zuluaga D. L., Smith D., Comadran J., Macaulay M., et al. (2010). Genome-wide association mapping to candidate polymorphism resolution in the unsequenced barley genome. Proc. Natl. Acad. Sci. 107, 21611–21616. doi: 10.1073/pnas.1010179107
Daba S. D., Horsley R., Brueggeman R., Chao S., and Mohammadi M. (2019). Genome-wide association studies and candidate gene identification for leaf scald and net blotch in barley (Hordeum vulgare L.). Plant Dis. 103, 880–889. doi: 10.1094/PDIS-07-18-1190-RE
De Jonge R., Van Esse H. P., Kombrink A., Shinya T., Desaki Y., Bours R., et al. (2010). Conserved fungal LysM effector Ecp6 prevents chitin-triggered immunity in plants. Science 329, 953–955. doi: 10.1126/science.1190859
Dixon M. S., Golstein C., Thomas C. M., van der Biezen E. A., and Jones J. D. (2000). Genetic complexity of pathogen perception by plants: the example of Rcr3, a tomato gene required specifically by Cf-2. Proc. Natl. Acad. Sci. 97, 8807–8814. doi: 10.1073/pnas.97.16.8807
Dodds P. N. and Rathjen J. P. (2010). Plant immunity: towards an integrated view of plant–pathogen interactions. Nat. Rev. Genet. 11, 539–548. doi: 10.1038/nrg2812
Dracatos P. M., Bartoš J., Elmansour H., Singh D., Karafiátová M., Zhang P., et al. (2019). The coiled-coil NLR rph1, confers leaf rust resistance in barley cultivar Sudan. Plant Physiol. 179, 1362–1372. doi: 10.1104/pp.18.01052
Duggal P., Gillanders E. M., Holmes T. N., and Bailey-Wilson J. E. (2008). Establishing an adjusted p-value threshold to control the family-wide type 1 error in genome wide association studies. BMC Genomics 9, 1–8. doi: 10.1186/1471-2164-9-516
Evanno G., Regnaut S., and Goudet J. (2005). Detecting the number of clusters of individuals using the software structure: a simulation study. Mol. Ecol. 14, 2611–2620. doi: 10.1111/j.1365-294X.2005.02553.x
FAO (Food and Agriculture Organization of the United Nations) (2021).FAOSTAT: statistical database. Available online at: https://www.fao.org/faostat/en/ (Accessed March 4, 2023).
Faris J. D. and Friesen T. L. (2020). Plant genes hijacked by necrotrophic fungal pathogens. Curr. Opin. Plant Biol. 56, 74–80. doi: 10.1016/j.pbi.2020.04.003
Feuillet C., Travella S., Stein N., Albar L., Nublat A., and Keller B. (2003). Map-based isolation of the leaf rust disease resistance gene Lr10 from the hexaploid wheat (Triticum aestivum L.) genome. Proc. Natl. Acad. Sci. 100, 15253–15258. doi: 10.1073/pnas.2435133100
Franckowiak J. D. and Platz G. J. (2013). International database for barley genes and barley genetic stocks. Barley Genet. Newsl. 43, 48–223.
Friesen T. L. and Faris J. D. (2021). Characterization of effector-target interactions in necrotrophic pathosystems reveals trends and variation in host manipulation. Annu. Rev. Phytopathol. 59, 77–98. doi: 10.1146/annurev-phyto-120320-012807
Friesen T., Faris J., Lai Z., and Steffenson B. (2006). Identification and chromosomal location of major genes for resistance to Pyrenophora teres in a doubled-haploid barley population. Genome 49, 855–859. doi: 10.1139/g06-024
Grewal T. S., Rossnagel B. G., Pozniak C. J., and Scoles G. J. (2008). Mapping quantitative trait loci associated with barley net blotch resistance. Theor. Appl. Genet. 116, 529–539. doi: 10.1007/s00122-007-0688-9
He Y., Xu J., Wang X., He X., Wang Y., Zhou J., et al. (2019). The arabidopsis pleiotropic drug resistance transporters PEN3 and PDR12 mediate camalexin secretion for resistance to botrytis cinerea. Plant Cell 31, 2206–2222. doi: 10.1105/tpc.19.00239
Hiddar H., Rehman S., Belkadi B., Filali-Maltouf A., Al-Jaboobi M., Verma R. P. S., et al. (2023). Identification of sources of resistance to scald (Rhynchosporium commune) and of related genomic regions using genome-wide association in a mapping panel of spring barley. Front. Plant Sci. 14. doi: 10.3389/fpls.2023.1133404
Hill W. and Weir B. (1988). Variances and covariances of squared linkage disequilibria in finite populations. Theor. population Biol. 33, 54–78. doi: 10.1016/0040-5809(88)90004-4
Huang L., Brooks S. A., Li W., Fellers J. P., Trick H. N., and Gill B. S. (2003). Map-based cloning of leaf rust resistance gene Lr21 from the large and polyploid genome of bread wheat. Genetics 164, 655–664. doi: 10.1093/genetics/164.2.655
Jarosch B., Kogel K.-H., and Schaffrath U. (1999). The ambivalence of the barley Mlo locus: mutations conferring resistance against powdery mildew (Blumeria graminis f. sp. hordei) enhance susceptibility to the rice blast fungus Magnaporthe grisea. Mol. Plant-Microbe Interact. 12, 508–514. doi: 10.1094/MPMI.1999.12.6.508
Jebbouj R. and El Yousfi B. (2010). An integrated multivariate approach to net blotch of barley: Virulence quantification, pathotyping and a breeding strategy for disease resistance. Eur. J. Plant Pathol. 127, 521–544. doi: 10.1007/s10658-010-9617-x
Jones J. D. G. and Dangl J. L. (2006). The plant immune system. Nature 444, 323–329. doi: 10.1038/nature05286
Jonsson R., Bryngelsson T., and Gustafsson M. (1997). Virulence studies of Swedish net blotch isolates (Drechslera teres) and identification of resistant barley lines. Euphytica 94, 209–218. doi: 10.1023/A:1002924424200
Kaschani F., Shabab M., Bozkurt T., Shindo T., Schornack S., Gu C., et al. (2010). An effector-targeted protease contributes to defense against Phytophthora infestans and is under diversifying selection in natural hosts. Plant Physiol. 154, 1794–1804. doi: 10.1104/pp.110.158030
Khan T. and Boyd W. (1969). Physiologic specialization in Drechslera teres. Aust. J. Biol. Sci. 22, 1229–1236. doi: 10.1071/BI9691229
König J., Perovic D., Kopahnke D., and Ordon F. (2014). Mapping seedling resistance to net form of net blotch (P yrenophora teres f. teres) in barley using detached leaf assay. Plant Breed. 133, 356–365. doi: 10.1111/pbr.12147
Krattinger S. G., Sucher J., Selter L. L., Chauhan H., Zhou B., Tang M., et al. (2016). The wheat durable, multipathogen resistance gene Lr34 confers partial blast resistance in rice. Plant Biotechnol. 14, 1261–1268. doi: 10.1111/pbi.12491
Kumar U., Joshi A. K., Kumar S., Chand R., and Röder M. S. (2009). Mapping of resistance to spot blotch disease caused by Bipolaris sorokiniana in spring wheat. Theor. Appl. Genet. 118, 783–792. doi: 10.1007/s00122-008-0938-5
Lehmensiek A., Platz G., Mace E., Poulsen D., and Sutherland M. (2007). Mapping of adult plant resistance to net form of net blotch in three Australian barley populations. Aust. J. Agric. Res. 58, 1191–1197. doi: 10.1071/AR07141
Liu Z., Ellwood S. R., Oliver R. P., and Friesen T. L. (2011). Pyrenophora teres: profile of an increasingly damaging barley pathogen. Mol. Plant Pathol. 12, 1–19. doi: 10.1111/j.1364-3703.2010.00649.x
Liu Z., Holmes D. J., Faris J. D., Chao S., Brueggeman R. S., Edwards M. C., et al. (2015). Necrotrophic effector-triggered susceptibility (NETS) underlies the barley–P yrenophora teres f. teres interaction specific to chromosome 6H. Mol. Plant Pathol. 16, 188–200. doi: 10.1111/mpp.2015.16.issue-2
Liu Z. H., Zhong S., Stasko A. K., Edwards M. C., and Friesen T. L. (2012). Virulence profile and genetic structure of a North Dakota population of Pyrenophora teres f. teres, the causal agent of net form net blotch of barley. Phytopathology 102, 539–546. doi: 10.1094/PHYTO-09-11-0243
Lorang J., Kidarsa T., Bradford C. S., Gilbert B., Curtis M., Tzeng S. C., et al. (2012). Tricking the guard: exploiting plant defense for disease susceptibility. Science 338, 659–662. doi: 10.1126/science.1226743
Lozano-Torres J. L., Wilbers R. H., Gawronski P., Boshoven J. C., Finkers-Tomczak A., Cordewener J. H., et al. (2012). Dual disease resistance mediated by the immune receptor Cf-2 in tomato requires a common virulence target of a fungus and a nematode. Proc. Natl. Acad. Sci. 109, 10119–10124. doi: 10.1073/pnas.1202867109
Ma Z., Lapitan N. L., and Steffenson B. (2004). QTL mapping of net blotch resistance genes in a doubled-haploid population of six-rowed barley. Euphytica 137, 291–296. doi: 10.1023/B:EUPH.0000040441.36990.58
Manninen O., Jalli M., Kalendar R., Schulman A., Afanasenko O., and Robinson J. (2006). Mapping of major spot-type and net-type net-blotch resistance genes in the Ethiopian barley line CI 9819. Genome 49, 1564–1571. doi: 10.1139/g06-119
Martin A., Platz G. J., De Klerk D., Fowler R. A., Smit F., Potgieter F. G., et al. (2018). Identification and mapping of net form of net blotch resistance in South African barley. Mol. Breed. 38, 53. doi: 10.1007/s11032-018-0814-1
McDonald W. C. (1967). Variability and the inheritance of morphological mutants in Pyrenophora teres. Phytopathology 57, 747–755.
Mcdonald B. A. and Linde C. (2002). Pathogen population genetics, evolutionary potential, and durable resistance. Annu. Rev. Phytopathol. 40, 349–379. doi: 10.1146/annurev.phyto.40.120501.101443
Mcgrann G. R., Stavrinides A., Russell J., Corbitt M. M., Booth A., Chartrain L., et al. (2014). A trade off between mlo resistance to powdery mildew and increased susceptibility of barley to a newly important disease, Ramularia leaf spot. J. Exp. Bot. 65, 1025–1037. doi: 10.1093/jxb/ert452
Meuwissen T. H. and Goddard M. E. (2000). Fine mapping of quantitative trait loci using linkage disequilibria with closely linked marker loci. Genetics 155, 421–430. doi: 10.1093/genetics/155.1.421
Misas-Villamil J. C., van der Hoorn R., and Doehlemann G. (2016). Papain-like cysteine proteases as hubs in plant immunity. New Phytol. 212, 902–907. doi: 10.1111/nph.14117
Mode C. and Schaller C. (1958). Two additional factors for host resistance to net blotch in barley 1. Agron. J. 50, 15–18. doi: 10.2134/agronj1958.00021962005000010005x
Novakazi F., Afanasenko O., Anisimova A., Platz G. J., Snowdon R., Kovaleva O., et al. (2019). Genetic analysis of a worldwide barley collection for resistance to net form of net blotch disease (Pyrenophora teres f. teres). Theor. Appl. Genet. 132, 2633–2650. doi: 10.1007/s00122-019-03378-1
O’boyle P., Brooks W., Barnett M., Berger G., Steffenson B., Stromberg E., et al. (2014). Mapping net blotch resistance in ‘Nomini’and CIho 2291 barley. Crop Sci. 54, 2596–2602. doi: 10.2135/cropsci2013.08.0514
Pritchard J. K., Stephens M., and Donnelly P. (2000). Inference of population structure using multilocus genotype data. Genetics 155, 945–959. doi: 10.1093/genetics/155.2.945
Remington D. L., Thornsberry J. M., Matsuoka Y., Wilson L. M., Whitt S. R., Doebley J., et al. (2001). Structure of linkage disequilibrium and phenotypic associations in the maize genome. Proc. Natl. Acad. Sci. U S A 98, 11479–11484. doi: 10.1073/pnas.201394398
Richards J., Chao S., Friesen T., and Brueggeman R. (2016). Fine mapping of the barley chromosome 6H net form net blotch susceptibility locus. G3 Genes|Genomes|Genetics 6, 1809–1818. doi: 10.1534/g3.116.028902
Richards J. K., Friesen T. L., and Brueggeman R. S. (2017). Association mapping utilizing diverse barley lines reveals net form net blotch seedling resistance/susceptibility loci. Theor. Appl. Genet. 130, 915–927. doi: 10.1007/s00122-017-2860-1
Rinaldo A., Gilbert B., Boni R., Krattinger S. G., Singh D., Park R. F., et al. (2017). The Lr34 adult plant rust resistance gene provides seedling resistance in durum wheat without senescence. Plant Biotechnol. J. 15, 894–905. doi: 10.1111/pbi.12684
Rooney H. C., Van’t Klooster J. W., van der Hoorn R. A., Joosten M. H., Jones J. D., and De Wit P. J. (2005). Cladosporium Avr2 inhibits tomato Rcr3 protease required for Cf-2-dependent disease resistance. Science 308, 1783–1786. doi: 10.1126/science.1111404
Rozanova I. V., Lashina N. M., Mustafin Z. S., Gorobets S. A., Efimov V. M., Afanasenko O. S., et al. (2019). SNPs associated with barley resistance to isolates of Pyrenophora teres f. teres. BMC Genomics 20, 292. doi: 10.1186/s12864-019-5623-3
Saari E. E. and Prescott L. M. (1975). A scale for appraising the foliar intensity of wheat diseases. Plant Dis. 59, 377–380.
Serenius M., Mironenko N., and Manninen O. (2005). Genetic variation, occurrence of mating types and different forms of Pyrenophora teres causing net blotch of barley in Finland. Mycological Res. 109, 809–817. doi: 10.1017/S0953756205002856
Shindo T., Misas-Villamil J. C., Hörger A. C., Song J., and van der Hoorn R. A. (2012). A role in immunity for Arabidopsis cysteine protease RD21, the ortholog of the tomato immune protease C14. PloS One 7, e29317. doi: 10.1371/journal.pone.0029317
Smedegård-Petersen V. (1971). Pyrenophora teres f. maculata f. nov. and Pyrenophora teres f. teres on barley in Denmark. Yearbook of the Royal Veterinary and Agricultural University. 1971, 124–144.
Sneller C., Mather D., and Crepieux S. (2009). Analytical approaches and population types for finding and utilizing QTL in complex plant populations. Crop Sci. 49, 363–380. doi: 10.2135/cropsci2008.07.0420
Song W.-Y., Wang G.-L., Chen L.-L., Kim H.-S., Pi L.-Y., Holsten T., et al. (1995). A receptor kinase-like protein encoded by the rice disease resistance gene, Xa21. Science 270, 1804–1806. doi: 10.1126/science.270.5243.1804
Song J., Win J., Tian M., Schornack S., Kaschani F., Ilyas M., et al. (2009). Apoplastic effectors secreted by two unrelated eukaryotic plant pathogens target the tomato defense protease Rcr3. Proc. Natl. Acad. Sci. 106, 1654–1659. doi: 10.1073/pnas.0809201106
Steffenson B., Hayes P., and Kleinhofs A. (1996). Genetics of seedling and adult plant resistance to net blotch (Pyrenophora teres f. teres) and spot blotch (Cochliobolus sativus) in barley. Theor. Appl. Genet. 92, 552–558. doi: 10.1007/BF00224557
Steffenson B. J. and Webster R. (1992). Pathotype diversity of Pyrenophora teres f. teres on barley. Phytopathology 82, 170–177. doi: 10.1094/Phyto-82-170
St. Pierre S., Gustus C., Steffenson B., Dill-Macky R., and Smith K. (2010). Mapping net form net blotch and Septoria speckled leaf blotch resistance loci in barley. Phytopathology 100, 80–84. doi: 10.1094/PHYTO-100-1-0080
Taibi K., Bentata F., Rehman S., Labhilili M., El Aissami A., Verma R. P. S., et al. (2016). Virulence of Moroccan Pyrenophora teres f. teres Revealed by International Differential Barley Genotypes. Cereal Res. Commun. 44, 263–271. doi: 10.1556/0806.44.2016.018
Tamang P., Neupane A., Mamidi S., Friesen T., and Brueggeman R. (2015). Association mapping of seedling resistance to spot form net blotch in a worldwide collection of barley. Phytopathology 105, 500–508. doi: 10.1094/PHYTO-04-14-0106-R
Tekauz A. (1985). A numerical scale to classify reactions of barley to Pyrenophora teres. Can. J. Plant Pathol. 7, 181–183. doi: 10.1080/07060668509501499
Tekauz A. (1990). Characterization and distribution of pathogenic variation in Pyrenophora teres f. teres and P. teres f. maculata from western Canada. Can. J. Plant Pathol. 12, 141–148. doi: 10.1080/07060669009501017
Thind A., Wicker T., Šimková H., Fossati D., Moullet O., Brabant C., et al. (2017). Rapid cloning of genes in hexaploid wheat using cultivar-specific long-range chromosome assembly. Nat. Biotechnol. 35, 793–796. doi: 10.1038/nbt.3877
Tör M., Brown D., Cooper A., Woods-Tör A., Sjölander K., Jones J. D. G., et al. (2004). Arabidopsis downy mildew resistance gene RPP27 encodes a receptor-like protein similar to CLAVATA2 and tomato Cf-9. Plant Physiol. 135, 1100–1112. doi: 10.1104/pp.103.037770
Vatter T., Maurer A., Kopahnke D., Perovic D., Ordon F., and Pillen K. (2017). A nested association mapping population identifies multiple small effect QTL conferring resistance against net blotch (Pyrenophora teres f. teres) in wild barley. PloS One 12, e0186803. doi: 10.1371/journal.pone.0186803
Veronese P., Nakagami H., Bluhm B., Abuqamar S., Chen X., Salmeron J., et al. (2006). The membrane-anchored BOTRYTIS-INDUCED KINASE1 plays distinct roles in Arabidopsis resistance to necrotrophic and biotrophic pathogens. Plant Cell 18, 257–273. doi: 10.1105/tpc.105.035576
Visioni A., Gyawali S., Selvakumar R., Gangwar O. P., Shekhawat P. S., Bhardwaj S. C., et al. (2018). Genome Wide Association Mapping of Seedling and Adult Plant Resistance to Barley Stripe Rust (Puccinia striiformis f. sp. hordei) in India. Front. Plant Sci. 9. doi: 10.3389/fpls.2018.00520
Visioni A., Rehman S., Viash S. S., Singh S. P., Vishwakarma R., Gyawali S., et al. (2020). Genome wide association mapping of spot blotch resistance at seedling and adult plant stages in barley. Front. Plant Sci. 11. doi: 10.3389/fpls.2020.00642
Williams K. J., Lichon A., Gianquitto P., Kretschmer J. M., Karakousis A., Manning S., et al. (1999). Identification and mapping of a gene conferring resistance to the spot form of net blotch (Pyrenophora teres f. maculata) in barley. Theor. Appl. Genet. 99, 323–327. doi: 10.1007/s001220051239
Williams K. J., Platz G. J., Barr A. R., Cheong J., Willsmore K., Cakir M., et al. (2003). A comparison of the genetics of seedling and adult plant resistance to the spot form of net blotch (Pyrenophora teres f. maculata). Aust. J. Agric. Res. 54, 1387–1394. doi: 10.1071/AR03028
Wolpert T. J., Dunkle L. D., and Ciuffetti L. M. (2002). Host-selective toxins and avirulence determinants: what’s in a name? Annu. Rev. Phytopathol. 40, 251–285. doi: 10.1146/annurev.phyto.40.011402.114210
Wonneberger R., Ficke A., and Lillemo M. (2017). Mapping of quantitative trait loci associated with resistance to net form net blotch (Pyrenophora teres f. teres) in a doubled haploid Norwegian barley population. PloS One 12, e0175773. doi: 10.1371/journal.pone.0175773
Yousfi B. E. and Ezzahiri B. (2002). Net blotch in semi-arid regions of Morocco II. Field Crops Res. 73, 81–93. doi: 10.1016/S0378-4290(01)00189-7
Zadoks J. C., Chang T. T., and Konzak C. F. (1974). A decimal code for the growth stages of cereals. Weed Res. 14, 415–421. doi: 10.1111/j.1365-3180.1974.tb01084.x
Zhou J., Loh Y.-T., Bressan R. A., and Martin G. B. (1995). The tomato gene Pti1 encodes a serine/threonine kinase that is phosphorylated by Pto and is involved in the hypersensitive response. Cell 83, 925–935. doi: 10.1016/0092-8674(95)90208-2
Keywords: barley, net form net blotch, resistance, Genome-wide association mapping (GWAM), Quantitative trait loci (QTL)
Citation: Rehman S, Al-Jaboobi M, Verma RPS, Sanchez Garcia M and Visioni A (2025) Genome-wide association mapping of net form net blotch resistance in barley at seedling and adult plant stages. Front. Agron. 7:1525588. doi: 10.3389/fagro.2025.1525588
Received: 10 November 2024; Accepted: 14 April 2025;
Published: 23 May 2025.
Edited by:
Karthikeyan Adhimoolam, Jeju National University, Republic of KoreaReviewed by:
Ping Yang, Chinese Academy of Agricultural Sciences, ChinaManoharan Akilan, Tamil Nadu Agricultural University, India
Copyright © 2025 Rehman, Al-Jaboobi, Verma, Sanchez Garcia and Visioni. This is an open-access article distributed under the terms of the Creative Commons Attribution License (CC BY). The use, distribution or reproduction in other forums is permitted, provided the original author(s) and the copyright owner(s) are credited and that the original publication in this journal is cited, in accordance with accepted academic practice. No use, distribution or reproduction is permitted which does not comply with these terms.
*Correspondence: Andrea Visioni, YS52aXNpb25pQGNnaWFyLm9yZw==
†These authors have contributed equally to this work