 Ranjan Kumar1
 Subhankar Ghosh1*
 Gautam R. Patel2
 Laishram Kanta Singh3*Amulya Kumar Mohanty4Arun Kumar Singha4
- 1Agricultural and Food Engineering (AgFE) Department, Indian Institute of Technology Kharagpur, Kharagpur, West Bengal, India
- 2Department of Soil and Water Conservation Engineering, College of Agricultural Engineering & Technology (CAET), Godhra, Gujarat, India
- 3Indian Council of Agricultural Research-Krishi Vigyan Kendra (ICAR-KVK) Imphal West, Indian Council of Agricultural Research (ICAR) Research Complex for North Eastern Hill (NEH) Region, Imphal, Manipur, India
- 4Indian Council of Agricultural Research (ICAR)-Agricultural Technology Application Research Institute, Umiam, Meghalaya, India
Introduction: Agro-land suitability evaluation is vital to determine the optimal use of agricultural land for specific crops, ensuring sustainable cultivation and maximizing yields.
Methods: This study focuses on assessing the suitability of land for wheat (Triticum L) cultivation in the Bhal region of Gujarat state, western India, a prominent agricultural area where fluctuating production levels have been attributed to sub-optimal crop selection. With wheat being a staple crop essential in meeting the demands of a growing population, systematic evaluation of the region’s land suitability is both timely and necessary. The analysis integrates a comprehensive range of parameters (17 in total), including land use/land cover, slope, soil texture, soil depth, maximum water-holding capacity, pH, Electrical Conductivity, Soil Organic Carbon, and the availability of essential macro-nutrients (N, P, K and S) and micro-nutrients (B, Cu, Fe, Mn and Zn). Using an advanced Multi-Criteria Decision Analysis (MCDA) methodology such as the Analytic Hierarchy Process (AHP) in a Geographic Information System (GIS) framework, a detailed land suitability map was developed for wheat cultivation.
Results and discussion: The soils in the Bhal region are found to be deficient of Nitrogen (N), Manganese (Mn), Iron (Fe) and Zinc (Zn), which necessitates fertilizer application. The highest and lowest normalized weights were obtained for soil texture (0.291) and Zinc concentration (0.017), respectively. The findings revealed that 24.80% (1121.1 km2) of total area is categorized as ‘highly suitable’, 31.37% (1418.2 km2) as ‘moderately suitable’, 12.40% (560.6 km2) as ‘least suitable’, and remaining 31.43% (1420.9 km2) as ‘not suitable’ for wheat cultivation. Ahmedabad, Kheda and Surendranagar districts are ‘highly’ to ‘moderately’ suitable, while Anand district is ‘moderately’ suitable and Bhavnagar district is ‘least’ suitable for wheat cultivation.
Concluding remarks and significance: These results underscore the critical importance of soil fertility and crop-specific land assessment in guiding agricultural strategies. The present study provides valuable insights into agricultural land-use planning and crop management, offering a data-driven approach to enhance wheat productivity in the Bhal region. By addressing the challenges of crop selection and resource optimization, these findings contribute to ensuring food security and promoting sustainable agricultural practices in the region.
1 Introduction
Land, as a fundamental natural resource, supports crucial environmental, ecological, and agricultural functions. It provides essential components such as soil, water, nutrients, and minerals required for sustaining life and supporting human development. Effective and sustainable management of land resources is indispensable, especially in agrarian economies where land serves as the backbone of food, fiber, fodder, and fuel production (Pimentel et al., 1995; FAO, 2017). However, rapid global population growth, coupled with increasing urbanization and industrialization, has intensified the demand for agricultural outputs, placing unprecedented pressure on finite land resources. This challenge is further exacerbated in developing countries like India, where agriculture employs nearly 45.5% of the workforce and contributes around 17.8% to the national Gross Domestic Product (GDP) (Economic Survey, 2023; NSSO, 2024). Despite its economic significance, Indian agriculture is fraught with challenges, including land degradation, resource mismanagement, and climate variability, which collectively threaten the sustainability of food production systems (NSSO, 2013; Kumar et al., 2020).
The degradation of arable land is a critical issue in India. A report by the Indian Council of Agricultural Research (ICAR) highlights that approximately 120.40 million hectares of Indian land are affected by various forms of degradation, including water and wind erosion, salinity, alkalinity, and acidity (ICAR, 2010). The most affected regions include Rajasthan, Madhya Pradesh, Maharashtra and parts of the Deccan Plateau, which face severe degradation due to wind erosion, waterlogging, and salinity. The Food and Agriculture Organization (FAO) estimates that India loses about 5.3 billion tons of soil annually due to erosion, significantly diminishing the productivity of its agricultural lands (Lal, 2001; FAO, 2017). Concurrently, the conversion of cultivable land to non-agricultural uses has reduced the net sown area, intensifying pressure on the remaining arable land to meet the growing food demands of a population projected to reach 1.64 billion by 2050 (Ray et al., 2013; Agricultural Census, 2018). With approximately 194.6 million people classified as malnourished, food insecurity remains a significant concern for policymakers and researchers alike (Smith et al., 2000; FAO, 2015). Addressing this dual challenge of increasing agricultural productivity while conserving land resources requires a strategic and scientific approach to land-use planning and crop management. Geographical Information Systems (GIS) play a pivotal role in land resource assessment by enabling spatial visualization, analysis, and integration of diverse biophysical parameters, which is essential for effective land-use planning and precision agriculture.
Moreover, agro-land suitability analysis has emerged as a pivotal tool in optimizing agricultural practices by assessing the potential of land for specific crops. This approach evaluates various biophysical and environmental parameters, such as soil texture, slope, moisture availability, nutrient content, and climatic conditions, to determine areas where specific crops are most likely to thrive (Zolekar and Bhagat, 2015). Recent advancements in geospatial technologies, particularly Geographic Information System (GIS) and Remote Sensing (RS), have significantly enhanced the accuracy and efficiency of agro-land suitability assessments (Valjarević et al., 2025). GIS enables the integration and spatial analysis of diverse datasets, while Multi-Criteria Decision Analysis (MCDA) methods, such as the Analytic Hierarchy Process (AHP), provide robust decision-making frameworks for prioritizing land use based on multiple, often competing criteria (Saaty, 1980; Malczewski, 2004; Ghosh et al., 2024). Studies have successfully employed these tools for evaluating land suitability for crops like rice (Ayoade, 2017; Islam et al., 2018; Rath et al., 2018; Özkan et al., 2019; Baroudy et al., 2020; Setyanto et al., 2023; Singha et al., 2023; Bazkiaee et al., 2024), wheat (Pilevar et al., 2020; Kılıc et al., 2022; Wang et al., 2023), maize (Ramamurthy et al., 2020; Awoonor et al., 2023; Król-Badziak et al., 2024) and sugarcane (Azadi et al., 2023; Chen et al., 2023; Gelalacha et al., 2024). However, significant research gaps remain in their application to wheat (Triticum spp.) cultivation, particularly in underexplored regions such as the Bhal area of Gujarat state, located in western India, where unique challenges like soil salinity, waterlogging, and nutrient deficiencies demand localized and precise assessments (Nayak et al., 2000; Dubey et al., 2003; Joshi et al., 2021).
The Bhal area of Gujarat state, a predominantly agrarian region located in western India, plays a vital economic role but suffers from inconsistent agricultural productivity due to sub-optimal crop selection and land management practices. This region, characterized by low-lying plains and heavy black soils, is particularly prone to waterlogging and salinity, making it imperative to adopt tailored approaches for assessing land suitability. Despite Gujarat contributing only 4–5% to India’s total wheat production, localized studies in marginal regions like the Bhal area are critical for enhancing regional food security and optimizing land use under challenging agro-climatic conditions. Given the area’s susceptibility to salinity and waterlogging, identifying suitable zones for wheat cultivation can provide significant economic and ecological benefits at the local scale, which cumulatively contribute to national objectives of sustainable agriculture. While some studies have explored land suitability for staple crops in Gujarat (e.g., Gurung, 2019; Dutta et al., 2024), their methodologies often lack the integration of modern geospatial tools such as high-resolution GIS and remote sensing and fail to account for the complex interplay of biophysical and chemical soil properties. Additionally, previous assessments have often relied on generic frameworks, which limit spatial accuracy and reduce practical applicability for farmers and policymakers. Gujarat’s semi-arid climate and saline soil conditions present unique challenges, similar agro-climatic characteristics are also found in Rajasthan and parts of Andhra Pradesh, making this study relevant for broader application in regions with comparable environments.
The present study aims to address the above-mentioned research gaps by employing advanced GIS-based MCDA method like AHP to evaluate land suitability for wheat cultivation in the Bhal region of Gujarat state, western India. This study has a dual objective: first, to assess the spatial suitability of land for wheat cultivation in the underexplored the Bhal region; and second, to demonstrate the application of AHP, a structured MCDA method within a GIS framework to improve the granularity and reliability of land suitability maps. Key parameters, including land use/land cover, soil, topography, moisture availability, salinity, organic carbon, and availability of essential macro- and micro-nutrients, are to be incorporated into the analysis to develop a high-resolution land suitability map. This research represents a significant advancement over previous studies by combining geospatial precision with an MCDA framework, enabling a more comprehensive evaluation of land potential. Such a comprehensive study is the first of its kind in western India in general and in this region in particular. The Analytic Hierarchy Process (AHP) was selected due to its ability to incorporate expert judgment and pairwise comparisons, offering a transparent and flexible approach for weighting multiple criteria. Compared to other MCDA methods such as TOPSIS or Ordered Weighted Averaging (OWA), AHP allows for more nuanced prioritization of criteria, which is crucial in complex agro-environmental assessments. TOPSIS, while effective in ranking alternatives, often assumes linear trade-offs and lacks the capacity for detailed hierarchical structuring of criteria. Similarly, OWA requires the predefinition of weighting vectors, which may not capture expert preferences as precisely. These limitations make AHP a more robust and interpretable choice for integrating diverse biophysical and environmental variables within a GIS-based land suitability framework.
According to the FAO framework for land evaluation, land suitability refers to the fitness of a given land unit for a defined use, incorporating not only soil characteristics but also climatic, hydrological, topographical, management, and socio-economic factors (FAO, 1976). In contrast, soil suitability refers specifically to the capacity of the soil component of land to support agricultural productivity based on its physical and chemical properties. Therefore, while soil properties are critical to crop performance, they represent only one subset of the broader land suitability framework. This study recognizes this distinction and aims to evaluate land suitability for wheat cultivation, not solely based on edaphic (soil) parameters but by integrating a wider range of biophysical indicators. The use of Land Use/Land Cover (LULC), slope, and Maximum Water Holding Capacity (MWHC) extends the scope beyond the soil profile, allowing for a more comprehensive land evaluation aligned with FAO guidelines.
By focusing on wheat cultivation, a staple crop critical to India’s food security, this study provides actionable insights for optimizing land use in the Bhal region. The findings not only have implications for enhancing wheat production in Gujarat but also contribute to broader efforts in sustainable agricultural development, land resource conservation, and food security. This research underscores the transformative potential of integrating modern geospatial technologies with robust decision-making frameworks in addressing the complex challenges of agricultural land management.
2 Materials and methods
2.1 Study area description
The Bhal region, situated in the southwest borderlands of Gujarat state, western India, spans mainly across five districts, i.e., Ahmedabad, Anand, Bhavnagar, Surendranagar and Kheda. Covering approximately 4520.8 km2 between 21°45’ N to 22°45’ N latitudes and 71°45’ E to 72°45’ E longitudes, this region includes parts of the Bhavnagar and Ahmedabad revenue districts bordering the Gulf of Khambhat (Figure 1). The study area consists of 17 administrative units (known as ‘blocks’), namely, Bavla, Kheda, Dholka, Matar, Sojitra, Petlad, Tarapur, Limbdi, Chuda, Khambhat, Dhandhuka, Barwala, Botad, Bhavnagar, Vallabhipur, Umrala and Sihor. Though considered geographically deprived, the region presents unique agricultural opportunities. This low-lying region borders the Gulf of Khambhat and is characterized by distinct agro-ecological features and unique coastal vegetation (Vyas and Joshi, 2015). The Bhal region experiences a semi-arid climate with three distinct seasons: summer (March–May), monsoon (June–September) and winter (October–February). The average annual rainfall ranges between 500 mm and 700 mm primarily due to the southwest monsoon from June to September, supplemented occasionally by the northeast monsoon from November to February (Pisal et al., 2017). This rainfall is largely stored as in-situ moisture, with wheat fields sometimes benefitting from additional irrigation. The temperature range of 12°–25°C during the wheat-growing season is ideal for wheat cultivation, supporting crop viability (Parmar et al., 2020).
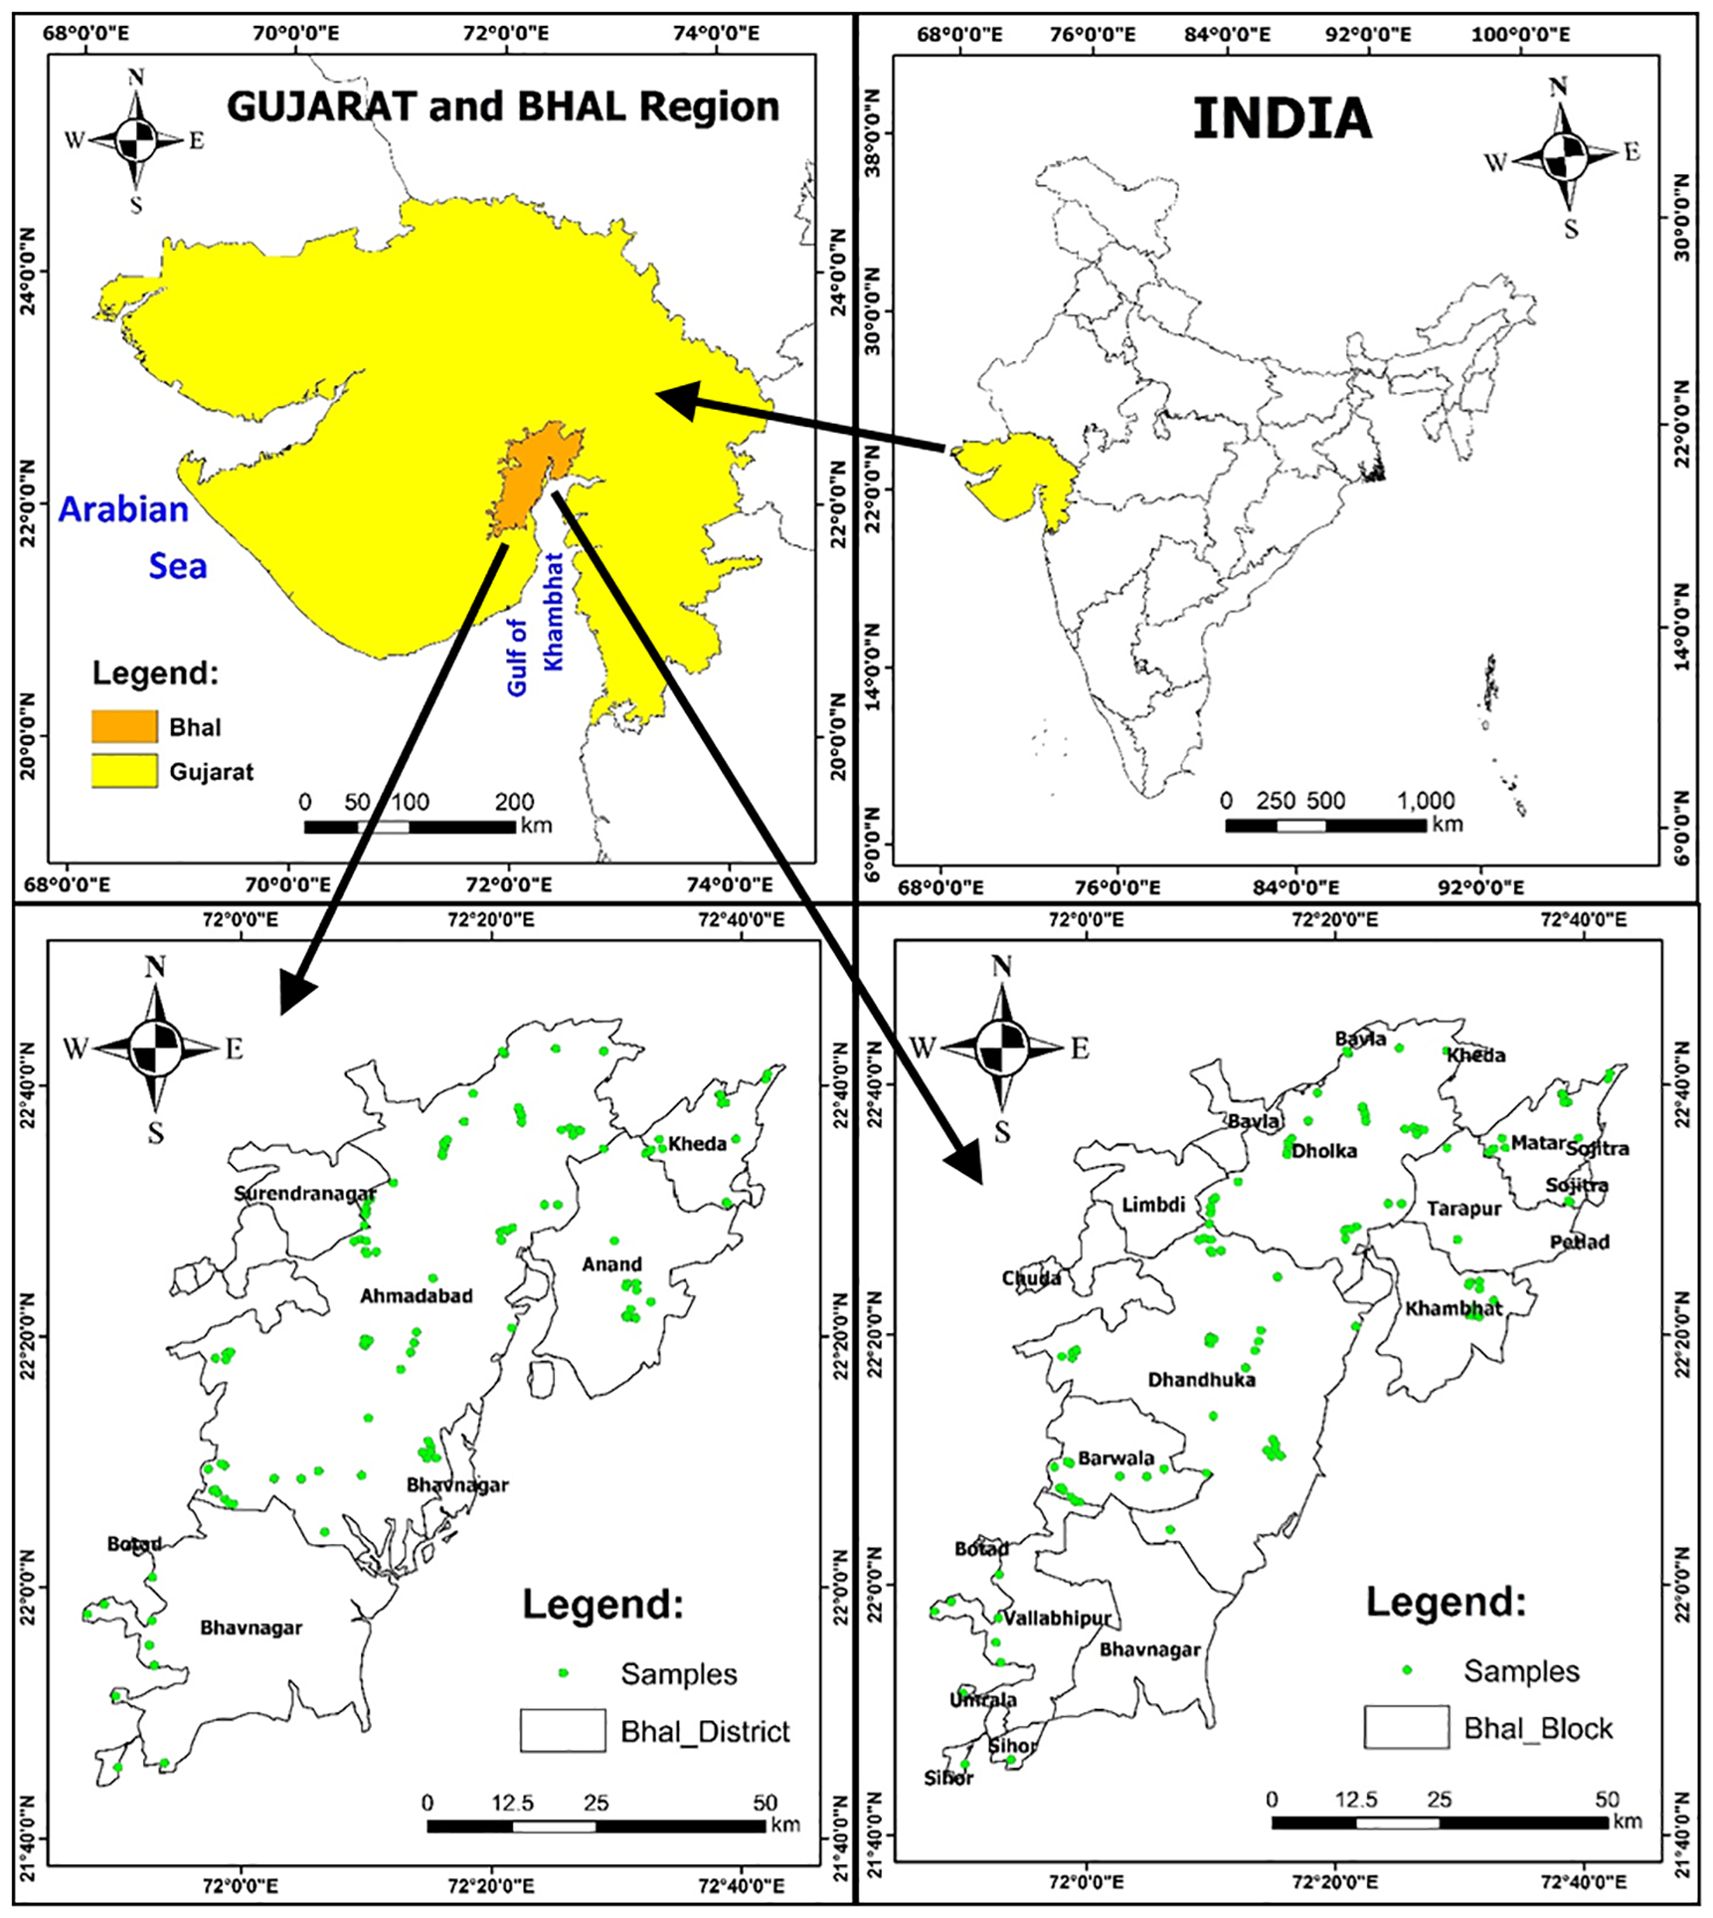
Figure 1. Location map of the study area (Bhal region, Gujarat state, western India) showing district boundaries, block boundaries and 145 soil-sampling locations.
Soils in the region are predominantly calcareous and sodic, with pH levels often around 8.0. These soils are prone to waterlogging and reduced permeability, forming marshes during the monsoon (Patil et al., 2023). Their physical characteristics—sticky when wet, hard when dry—adversely affect both Rabi and Kharif cropping patterns (Sharma and Chaudhari, 2012). The resulting moisture stress often restricts crop growth, reducing yields. Given these constraints, this study aims to analyze the agricultural land suitability of the Bhal region with a specific focus on wheat, by integrating soil, climate, and land use factors using geospatial methods to enhance productivity and inform sustainable land-use planning.
2.2 Data collection
Digital elevation model (DEM) data of the Shuttle Radar Topography Mission (SRTM) was obtained from the USGS website (https://earthexplorer.usgs.gov/), with a spatial resolution of 1-arc second (30m×30m). Land use/land cover (LULC) maps of November 2006 (IRS P-6, LISS-III sensor, 23.5 m spatial resolution) and November 2018 (Sentinel-1, 10 m spatial resolution) were acquired from the Bhaskaracharya National Institute for Space Applications and Geo-informatics (BISAG), Gandhinagar (https://bisag-n.gov.in/) (Supplementary Figures S1a, b). Landsat 8 imagery with 30 m spatial resolution was used, and pre-processing steps such as geometric correction, atmospheric correction, and resampling were applied to ensure alignment with other thematic layers used in the GIS-based analysis. A total of 145 soil samples were collected from locations more or less uniformly distributed across the Bhal region, during the Rabi season (November–January, 2018) to ensure spatial and temporal consistency (Supplementary Table S1). Samples were taken at a depth of 0–15 cm using a stainless-steel auger. Soil samples were air-dried, sieved (2 mm), and analyzed at Anand Agricultural University’s Soil Testing Laboratory. The Electrical Conductivity (EC) and pH were measured using digital meters in a 1:2.5 soil-to-water suspension. Soil Organic Carbon (SOC) was determined using the Walkley and Black method, while available Nitrogen (N) was measured by the alkaline KMnO4 method, and Phosphorus (P), Potassium (K), and Sulfur (S) were analyzed using standard colorimetric and photometric techniques. Micronutrients (B, Cu, Fe, Mn, Zn) were extracted using DTPA (Diethylenetriaminepentaacetic acid) and analyzed with Atomic Absorption Spectrophotometry (AAS). Data accuracy was validated by expert review and cross-checked against reference standards, with a coefficient of variation (CV) below 10% for all analyses.
2.3 Methodology
2.3.1 Preparation of thematic maps
Remotely-sensed data, complemented by field-based observations, were integral to developing thematic maps within a GIS environment, supporting a comprehensive suitability analysis for wheat cultivation in the Bhal region of Gujarat state, western India. A total of 17 thematic layers were prepared, including LULC, slope, soil texture, soil depth, maximum water-holding capacity (MWHC), pH, electrical conductivity (EC), soil organic carbon (SOC), and the availability of essential macro- (N, P, K, S) and micro-nutrients (B, Cu, Fe, Mn, Zn). These parameters were selected due to their relevance to wheat crop performance and their availability at a high spatial resolution for the Bhal region. Climatic variables such as rainfall and temperature, as well as cropping intensity and irrigation infrastructure, were not included due to the absence of localized, high-resolution datasets for these parameters. However, proxies such as MWHC and LULC partially capture the influence of water availability and land management. The slope and depth data indirectly reflect land workability and drainage conditions, which influence irrigation efficiency. Future work may incorporate climate modeling and temporal remote sensing data to capture dynamic variables like cropping intensity and seasonal water stress.
The LULC maps for November, 2006 (Supplementary Figure S1a) and November, 2018 (Supplementary Figure S1b) were acquired for comparison purposes. The maps were pre-processed (i.e., geometric correction, radiometric correction, layer-stacking, and mosaicking) and classified using a supervised classification algorithm available in ArcGIS v10.4. ArcGIS software was chosen for its superior classification capabilities, providing clear delineation of various LULC classes, which is essential given the study area’s large extent. The LULC thematic map (raster data) of November 2018 was specifically used to assess agro-land suitability for wheat, reflecting the current land use scenario in the region. The SRTM DEM data was used to prepare the %slope theme (raster map) in ArcGIS v10.4. Soil data (i.e., texture, depth, and MWHC) acquired from the NBSS&LUP were digitized in ArcGIS v10.4, and those shapefiles were further processed to prepare the soil thematic layers (raster maps). Spatial variation maps of pH, EC, SOC, and nine essential macro- and micro-nutrients were prepared using the Inverse Distance Weighted (IDW) interpolation method in ArcGIS v10.4.
2.3.2 Analytic hierarchy process
The Analytic Hierarchy Process (AHP) is a structured multi-criteria decision-making method that integrates mathematics and human psychology to solve complex problems. It was originally developed by Prof. Thomas L. Saaty in the late 1970s and formalized in the 1980s (Saaty, 1980). AHP is widely used in land suitability analysis (Mustafa et al., 2011; Akıncı et al., 2013; Rabia and Terribile, 2013; Pramanik, 2016; Sathiyamurthi et al., 2024), land-use planning (Nyeko, 2012), and establishing public policy (Velasquez and Hester, 2013). Its hierarchical structure enhances decision-making transparency, consistency, and confidence, particularly in spatial multi-criteria evaluations.
To assess land suitability for wheat in the Bhal region, the study followed a series of methodological steps. Initially, essential thematic maps and databases were prepared to compile baseline information of the study region. Key criteria for land suitability analysis were identified, and ranked following the FAO guidelines mentioned in FAO Soil Bulletin and expert opinions gathered from specialists in soil science and agronomy (FAO, 1976). Fourteen specialists, including soil researchers and agronomists, contributed insights via structured AHP questionnaires (Supplementary Table S2), where they conducted pairwise comparisons of criteria according to the FAO (1976) and Saaty’s scale given in Saaty (1980). This expert feedback and grounded in experience were crucial in achieving reliable and satisfactory results. This ranking allowed for a systematic judgment analysis, assigning ranks that were calculated to form a normalized pairwise comparison matrix, which provided weighted criteria for subsequent GIS-based evaluation. The weight coefficients for each criterion were derived by averaging expert judgments using Saaty’s 1–9 scale in the pairwise comparison matrix, followed by normalization to ensure the consistency of weights, and verified using a Consistency Ratio (CR) threshold of less than 10% or 0.10. This methodology ensures robust judgments and minimizes bias in criteria selection and score assignment. Microsoft Excel v2016 enabled the preparation of a pairwise comparison matrix to prioritize parameters, leading to the assignment and calculation of weights essential for GIS-based analysis.
AHP employs pairwise comparison matrix to assign ranks to criteria (themes), effectively assessing their relative significance while minimizing judgment errors through consistency ratio calculation (Cengiz and Akbulak, 2009; Mustafa et al., 2011; Jenifer and Jha, 2017). Known for its flexibility and accuracy (Malczewski, 2006), the AHP method applied in this study for wheat cultivation suitability analysis followed six major steps: (1) rank assignment to criteria (theme), (2) preparation of pairwise comparison matrix, (3) normalized weight calculation for themes, (4) score assignment to the features under each theme, (5) weighted overlay analysis in GIS, and (6) land suitability map generation.
2.3.2.1 Pairwise comparison matrix
The pairwise comparison analysis allows decision-makers to assign varying levels of importance to individual factors based on crop-specific land suitability needs (Elaalem, 2012). Ranks are assigned to each criterion according to their relative significance and land features, as recommended in past land suitability studies (Pilevar et al., 2020; Kılıc et al., 2022; Wang et al., 2023; Ayoade, 2017; Ramamurthy et al., 2020; Gelalacha et al., 2024). This method benefits the assessment of land suitability by incorporating all relevant factors (themes). Pairwise comparisons were established through expert opinions, literature, and research, enabling the Analytic Hierarchy Process (AHP) to systematically rank criteria (Saaty, 1997). The resulting matrix used ranks from 1 to 17 to determine the influence of each criterion (theme), allowing us to judge the relative importance and dominance of each over others (Table 1). The theme with the highest importance was assigned the rank of 1, and the least important theme was assigned a rank of 17. Normalized weights of the themes were calculated using the AHP method (Jenifer and Jha, 2017). The ranks given to all the parameters (themes) were based on expert opinion and FAO guidelines, and are shown in Table 1. The consistency ratio for normalized AHP weights was calculated, and it was found to be 0.02 (<10%), suggesting that the weights are consistent. Pairwise comparison matrix and normalized pairwise comparison matrix of land suitability parameters are shown in Supplementary Table S2 and Supplementary Table S3, respectively.
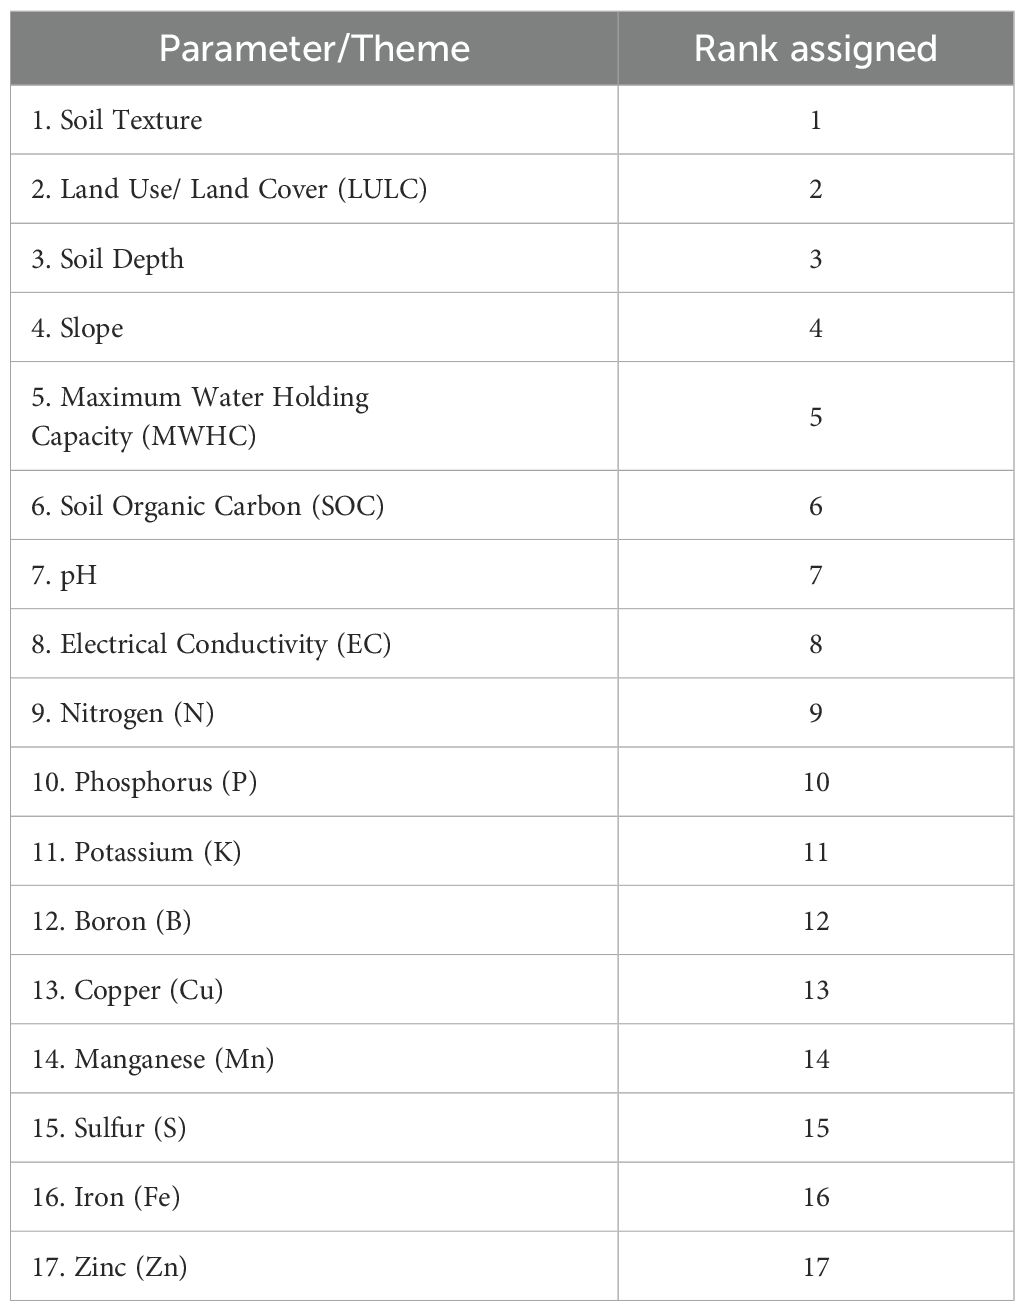
Table 1. Parameters/themes selected for land suitability analysis with their assigned ranks.
2.3.2.2 Assignment of feature scores
Following the FAO (1976) guidelines and studies conducted by Bandyopadhyay et al. (2009) and Akıncı et al. (2013), scores of 1 to 4 (Table 2) were assigned to the features of each theme, where higher scores indicate better suitability for wheat cultivation and vice versa. Gently sloped, deep soils with high MWHC, moderate pH, and adequate nutrients received the highest scores as they provide favorable conditions for wheat cultivation. Conversely, steep, shallow, and rocky soils with poor nutrient levels were assigned lower scores, reflecting limitations for agriculture.
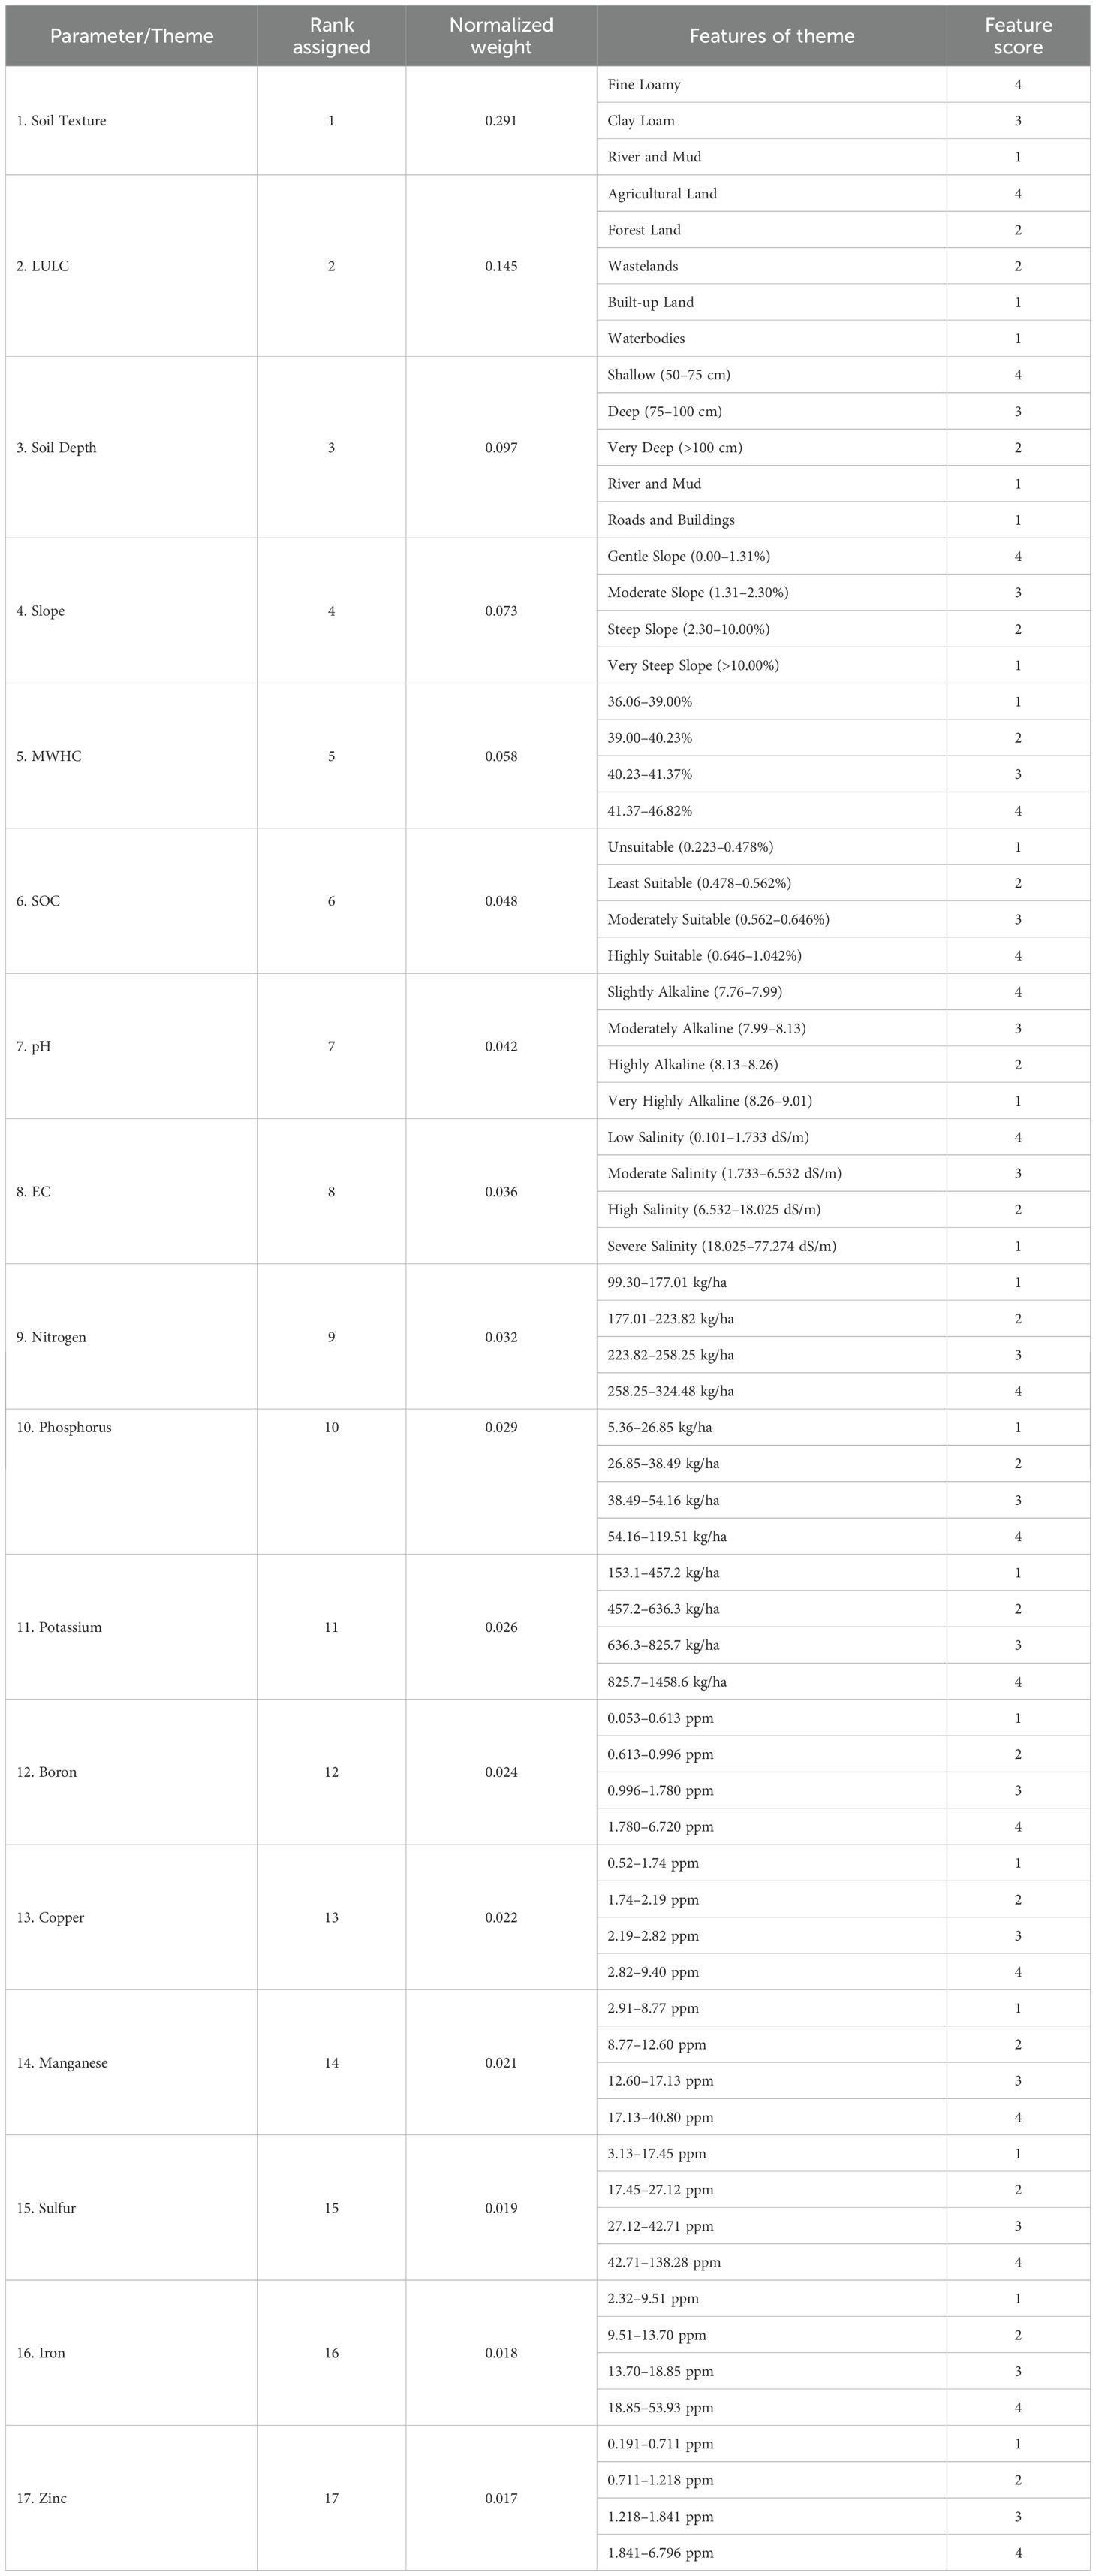
Table 2. Normalized theme weights and their feature scores.
2.3.2.3 Weighted overlay analysis in GIS
The Weighted Overlay Analysis (WOA) function in ArcGIS v10.4 is effective for complex site selection and suitability mapping (Girvan et al., 2003; Kuria et al., 2011). The raster layers of the themes were overlaid in a GIS environment, and the land suitability map was generated by multiplying normalized theme weights and their feature factor values (Cengiz and Akbulak, 2009; Mojid et al., 2009). The land suitability score (S) for wheat cultivation was calculated following Equation 1:
where, S = land suitability score for wheat, Wi = normalized weight of land suitability parameter/theme, n = total number of land suitability parameters, Fj = scores of features of individual themes, and m = number of features under each theme. The resulting score values were classified into four land suitability categories: (i) ‘not suitable’ (1.00–1.75), (ii) ‘least suitable’ (1.75–2.50), (iii) ‘moderately suitable’ (2.50–3.25), and (iv) ‘highly suitable’ (3.25–4.00). Field observations were also taken into account for verifying these classifications, keeping in mind different land uses in the region.
2.3.2.4 Schematic representation of the methodology
Figure 2 illustrates the step-by-step framework used in this study for agro-land suitability analysis of wheat. It includes data collection, pre-processing, parameter evaluation, GIS-based multi-criteria analysis, and final suitability mapping for wheat cultivation in the Bhal region. This systematic approach ensures accurate and reliable outcomes for land-use planning.
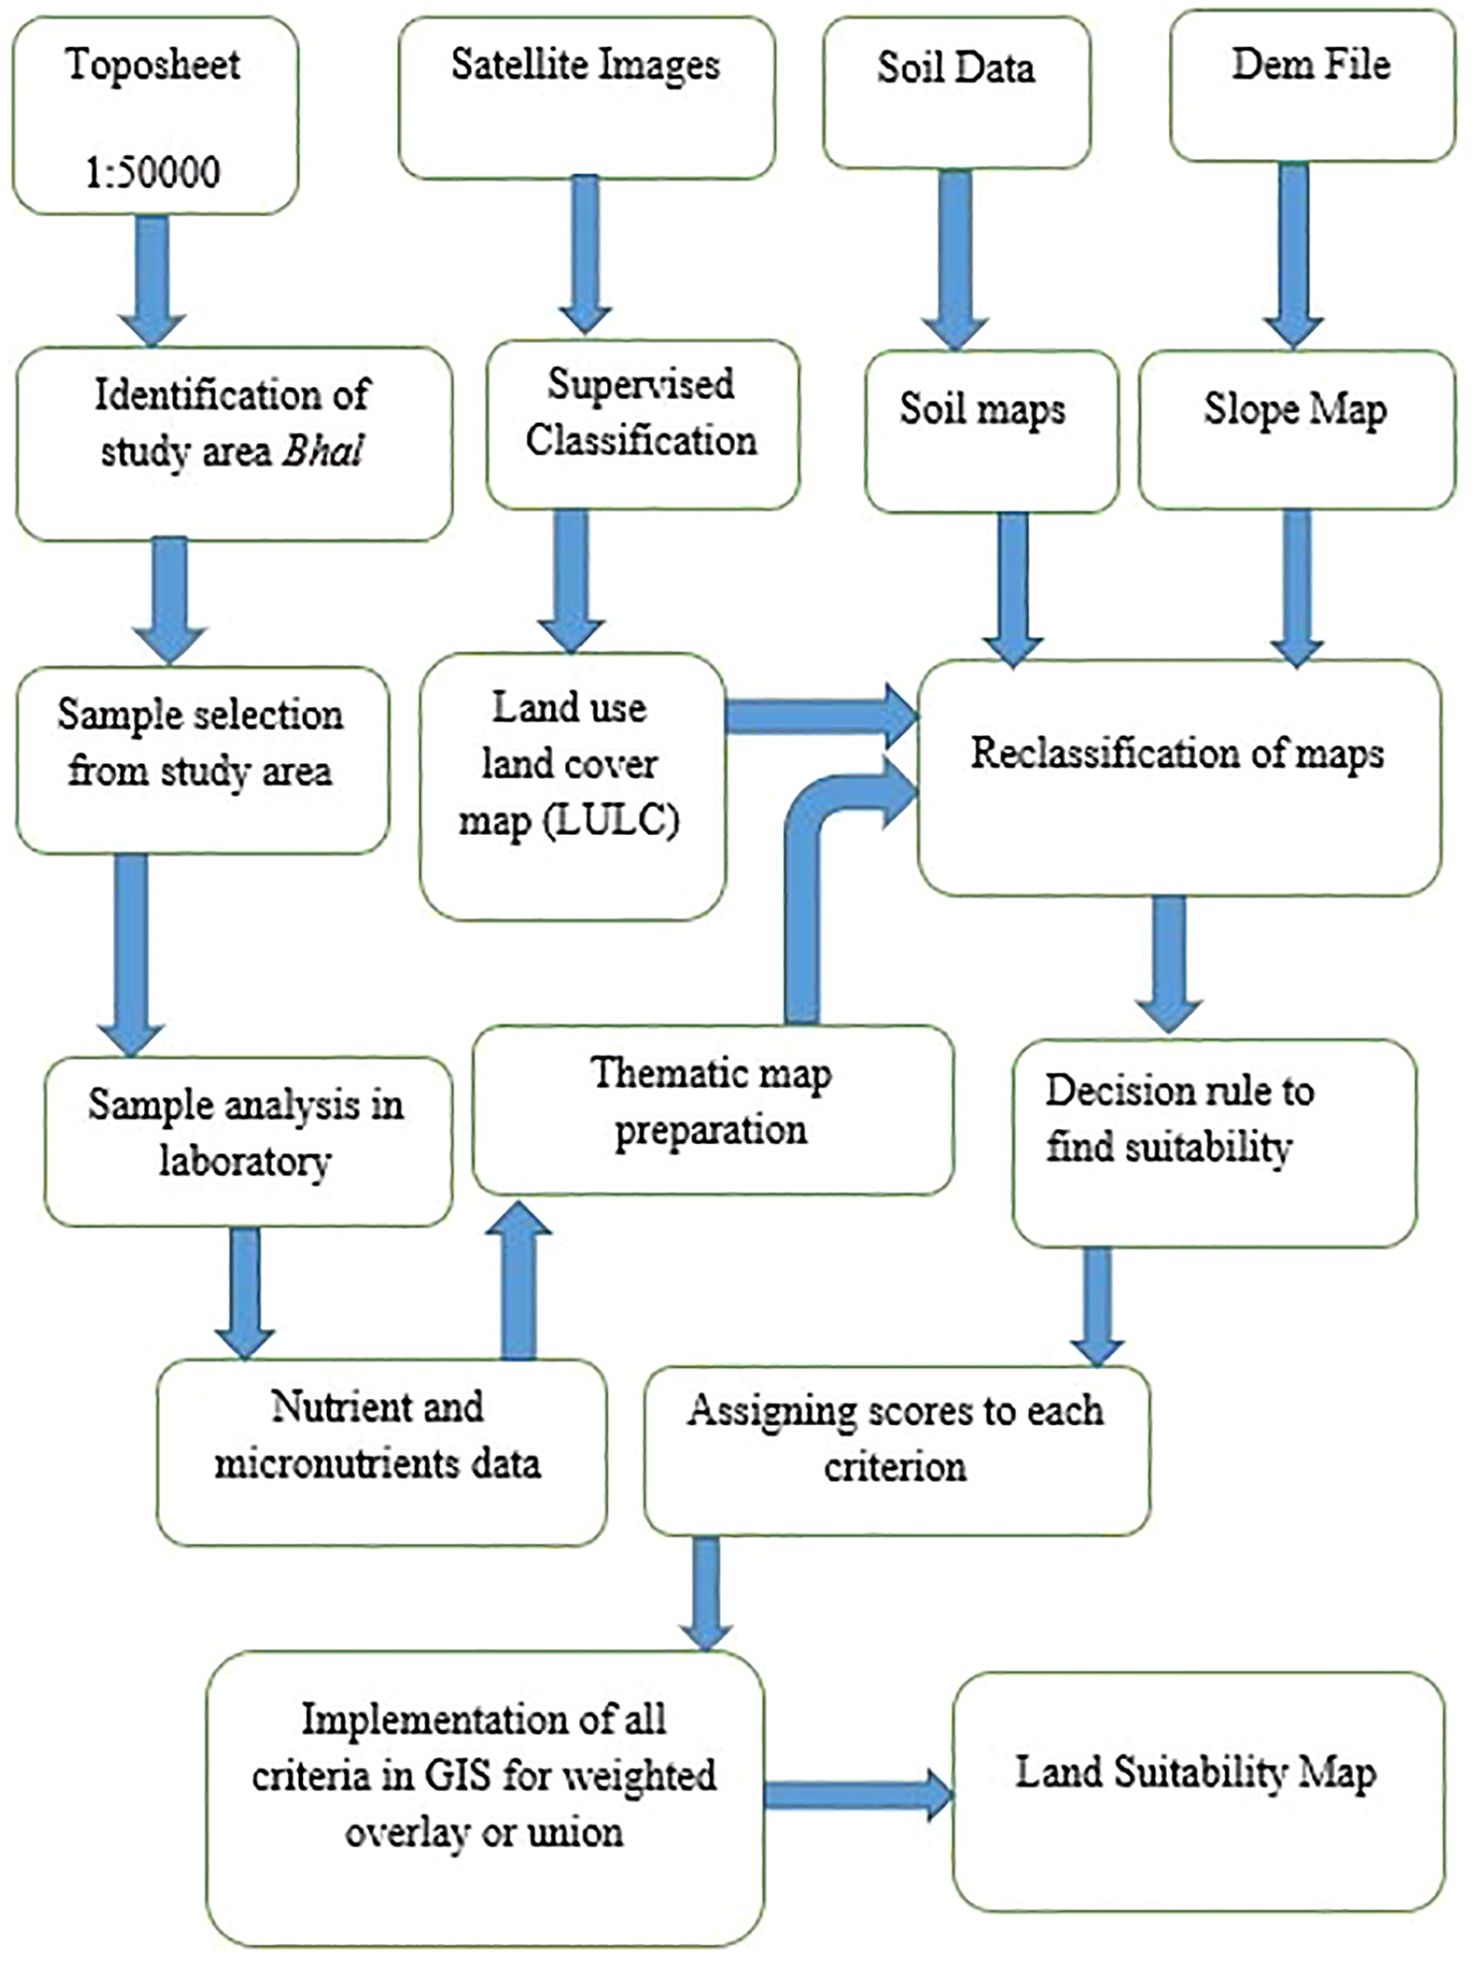
Figure 2. Schematic representation of the methodology adopted in this study.
3 Results and discussion
3.1 Comparative assessment of land use/land cover changes
The land use/land cover (LULC) maps indicate that in November 2006 (Figure 3a), the study area comprised of 69.04% agricultural land, 23.78% wastelands, 1.56% built-up areas, 3% water bodies, and 2.52% forest (Table 3). However, agricultural land increased to 71.42% in November 2018, driven by rising population pressures and the conversion of wastelands to farmland (Figure 3b). Built-up areas rose to 2.14%, reflecting urbanization and increased housing demand. Waterbodies showed a slight increase to 4.07%, likely due to improved water storage techniques; however, part of this increase could also be attributed to differences or limitations in satellite image classification methods. Wastelands decreased to 20.48%, as a consequence of the rise in agriculture and built-up areas. Forest cover declined to 1.89% due to conversion into agricultural land and urban development. Overall, the changes from 2006 to 2018 illustrate significant shifts in land-use patterns driven by population growth and urbanization (Figures 3a, b). The observed increase in agricultural area and concurrent reduction in wasteland may be driven by socio-economic factors such as rising demand for food due to population growth, government schemes promoting cultivation (e.g., subsidies, irrigation support), and encroachment or conversion of marginal lands into arable land. These socio-economic drivers align with previous studies on land-use changes in similar regions, where agricultural expansion has been linked to both economic incentives and demographic pressures.
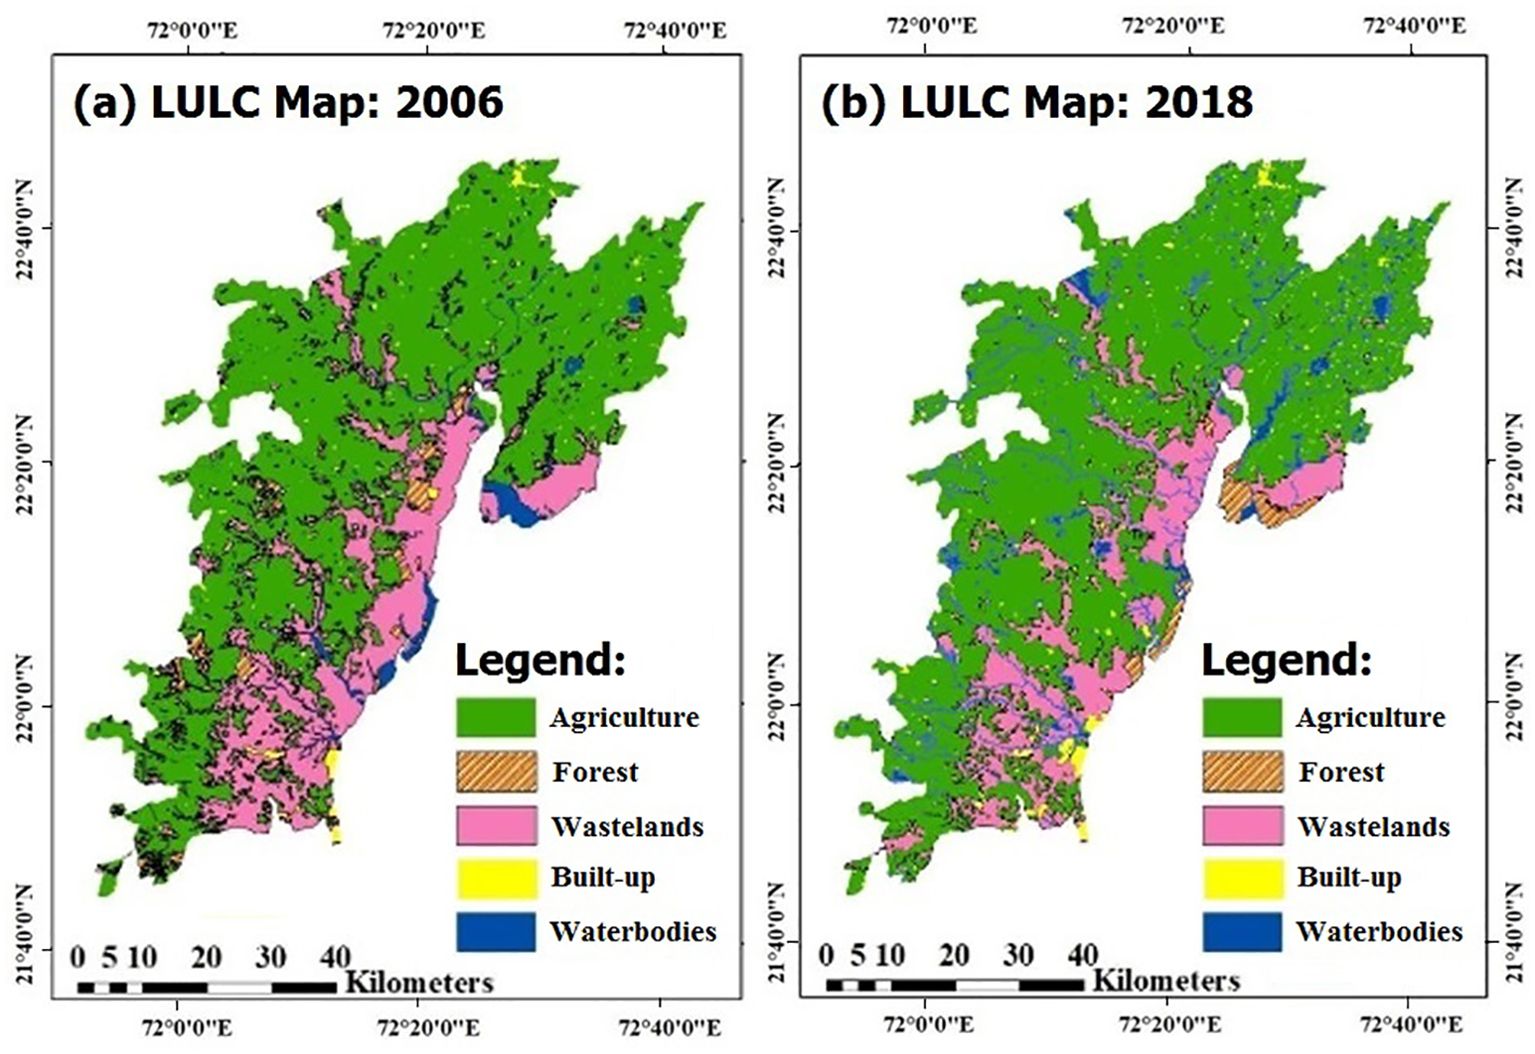
Figure 3. (a, b) Land use/land cover (LULC) maps of: (a) November 2006, and (b) November 2018.
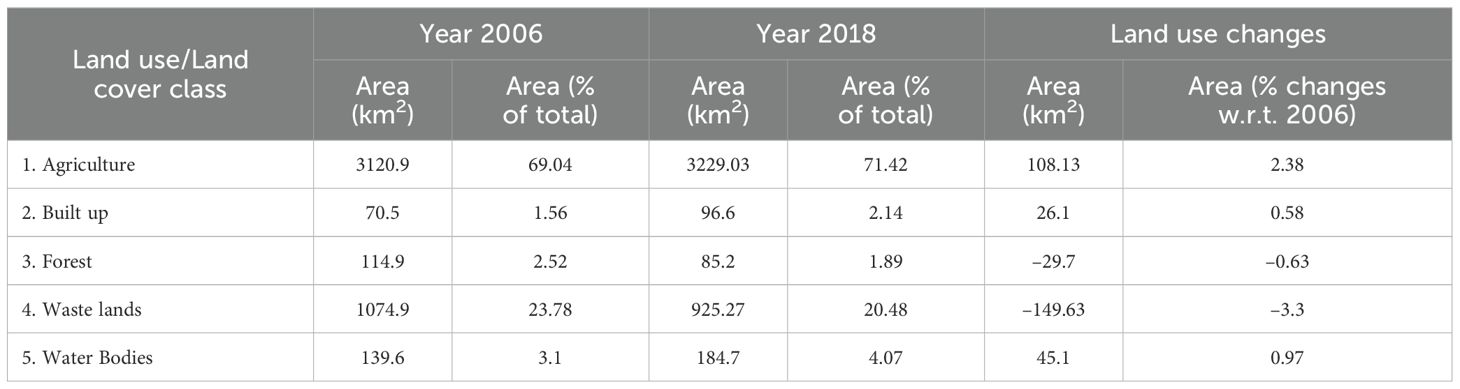
Table 3. Changes in land use/land cover pattern of the Bhal region between 2006 and 2018.
3.2 Spatial variation maps of thematic layers
3.2.1 Slope and soil depth maps
The land slope of the study area predominantly varies within a range of 0–2.5%, with 99.99% of the area falling under gentle slopes (0.00–1.31% and 1.31–2.30%), which are suitable for wheat cultivation (Figure 4a). Steeper slopes (2.30–10.00% and 10.00–35.00%) constitute only 0.01% of the area, which is shown in Figure 4a, and are generally unsuitable due to soil erosion that diminishes soil fertility. Wheat requires gentle slopes that retain sufficient moisture without water stagnation, making slopes up to 2.5% favorable.
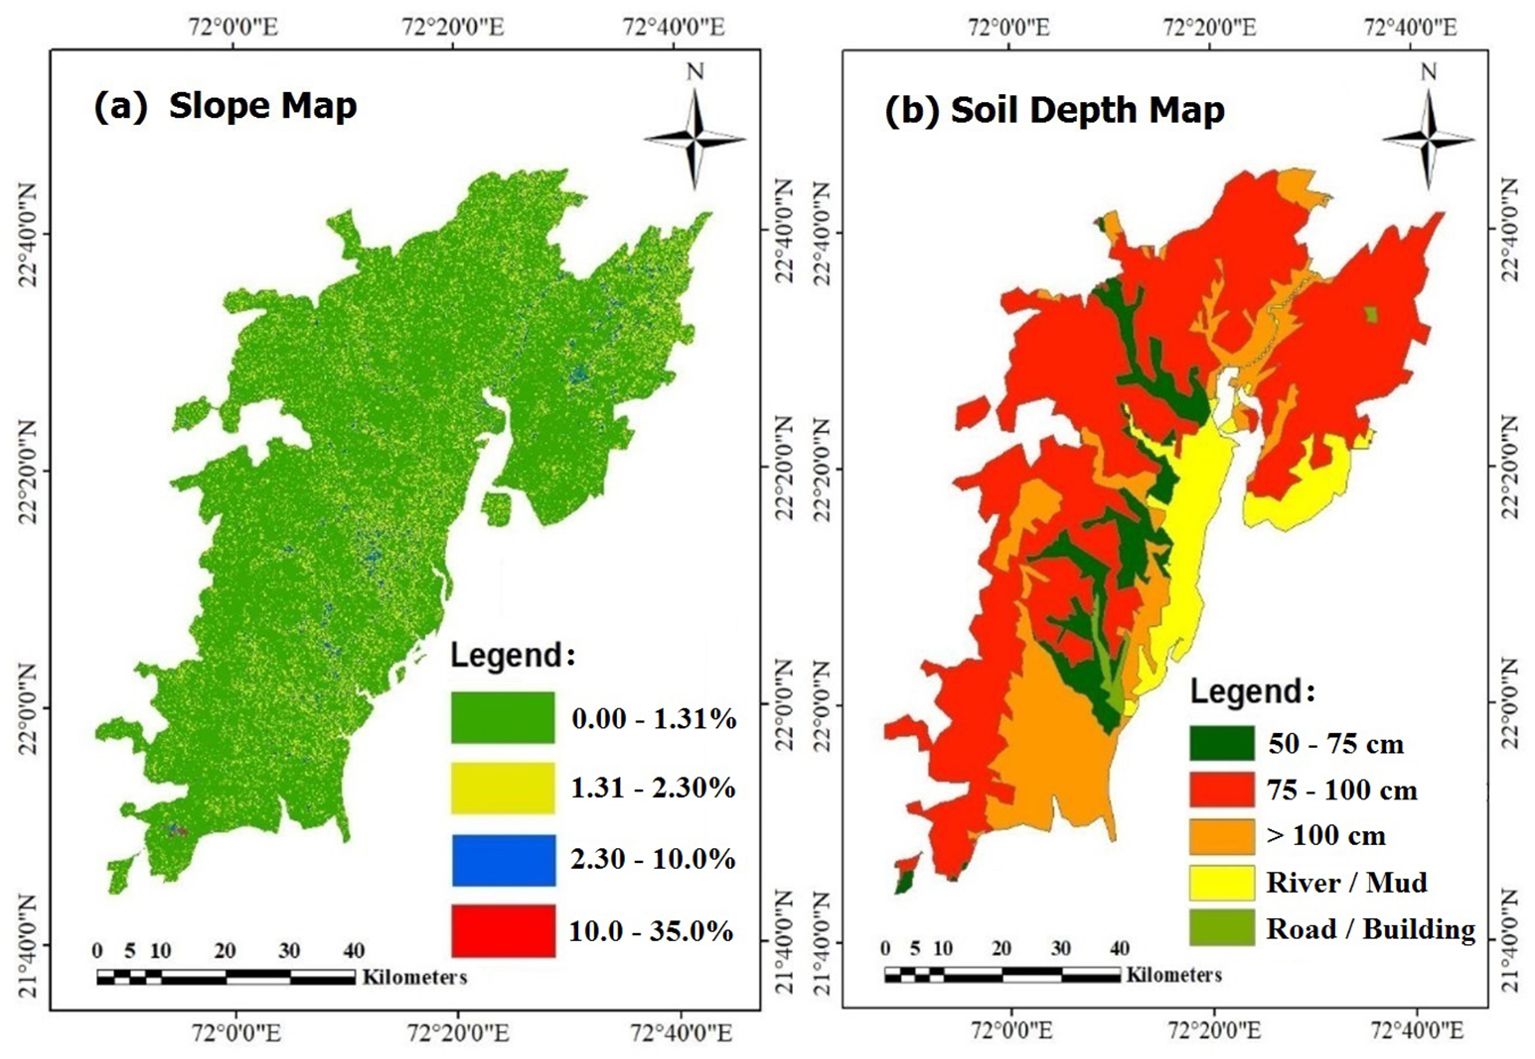
Figure 4. (a, b) Spatial variation maps of: (a) slope, and (b) soil depth.
Soil depth across the study area ranges from shallow (50–75 cm) to very deep (>100 cm), as shown in Figure 4b. Shallow (50–75 cm) and deep (75–100 cm) soils are ideal for wheat as it supports root development, aeration, and moisture availability. Deeper soils (>100 cm), though more suitable for crops requiring higher water retention, can also support wheat under appropriate management. These factors highlight the critical role of slope and soil depth in determining land suitability for sustainable wheat farming.
3.2.2 MWHC and soil texture maps
The study area has favorable maximum water holding capacity (MWHC) for wheat cultivation, with 42.5% of the total area having MWHC between 41.37–46.82%, and 31.9% of area has a MWHC between 40.23–41.37% (Figure 5a). These values indicate sufficient moisture retention to support wheat growth without frequent irrigation, essential for sustainable farming practices in the Bhal region.
Figure 5. (a, b) Spatial variation maps of: (a) MWHC, and (b) soil texture.
The predominant soil texture is of clay loam type (Figure 5b), covering 91.1% of the total study area with gentle slopes (0–2.30%). This texture is characterized by high water holding capacity and low infiltration rates, which enhances in-situ moisture storage conditions, reducing the need for irrigation throughout the wheat crop cycle. Fine loamy soil is present in 8.9% of the area, which also provides suitable conditions for wheat cultivation. These soils are rich in potash but have marginal levels of phosphate, manganese, and zinc. Overall, the soil properties and texture are highly favorable for wheat production in the Bhal region.
3.2.3 SOC and EC maps
Soil Organic Carbon (SOC) is a crucial indicator of soil health, influencing crop yield by affecting biological, physical, and chemical properties. In the study area, SOC values range from 0.223 to 1.042% as shown in Figure 6a. The study area is classified into four suitability classes based on SOC: (i) unsuitable (SOC=0.223–0.478% in 13.5% of the area, near the seashore with saline intrusion), (ii) least suitable (SOC=0.478–0.562% in 22.9% of area), (iii) moderately suitable (SOC=0.562–0.646% in 34.5% of area), and (iv) highly suitable (SOC=0.646–1.042% in 29.1% of area). SOC plays a key role in maintaining soil fertility and supporting wheat growth, with higher SOC values improving soil structure and nutrient availability.
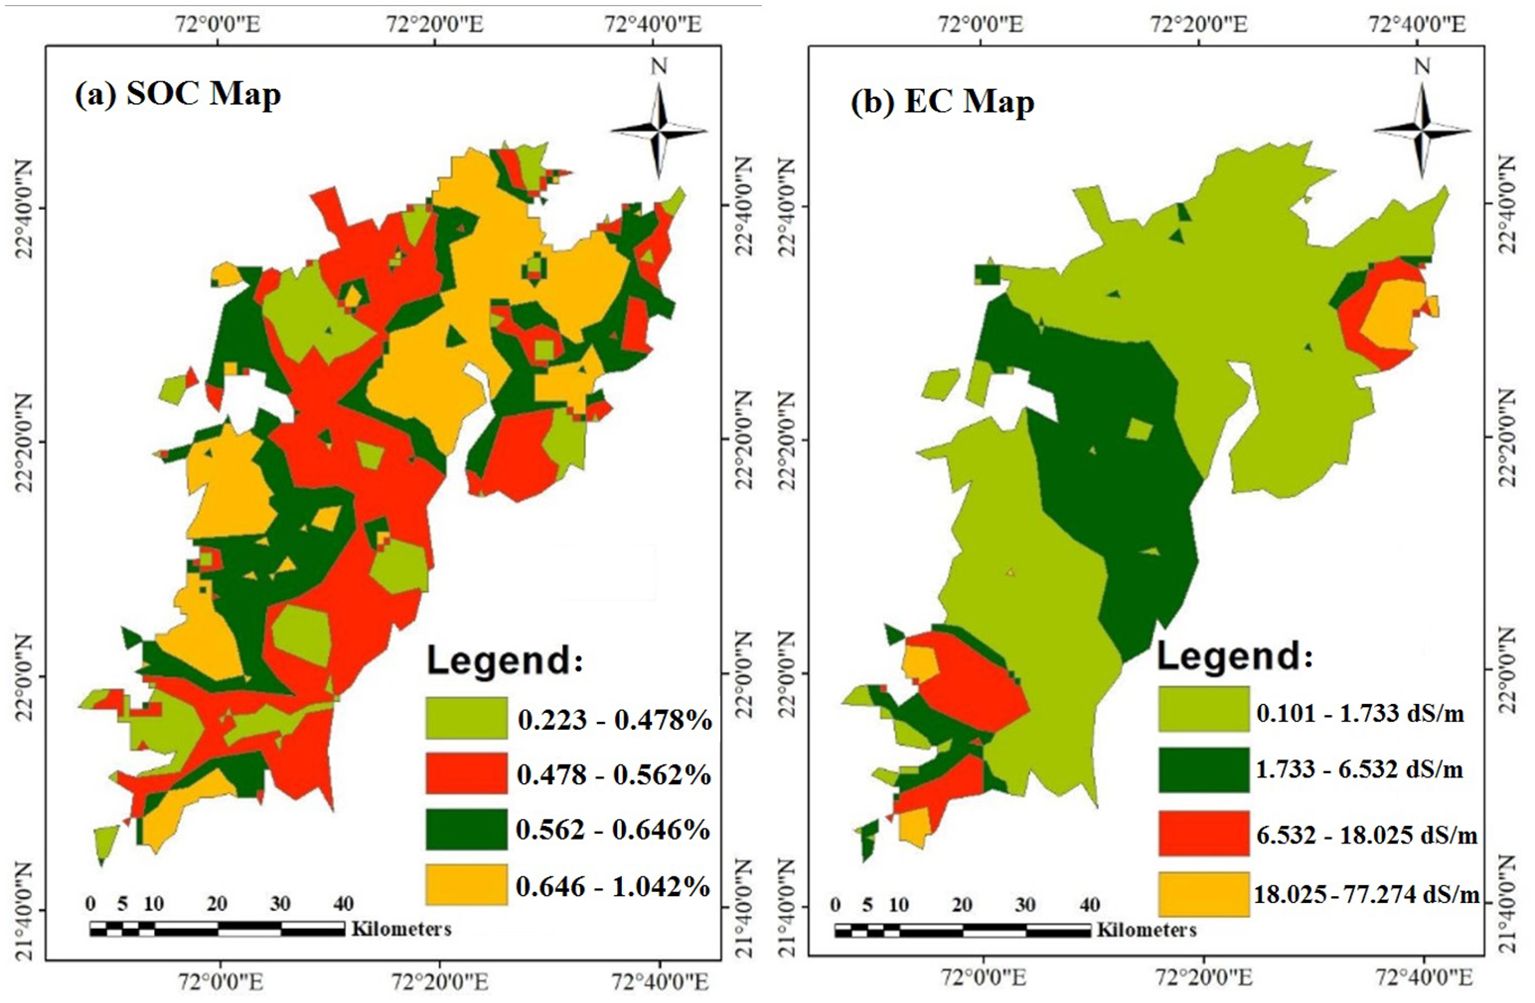
Figure 6. (a, b) Spatial variation maps of: (a) SOC, and (b) EC.
Soil Electrical Conductivity (EC) indicates soil salinity, a critical factor affecting crop yield. EC values in the region vary widely, from 0.101 to 77.274 dS/m, as shown in Figure 6b. Salinity (EC) in 62.9% of the area are within a tolerable range of 0.101–1.733 dS/m, making it suitable for wheat cultivation. However, 26.8% of the area is under moderate salinity (1.733–6.532 dS/m), whereas 3% of the area near the Gulf of Khambhat has severe salinity (>18.025 dS/m), making it unsuitable for wheat production. This study highlights the need for the cultivation of salt-tolerant crops in highly saline areas.
3.2.4 pH and Nitrogen distribution maps
Soil pH significantly influences nutrient availability and crop productivity. Wheat is known to grow optimally in soils with a pH range of 6.5 to 7.8, although it can tolerate slightly alkaline conditions up to 8.3, depending on soil type and nutrient management (Brady and Weil, 2008; FAO, 2000). The study area exhibits a pH range of 7.76–9.01, with over 55% of the region falling within the 7.99–8.26 range, which is marginally above the optimal level but still within tolerable limits for wheat cultivation (Figure 7a). Approximately 15% of the area lies in the very high pH range (8.26–9.01), which may limit nutrient availability, particularly Phosphorus, Zinc and Iron. On the other hand, 20% of the area lies in the slightly alkaline range of 7.76–7.99, closer to the crop’s preferred conditions. Overall, this pH distribution supports wheat growth, given the crop’s adaptability to neutral to slightly alkaline soils, although site-specific soil amendments may be necessary in high pH zones.
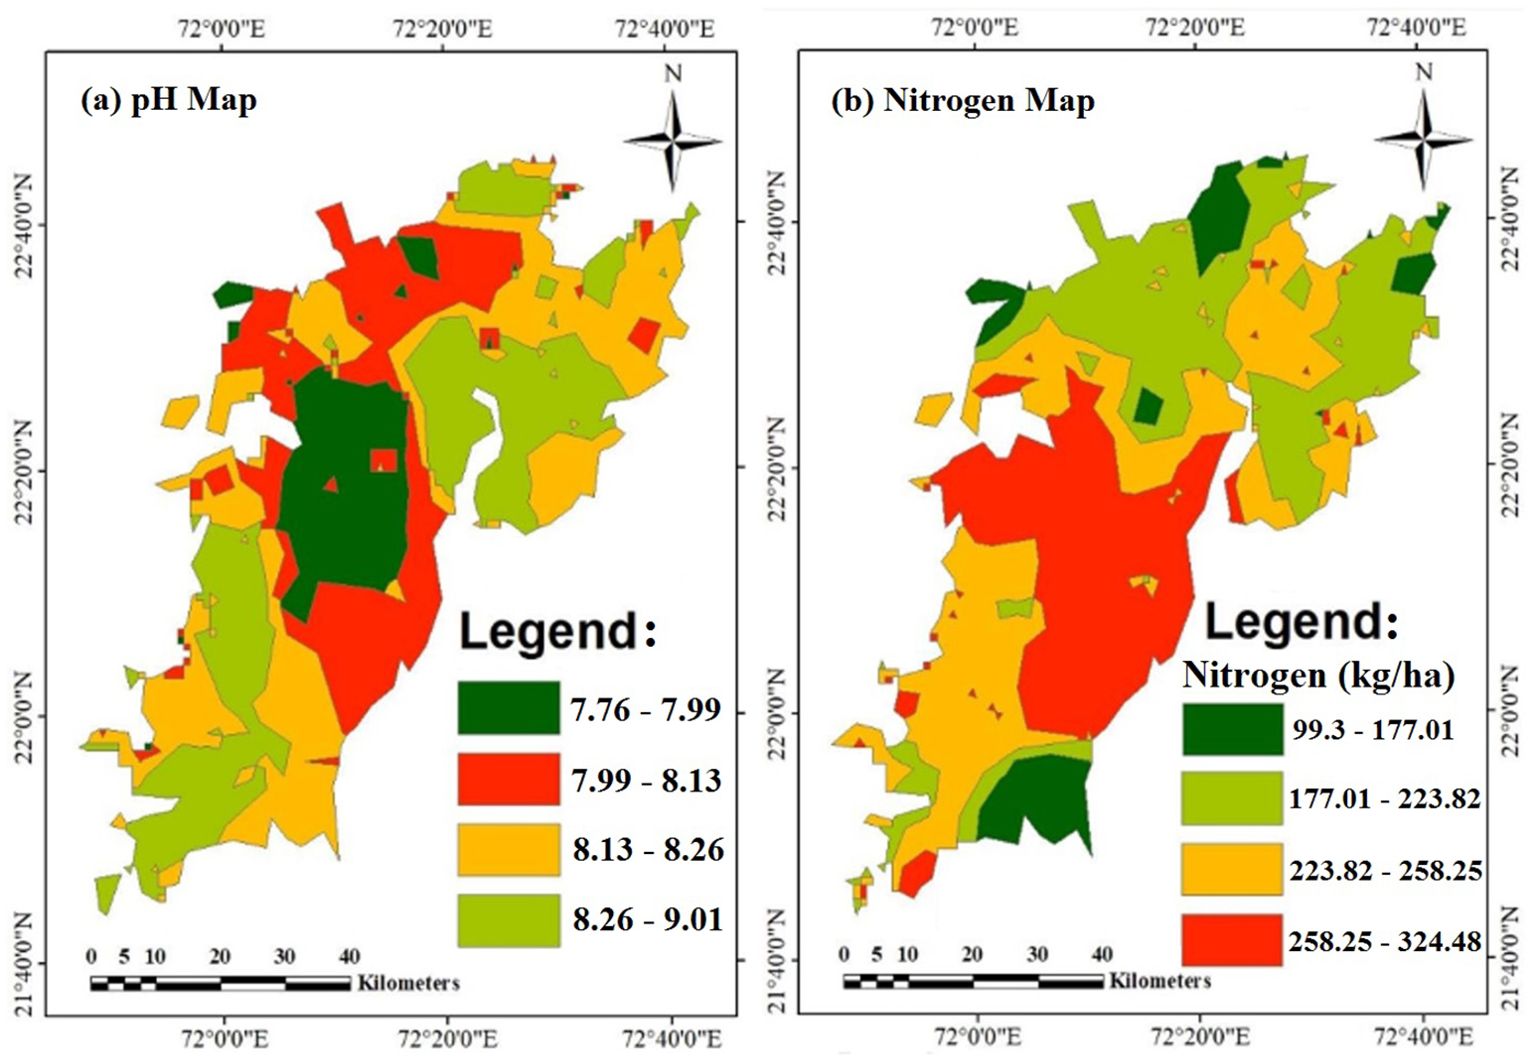
Figure 7. (a, b) Spatial variation maps of: (a) pH, and (b) Nitrogen (N).
Nitrogen (N), crucial for plant growth and productivity, is largely scarce in the region. Only 15% of the study area shows Nitrogen levels exceeding 258 kg/ha, suitable for wheat cultivation (Figure 7b). The remaining 85% of the area falls within a Nitrogen-deficient range (99–258 kg/ha), necessitating supplemental fertilization to enhance wheat yield. These findings emphasize the importance of soil management practices to optimize wheat cultivation in Nitrogen-deficient areas. The nitrogen thematic map represents the inherent nitrogen content in the soil (kg/ha), as derived from laboratory analysis of collected soil samples, and not the external application rate of nitrogen fertilizer. The values indicate the available nitrogen reserves in the soil profile before any fertilization. According to agronomic guidelines, wheat requires an optimal available soil nitrogen level of approximately 280–350 kg/ha to support healthy growth and achieve optimal yields (FAO, 2000; Majumdar et al., 2013). In this study, approximately 85% of the area exhibited nitrogen levels in the range of 99–258 kg/ha, which is considered deficient for wheat cultivation. This finding emphasizes the need for supplemental nitrogen fertilization to ensure crop productivity in these areas.
3.2.5 Phosphorous and potassium distribution maps
Phosphorus (P) plays a critical role in root development, crop maturity and seed production, making it the second-most essential nutrient after Nitrogen (N) for crop productivity. The study revealed that 31.7% of the region has Phosphorus levels below 26 kg/ha, which may require additional fertilization to meet wheat crop needs (Figure 8a). The remaining area contains sufficient Phosphorus for optimal crop yield. Lower Phosphorus levels are likely due to fixation by clay minerals, Iron (Fe) and Aluminum Oxides (Al2O3), aligning with findings by Prasunarani et al. (1992). Regions with black soils exhibit higher Phosphorus availability, attributed to their superior cation exchange capacity and Phosphorus fixation properties. Overall, Phosphorus sufficiency across the area ensures optimal wheat yield without significant nutrient deficiency-related issues.
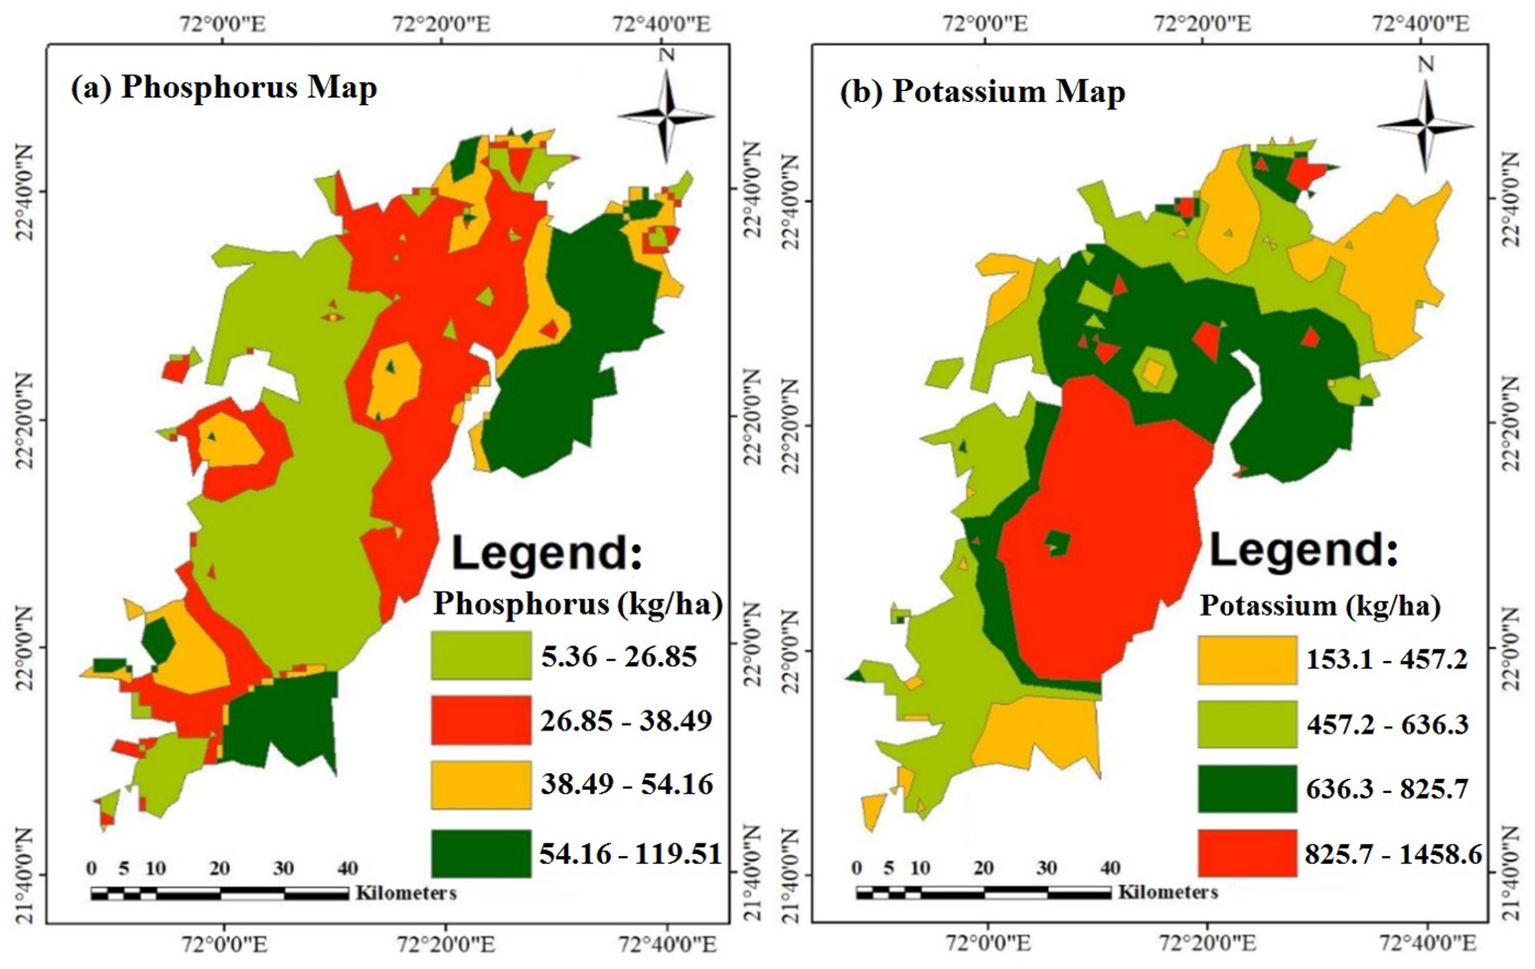
Figure 8. (a, b) Spatial variation maps of: (a) Phosphorus (P), and (b) Potassium (K).
Potassium (K), a macro-nutrient essential for crop physiological processes like protein synthesis, nutrient transport, photosynthesis and stomatal regulation, and also critical for wheat productivity. Potassium content in the study area ranges from 153 to 1458 kg/ha, significantly exceeding the recommended 50 kg/ha limit for Indian soils (Figure 8b). This abundance ensures that Potassium requirements for wheat production are well met. The region’s potassium sufficiency supports healthy plant growth, enhances nitrogen utilization, and provides resistance against diseases and pests. Together, the sufficient levels of Phosphorus and Potassium make the area highly suitable for wheat cultivation, promising optimum yields.
3.2.6 Boron and sulfur distribution maps
Boron (B) plays a crucial role in plant processes such as cell wall formation, sugar transport and pollination. Boron levels range from 0.053–0.613 ppm in 40% of the study area, 0.613–0.996 ppm in 29.6% of area, 0.996–1.780 ppm in 28% of area, and 1.780–6.720 ppm in 2.4% of area (Figure 9a). These higher Boron levels are adequate for wheat cultivation, as Boron supports structural integrity and reproductive functions essential for optimal yield.
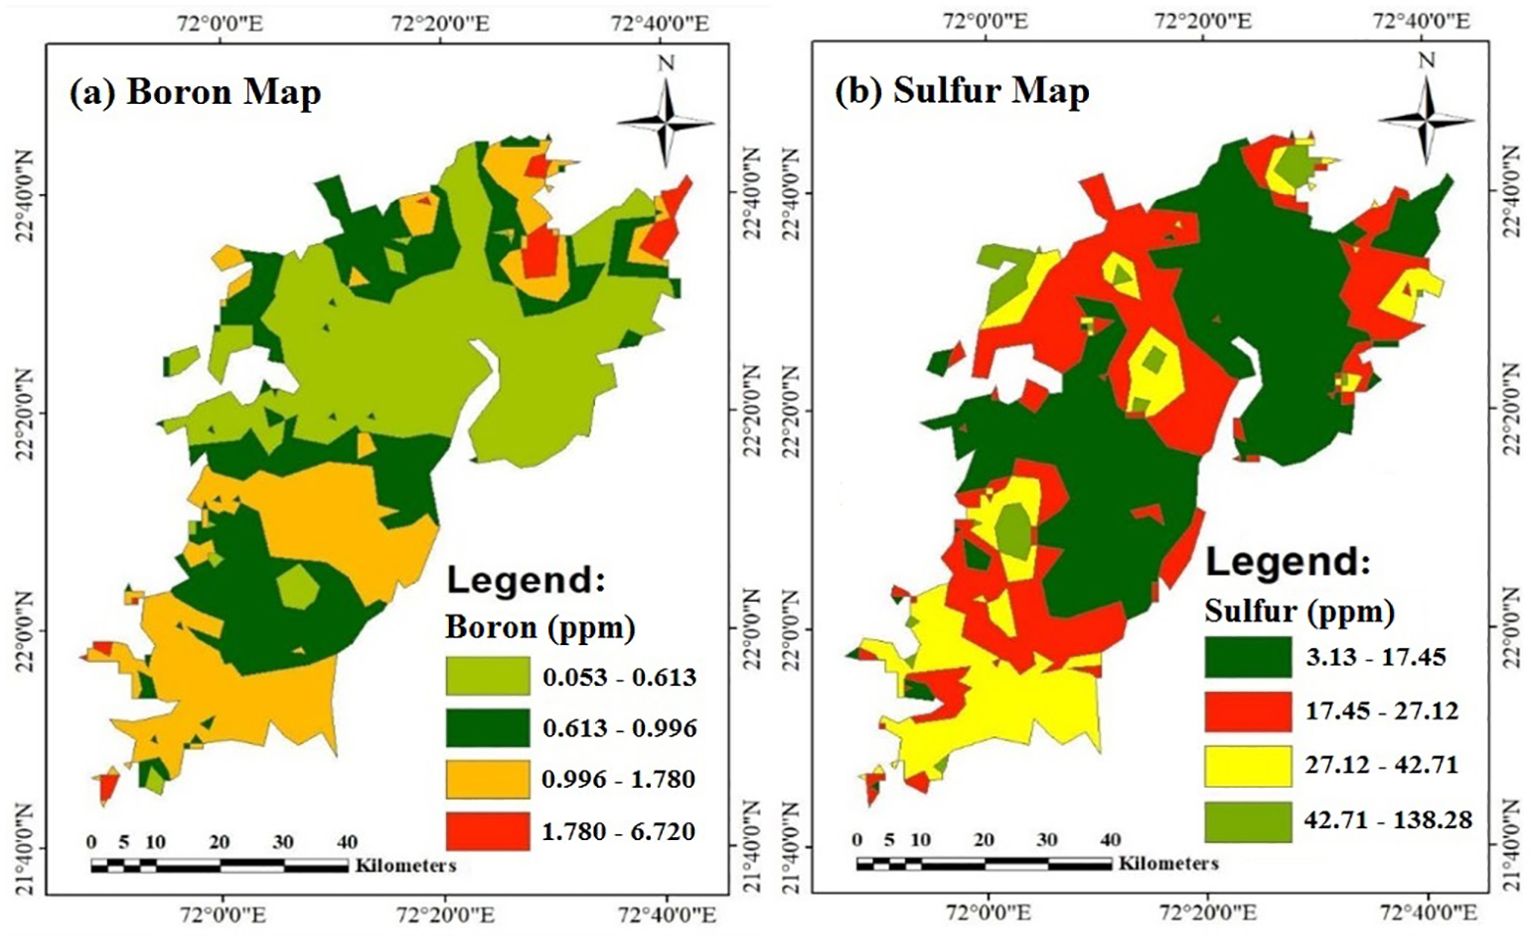
Figure 9. (a, b) Spatial variation maps of: (a) Boron (B), and (b) Sulfur (S).
Sulfur (S), another vital nutrient, contributes to Chlorophyll production, protein synthesis and overall plant metabolism. Global Sulfur deficiencies are attributed to reduced sulfur fertilizer usage and lower atmospheric deposition since the 1970s. Wheat, which has a relatively low Sulfur requirement of 10–20 kg/ha, benefits from the predominantly clayey soils in the study area, which mitigate the risk of Sulfur deficiency. Figure 9b shows that 46.4% of the area has Sulfur levels between 3.13–17.45 ppm, 31.2% of area has 17.45–27.12 ppm, 18.6% of area has 27.12–42.71 ppm, and 3.8% of area has >42.71 ppm. While Sulfur levels are largely sufficient in the region, targeted fertilization in areas with marginal deficiencies may further enhance wheat productivity. Additionally, Zinc Sulfate (ZnSO4) applications for rice not only address Zinc deficiencies but also help balance Sulfur levels, ensuring adequate micronutrient availability across the study area. Overall, the region is well-suited for wheat cultivation in terms of Boron and Sulfur availability, requiring only minimal interventions to optimize crop yield.
3.2.7 Manganese and iron distribution maps
Manganese (Mn) is an essential micronutrient vital for plant nutrition, serving as a key component of enzymes involved in photosynthesis and other physiological processes (Narender et al., 2018). Intensive rice-wheat cultivation, especially in non-traditional rice-growing areas, has contributed to Manganese deficiency due to higher leaching losses in submerged rice fields, which subsequently affects wheat crops. Manganese deficiency disrupts photosynthesis, hindering plant growth and productivity. Manganese distribution in Figure 10a shows that 25.6% of the total area contains Manganese in the range of 2.91–8.77 ppm, 43.3% of area contains 8.77–12.60 ppm, 19.2% of area contains 12.60–17.13 ppm, and 11.9% of area contains 17.13–40.80 ppm. These values indicate that while some areas have Manganese levels suitable for cultivating rice and wheat, a significant portion of the area requires fertilization to address deficiencies and improve crop yield.
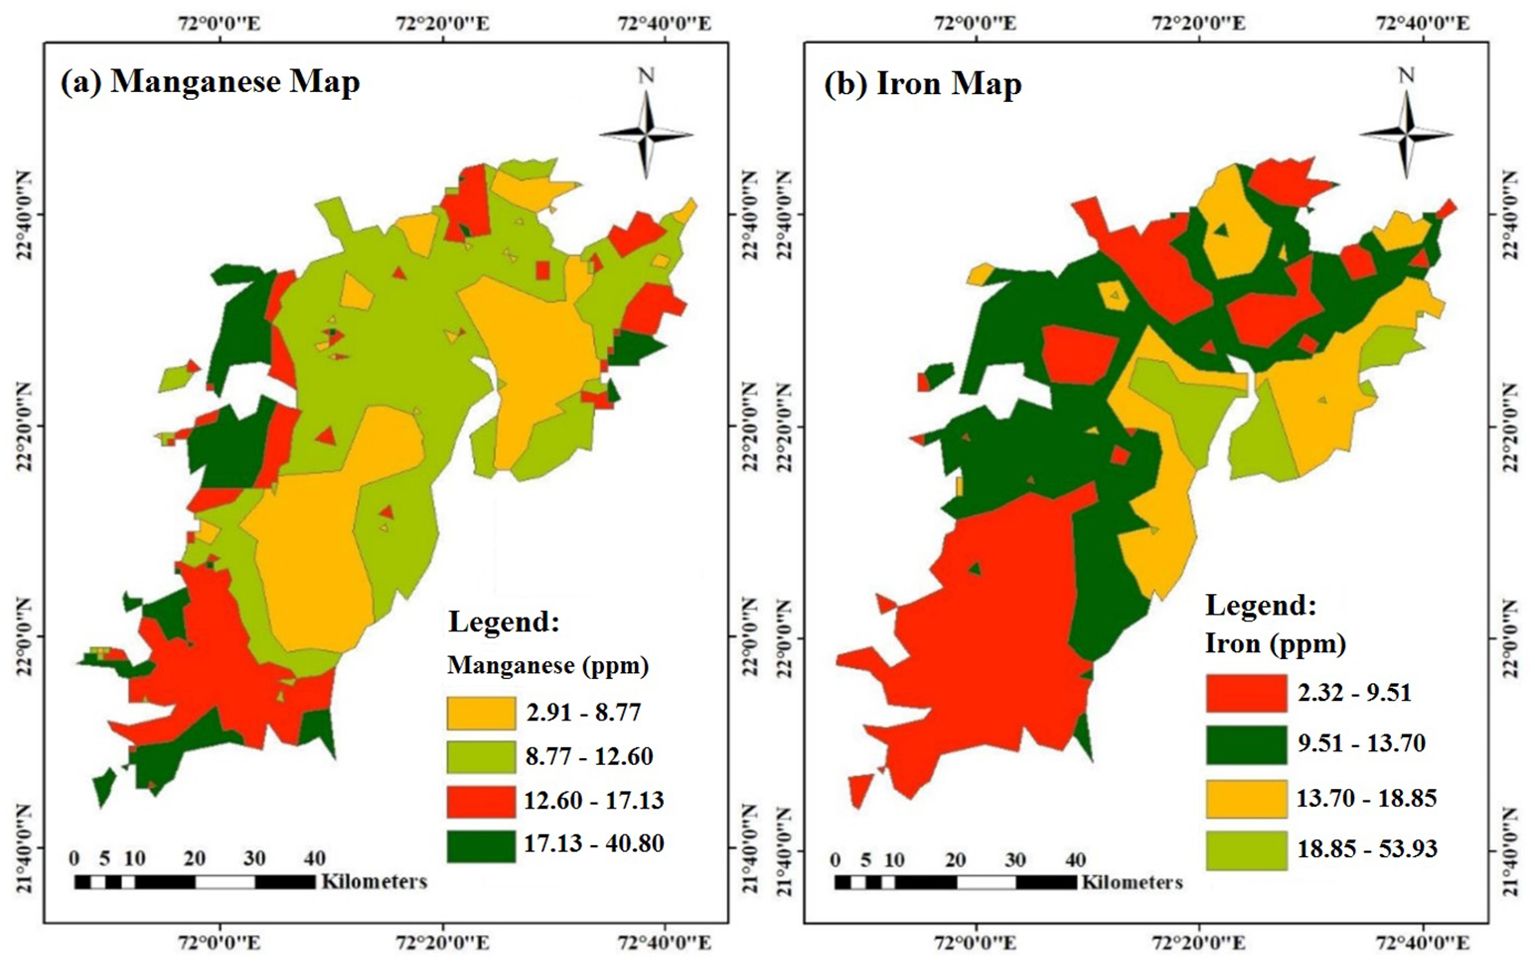
Figure 10. (a, b) Spatial variation maps of: (a) Manganese (Mn), and (b) Iron (Fe).
Iron (Fe), another critical nutrient, is the third most limiting factor for plant growth and metabolism due to the low solubility of Ferric Iron (Fe3+) in aerobic environments (Rout and Sahoo, 2015). Iron (Fe), crucial for chlorophyll synthesis and energy transfer, is considered sufficient for wheat at levels above 4.5 ppm in DTPA-extractable form (Yadav et al., 2011; Singh, 2008). Despite being the fourth most abundant element in the lithosphere, Iron’s bioavailability is often limited in neutral pH and aerobic soils, as it is predominantly present in insoluble forms. Iron deficiency manifests as interveinal chlorosis of young leaves and stunted root growth, significantly affecting plant growth, product quality and yield. The study area’s soil analysis in Figure 10b shows that only 6.7% of the total area has Iron levels ranging from 18.85–53.93 ppm, suitable for rice and wheat cultivation. The remaining areas are Iron-deficient, with 37.5% of the total area has Iron levels between 2.32–9.51 ppm, 37.1% of area has 9.51–13.70 ppm, and 18.7% of area has 13.70–18.85 ppm. This deficiency necessitates fertilization, preferably with organic manure, to enhance soil Iron content and prevent diseases caused by Iron deficiency. Targeted nutrient management practices are recommended to address both Mn and Fe deficiencies, which currently limit wheat yield potential in the region.
3.2.8 Zinc and copper distribution maps
Zinc (Zn), an essential micro-nutrient for plant growth, plays a critical role in various physiological and biochemical processes such as cell wall development, respiration, photosynthesis, enzyme activity and protein synthesis. In the study area, Zinc deficiency is a significant concern for crop productivity, particularly for wheat. Wheat typically requires a DTPA-extractable Zinc level of at least 0.6–1.0 ppm for optimal growth (Singh, 2008; Takkar et al., 1997).The spatial distribution of Zinc in Figure 11a shows that 36.9% of the total area has Zinc levels ranging from 0.191–0.711 ppm, 39.5% of area has 0.716–1.218 ppm, 18.4% of area has 1.218–1.841 ppm, and only 5.2% of the area has 1.841–6.796 ppm. With over 90% of the area is classified as Zinc deficient, external fertilization is essential for achieving better crop yields. This highlights the critical role of Zinc in ensuring optimal production for wheat in the region.
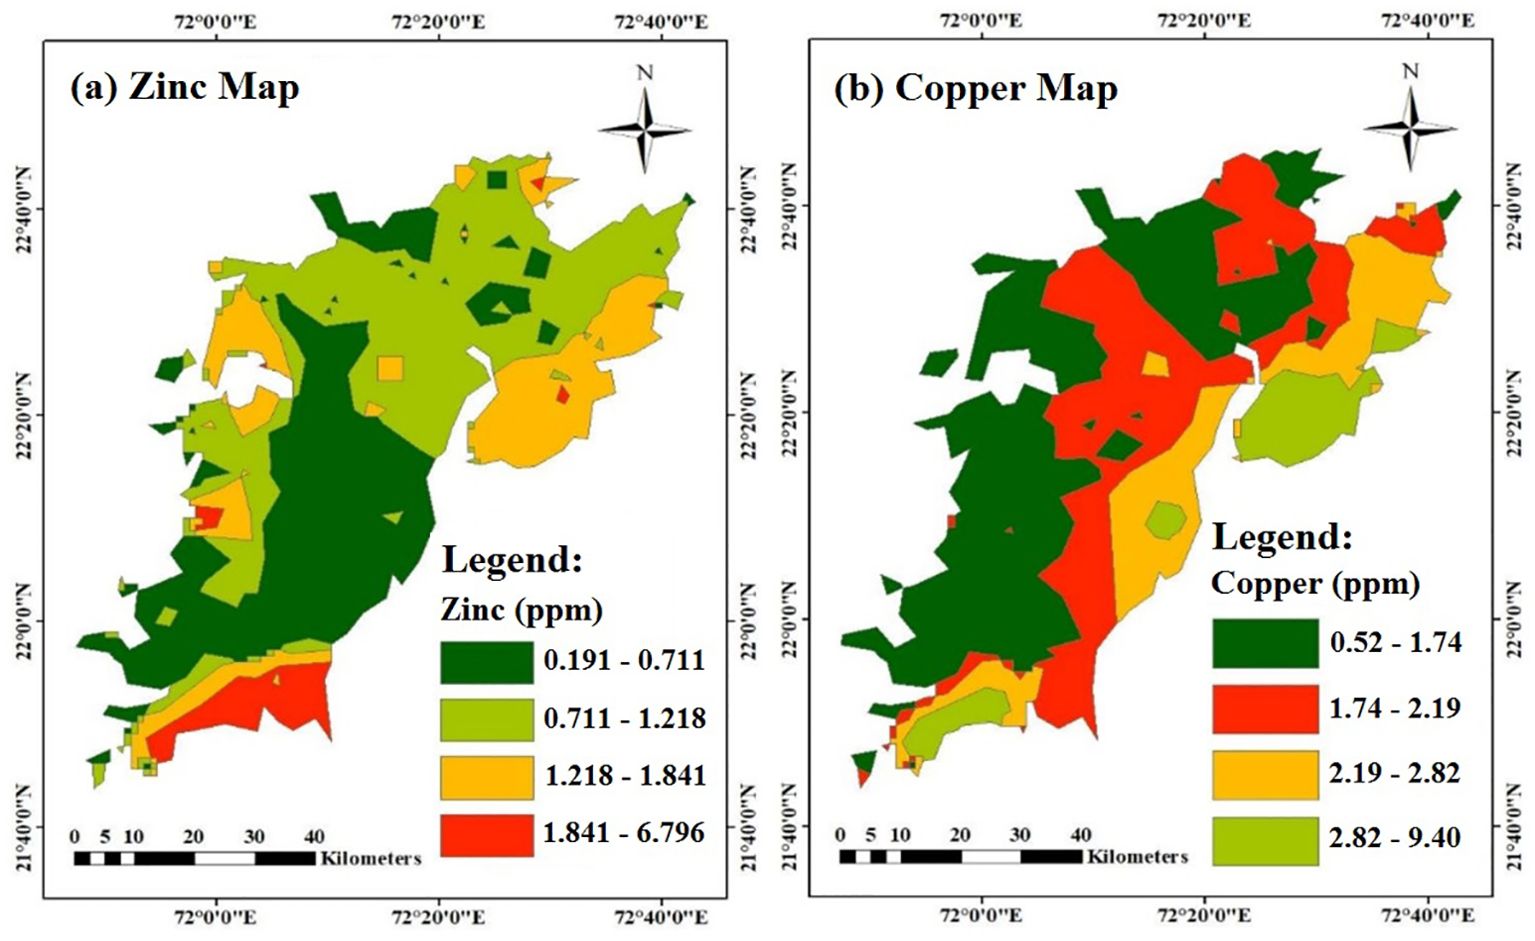
Figure 11. (a, b) Spatial variation maps of: (a) Zinc (Zn), and (b) Copper (Cu).
Copper (Cu), though required in smaller quantities than Zinc, it is equally indispensable for plant growth, particularly in processes like Chlorophyll formation and photosynthesis, which are fundamental for energy absorption and plant viability. The critical soil Copper level for wheat is approximately 0.2–0.5 ppm, indicating that all recorded values in the region are above the sufficiency threshold (Takkar et al., 1997). The Copper distribution in the study area in Figure 11b reveals that 43.3% of the total area contains Copper levels ranging from 0.52–1.74 ppm, 31.2% of area contains 1.74–2.19 ppm, 16.7% of area contains 2.19–2.82 ppm, and the remaining 8.8% of area contains 2.82–9.40 ppm. Unlike Zinc, Copper levels in the region are generally sufficient to meet the requirements for wheat cultivation, ensuring that this micro-nutrient does not pose a constraint to crop productivity. Addressing Zinc deficiency while leveraging the adequate Copper levels will significantly contribute to enhancing cereal crop yields and ensuring sustainable agricultural practices in the study area.
3.3 Results of land suitability mapping
The overall land suitability for wheat cultivation is influenced by the combined effects of several critical parameters, including LULC, soil texture, soil depth, slope, MWHC, EC, pH, SOC, and availability of macro- and micro-nutrients. Each parameter was analyzed against the optimal conditions for wheat growth, and their individual thematic maps were processed in GIS environment to create an integrated wheat suitability map. The analysis was performed in ArcGIS v10.4, ensuring a robust methodological approach and accurate spatial representation of land suitability for wheat cultivation (Figure 12). The normalized weights of 17 land suitability parameters (themes) and their feature scores are shown in Table 2. The highest normalized weights were calculated for soil texture (0.291) followed by land use/land cover (0.145), whereas the lowest weight was obtained for the micro-nutrient Zinc (0.017).
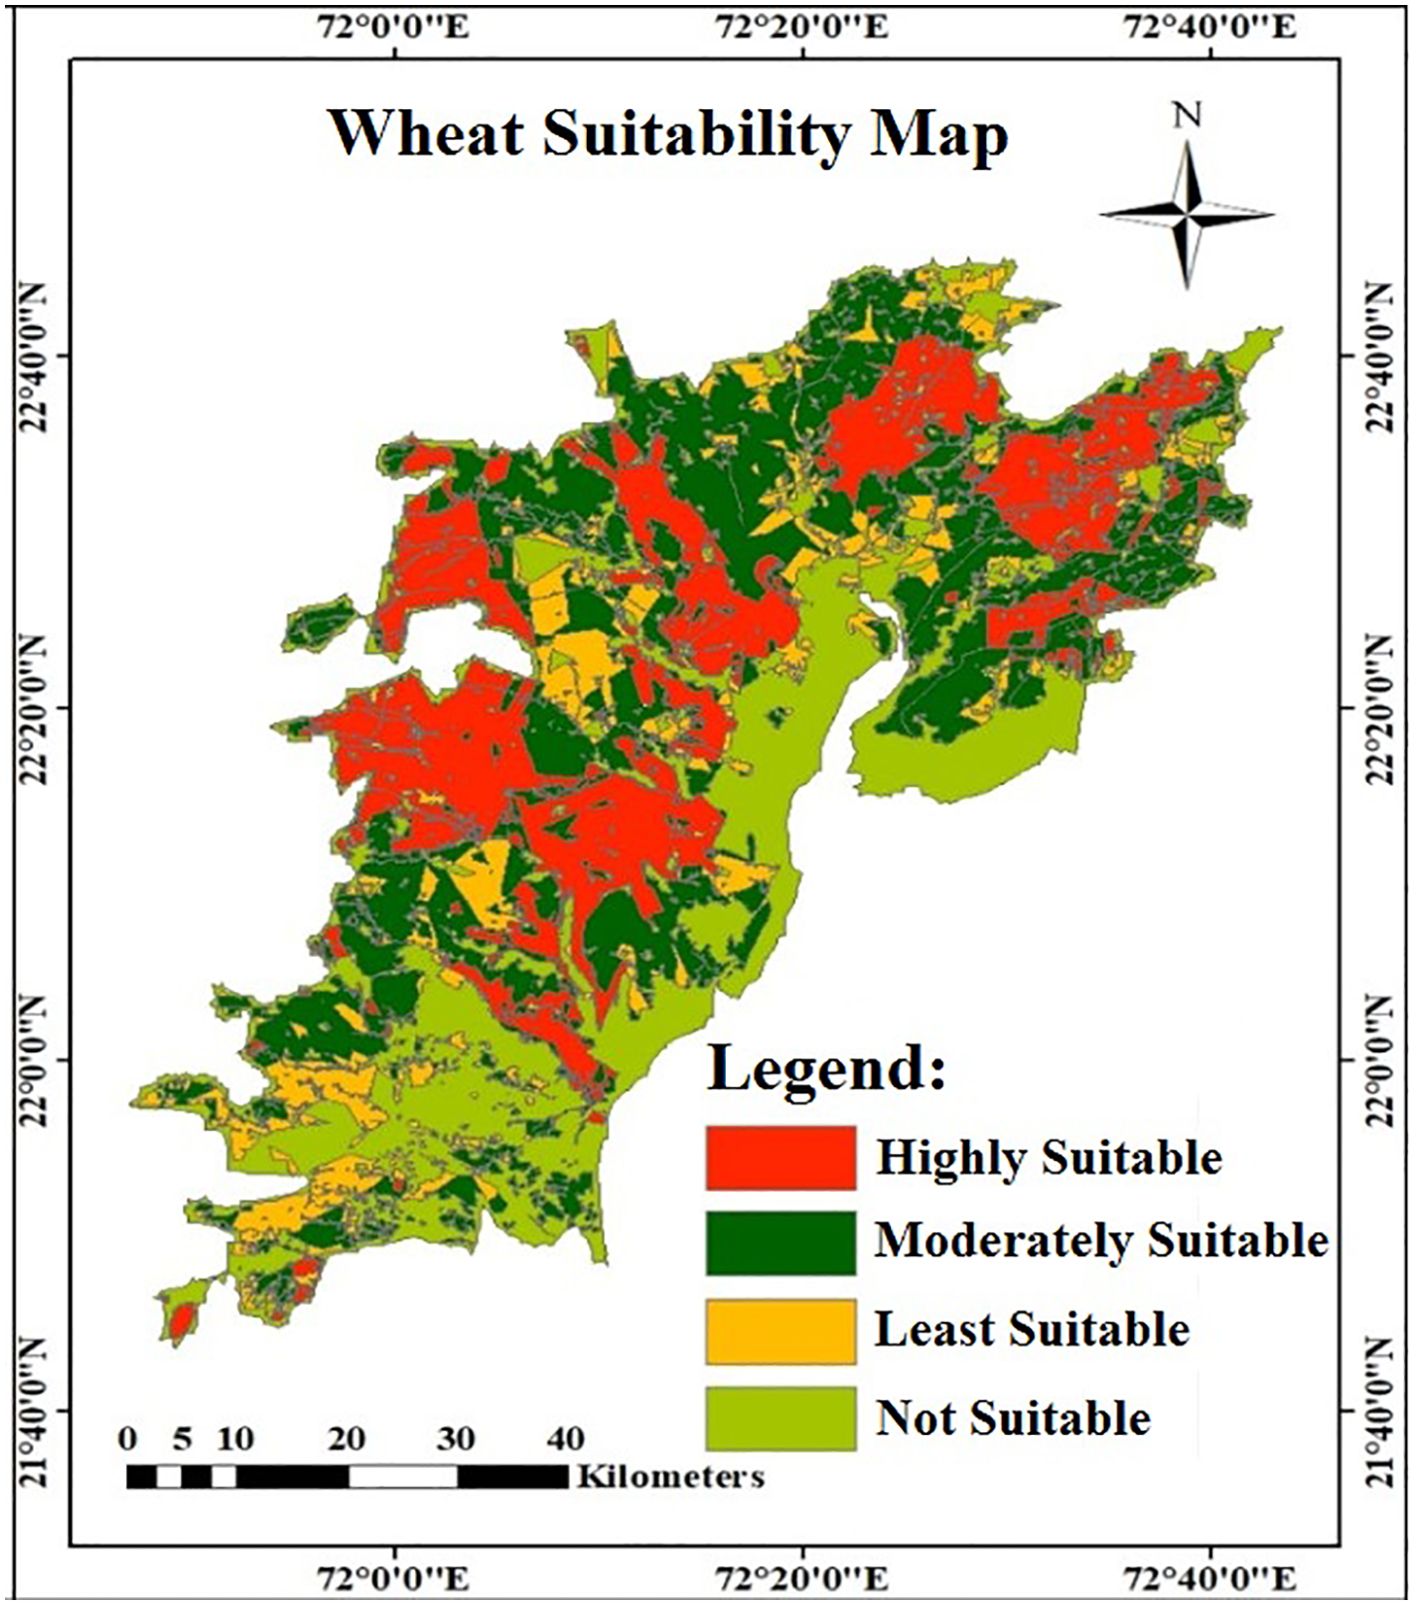
Figure 12. GIS-based land suitability map for wheat cultivation, prepared using the AHP method.
The results of GIS-based land suitability analysis using AHP method reveal the following land suitability classifications for wheat in the Bhal region: (i) 24.80% (1121.1 km2) of the total area was classified as ‘highly suitable’, (ii) 31.37% (1418.2 km2) of area as ‘moderately suitable’, (iii) 12.40% (560.6 km2) of area as ‘least suitable’, and (iv) 31.43% (1420.9 km2) of area as ‘not suitable’ (Figure 12). Thus, over 43% of the total area falls into ‘least’ to ‘not suitable’ categories for wheat cultivation, primarily due to limitations in soil texture, nutrient imbalances, salinity, and topography. Results further indicate that Ahmedabad, Kheda and Surendranagar districts are ‘highly’ to ‘moderately’ suitable for wheat cultivation, except the coastal tracts along the Gulf of Khambhat where wheat cultivation is not unsuitable. On the other hand, Anand district is ‘moderately’ suitable for wheat cultivation except the coastal areas near Khambhat. In contrast, the Bhavnagar district is ‘least’ suitable to ‘unsuitable’ for wheat cultivation. These findings underscore the critical need for targeted soil and land management strategies to enhance wheat productivity and justify the study’s relevance in optimizing land use for food security. These findings are consistent with earlier studies employing similar GIS-based multi-criteria approaches for land suitability evaluation across varied agro-climatic zones (Pilevar et al., 2020; Kılıc et al., 2022; Wang et al., 2023; Ayoade, 2017; Ramamurthy et al., 2020; Gelalacha et al., 2024), reinforcing the methodological robustness and transferability of AHP-integrated GIS models in identifying suitable areas for crop production.
The land use/land cover (LULC) pattern of the Bhal area in November 2018 reveals that the majority of the region is dominated by agricultural land, covering approximately 71.42% of the total area. This is followed by 20.48% of area classified as wastelands, 4.07% of area as waterbodies, 2.14% of area as built-up land, and only 1.89% of area as forest land (Figure 3b; Table 3). The observed increase in agricultural area, particularly for wheat, may be driven by socio-economic factors such as rising food demand due to population growth, government schemes promoting cultivation, and the encroachment of marginal lands into arable land. A more comprehensive study that includes other crops could offer insights into broader land-use optimization and crop diversification strategies. This breakdown underscores the agricultural prominence of the region, providing a solid foundation for evaluating its suitability for wheat cultivation. Using the LULC map as a baseline, this study strategically integrates multiple thematic layers to assess land suitability for wheat cultivation, leveraging the Geographic Information System (GIS) to achieve spatial precision and data-driven insights. Table 2 presents the thematic parameters used in the AHP model along with their assigned ranks, normalized weights, classification features, and feature scores. The classification thresholds were developed based on agro-ecological guidelines, expert input, and suitability criteria from past studies relevant to wheat cultivation in semi-arid regions. Including the area distribution under each class allows a clearer understanding of parameter influence at the landscape scale and improves the transparency of the land suitability evaluation.
3.4 Benefits to the farmers and economy
The findings of this study provide spatially explicit information that can help farmers in the Bhal region of Gujarat make more informed land management decisions for wheat cultivation. By using the land suitability map, farmers can identify areas with higher potential productivity, allowing for better targeting of inputs such as fertilizers and irrigation, thereby reducing production costs and improving resource efficiency. For instance, in areas affected by seasonal waterlogging, the study highlights how stored in-situ moisture can be leveraged during the Rabi season, reducing dependence on external irrigation and limiting the risk of salinity from seawater intrusion both of which contribute to cost savings and crop sustainability. Although this study does not include a full economic analysis, it lays the groundwork for future cost-benefit evaluations in line with FAO (1976), and contributes to region-specific strategies for enhancing land use efficiency and agricultural sustainability.
3.5 Challenges and practical implications
In addition to nutrient and topographic constraints, waterlogging is a notable concern in the Bhal region, which is exacerbated by the absence of a proper drainage system, particularly in low-lying and poorly drained agricultural lands. Waterlogging negatively impacts soil aeration and root growth, reducing the land’s agricultural potential. However, this condition also provides a strategic advantage for wheat cultivation. During the post-monsoon season, residual soil moisture retained from waterlogged conditions reduces the need for external irrigation. This not only lowers irrigation costs for farmers but also helps prevent salinity buildup caused by seawater intrusion—a common issue when groundwater is extracted near coastal zones. As a result, managing and utilizing in-situ moisture effectively offers both agronomic and economic benefits for sustainable wheat production in the region.
4 Conclusion
This study presents a comprehensive land suitability assessment for wheat (Triticum aestivum L.) cultivation in the Bhal region of Gujarat, western India, utilizing the GIS-based Analytic Hierarchy Process (AHP) method. By incorporating multiple land characteristics, such as land use/land cover (LULC), soil properties, topography, and macro- and micro-nutrient availability, the study provides a nuanced understanding of the region’s agricultural potential. This is the first such study conducted in this region and contributes significantly to the existing body of knowledge in Western India.
The findings reveal that while 68.57% (3099.9 km²) of the region is ‘suitable’ for wheat cultivation, a considerable portion—31.43% (1420.9 km²)—remains ‘unsuitable’, highlighting the challenges faced by local farmers. Results further indicate towards ‘highly’ to ‘moderately’ suitable lands in Ahmedabad, Kheda and Surendranagar districts, while Anand district is categorized as ‘moderately’ suitable and Bhavnagar district is classified as ‘least’ suitable for wheat cultivation. Results also indicate deficiencies in critical nutrients like nitrogen (N), manganese (Mn), iron (Fe), and zinc (Zn), which necessitate external fertilization to improve crop yields. These outcomes suggest that targeted interventions are required to address nutrient imbalances and optimize wheat production in the region. These outcomes are expected to empower farmers, optimize land use, and enhance the region’s agricultural output, contributing to food security and economic progress.
The study highlights the importance of considering not only the chemical and physical soil attributes but also topographic features such as slope and moisture retention capacity (MWHC) for assessing land suitability. The integration of LULC data, as well as the recognition of waterlogging as a potential environmental constraint, reflects the broader biophysical context within which wheat cultivation occurs. Waterlogging, while traditionally seen as a limitation, can offer benefits to farmers in the Bhal region by retaining moisture in the soil, which helps reduce the need for irrigation. This is particularly important in mitigating salinity issues caused by seawater intrusion from nearby coastal areas, further contributing to reduced irrigation costs and enhanced productivity.
The present study provides a robust biophysical assessment of land suitability in the Bhal region of Gujarat, and establishes a solid foundation for understanding land potential. However, land suitability is inherently multidimensional and requires the integration of socio-economic conditions, climatic variability, and management practices for a more holistic evaluation. Although these factors were beyond the current scope, they are essential for future research aligned with the FAO’s land evaluation framework. This work highlights the need for integrating dynamic environmental, climatic, and socio-economic datasets in land suitability analyses and calls for region-specific approaches to optimize land use, reduce farming costs, and enhance food security in semi-arid region.
By offering both a diagnostic and planning tool, this model has the potential to empower farmers, government agencies, and NGOs to implement targeted soil health improvement programs that are more cost-effective and sustainable than generalized fertilization or land conversion strategies. This research makes a valuable contribution to the field of agro-environmental planning and sets the stage for more integrated and adaptive strategies in land suitability assessments. Building on this foundation, future research could focus on integrating dynamic environmental and climatic variables, such as real-time rainfall variability and temperature trends, to improve the accuracy of suitability predictions. The incorporation of advanced hydrological and drainage models can also enhance the understanding of waterlogging issues. Furthermore, applying remote sensing technologies and machine learning algorithms may offer a more robust, data-driven decision-support system. Expanding this methodology to other crops and agro-climatic regions would strengthen its relevance and contribute meaningfully to global efforts in promoting agricultural sustainability and food security.
5 Limitations and scope for future research
This study focuses exclusively on wheat cultivation, which limits its applicability for other crops. Expanding the model to include multiple cropping systems would support broader land-use optimization and crop diversification strategies. The current model does not incorporate real-time climatic variables or socio-economic factors, both of which are crucial for adaptive and sustainable agricultural planning. Additionally, the weight distribution in the AHP method, while literature- and expert-based, may introduce bias due to the dominance of soil-related parameters. Future work should consider integrating dynamic climate data, stakeholder input, and hybrid MCDA approaches (e.g., AHP-TOPSIS) to enhance methodological robustness and decision-making accuracy.
Data availability statement
The original contributions presented in the study are included in the article/Supplementary Material. Further inquiries can be directed to the corresponding authors.
Author contributions
RK: Data curation, Formal Analysis, Investigation, Methodology, Writing – original draft. SG: Conceptualization, Supervision, Writing – review & editing. GP: Project administration, Resources, Supervision, Writing – review & editing. LS: Writing – review & editing. AM: Writing – review & editing. AS: Writing – review & editing.
Funding
The author(s) declare that no financial support was received for the research and/or publication of this article.
Acknowledgments
The first and second authors are highly grateful to the Ministry of Education (MOE), New Delhi, Government of India, for providing student fellowships to pursue M.Tech. and Ph.D. studies, respectively. The authors are also thankful to the National Bureau of Soil Survey & Land Use Planning (NBSS&LUP), Nagpur for providing soil data, as well as to the Bhaskaracharya Institute for Space Applications and Geoinformatics (BISAG), Gandhinagar for providing remote sensing data. The authors provide sincere thanks to the agronomists, soil researchers and experts for their valuable suggestions and opinion.
Conflict of interest
The authors declare that the research was conducted in the absence of any commercial or financial relationships that could be construed as a potential conflict of interest.
Generative AI statement
The author(s) declare that no Generative AI was used in the creation of this manuscript.
Publisher’s note
All claims expressed in this article are solely those of the authors and do not necessarily represent those of their affiliated organizations, or those of the publisher, the editors and the reviewers. Any product that may be evaluated in this article, or claim that may be made by its manufacturer, is not guaranteed or endorsed by the publisher.
Supplementary material
The Supplementary Material for this article can be found online at: https://www.frontiersin.org/articles/10.3389/fagro.2025.1551494/full#supplementary-material
References
Agricultural Census (2018). Annual Report 2018–19 (New Delhi: Ministry of Agriculture & Farmers Welfare, Government of India), 220 p.
Akıncı H., Özalp A.Y., and Turgut B. (2013). Agricultural land use suitability analysis using GIS and AHP technique. Comput. Electron. Agric. 97, 71–82. doi: 10.1016/j.compag.2013.07.006
Awoonor J. K., Dogbey B. F., and Quansah G. W. (2023). Soil suitability assessment for sustainable intensification of maize production in the humid savannah of Ghana. Front. Sustain. Food Syst. 7. doi: 10.3389/fsufs.2023.1094290
Ayoade M. A. (2017). Suitability assessment and mapping of oyo state, Nigeria, for rice cultivation using GIS. Theor. Appl. Climatology 129, 1341–1354. doi: 10.1007/s00704-016-1852-4
Azadi A., Jalali S. A. S., and Navidi M. N. (2023). Assessment of land suitability for sugarcane cultivation using TOPSIS and parametric methods in southwestern Iran. Eurasian Soil Sci. 56, 818–829. doi: 10.1134/s1064229322602268
Bandyopadhyay S., Jaiswal R. K., Hegde V. S., and Jayaraman V. (2009). Assessment of land suitability potentials for agriculture using a remote sensing and GIS based approach. Int. J. Remote Sens. 30, 879–895. doi: 10.1080/01431160802395235
Baroudy A. A.El, Ali A. M., Mohamed E. S., Moghanm F. S., Shokr M. S., Savin I., et al. (2020). Modeling land suitability for rice crop using remote sensing and soil quality indicators: the case study of the Nile delta. Sustainability 12, 9653. doi: 10.3390/su12229653
Bazkiaee P. A., Kamkar B., Amiri E., Kazemi H., Rezaei M., and Araji H. A. (2024). Multi-criteria GIS-based land suitability analysis for rice cultivation: A case study in Guilan province, Iran. Environ. Monit. Assess. 196, 680. doi: 10.1007/s10661-024-12811-y
Brady N. C. and Weil R. R. (2008). The nature and properties of soils Vol. 13 (Upper Saddle River, NJ: Prentice Hall), 662–710.
Cengiz T. and Akbulak C. (2009). Application of analytical hierarchy process and geographic information systems in land-use suitability evaluation: A case study of dümrek village (Çanakkale, Turkey). Int. J. Sustain. Dev. World Ecol. 16, 286–294. doi: 10.1080/13504500903106634
Chen S., Ye H., Nie C., Wang H., and Wang J. (2023). Research on the assessment method of sugarcane cultivation suitability in Guangxi province, China, based on multi-source data. Agriculture 13, 988. doi: 10.3390/agriculture13050988
Dubey S. K., Yadav R. K., Chaturvedi R. K., Yadav R. K., and Minhas. P. S. (2003). “Strategies for dry land salinity management in Bhal area of Gujarat State: A case study,” in Proceedings in the 2nd International Conference on Water Quality Management, New Delhi, India, 13–15 February 2003.
Dutta A., Banerjee M., and Ray R. (2024). Land capability assessment of Sali watershed for agricultural suitability using a multi-criteria-based decision-making approach. Environ. Monit. Assess. 196, 237. doi: 10.1007/s10661-024-12393-9
Economic Survey (2023). Economic Survey 2022-23 (New Delhi: Ministry of Finance, Department of Economic Affairs, Economic Division, Government of India), 372 p.
Elaalem M. (2012). Land suitability evaluation for sorghum based on boolean and fuzzy-multi-criteria decision analysis methods. Int. J. Environ. Sci. Dev. 3, 357–361. doi: 10.7763/ijesd.2012.v3.247
FAO (1976). A framework for land evaluation, Soil Bulletin 32 (Rome, Italy: Food and Agriculture Organization of the United Nations).
FAO (2000). Irrigated Wheat: Managing Your Crop (Rome, Italy: Food and Agriculture Organization of the United Nations). Available online at: https://www.fao.org/4/x8234e/x8234e00.htm.
FAO (2015). State of Food Insecurity in the World 2015 (Rome, Italy: Food and Agriculture Organization of the United Nations), 8 p.
FAO (2017). The Future of Food and Agriculture–Trends and Challenges (Rome, Italy: Food and Agriculture Organization of the United Nations), 47 p.
Gelalacha A. T., Haile M. M., and Tolera A. M. (2024). Land suitability and crop water requirements for irrigated sugar cane in the kuraz irrigation scheme, lower omo basin, Ethiopia. Irrigation Drainage 73, 1080–1101. doi: 10.1002/ird.2920
Ghosh S., Jha M. K., Pandey V. M., and Rahman A. (2024). “Comparative evaluation of index-based techniques for seawater intrusion vulnerability analysis,” in Proceedings of the 3rd International Conference on Advancements in Engineering Education, Sydney, Australia, 20–23 November 2024. 74–84.
Girvan M. S., Bullimore J., Pretty J. N., Osborn A.M., and Ball A. S. (2003). Soil type is the primary determinant of the composition of the total and active bacterial communities in arable soils. Appl. Environ. Microbiol. 69, 1800–1809. doi: 10.1128/aem.69.3.1800-1809.2003
Gurung S. (2019). “Land capability classification for agriculture: GIS and remote sensing approach—A survey,” in Advances in Communication, Cloud, and Big Data: Proceedings of 2nd National Conference on CCB 2016, Singapore. (Singapore: Springer), 29–39. doi: 10.1007/978-981-10-8911-4_4
ICAR (2010). Degraded and Wastelands of India: Status and Spatial Distribution (New Delhi: Indian Council of Agricultural Research), 158 p.
Islam Md M., Ahamed T., and Noguchi R. (2018). Land suitability and insurance premiums: A GIS-based multicriteria analysis approach for sustainable rice production. Sustainability 10, 1759. doi: 10.3390/su10061759
Jenifer M. A. and Jha M. K. (2017). Comparison of analytic hierarchy process, catastrophe and entropy techniques for evaluating groundwater prospect of hard-rock aquifer systems. J. Hydrology 548, 605–624. doi: 10.1016/j.jhydrol.2017.03.023
Joshi J. R., Soni N. P., Mayani K. R., and Gohil H. S. (2021). A critical analysis of water logging problem in “Bhal” region of Gujarat, India. Int. J. Creative Res. Thoughts 9, e191–e196. Available online at: https://ijcrt.org/papers/IJCRT2105457.pdf.
Kılıc O. M., Ersayın K., Gunal H., Khalofah A., and Alsubeie M. S. (2022). Combination of fuzzy-AHP and GIS techniques in land suitability assessment for wheat (Triticum aestivum) cultivation. Saudi J. Biol. Sci. 29, 2634–2644. doi: 10.1016/j.sjbs.2021.12.050
Król-Badziak A., Kozyra J., and Rozakis S. (2024). Assessment of suitability area for maize production in Poland related to the climate change and water stress. Sustainability 16, 852. doi: 10.3390/su16020852
Kumar A., Singh D., and Mahapatra S. K. (2020). Current and potential soil suitability of pearl millet, wheat and mustard for sustainable production in aravalli foothills of mewat region of haryana, India. Int. J. Curr. Microbiol. Appl. Sci. 9, 3566–3583. doi: 10.20546/ijcmas.2020.905.424
Kuria D., Ngari D., and Waithaka E. (2011). Using Geographic Information Systems (GIS) to Determine Land Suitability for Rice crop growing in the Tana delta. J. Geogr. Regional Plann. 4, 525–532. Available online at: https://academicjournals.org/journal/JGRP/article-full-text-pdf/A44B1D240876.
Majumdar K., Jat M. L., Pampolino M., Satyanarayana T., Dutta S., and Kumar A. (2013). Nutrient management in wheat: current scenario, improved strategies and future research needs in India. J. Cereal Res. 4, 1–10. Available online at: http://epubs.icar.org.in/ejournal/index.php/JWR/article/download/35305/15610 (Accessed June 18, 2025).
Malczewski J. (2004). GIS-based land-use suitability analysis: A critical overview. Prog. Plann. 62, 3–65. doi: 10.1016/j.progress.2003.09.002
Malczewski J. (2006). GIS-based multicriteria decision analysis: A survey of the literature. Int. J. Geographical Inf. Sci. 20, 703–726. doi: 10.1080/13658810600661508
Mojid Ma, Mustafa S., and Wyseure G. (2009). Growth, yield and water use efficiency of wheat in silt loam-amended loamy sand. J. Bangladesh Agric. Univ. 7, 403–410. doi: 10.3329/jbau.v7i2.4753
Mustafa A. A., Singh M., Sahoo R. N., Ahmed N., Khanna M., Sarangi A., et al. (2011). Land suitability analysis for different crops: A multi criteria decision making approach using remote sensing and GIS. Researcher 3, 61–84. Available online at: https://www.sciencepub.net/researcher/research0312/014_7181research0312_61_84.pdf.
Narender, Mukesh S., Rani V., Kumar A., Verma K., and Karwasara N. (2018). Performance evaluation of vegetable washer for carrot crop. Int. J. Curr. Microbiol. Appl. Sci. 7, 454–458. doi: 10.20546/ijcmas.2018.701.053
Nayak, Arunima K., Gururaja Rao G., Chinchmalatpure A. R., and Singh R. (2000). Characterization and classification of some salt-affected soils of Bhal region of Gujarat. Agropedology 10, 152–162. Available online at: https://www.academia.edu/109998102.
NSSO (2013). “Key indicators of land and livestock holdings in India,” in National Sample Survey Office, 70th Round, Ministry of Statistics and Programme Implementation (Government of India, New Delhi), 23 p.
NSSO (2024). “Comprehensive annual modular survey 2022-23: NSS 79th round,” in National Sample Survey Office, NSS Report No. 590, Ministry of Statistics and Programme Implementation (New Delhi, India: Government of India), 195 p.
Nyeko M. (2012). GIS and multi-criteria decision analysis for land use resource planning. J. Geographic Inf. System 4, 341–348. doi: 10.4236/jgis.2012.44039
Özkan B., Dengiz O., and Turan İD (2019). Site suitability assessment and mapping for rice cultivation using multi-criteria decision analysis based on fuzzy-AHP and TOPSIS approaches under semihumid ecological condition in delta plain. Paddy Water Environ. 17, 665–676. doi: 10.1007/s10333-019-00692-8
Parmar M., Solanki H., and Kalubarme M. H. (2020). Wheat crop growth monitoring using multi-spectral vegetation indices in bhal region, gujarat state. Int. J. Adv. Agric. Sci. Technol. 7, 47–66. Available online at: https://ijaast.org/index.php/ijaast/article/view/655.
Patil L. M., Patel K. G., TM N., Patel J. M., and Naik V. R. (2023). Soil related issues of south gujarat, India. Int. J. Plant Soil Sci. 35, 1714–1721. doi: 10.9734/ijpss/2023/v35i183451
Pilevar A. R., Matinfar H. R., Sohrabi A., and Sarmadian F. (2020). Integrated fuzzy, AHP and GIS techniques for land suitability assessment in semi-arid regions for wheat and maize farming. Ecol. Indic. 110, 105887. doi: 10.1016/j.ecolind.2019.105887
Pimentel D., Harvey C., Resosudarmo P., Sinclair K., Kurz D., McNair M., et al. (1995). Environmental and economic costs of soil erosion and conservation benefits. Science 267, 1117–1123. doi: 10.1126/science.267.5201.1117
Pisal R. R., Kumar N., and Shukla S. P. (2017). Long term trend analysis of rainfall at heavy rainfall zone of South Gujarat, India. Indian J. Soil Conserv. 45, 168–175. Available online at: https://www.researchgate.net/publication/324329675.
Pramanik M. K. (2016). Site suitability analysis for agricultural land use of darjeeling district using AHP and GIS techniques. Modeling Earth Syst. Environ. 2, 56. doi: 10.1007/s40808-016-0116-8
Prasunarani P. P., Pillai R. N., Bhanuprased V., and Subbaiah G. V. (1992). Nutrient status of some red and associated soils of Nellore district under somasila project in Andhra Pradesh. Andhra Agric. J. 39, 1–5. Available online at: https://agris.fao.org/search/en/providers/122648/records/6471f55877fd37171a71d050.
Rabia A. H. and Terribile F. (2013). Introducing a new parametric concept for land suitability assessment. Int. J. Environ. Sci. Dev. 4, 15–19. doi: 10.7763/ijesd.2013.v4.295
Ramamurthy V., Obi Reddy G. P., and Kumar N. (2020). Assessment of land suitability for maize (Zea mays L) in semi-arid ecosystem of southern India using integrated AHP and GIS approach. Comput. Electron. Agric. 179, 105806. doi: 10.1016/j.compag.2020.105806
Rath S. S., Panda J., Annadurai R., and Nanda S. (2018). A study on land suitability for rice cultivation in khordha district of odisha (India) using remote sensing and GIS. Earth Syst. Environ. 2, 119–132. doi: 10.1007/s41748-018-0037-y
Ray D. K., Mueller N. D., West P. C., and Foley J. A. (2013). Yield trends are insufficient to double global crop production by 2050. PloS One 8, e66428. doi: 10.1371/journal.pone.0066428
Rout G. R. and Sahoo S. (2015). Role of iron in plant growth and metabolism. Rev. Agric. Sci. 3, 1–24. doi: 10.7831/ras.3.1
Saaty T. L. (1997). That is not the analytic hierarchy process: What the AHP is and what it is not. J. Multi-Criteria decision Anal. 6, (6). doi: 10.1002/(SICI)1099-1360(199711)6:6<324::AID-MCDA167>3.0.CO;2-Q
Sathiyamurthi S., Sivasakthi M., Saravanan S., Gobi R., Kumar S. P., and Karuppannan S. (2024). Assessment of crop suitability analysis using AHP-TOPSIS and geospatial techniques: A case study of krishnagiri district, India. Environ. Sustainability Indic. 24, 100466. doi: 10.1016/j.indic.2024.100466
Setyanto D. P., Susanto S., Setyawan C., and Zaki M. K. (2023). GIS-based analysis of land suitability for rice production in food buffer area of new capital city Indonesia. E3S Web Conferences 468, 8004. doi: 10.1051/e3sconf/202346808004
Sharma D. K. and Chaudhari S. K. (2012). Agronomic research in salt affected soils of India: an overview. Indian J. Agron. 57, 175–185. Available online at: https://www.researchgate.net/publication/305492868.
Singh N. B. (2008). Crop demand-driven site-specific nitrogen applications in rice (Oryza sativa) and wheat (Triticum aestivum): some recent advances. Indian J. Agron. 53, 157–166. doi: 10.59797/ija.v53i3.4853
Singha C., Swain K. C., Sahoo S., Abdo H. G., Almohamad H., Al Dughairi A. A., et al. (2023). Total land suitability analysis for rice and potato crops through fuzzyAHP technique in west bengal, India. Cogent Food Agric. 9, 2257975. doi: 10.1080/23311932.2023.2257975
Smith L. C., El Obeid A. E., and Jensen H. H. (2000). The geography and causes of food insecurity in developing countries. Agric. Economics 22, 199–215. doi: 10.1111/j.1574-0862.2000.tb00018.x
Takkar P. N., Singh M. V., and Ganeshmurthy A. N. (1997). A critical review of plant nutrient supply needs, efficiency and policy issues for Indian agriculture for the year 2000: Micronutrients and trace elements. Plant nutrient supply efficiency Policy 2000-2025, 238–264.
Valjarević A., Morar C., Brasanac-Bosanac L., Cirkovic-Mitrovic T., Djekic T., Mihajlović M., et al. (2025). Sustainable land use in Moldova: GIS & remote sensing of forests and crops. Land Use Policy 152, 107515. doi: 10.1016/j.landusepol.2025.107515
Velasquez M. and Hester P. T. (2013). An analysis of multi-criteria decision making methods. Int. J. Operations Res. 10, 56–66. Available online at: https://www.orstw.org.tw/ijor/vol10no2/ijor_vol10_no2_p56_p66.pdf.
Vyas S. and Joshi A. J. (2015). Quantitative study of coastal flora of Bhal region in Gujarat. Int. J. Sci. Res. 4, 337–341. Available online at: https://www.academia.edu/102616445.
Wang Y.-C., Lu Y.-H., Chiang L.-C., and Hsu C.-C. (2023). Assessing crop suitability of rice, wheat, and maize on agricultural lands in Taiwan. Natural Resour. Res. 32, 813–834. doi: 10.1007/s11053-023-10162-y
Yadav G. S., Shivay Y. S., and Kumar D. (2011). Effect of mulching and iron nutrition on productivity, nutrient uptake and economics of aerobic rice (Oryza sativa). Indian J. Agron. 56, 365–372. Available oline at: https://www.researchgate.net/publication/288539028.
Keywords: agro-land suitability, wheat potential, Triticum L, land-use planning, Gujarat, multi-criteria decision analysis, analytic hierarchy process, GIS
Citation: Kumar R, Ghosh S, Patel GR, Singh LK, Mohanty AK and Singha AK (2025) Mapping wheat potential: a GIS-based agro-land suitability analysis in Gujarat’s Bhal Region, Western India. Front. Agron. 7:1551494. doi: 10.3389/fagro.2025.1551494
Received: 25 December 2024; Accepted: 23 June 2025;
Published: 17 July 2025.
Edited by:
Cosmas Parwada, Midlands State University, ZimbabweReviewed by:
Aleksandar Valjarević, University of Belgrade, SerbiaEl-Sayed Ewis Omran, Suez Canal University, Egypt
Copyright © 2025 Kumar, Ghosh, Patel, Singh, Mohanty and Singha. This is an open-access article distributed under the terms of the Creative Commons Attribution License (CC BY). The use, distribution or reproduction in other forums is permitted, provided the original author(s) and the copyright owner(s) are credited and that the original publication in this journal is cited, in accordance with accepted academic practice. No use, distribution or reproduction is permitted which does not comply with these terms.
*Correspondence: Subhankar Ghosh, c3ViaGFua2FyZ2hvc2gxOTk0QHlhaG9vLmlu; Laishram Kanta Singh, a2FudGFfbGFpQHlhaG9vLmNvLmlu