 Luana Pulvirenti1*
 Tiziana Ferreri1
 Tonia Strano1
 Federica Zappalà1Sebastiano Infantino2Caterina Caruso2Raffaele Morrone1
 Nicola D’Antona1
 Antonio Carlo Barbera2
 Alessandra Carrubba3
 Edoardo Napoli1
- 1Istituto di Chimica Biomolecolare, Consiglio Nazionale delle Ricerche (CNR), Sede Secondaria di Catania, Catania, Italy
- 2Department of Agriculture, Food and Environment, University of Catania, Catania, Italy
- 3Department of Agriculture, Food and Forest Sciences, University of Palermo, Viale d, Palermo, Italy
Introduction: Ocimum basilicum L. (basil) is a widely used aromatic plant with recognized functional properties, largely attributed to its rich profile of bioactive secondary metabolites. As demand for year-round high-quality basil increases, alternative approaches that ensure consistent phytochemical profiles are needed. This study aimed to investigate how different photoperiod regimes (6:4, 16:8, and 18:6 h light:dark) affect the composition of volatile organic compounds (VOCs) released from fresh basil tissues, together with the accumulation of polyphenols, and anthocyanins in four basil genotypes (Italian, Rosie, Greek, and Thai) grown under controlled hydroponic conditions.
Methods: Basil plants were cultivated for 26 days in a programmable mini-climate cabinet (Horto4), and their phytochemical composition was analyzed using HS-GC/MS and HPLC-UV techniques.
Results: Results showed that photoperiod significantly affected the accumulation of non-volatile compounds across genotypes. The Italian genotype under the 6:4 photoperiod exhibited the highest concentration of total polyphenols (7.96 mg/g d.w.), including chicoric (3.52 mg/g), rosmarinic (2.79 mg/g), and caffeic acids (0.42 mg/g). Anthocyanin levels in the Rosie genotype also decreased with longer light exposure, with pelargonidin/delphinidin-based pigments dropping from 0.84 mg/g under 6:4 to 0.24 mg/g under 18:6. In terms of VOCs, the Thai genotype showed a consistently high content of estragole (up to 90%) regardless of light exposure, while eucalyptol and β-pinene were predominant in the other genotypes.
Discussion: This work demonstrates that photoperiod modulation can serve as a controlled abiotic stressor to fine-tune the phytochemical composition of basil. It provides a framework for controlled-environment modulation of basil tissue phytochemistry, enabling consistent, “ready-to-eat” tissue quality with stable functional properties, supporting the principles of precision agriculture and farm-to-table innovation.
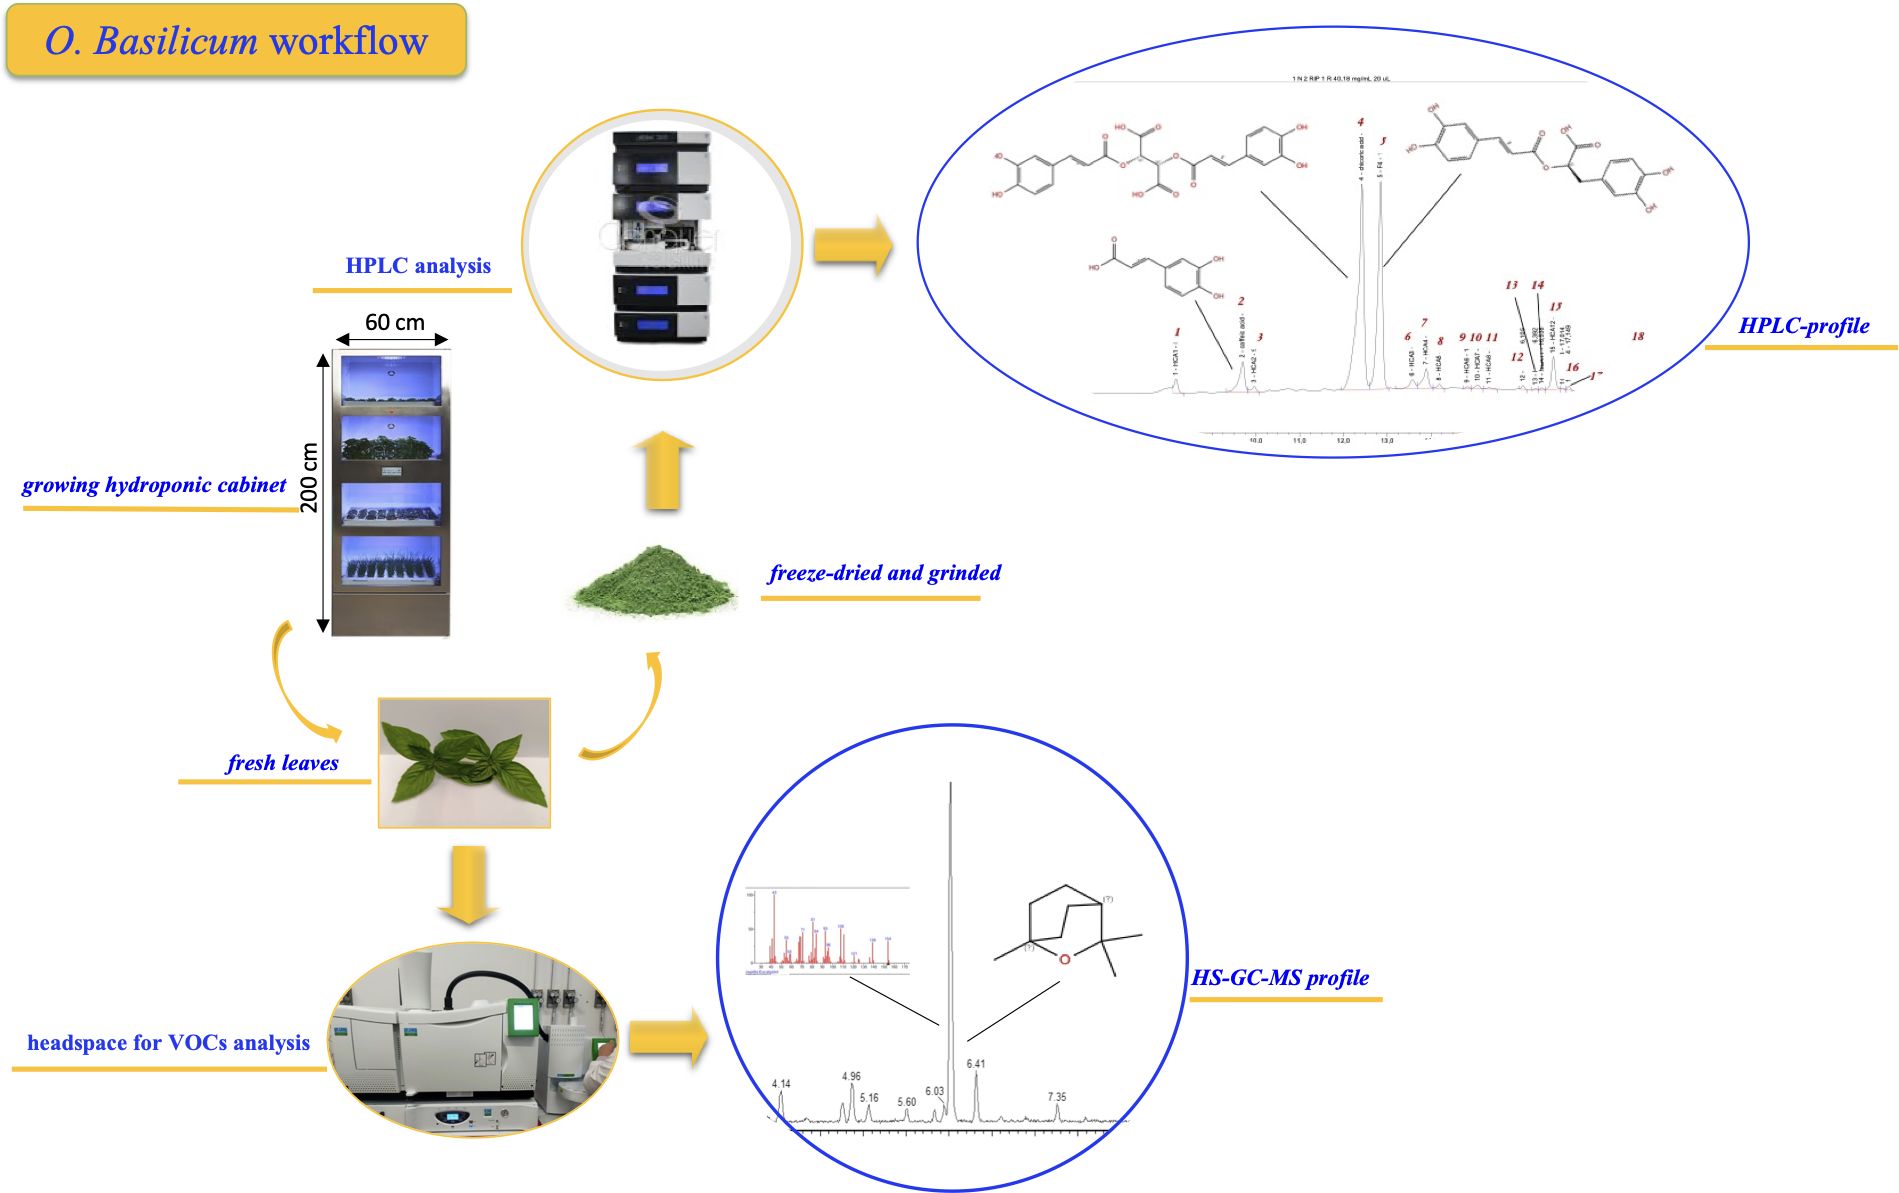
Graphical Abstract.
1 Introduction
Basil (Ocimum basilicum L.) is an edible aromatic plant belonging to the Lamiaceae family, widely used in the preparation of many foods belonging to the Mediterranean diet such as pasta with fresh tomatoes and pizza. Although its origins have to be found in India, basil is currently used and cultivated all over the world. In Italy, Liguria is undoubtedly the most important region in terms of cultivation of the fresh plants as well as the production of its peculiar preparation “Genoese pesto”, which obtained the DOP (protected designation of origin) designation (Romano et al., 2022). Beyond its culinary applications, due to its high content of bioactive secondary metabolites (Romano et al., 2022) basil can be considered a functional food (Filip, 2017), that is, a food whose regular consumption could have beneficial effects on human health (Pulvirenti and Paterna, 2022). The health-promoting properties of basil are attributable to its high content of biologically active metabolites such as hydroxycinnamic acids and derivatives (caffeic (1), chicoric (2) and rosmarinic (3), see Figure 1), and flavonoids such as quercetin. Additionally, some basil varieties, such as O. basilicum var purpurascens, contain the natural phenolic pigments called anthocyanins (Fernandes et al., 2019) responsible for their characteristic reddish color. Recent studies highlight the protective role of polyphenols-rich foods against chronic diseases, including cardiovascular diseases, metabolic disorders (diabetes, obesity, hypertension just to cite a few) (Wang et al., 2022; El-Beshbishy and Bahashwan, 2012; Kadan et al., 2016) and degenerative diseases such as cancer (Adefegha, 2018). Many of these pathological conditions share oxidative stress and inflammation as triggering factors. Antioxidant-rich foods like basil can help prevent and counteract these processes (Adefegha, 2018). In addition to its content in non-volatile specialized metabolites, basil reputation and widespread use as a spice worldwide is due to its intense aroma, given by its peculiar volatile organic compounds (VOCs), such as eugenol (4), linalool (5), and 1,8-cineole (6) (Ruberto et al., 1991) (Figure 1).
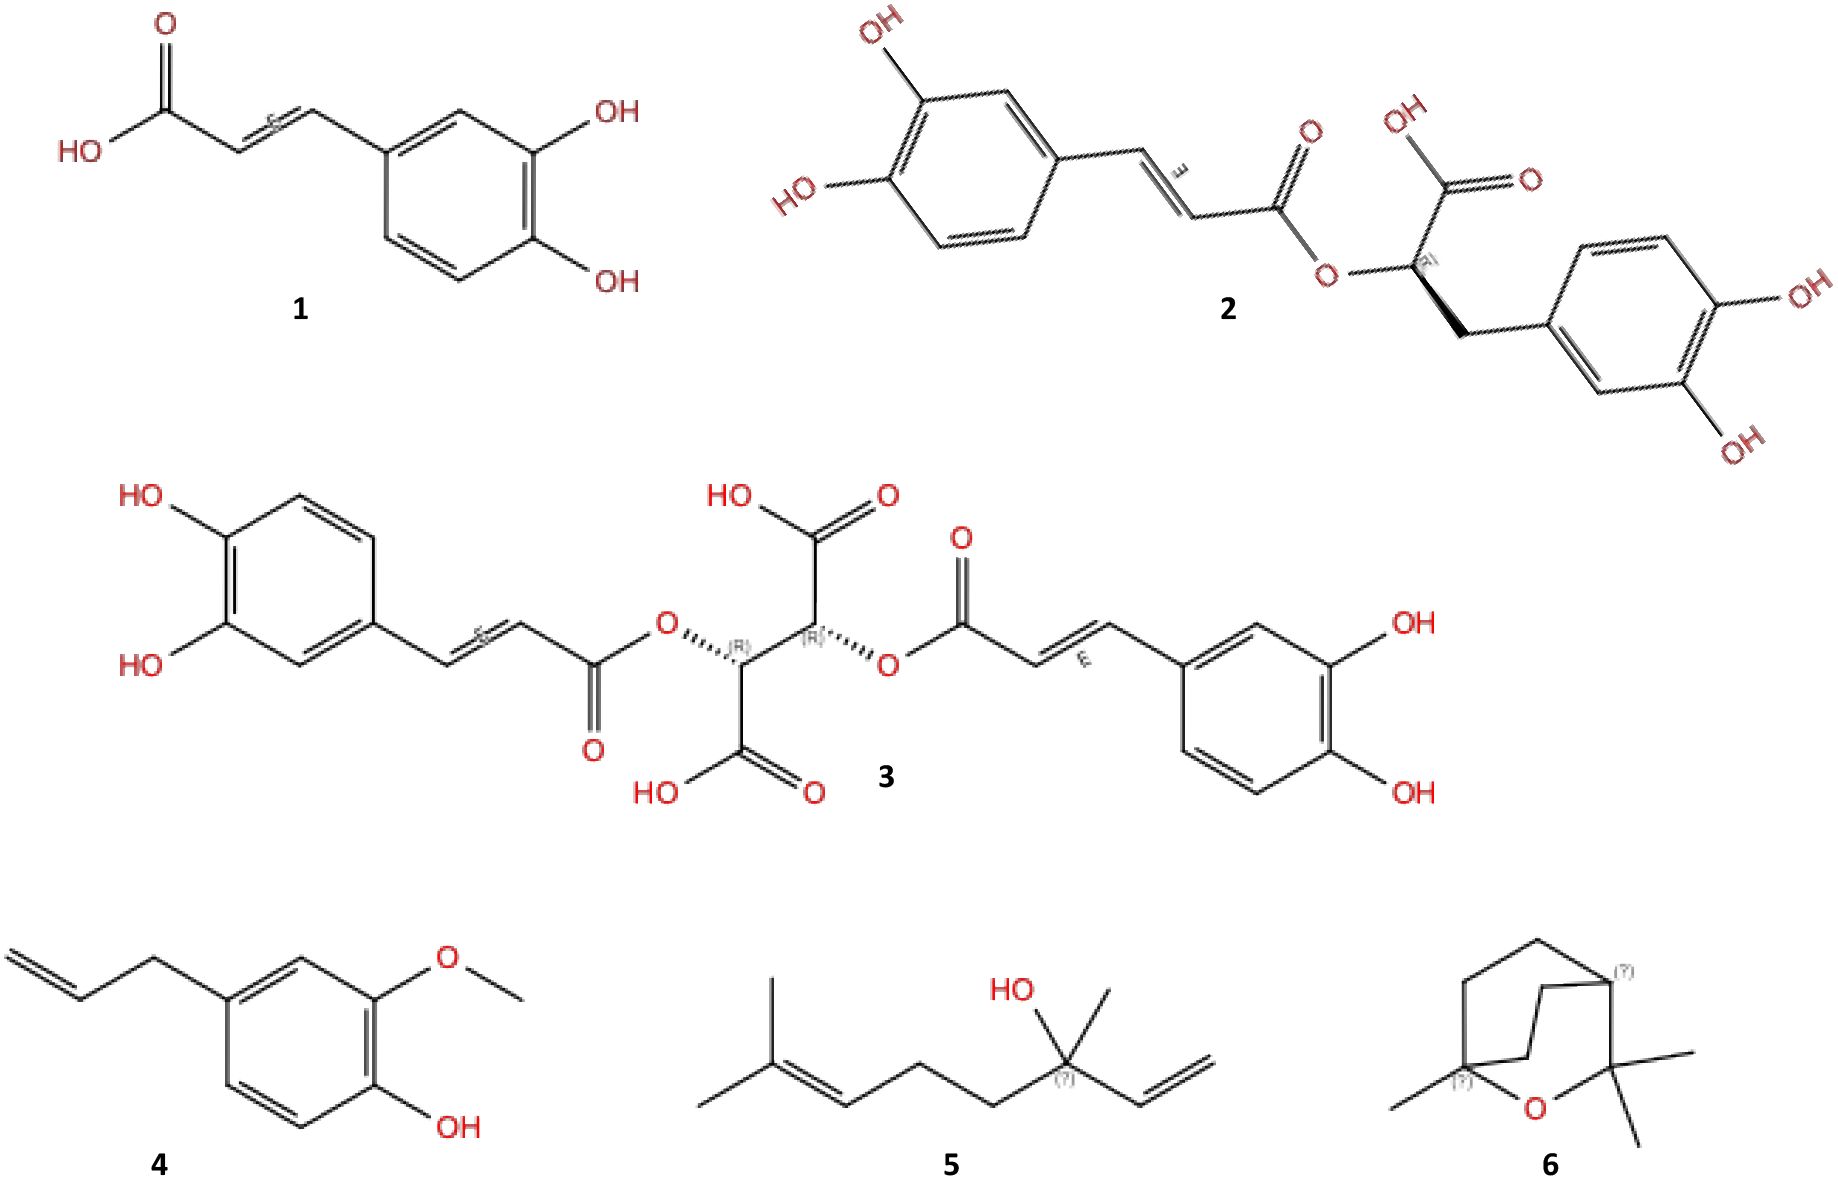
Figure 1. Representative specialized metabolites in basil, in detail: caffeic acid (1), rosmarinic acid (2), chicoric acid (3), eugenol (4), linalool (5), and 1,8-cineole (6).
In order not to lose its aroma, basil is typically consumed fresh without any cooking, as high temperatures would seriously damage basil VOCs content, as reported by Coucquyt et al. (2020). Beyond domestic use, basil is also a key ingredient in high-end gastronomy as reported in a recent study by Spence (2024), who surveyed the 500 top-rated restaurants in California, revealing that basil was the most used herb, with 97% of preparations featuring fresh basil, and a 40% increase in demand over the year before. These considerations underscore the need for sustainable alternatives to open-field production, striking a balance between technology, practicality, and cost-effectiveness to ensure ‘ready-to-eat’ basil tissues with consistent quality, readily available in both restaurants and even home kitchens. The extensive use of basil in many different cuisines has resulted in a range of species and cultivars of the Ocimum genus being produced. To date, approximately 70 species are officially registered (www.theplantlist.org), with at least 150 more under consideration (Jakovljević et al., 2022). Accordingly, a certain variability is also found in the biosynthesis and accumulation of secondary metabolites in relation to the species and the growing conditions. The increasing demand for high-quality basil at global level throughout the year calls for innovative strategies that ensure consistent phytochemical composition of basil tissues (Rusu et al., 2021), regardless of seasonal limitations. While traditional open-field farming is subject to climatic variability, controlled-environment agriculture (CEA) provides an alternative approach that allows for precise regulation of environmental parameters, including light, temperature, and nutrient availability (Sharma et al., 2024). Among these factors, photoperiod is a crucial variable that influences growth rates, metabolite accumulation, and overall crop quality (Skrubis and Markakis, 1976; Avgoustaki, 2019). Recent studies have highlighted the significant impact of photoperiod and light intensity on the growth and secondary metabolism of basil. D’Aquino et al. (2024) demonstrated that varying photosynthetic photon flux density (PPFD) levels and photoperiods can modulate the volatile profile and accumulation of non-volatile compounds, including monoterpenes and sesquiterpenes, in basil plants. Similarly, Frąszczak et al. (2011) found that extending light exposure to 16 hours enhanced fresh biomass, plant height, and chlorophyll content in different basil cultivars. These findings underscore the importance of optimizing light conditions to improve the phytochemical profile and overall quality of basil in controlled environment agriculture. In recent years, the effect of rapid environmental change, rapid population growth and urbanization, and competition for land and water resources are playing a crucial role in meeting global demand for food. In this context, the challenge of precision agriculture must have as its main goal the improvement of the strategies implemented in the management of edible crops, with particular focus on product quality, sustainability, food safety, and environmental protection (Rusu et al., 2021). Hydroponic systems (Ronga et al., 2018) allow greater control on plant nutrition and growth conditions, and consequently an effective modulation of the phytochemical profile (Al-Huqail et al., 2020), and the induction of “positive” stresses which can potentially improve the quality of the product. In this study, the use of mini greenhouses (or climate cabinets), allowed to explore photoperiod as a controlled abiotic stress, with the aim to demonstrate how its modulation can trigger targeted metabolic responses in basil. With this purpose, three photoperiodic regimes (6:4, 16:8, and 18:6 h light:dark) were tested, being 16:8 (corresponding to a natural day:night alternance) a widely used photoperiod in similar experiments on basil (Avgoustaki, 2019; D’Aquino et al., 2024), whereas a repeated 6:4 light/dark alternance and a prolonged light exposure (18:6) were intended as stress conditions. The selected photoperiodic regimes were applied throughout a 26-day growth cycle on four different basil genotypes (Italian, Rosie, Greek, and Thai), grown in the hydroponic cabin Horto4 (https://www.tomatopiu.com/serra-idroponica-4-piani-da-interni). Although belonging to the same species, the four selected genotypes are well distinguished based on their morphological (size, color and aspect of leaves) and phytochemical features (Giachino et al., 2014). The leaf samples obtained from each genotype and treatment were extracted using a hydroalcoholic mixture and subsequently analyzed (see the experimental section for further details). Therefore, the aim of this study is to assess how different photoperiodic regimes (6:4, 16:8, and 18:6 h light:dark) influence the accumulation of bioactive secondary metabolites, namely polyphenols, anthocyanins, and the profile of volatile organic compounds (VOCs), in four genotypes of Ocimum basilicum (Italian, Rosie, Greek, and Thai). Although the plants were cultivated in a controlled hydroponic environment (Horto4 climate cabinet), the focus of the research was not on the growing system per se, rather on the modulation of photoperiod as an abiotic stressor and its biochemical effects on basil.
2 Materials and methods
2.1 Plant material
No-GMO seeds of Ocimum basilicum (Italian, Rosie, Greek and Thai) were obtained from the company Tomato+ (www.tomatopiu.com, Borgosatollo (BS), Italy). The seeds were planted in pods for indoor hydroponic cultivation, made of biodegradable and compostable material and containing an inert substrate without GMOs, chemical additives, and/or pesticides, packaged in a controlled environment able to maintain seed vitality for up to 6 months. The pods were placed in the trays of the mini greenhouse and inserted into the respective cultivation shelf where the nutrient solution was provided. After 26 days of growth in controlled conditions, basil plants were harvested, and the pods discarded as wet waste together with the plant roots.
2.2 Climate chamber parameters and sampling
The selected basil genotypes were cultivated in a climate-controlled hydroponic growth cabinet (Horto4, Tomato+; see previous paragraph). Lighting was provided by the cabinet’s integrated full-spectrum LED modules (manufacturer: Tomato+, model Horto4, Borgosatollo, Italy; https://www.tomatopiu.com/serra-idroponica-4-piani-da-interni). The spectrum consisted of hyper red (635–666 nm, peak 660 nm; efficacy 3.17 μmol J−1; total output 37.28 μmol s−1), deep blue (439–461 nm, peak 451 nm; efficacy 2.39 μmol J−1; total output 29.16 μmol s−1), far red (720–740 nm, peak 730 nm; efficacy 3.14 μmol J−1; total output 12.54 μmol s−1), and true green (513–545 nm, peak 525 nm; efficacy 1.22 μmol J−1; total output 6.96 μmol s−1). The photosynthetic photon flux density (PPFD) at canopy height averaged ~163–171 μmol m−2 s−1 across shelves, as measured with a PAR quantum sensor. The corresponding daily light integral (DLI) values were estimated at 8.2, 9.9, and 10.9 mol m−2 d−1 for the 6:4, 16:8, and 18:6 photoperiods, respectively. These values are consistent with those reported in the literature for basil cultivation under comparable controlled-environment conditions (Frąszczak et al., 2011; D’Aquino et al., 2024). This system allows precise control over key environmental parameters such as photoperiod, temperature, humidity, and nutrient solution composition. The cabinet (64 × 60 × 200 cm) comprises four independently programmable cultivation shelves (except for the nutrient solution, which is supplied from a single shared 20 L tank). Each shelf accommodates 81 cultivation pods, allowing for a total of 324 plants to be grown simultaneously.
Photoperiod treatments included 18:6, 16:8, and 6:4 h light/dark cycles; in the latter case, the regime consisted of alternating 6 hours of light and 4 hours of darkness, repeated across the 24-h day. Thus, plants were exposed to alternating periods of light and dark across the diel cycle, instead of a single continuous light phase. With this method 120 plants were grown. After germination, seedlings were thinned to six plants per pot, with 20 pots per treatment. The experiment was conducted on three shelves using the environmental settings reported in Table 1. The cultivation period lasted 26 days. At harvest, all 120 plants per treatment were collected for agronomic and quality assessments. A subsample of 1 gram of randomly selected fresh tissue per replicate was used for volatile organic compound (VOC) analysis (see Section 2.3), conducted in triplicate. The remaining leaves were weighed and immediately freeze-dried for secondary metabolite profiling (see Section 2.4). Lyophilization was carried out using a TELSTAR LYOQUEST semiautomatic freeze-dryer equipped with a capping tray (T = -80 °C; P = 0.005 mBar) for 72 hours. The dried plant material was then finely ground using a household electric grinder to obtain a homogeneous powder, which was stored in sealed plastic jars until further analysis (see following sections).
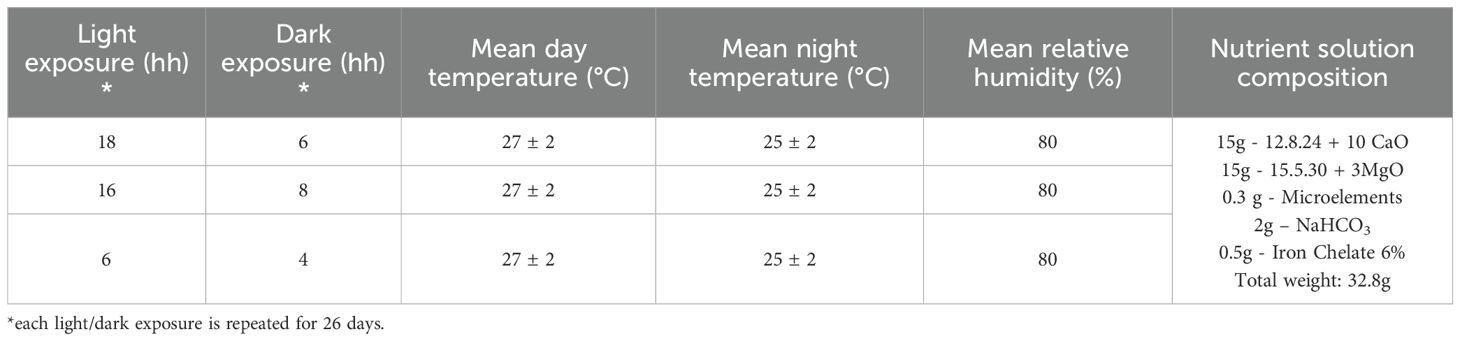
Table 1. Cultivation parameters of tested basil genotypes.
2.3 Identification of volatile fraction (VOCs analysis) by static head space (HS)–GC/MS analyses
Volatile organic compounds (VOCs) were analyzed using static headspace (HS) sampling coupled with gas chromatography/mass spectrometry (GC-MS). This method was selected for its ability to preserve the aromatic profile of fresh aromatic species. To carry out this analysis, a Clarus 690 gas chromatograph (Perkin Elmer, Milan, Italy) equipped with a Clarus SQ8T mass spectrometer (Perkin Elmer, Milan, Italy) and a Turbomatrix 16 autosampler (Perkin Elmer, Milan, Italy) were used. One g of fresh leaves from each sample was placed in a sealed 20 mL vial and then thermostated for 5 min at 40 °C. Head space conditions were the following: transfer line 180 °C, needle temperature 100 °C, injection time 0.5 min., withdraw 0.2 min., pressurizing time 0.3 min. For the separation of compounds, an ELITE - 5MS (30mx0.25x0.25, Perkin Elmer, Milan Italy) capillary column was housed in the GC oven. Briefly, the oven GC temperature program was: isothermal at 60 °C for 1 min, then ramped to 220 °C at a rate of 5 °C min−1, and finally isothermal at 220 °C for 5 min. H2 was used as carrier gas at a constant flow rate of 1.0 mL min−1. The mass spectra were obtained in the electron impact mode (EI), at 70 eV in scan mode in the range 35–400 m/z. The identification of the separated compounds was performed by comparing the mass spectra for each compound with that reported on the MS library search (NIST/EPA/NIH and NIST Tandem Mass Spectra Library, version 2.4). Compounds were identified by comparison of experimental retention indices (KIexp) with reference literature values (KIlit) (Adams, 2007) and by comparison of mass spectra with those from commercial libraries (NIST, Wiley) as reported in Supplementary Table S1. The linear retention index (LRI) of each compound was calculated using a mixture of n-alkanes (C8-C20, Ultrasci) injected directly into GC injector at the same operating conditions reported above and each calculated LRI was compared with those reported in Nist Chemistry WebBook. All analyses were carried out in triplicate.
2.4 Identification and quantification of Ocimum basilicum biochemical markers via HPLC/DAD and HPLC/ESI/MS analyses
Anthocyanins and hydroxycinnamic acid derivatives (HCA) of Ocimum basilicum leaves of genotypes Italian (I), Rosie (R), Greek (G) and Thai (T) obtained by hydroponic cultivation under different photoperiodic conditions were determined. For each sample, basil dried and grinded leaves (~ 130 mg) were placed in a 10 mL vial and 3 mL of a mixture EtOH-H2O (7:3 v/v) were added; the resulting suspension was kept overnight at room temperature, in the dark under vigorous and continuous stirring in a shaker (200 rpm). The extraction procedure was repeated twice for all samples, after that the heterogeneous mixture was centrifuged at 4000 rpm (ALC PK 130 centrifuge, Milan Italy) for 10 minutes to recover the green supernatant solution. A small aliquot of this solution was filtered with PTFE filters (15 mm diameter, 0.45 μ pore size (Chemtek Analytica, Milan, Italy), into a 2 mL amber vial for analysis. Chromatographic analyses were carried out on an Ultimate3000 UHPLC-focused instrument equipped with a binary high-pressure pump, a photodiode array detector, a thermostated column compartment and an automated sample injector (Thermo Fisher Scientific, Inc., Milan, Italy). Collected data were processed through a Chromeleon Chromatography Information Management System v. 6.80. Chromatographic runs were all carried out using a reverse-phase column (Gemini C18, 250 × 4.6 mm, 4,6 μm particle size, Phenomenex Italia s.r.l., Bologna, Italy) equipped with a guard column (Gemini C18 4 × 3.0 mm, 5 μm particle size, Phenomenex Italia s.r.l., Bologna, Italy). Components of the hydroalcoholic extracts of each sample were eluted using a gradient of B (2.5% formic acid in acetonitrile) in A (2.5% formic acid in water): 0 min: 5% B; 1 min: 50% B; 15 min: 90% B; 20 min: 90% B; 28 min: 100% B; then kept for other 2 min, 100% B. The solvent flow rate was 1 mL/min, the temperature was kept at 25 °C, and the injector volume selected was 20 μL. The analysis was carried out at 254, 330, 350 and 520 nm, diagnostic wavelengths typically used for the identification of polyphenol metabolites (Harborne, 1973). About twenty-nine chromatographic peaks were detected. Quantification of simple phenols and polyphenols was performed using UV-Vis/DAD detection and external calibration with standards bearing identical or similar chromophores. Hydroxycinnamic acids were quantified at 330 nm using a calibration curve generated with caffeic acid as the reference standard (R² = 0.9995, CRL 13007262,95). Peaks corresponding to chicoric (R² = 1, CRL 29917781,29) and rosmarinic acids (R² = 1, CRL 21285628,52) were identified and confirmed through co-elution with authentic standards. The limits of detection (LOD) and quantification (LOQ) for caffeic, rosmarinic, and chicoric acids were calculated, and the corresponding values are reported in Supplementary Table S2. Anthocyanins and their derivatives were quantified at 520 nm using malvidin chloride as the external standard (R² = 0.9997, CRL 28899520,59). To unambiguously identify the chromatographic signals and/or to confirm peak assignments, a series of UPLC/ESI/MS analyses were performed on a selected number of samples employing a Vanquish UPLC System equipped with a quaternary high-pressure pump F (VF-P20-A), a photodiode array detector (VC-D11-A), a thermostated column compartment and an automated sample injector (VF-A10-A) (Thermo Fisher Scientific, Inc., Milan, Italy) coupled to a TSQ Fortis Plus Mass spectrometer. Collected data were processed through the software Thermos Scientific Xcalibur version 4.5. The chromatographic method discussed above adapted to a reverse-phase 10 cm column (Luna Omega C18, 100 × 2.1 mm, 1,6 μm particle size, Phenomenex Italia s.r.l., Bologna, Italy); while the MS method was set with a scan-range (m/z) of 150–2000 in both positive (3000 V) and negative (2200 V) mode, Q1 resolution of 0.7 (FWHM) and 20 eV as source fragmentation; the ion source type was H-ESI with a static spray voltage.
2.5 Statistical analysis
All data from phytochemical analyses, including secondary metabolites and VOCs, were submitted to ANOVA by means of the statistical package Minitab® version 17.1.0 (Minitab Inc., State College, PA, USA, 2013). Preliminary tests for normality of residuals (Bartlett’s test) and for variance homogeneity (Levene’s test) were run for each dataset, and whenever the preliminary assumptions were rejected, data were submitted to Box-Cox transformation according to the formula Y’=1/√(Y). All the above procedures are implemented in the Minitab package. The GLM (General Linear Model) procedure was used, setting as dependent variables the measured data, whereas the independent variables (treatments) were “genotype” (G) and “photoperiod” (P). Whenever an adequate number of replicates allowed a complete analysis, the effect of the G x P interactions was also taken into account; otherwise (as in the VOCs results), the two variability sources were separately and independently considered. When the F-test indicated statistical significance at the P ≤ 0.05 level, Tukey’s HSD test was used to evidence the differences among treatments (Gomez and Gomez, 1984). In order to assess any significant trend in samples variability, all data were submitted to Principal Component Analysis (PCA) by means of the statistical package PAST version 5.2.1 (Hammer and Harper, 2001). A Clustered Heatmap (CH) was also drawn using the package Rstudio 2023.06.0.
3 Results
3.1 Impact of selected genotype and photoperiodic conditions on basil VOCs composition
The HS/GC-MS analyses identified 26 compounds, representing 95 to 99% of the total peak area (Table 2). The chromatographic profile of three out of the four basil varieties Italian, Greek, and Rosie was dominated by the monoterpenoid eucalyptol (6), which averaged between 46 and 54% across all photoperiodic conditions. In contrast, the aromatic profile of the Thai genotype was dominated by the phenylpropanoid estragole (4), reaching on average 82.5% of the total composition. The ANOVA enlightened significant differences among genotypes in several other compounds, e.g., linalool, which was the second most abundant compound in Rosie (17.4%) and Italian (7.0%), reached significantly lower values (0.4%) in the Thai genotype. In Italian, Greek, and Rosie, the remaining detected VOCs (mostly hydrocarbon monoterpenes) ranged between 3 and 7% of the total, showing few and negligible differences among genotypes. Otherwise, in Thai, the majority of detected VOCs were found at significantly lower levels in many cases <1%.
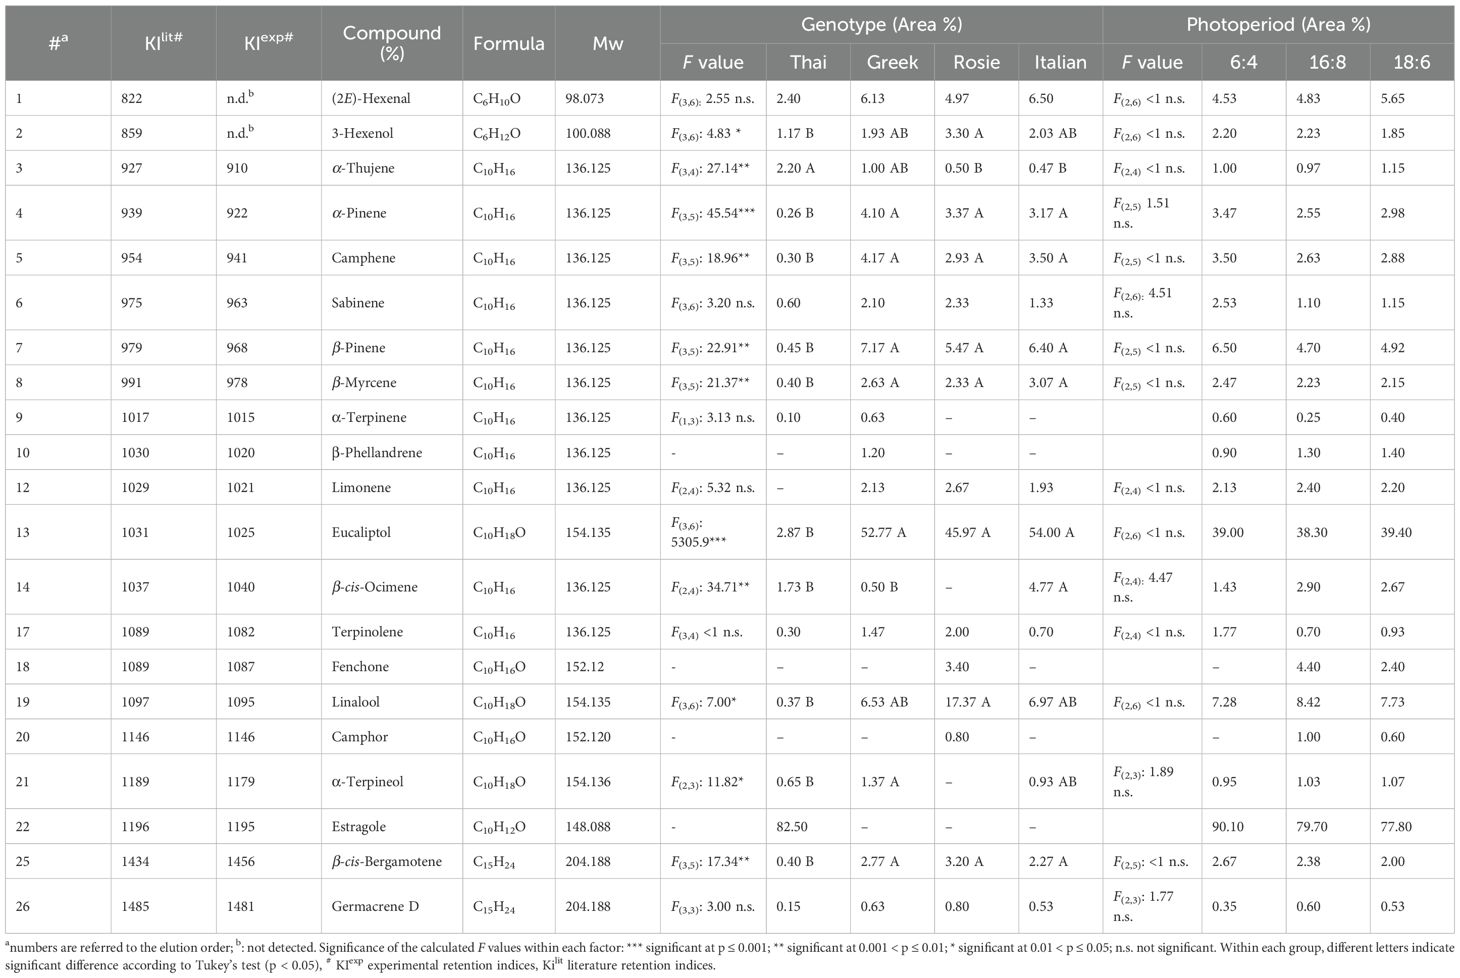
Table 2. Peak list of identified classes of basil VOCs, mean values across genotypes and photoperiodic conditions, and results of the ANOVA for each compound according to genotype and photoperiodic condition.
Notably, the Italian genotype (Figure 2) showed the highest presence of β-cis-ocimene (4.8%), resulting in an increased presence of woody and floral scent notes.
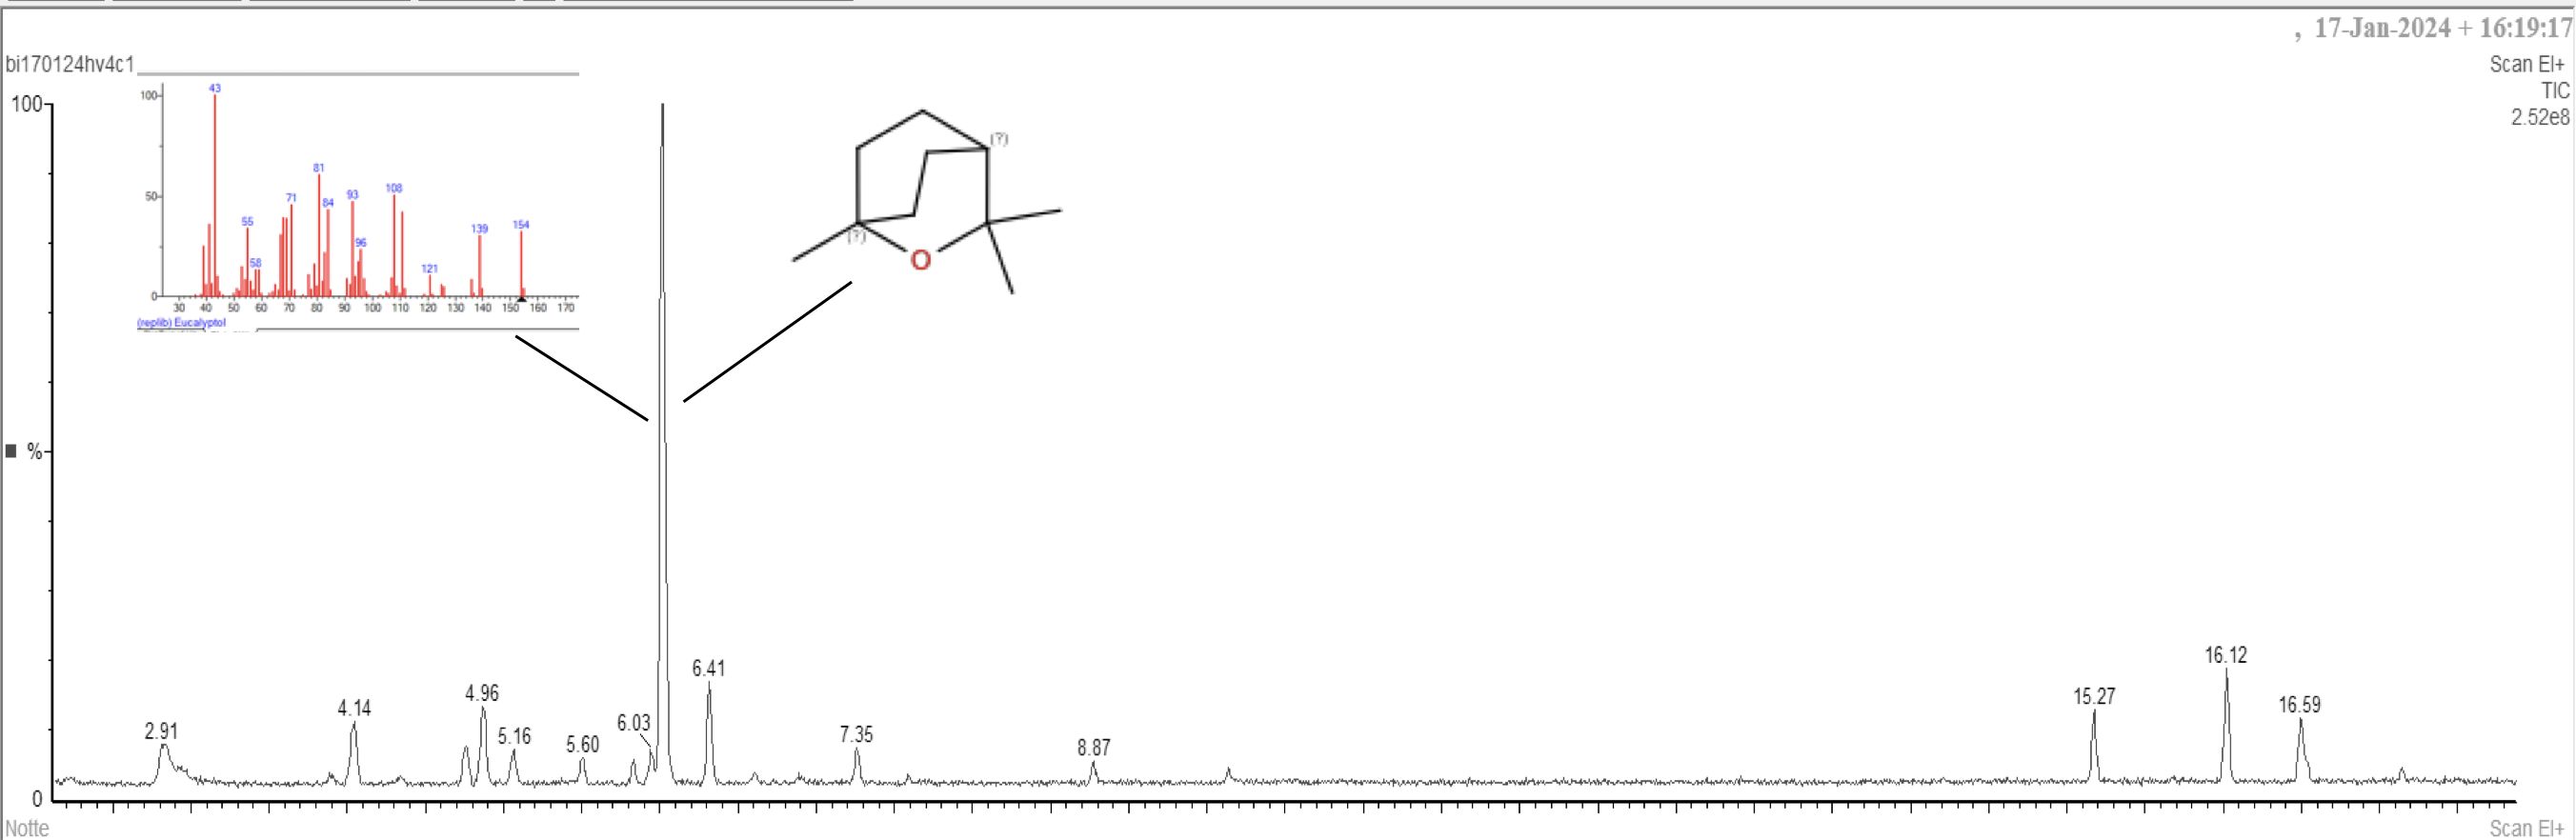
Figure 2. GC-MS chromatogram of Italian O. basilicum leaves.
β-Pinene was the second major component in the Greek genotype (7.2%), the third in Rosie (5.5%) and the fourth in Italian (6.4%), without statistically significant differences among these three basil types; a significant difference was instead found between those three genotypes and Thai (0.5%).
At the ANOVA, the photoperiod did not demonstrate any significant influence on the relative percentages of the detected volatile components. However, several compounds displayed a definite increasing (β-cis-ocimene) or decreasing (α− and β−pinene, camphene, terpinolene) trend at increasing number of uninterrupted hours of dark (6:4>18:6>16:8).
3.2 Characterization of O. basilicum polyphenolic profiles
Twenty-nine metabolites (Table 3) were detected by HPLC/Uv-Vis-PDA. Twenty-one of them, marked with HCA1 to HCA21, belonged to the class of hydroxycinnamic acids, whereas eight metabolites (A1 to A8) belonged to the subclass of anthocyanins and were detected only in the Rosie genotype, belonging to the variety purpurascens (Phippen and Simon, 1998; Fernandes et al., 2019).
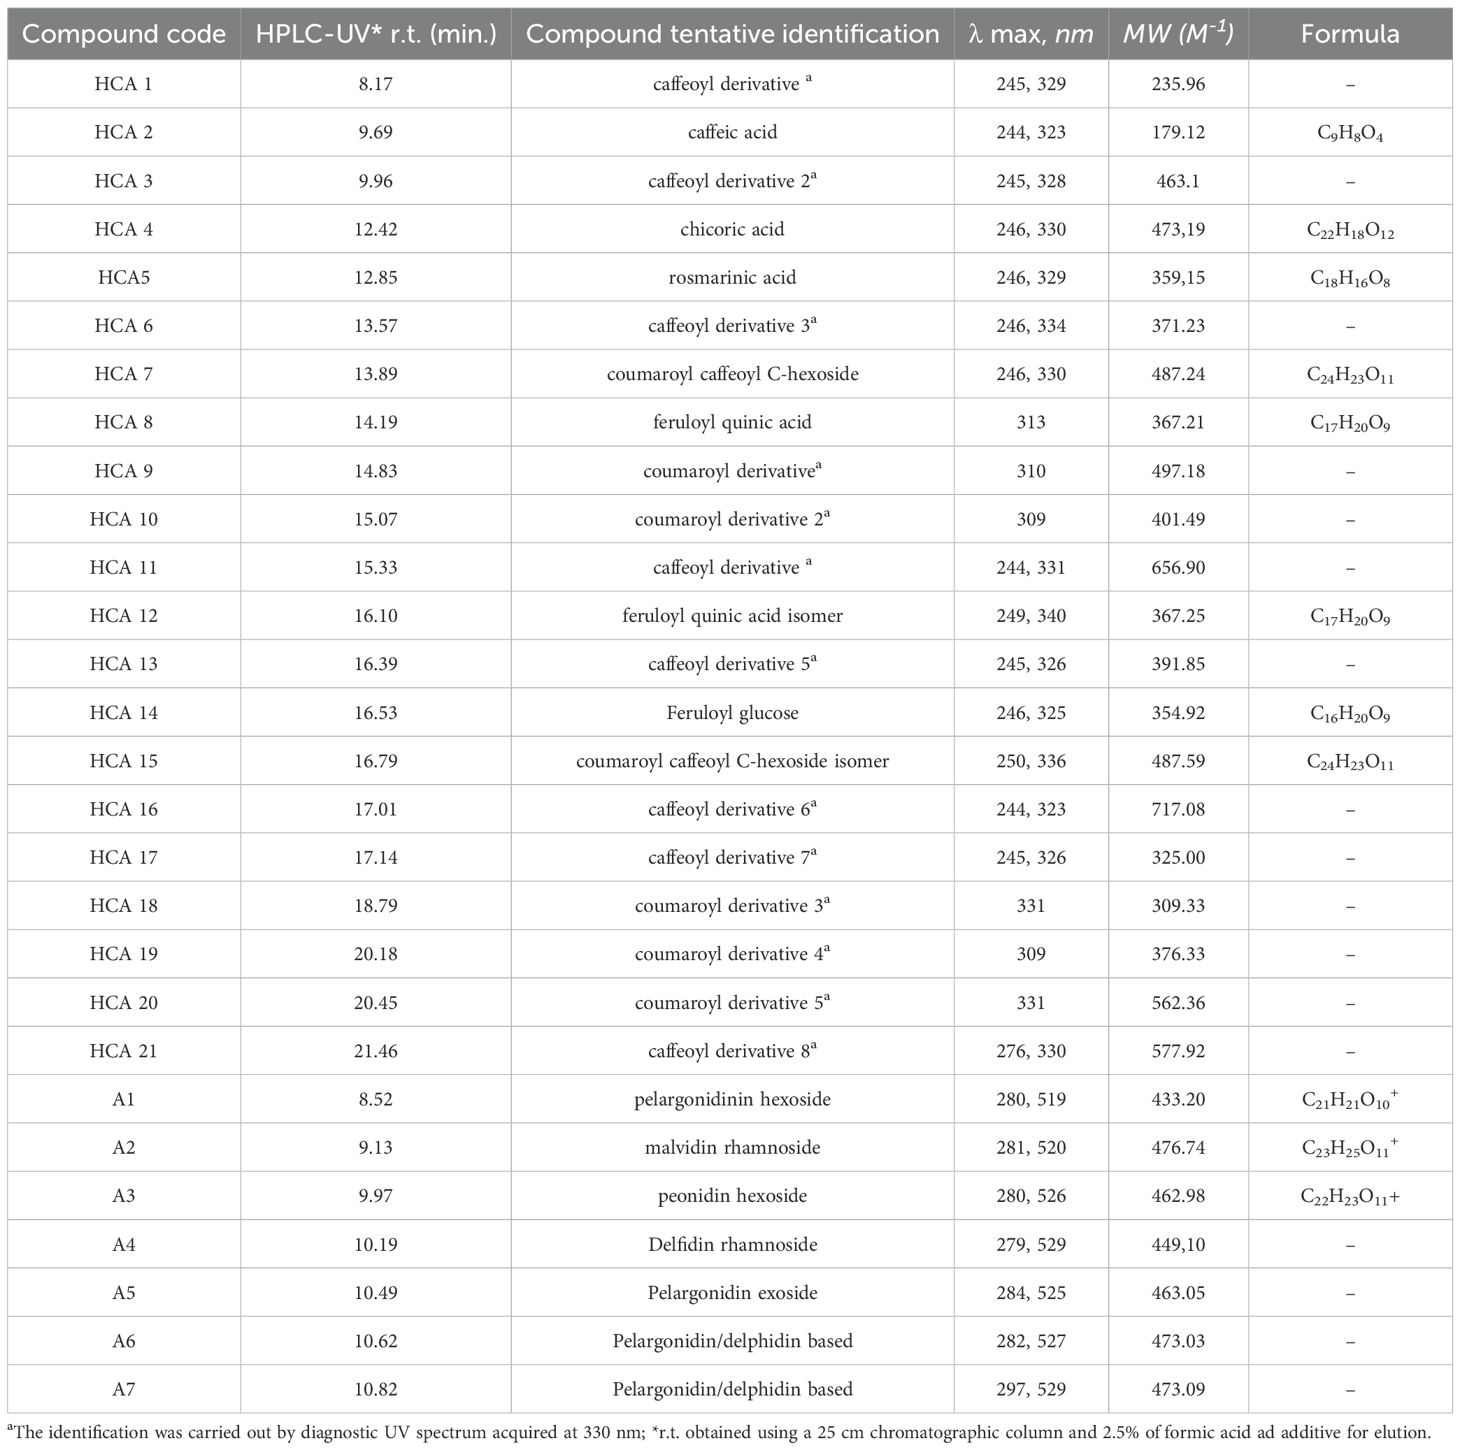
Table 3. Peak list of identified classes of polyphenols in O. basilicum genotypes.
The mean values across genotypes and photoperiodic conditions of the major detected metabolites, along with their interactions (GxP) and the results of the performed ANOVA, are reported in Table 4. Caffeic acid (r.t. 9.96 min.), chicoric acid (r.t. 12.42 min.) and rosmarinic acid (r.t. 12.85 min.) (see Figure 3) were found in all genotypes; UPLC/MS analyses confirmed their assignment for peaks 1, 4 and 5, with the following M-1 ions: 179.12 (100%), 473.19 (100%) and 359.15 (100%), respectively.
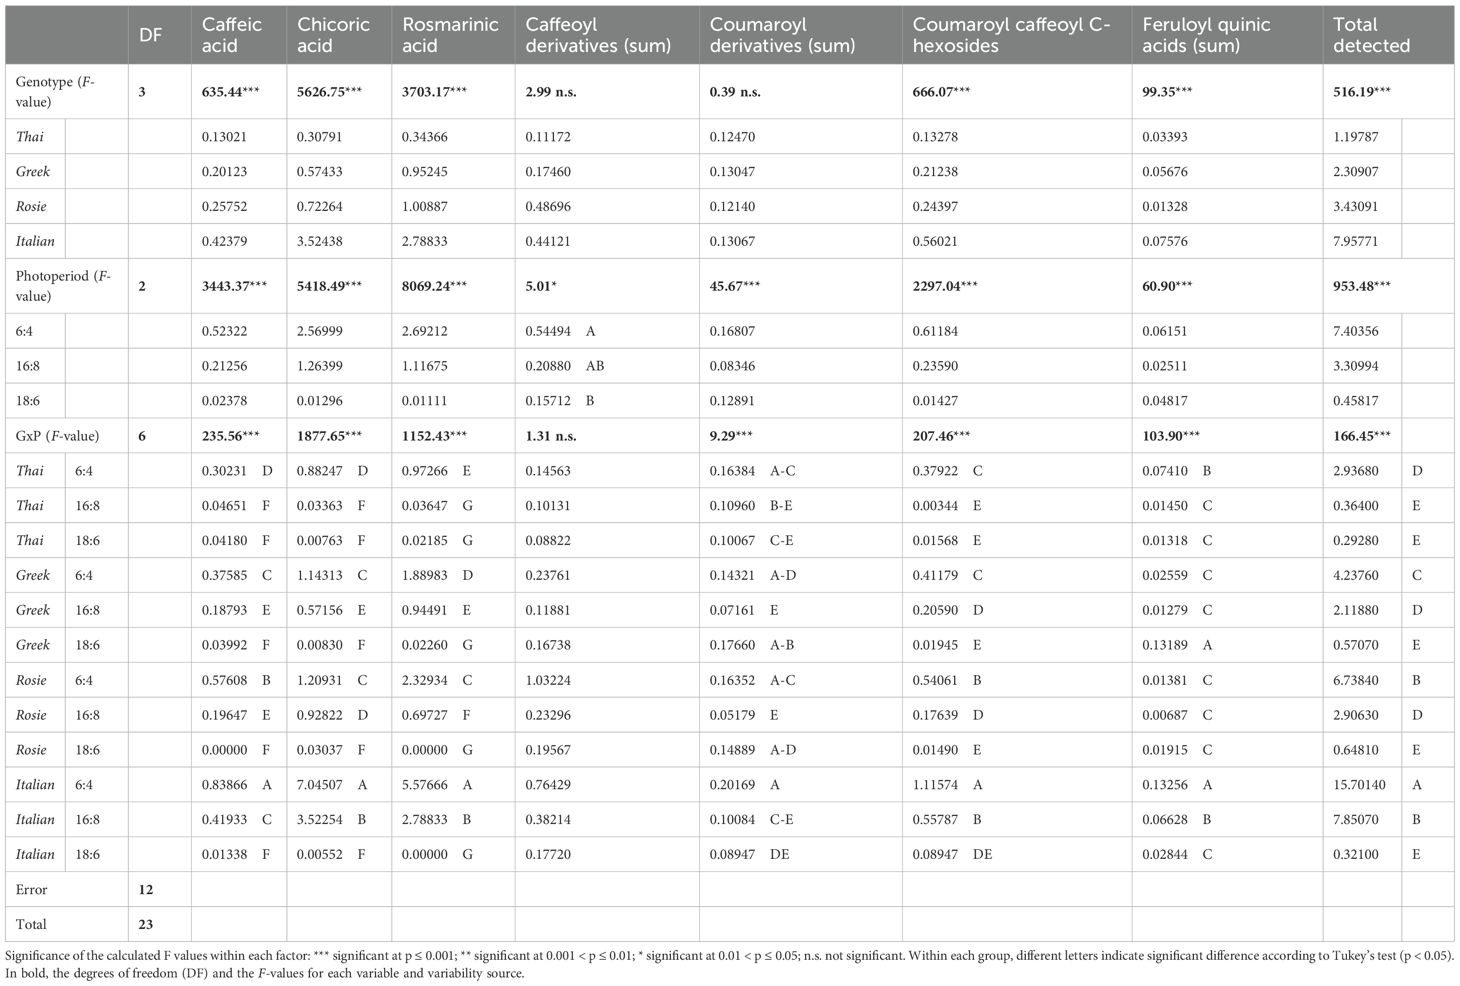
Table 4. Mean values (mg g-1 of plant dry matter) across genotypes and photoperiodic conditions, and results of the ANOVA, for the major secondary metabolites detected in four basil genotypes under 6:4, 16:8, and 18:6 h light:dark.
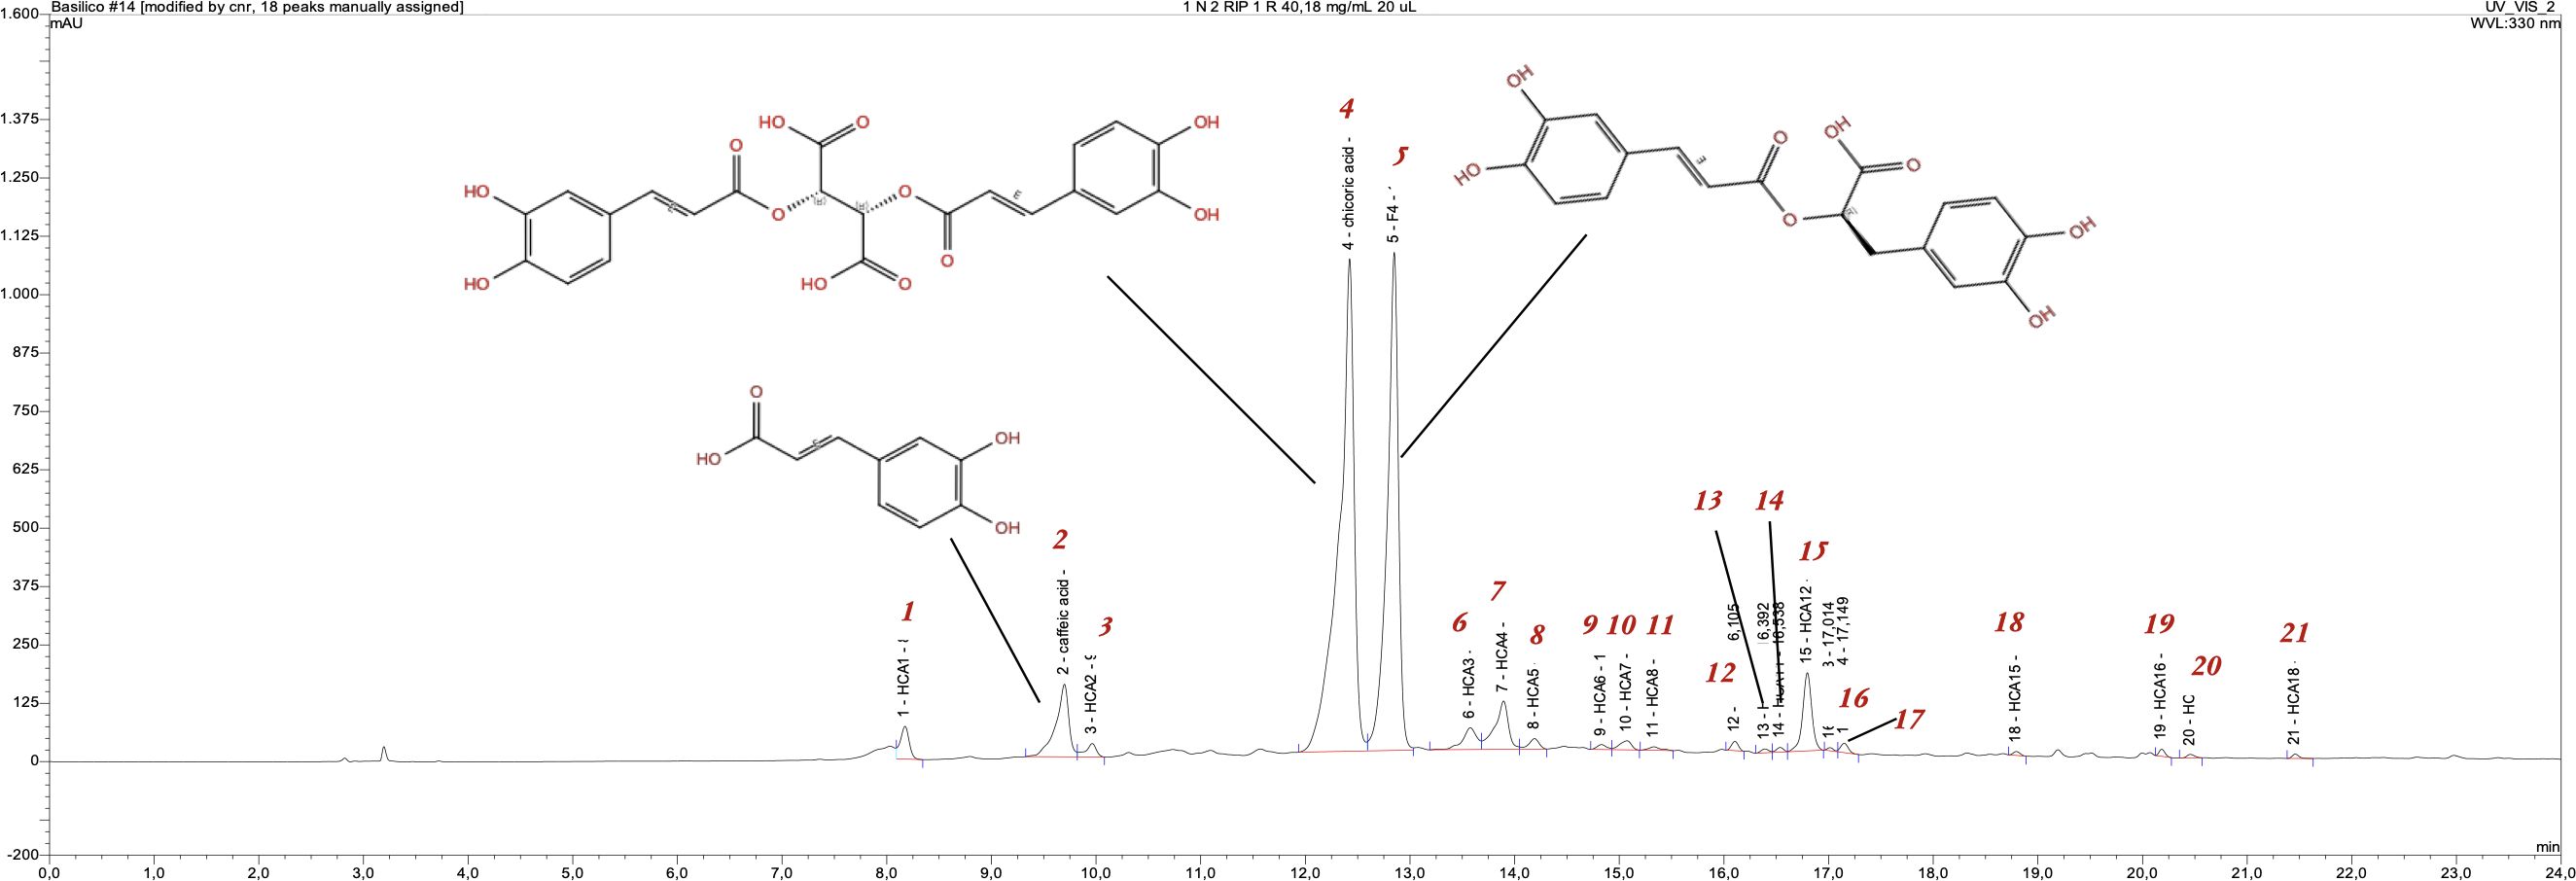
Figure 3. HPLC/UV vis- DAD chromatogram, visualized at 330 nm, of O. basilicum genotype Italian.
The chromatographic profile (Figure 3) of the Italian basil leaves extract (growth at photoperiod 16:8) shows 21 chromatographic peaks, each of which has a characteristic UV spectrum at 330 nm associated with the molecular structure (chromophore) of hydroxycinnamic acids. The most abundant of these are peaks 1, 4 and 5, and chicoric acid (peak 4) is the most abundant of the three (44%) followed by rosmarinic acid (peak 5, 36%), while caffeic acid (peak 1), which is the precursor of both compounds, was present at 5%. The chromatographic profile of the hydroalcoholic extract of Rosie leaves (grown at a 6:4 photoperiod) showed that the main compound in this case was rosmarinic acid (peak 5), representing 35% of the extract (2.33 mg/g of Rosie dry leaves) followed by chicoric acid (peak 4) and caffeic acid (peak 1), which represented 17% and 9% of the extract, respectively (1.21 and 0.58 mg/g of Rosie basil dry leaves).
All the investigated metabolites proved to be significantly affected by the genotype, the photoperiodic condition, and their interaction, with the only exception of the total of caffeoyl derivatives, which did not show a significant GxP interaction. However, although the occurrence of significant GxP effects does not allow to generalize about the main effects, the observation of the interaction values shows, within each genotype, a definite decreasing trend of all metabolites with increasing illumination hours. Hence, the Italian genotype, which averaged the highest content of total detected metabolites (7.96 mg g-1 of plant d.m.), and, within them, caffeic acid (0.42 mg g-1), chicoric acid (3.52 mg g-1), and rosmarinic acid (2.79 mg g-1), exhibited marked decreases from the photoperiodic ratio 6:4 to 16:8 and 18:6. The same trend was recognizable across all genotypes, and in the more prolonged uninterrupted light conditions (18:6), both the total metabolites content and the amounts of caffeic, chicoric and rosmarinic acids dropped to the minimum level, in some cases (caffeic and rosmarinic acid in Rosie, and rosmarinic acid in Italian), even falling below the analytical detection threshold.
The Rosie genotype, belonging to the purpurascens variety, showed as a distinctive character the presence of anthocyanins, responsible for the typical reddish color of its leaves of this variety, which in the photoperiodic condition of 6:4 represented 21% of the extract (0.84 mg g-1 of dry basil leaves). Being these compounds only retrieved in the Rosie genotype, a separate one-way ANOVA was run to assess the effect of photoperiod on their accumulation in basil leaves (Table 5).
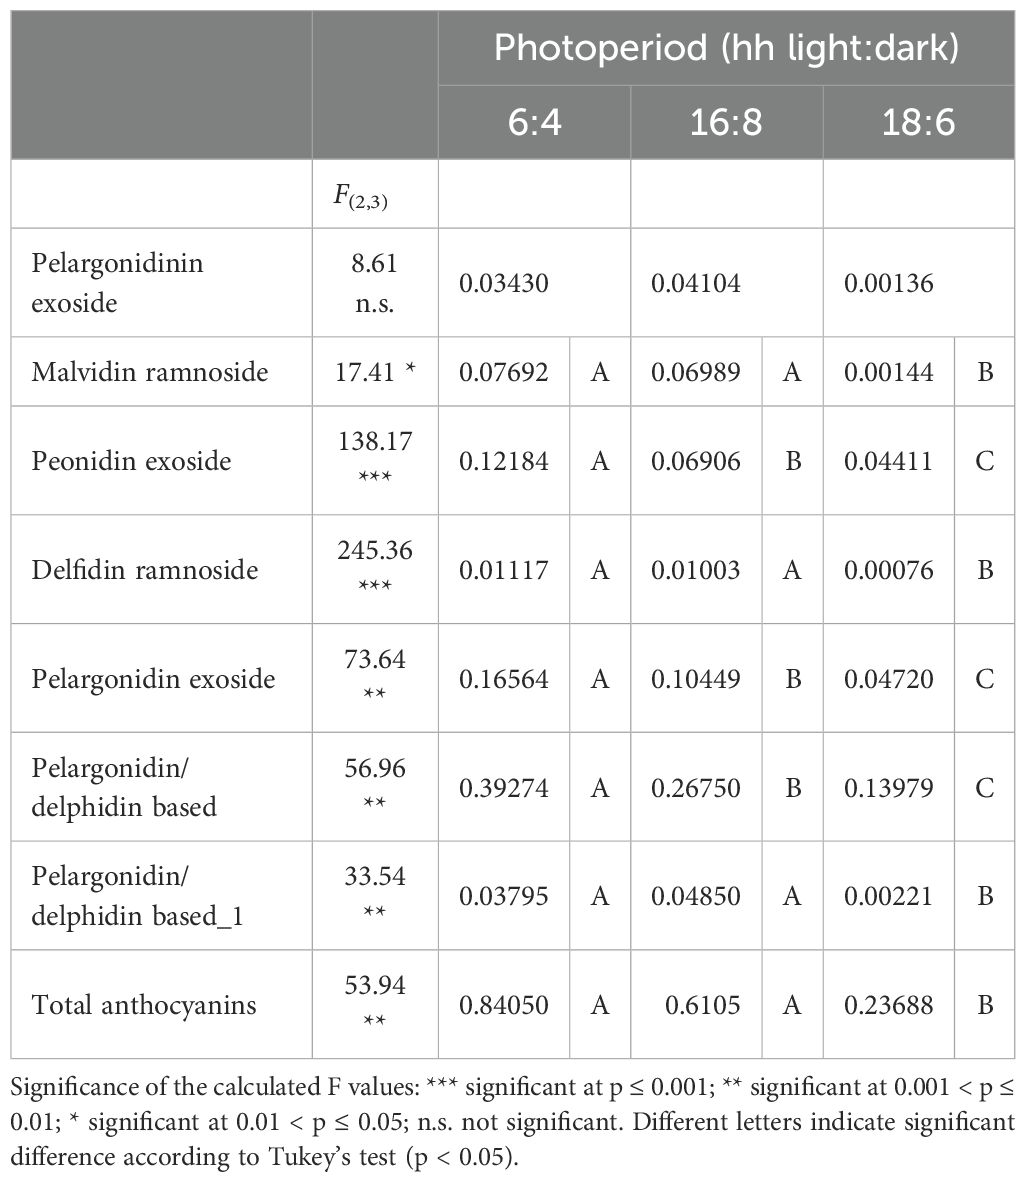
Table 5. Mean values (mg per g of plant dry matter) according to photoperiodic condition and results of the ANOVA for the major anthocyanins detected in O. basilicum var. Rosie.
Among the detected anthocyanins, the most abundant was A6 (pelargonidin/delphidin based), reaching 46.7%, 43.8%, and 59.0% of the total accumulated anthocyanins in the extract of Rosie basil leaves under 6:4, 16:8, and 18:6 photoperiodic conditions, respectively. As seen for the other secondary metabolites, also in this case a definite decrease can be observed from the 6:4 to the 18:6 photoperiodic conditions.
3.3 Results of multivariate analysis
The Principal Component Analysis (PCA), conducted on all detected secondary metabolites (VOCs, HCAs, and anthocyanins) across all genotypes and photoperiodic conditions, yielded the results illustrated in Figure 4. The first three principal components (PCs) cumulatively explained 75% of the total experimental variance (Table 6). The contribution of each variable to the obtained PCs is reported in Supplementary Table S3 (Supplementary Material).
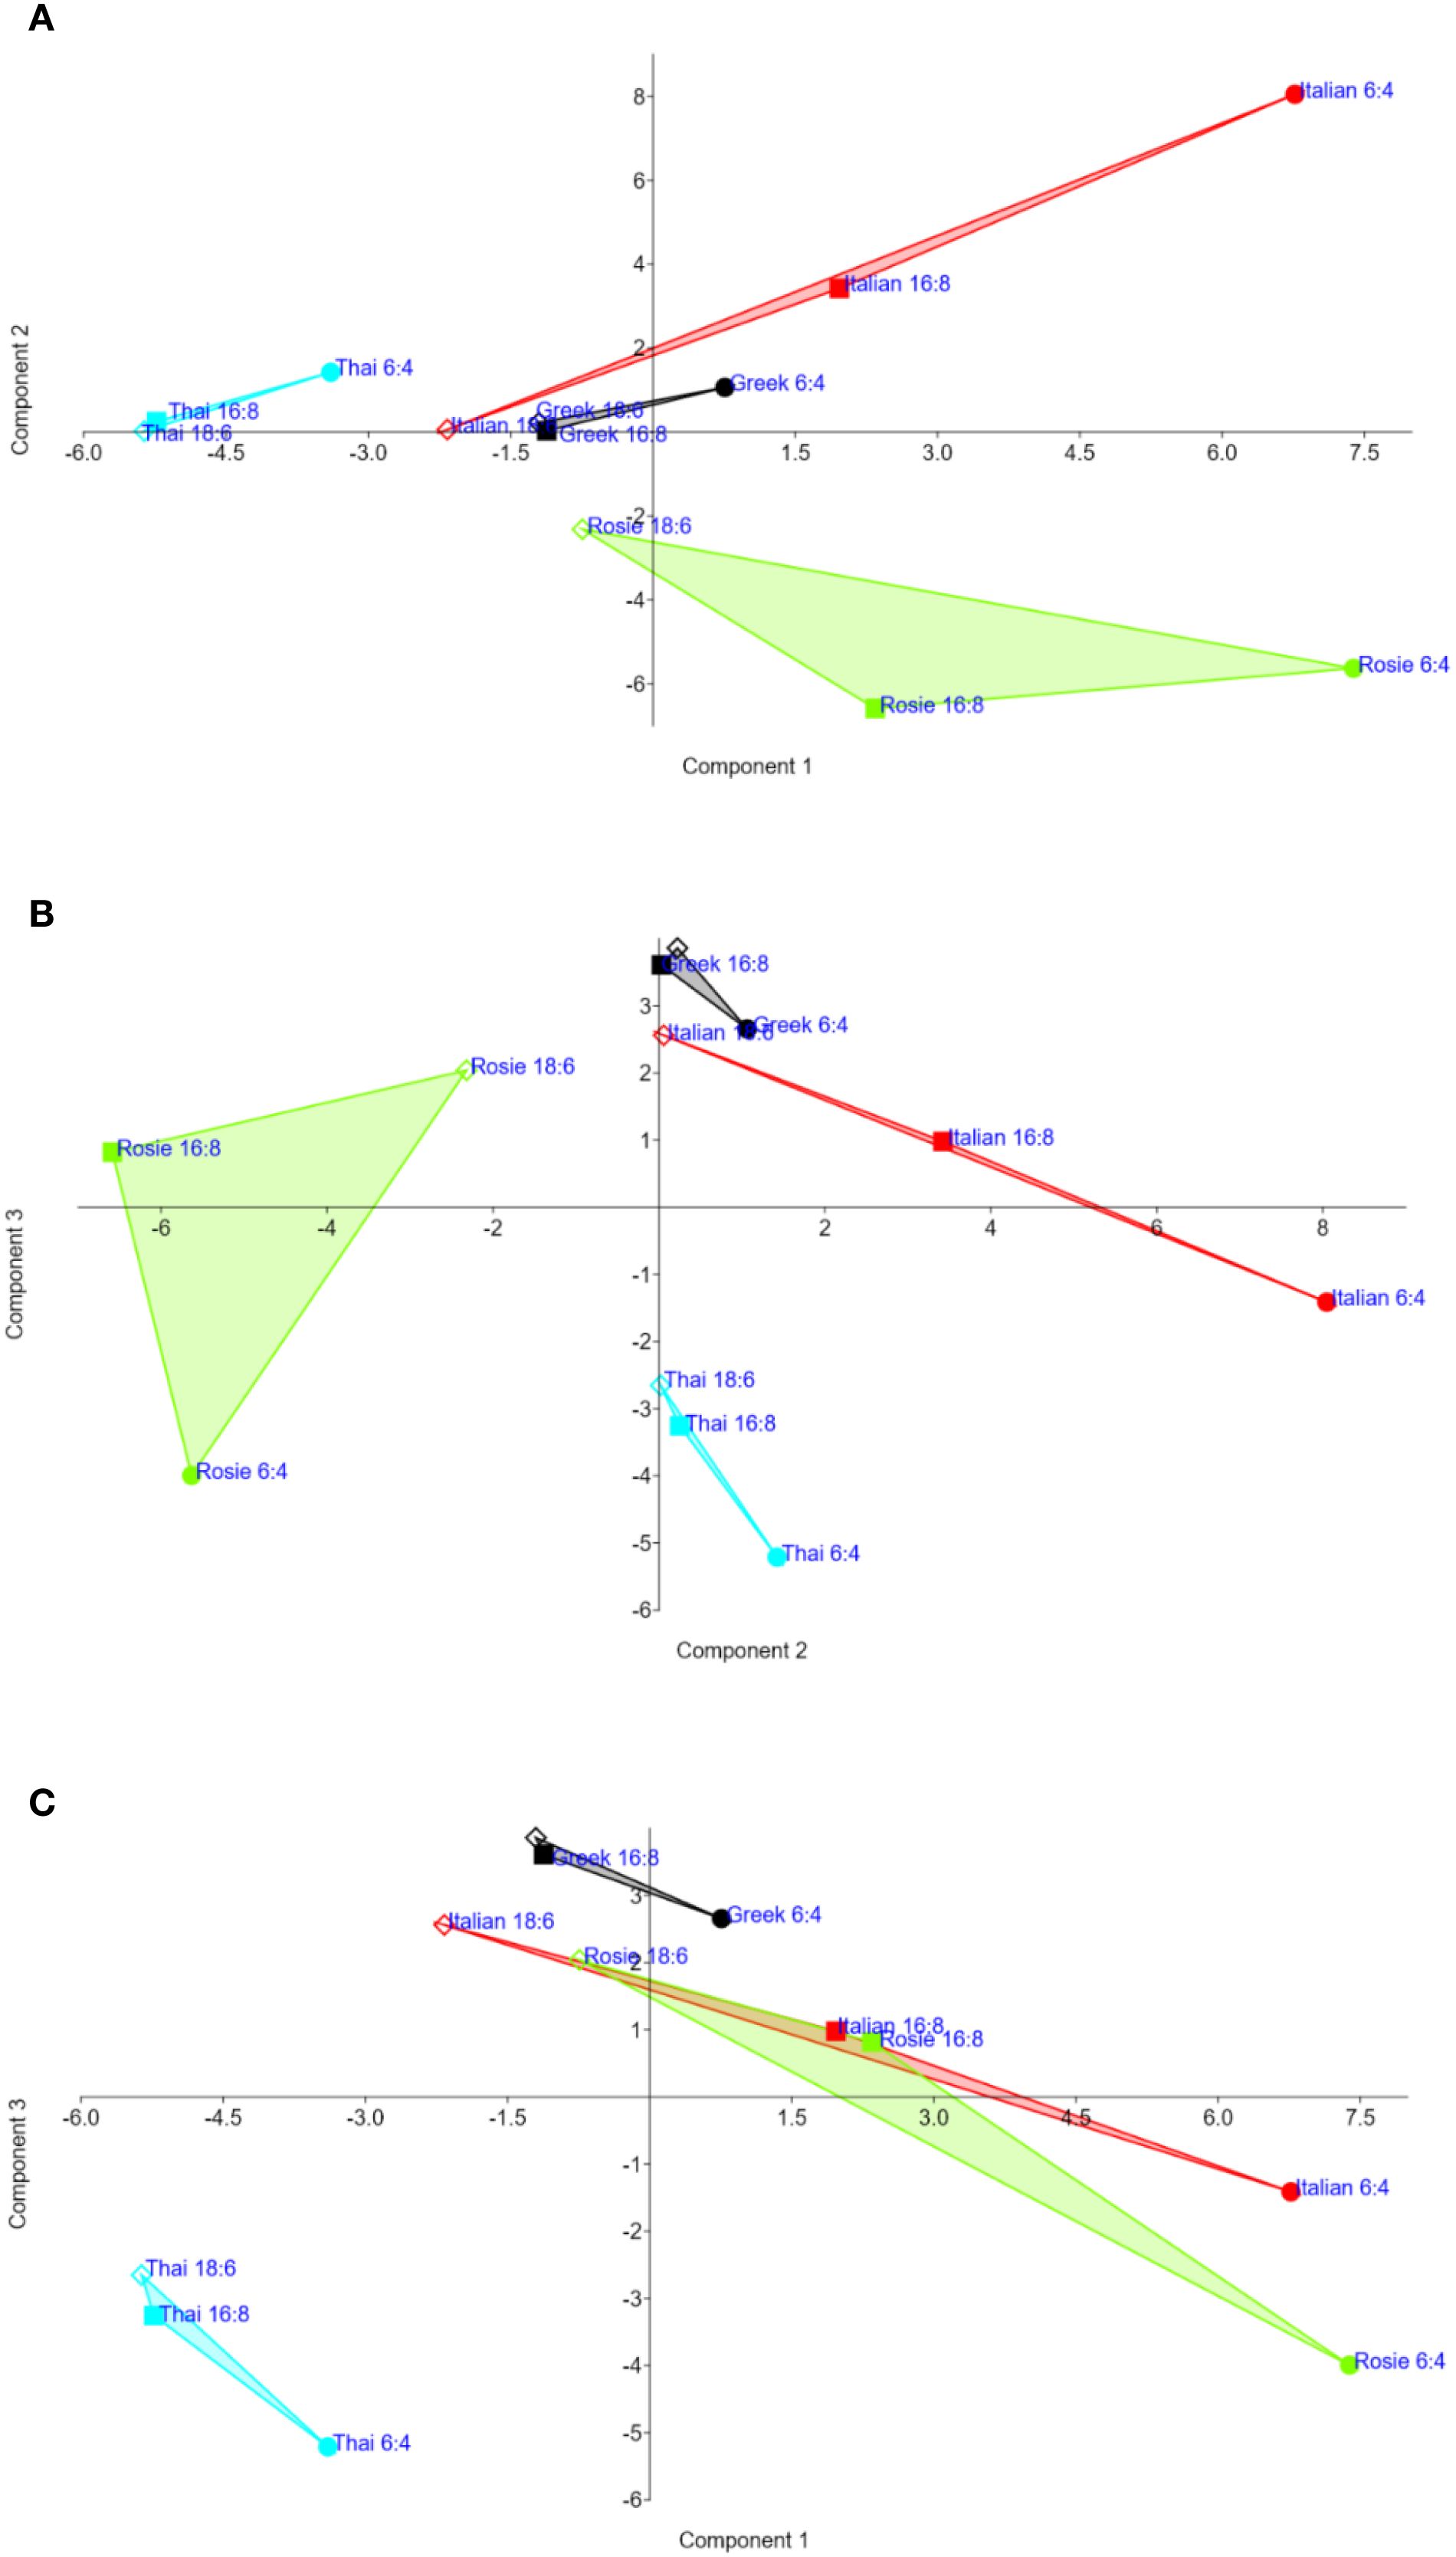
Figure 4. PCA scatterplots on the first three PCs (A: PC1, PC2; B: PC1, PC3; C: PC2, PC3) based on all secondary metabolites (polyphenols and VOCs) detected in four O. basilicum genotypes grown under three photoperiodic conditions. Clustering of genotypes and photoperiodic conditions distinctly separated the Italian genotype under the 6:4 hh (light/dark) photoperiod, which exhibited higher-than-average concentrations of total polyphenols (including rosmarinic, caffeic and chicoric acids) and, to a lesser extent, caffeoyl derivatives, coumaroyl derivatives, and feruloyl quinic acids. The other two treatments for the Italian genotype appeared far apart in the dendrogram.
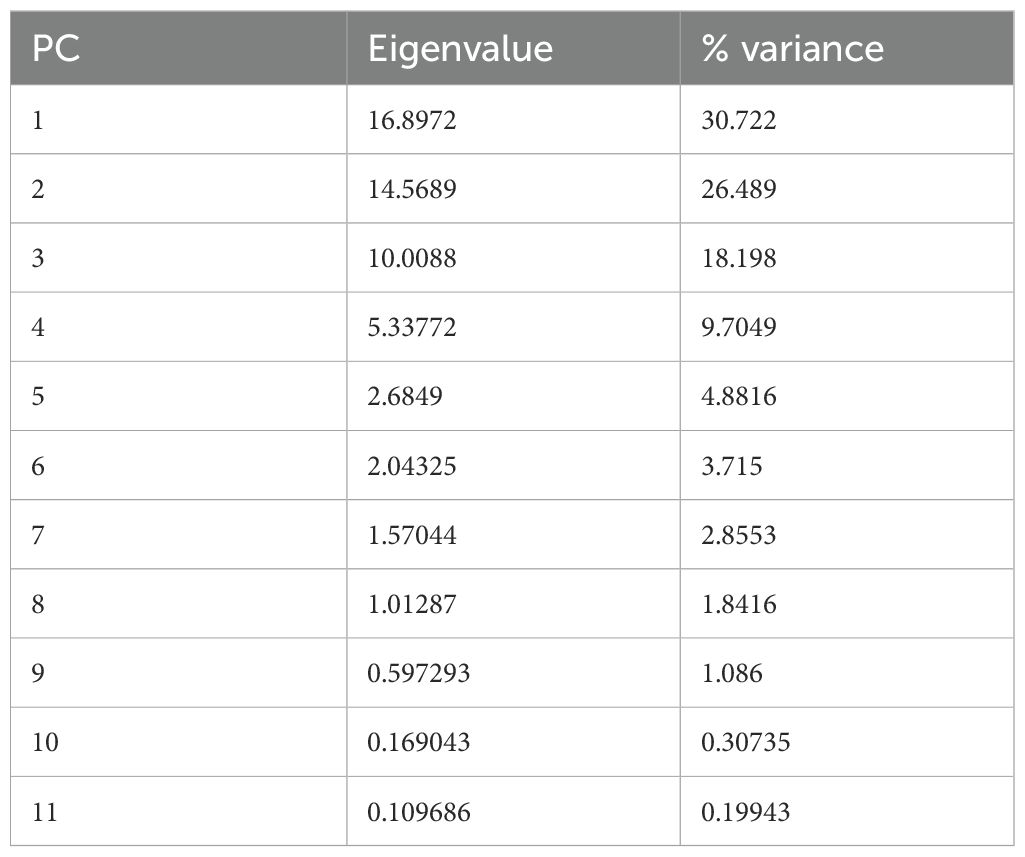
Table 6. Eigenvalues and percentage of explained variance for the 11 PCs obtained in the PCA.
Overall, the first two PCs appear to be more strongly associated with the content of polyphenol content in the basil extracts, whereas the third PC is more closely linked to flavor-related characteristics. The first PC (Figures 4A, B) was positively associated with the total concentration of detected metabolites, particularly the most abundant compounds such as rosmarinic acid, chicoric acid, caffeic acid, and caffeoyl derivatives. In contrast, a negative association was observed between PC1 and two VOCs: estragole and β-thujene.
The second PC (Figures 4A, C) was partially associated with the same compounds that contributed to PC1 (i.e., total metabolite content and major HCA such as rosmarinic, chicoric, and caffeic acids). However, it also showed significant associations with feruloyl quinic acids, coumaroyl caffeoyl C-hexosides, and several coumaroyl derivatives. PC2 was negatively associated with anthocyanin content and, among the VOCs, with 3-hexenol, linalool, fenchone, and camphor.
The third PC was positively associated with nearly all measured VOCs (including camphene, α- and β-pinene, eucalyptol, and germacrene D), and negatively associated with most of the detected metabolites, notably feruloyl glucose and certain caffeoyl derivatives.
The PCA effectively discriminated the genotypes: Thai (clearly separated along PC1) and Rosie (well distinguished along PC2), whereas the Greek and Italian genotypes were more distinctly represented on PC3. Within genotypes, the first two PCs allowed distinction among photoperiodic treatments, with the sequence 6:4>16:8>18:6 generally corresponding to increasing values of PC1 and PC2.
The clustered heatmap (Figure 5), generated using all measured secondary metabolites (including polyphenols and VOCs), corroborates the PCA findings in terms of variable and sample grouping. Clustering of variables revealed four distinct groups:
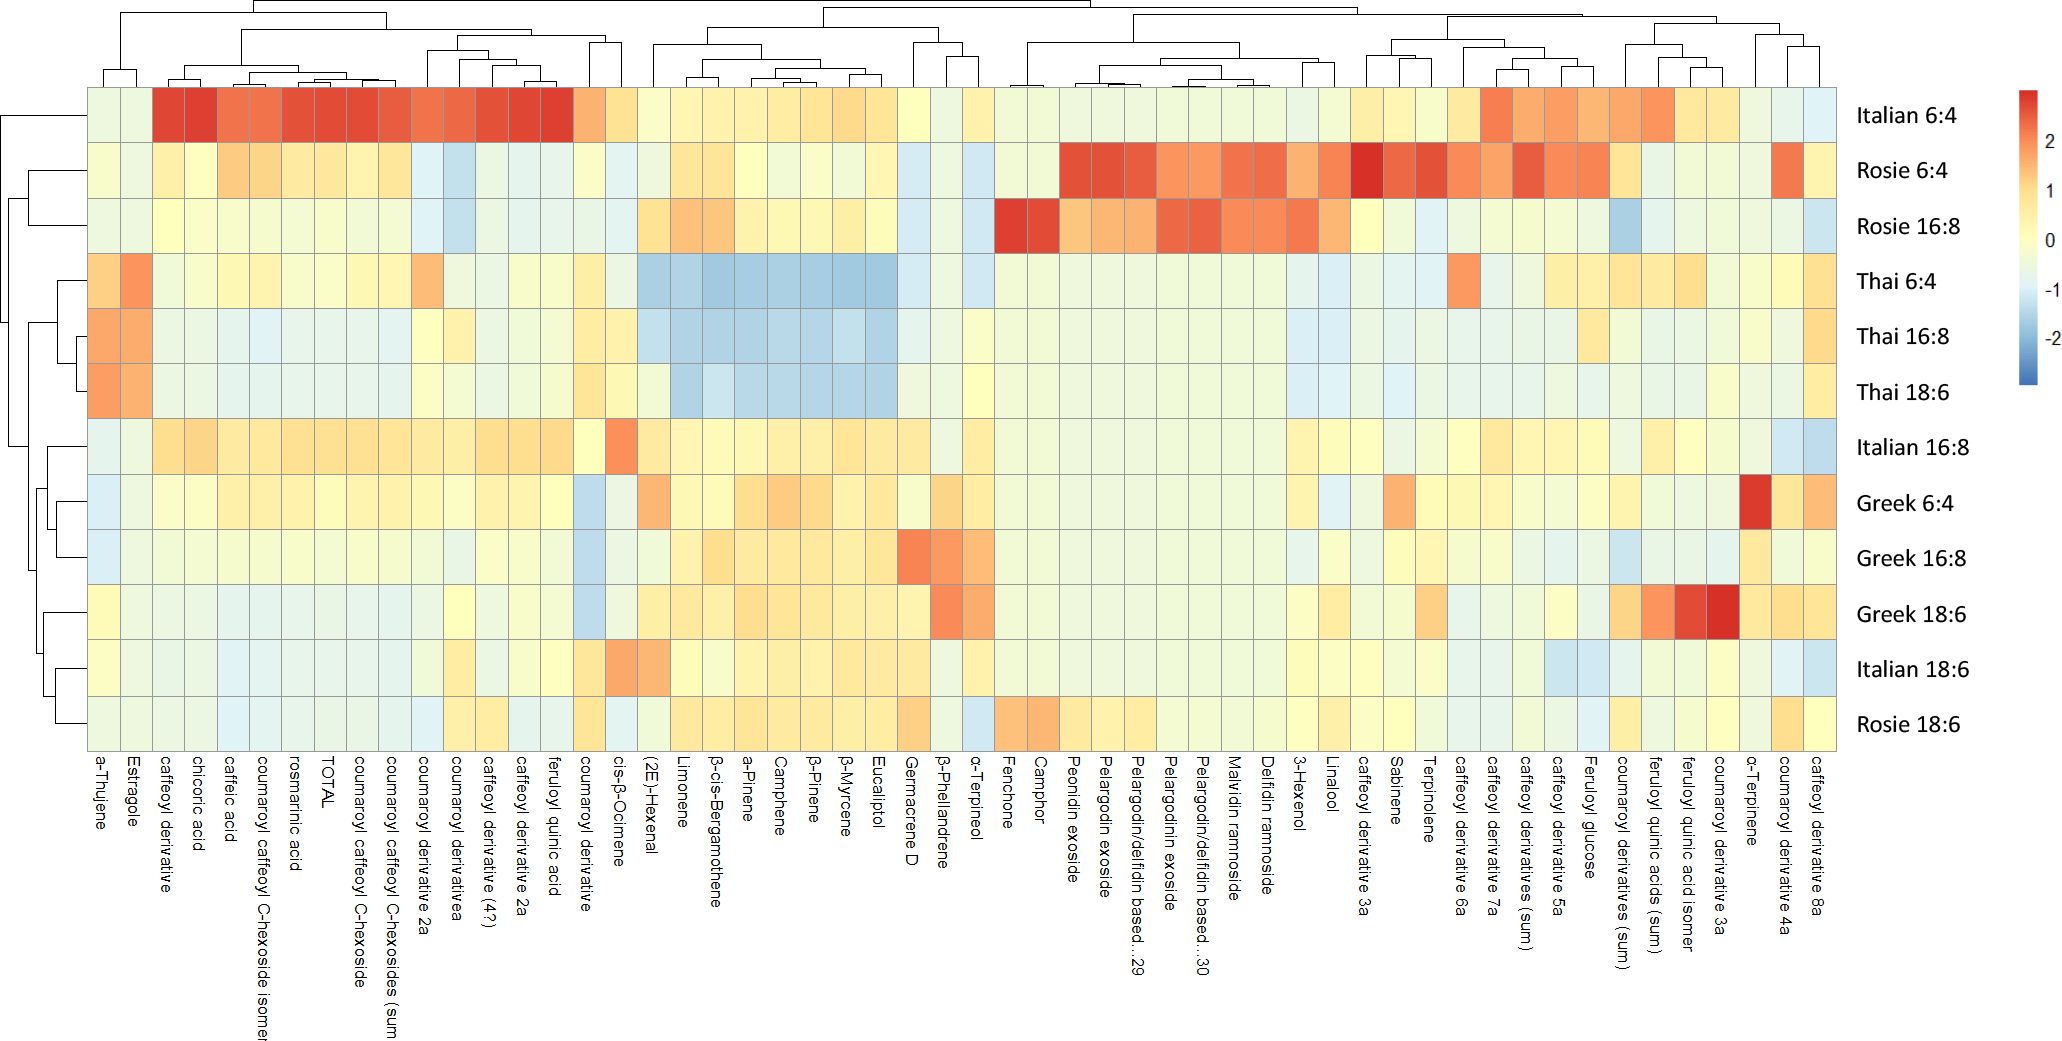
Figure 5. Clustered heatmap of all detected metabolites (polyphenols and VOCs) in four genotypes of O. basilicum grown under three photoperiodic conditions.
1. Cluster I: total polyphenols, including the most abundant compounds (rosmarinic, caffeic, and chicoric acids), and two VOCs (estragole and α-thujene).
2. Cluster II: the majority of VOCs, ranging from (2)-E-hexenal to eucalyptol, excluding estragole and α-thujene (assigned to the cluster I), fenchone, camphor, 3-hexenol, and linalool (assigned to cluster III), and sabinene, terpinolene and γ-terpinene (assigned to the cluster IV).
3. Cluster III: all anthocyanins, along with four VOCs (fenchone, camphor, linalool and 3-hexenol).
4. Cluster IV: several caffeoyl and coumaroyl derivatives, as well as sabinene, terpinolene and γ-terpinene.
In the Rosie genotype under 6:4 and 16:8 photoperiods, high anthocyanin content explained their clustering. In contrast, under the 18:6 photoperiod, Rosie showed a distinct metabolic profile, characterized by reduced anthocyanin accumulation.
The three Thai treatments clustered closely, sharing a general trend of lower-than-average VOC levels (e.g., α-/β-pinene, eucalyptol, limonene, germacrene D), but higher levels of α-thujene and estragole.
The three Greek treatments also clustered together, characterized primarily by low values of coumaroyl derivative and slightly elevated levels of the major VOCs.
4 Discussion
Our findings demonstrate the significant influence of photoperiodic regimes on the phytochemical profiles of different Ocimum basilicum genotypes, highlighting the potential of light modulation as a key tool in controlled-environment agriculture for “phytochemical fine-tuning”. The observed variations in the accumulation of secondary metabolites, particularly polyphenols and anthocyanins, across genotypes and photoperiods, underscore the complex interplay between genotype-specific metabolic pathways and environmental stimuli. The pronounced decrease in the total content of caffeoyl derivatives and anthocyanins with longer light exposure is a crucial finding of this study. This trend, evident across all genotypes, suggests a direct link between extended photoperiods and reduced biosynthesis or enhanced degradation of these compounds. As suggested by the multivariate analysis, this is particularly notable in the Italian genotype, which exhibited a substantial drop in caffeic, chicoric, and rosmarinic acids as the light period increased from a cyclic 6:4 to a continuous 18:6 hours, giving evidence of significantly different metabolic responses under varying light regimes. These three metabolites represent approximately 80% of the total extract content, corroborating literature reports about basil composition (Lee and Scagel, 2009; Strazzer et al., 2011). Their high accumulation has been associated with a quality factor in the growth of this plant. Similarly, the anthocyanin content in the Rosie genotype significantly decreased with prolonged light exposure (Fernandes et al., 2019). This response can be interpreted as a classic plant defense mechanism. Plants grown under more stressful, shorter photoperiods (like the 6:4 h cycle) may upregulate the phenylpropanoid pathway to produce higher concentrations of these antioxidants as a protective measure against oxidative stress. This is a common response, as reported in the literature. Conversely, under longer, less stressful light exposures, the plant may allocate more resources to primary metabolism (e.g., growth), down-regulating the synthesis of certain secondary metabolites (D’Aquino et al., 2024; Puccinelli et al., 2025; Frąszczak et al., 2011). It is important to underline that the effects of shorter photoperiods on secondary metabolite accumulation are not consistent across plant species. While our findings on basil, consistent with previous reports, suggest that reduced photoperiods can enhance the biosynthesis of phenolic compounds and anthocyanins, other studies have shown contrasting outcomes. For instance, in lettuce and spinach, shorter light exposures did not lead to a significant increase in phenolic content, or even resulted in a reduction, depending on the interaction with light intensity and spectral quality (Lefsrud et al., 2008; Dou et al., 2017). These discrepancies indicate that the influence of photoperiod is strongly species- and condition-dependent, and that its impact on secondary metabolism should be interpreted within the broader framework of genotype, light spectrum, and overall growth environment. The high accumulation of these hydroxycinnamic acids has been widely associated with quality and health-promoting properties in basil (Lee and Scagel, 2009). Regarding the volatile organic compounds (VOCs), our static headspace analysis revealed a clear genotype-dependent profile (Rusu et al., 2021). The Thai genotype was consistently dominated by estragole, aligning with previous reports on essential oils from this specific chemotype (Łyczko et al., 2020). In contrast, the Italian, Greek, and Rosie genotypes were characterized by a high abundance of eucalyptol. This observation, while consistent within our experimental design, contrasts with some literature reports that identify linalool as the dominant compound in Italian (Genoese) basil (Mulugeta et al., 2024) and in O. basilicum var. purpurascens (Mondello et al., 2002), with concentrations reaching over 50% and 29.7%, respectively. In contrast, geranyl acetate was found to be predominant (>60%) in Greek basil (Özcan and Chalchat, 2002). As noted in similar studies (Jiang et al., 2024; Klimánková et al., 2008), significant variations in the type and quantity of VOCs detected by different methods are common. This discrepancy underscores the critical impact of the analytical methodology. Our use of static headspace (HS) analysis provides a profile of the volatile compounds released from fresh tissue, which is often distinct from the composition of essential oils obtained through more aggressive methods like distillation. In fact, while oxidative processes and thermal degradation during distillation may contribute to the observed differences, the intrinsic physiology of VOC release, involving their passage through cell structures and stomata, can also lead to selective emission patterns distinct from the compounds stored in the tissues (Klimánková et al., 2008; Dudareva et al., 2013). Therefore, the HS-GC/MS method, while not directly comparable to essential oil data, offers a rapid and reliable means to assess the actual aroma profile of fresh basil genotypes, which is crucial for the “ready-to-eat” and high-end gastronomy markets. The consistent genotypic differences in VOC profiles, alongside the photoperiod-induced changes in non-volatile compounds, provide a strong foundation for future studies aiming to precisely manipulate the aromatic and functional properties of basil. In essence, our study confirms that photoperiod modulation is a powerful, non-invasive stressor that can be leveraged to steer metabolic outcomes in a genotype-specific manner. This approach presents a viable model for the development of sustainable, high-tech indoor systems capable of delivering fresh herbs with tailored functional properties, thus supporting the core tenets of precision agriculture and the ‘farm-to-table’ movement. Finally, preliminary cost estimations performed in parallel with this study, as reported in Supplementary Table S4, indicate that the average production cost of fresh basil in controlled-environment systems ranges between €0.018 and €0.022 per gram, with electricity representing the main cost driver. By comparison, local retail prices of fresh basil in Sicily range from approximately €0.0015 to €0.066 per gram, depending on packaging and point of sale (Mister Natura, 2025; Despar Sicilia, 2025). These figures highlight that, while the absolute costs of indoor cultivation remain higher than open-field production, controlled-environment systems offer the advantage of delivering consistent year-round tissue quality and functional properties, supporting their potential economic competitiveness in premium markets. While higher initial investments in technology are required, precision agriculture practices, such as optimized lighting schedules, sensor-based fertigation, and automated climate control, can enhance sustainability by lowering energy and water use and reducing nutrient dispersion. Moreover, the use of climate-controlled chambers ensures the year-round production of fresh, ‘ready-to-eat’ basil of consistent quality, independent of seasonal variability.
5 Conclusions
The accumulation of secondary metabolites (HCA and anthocyanins) was highest in the Italian genotype. Our experimental setup highlighted the importance of the optimal photoperiod for cultivating basil in hydroponic mini-greenhouses, achieving edible plants with high levels of secondary metabolites such as VOCs and HCAs. The versatility of photoperiod modulation as a controlled abiotic stress strategy enhances metabolite accumulation. The significant impact of light exposure on chemical composition and aroma underscores its potential for nutraceutical and commercial applications, delivering high-quality “ready-to-eat” basil with consistent quality. The hydroponic climate-controlled setup used not only enhances the biosynthesis of valuable secondary metabolites but also serves as a versatile model applicable to other crop species. This approach supports year-round availability of high-quality basil tissues with low environmental impact, aligning with the principles of precision agriculture and promoting sustainable and resilient food systems. Its adaptability to diverse contexts, from large-scale farming to domestic and gastronomic environments, demonstrates the potential to provide fresh, aromatic herbs throughout the year, fostering a genuine farm-to-table experience. The integration of HPLC-UV and GC-MS as analytical tools strengthens this approach, enabling precise qualitative and quantitative analysis of specialized metabolites under induced abiotic stress. Importantly, preliminary cost estimations performed in parallel with the study indicate an average production cost of €0.018–0.022 per gram of fresh basil in climate-controlled systems. In comparison, local retail prices of field-grown basil in Sicily typically range between €0.0015 and €0.066 per gram, depending on packaging and distribution channel (Mister Natura, 2025; Despar Sicilia, 2025). While the production cost of indoor systems is therefore higher, their scalability, year-round availability, and consistency in tissue quality highlight their potential competitiveness in premium markets. In conclusion, this study demonstrates that photoperiod modulation represents a practical and effective strategy to steer the phytochemical profile of basil in controlled environments, ensuring year-round production of fresh, high-quality tissues with consistent nutritional and aromatic properties.
Data availability statement
The original contributions presented in the study are included in the article/Supplementary Material. Further inquiries can be directed to the corresponding author.
Author contributions
LP: Conceptualization, Data curation, Formal analysis, Funding acquisition, Investigation, Methodology, Project administration, Resources, Software, Supervision, Validation, Visualization, Writing – original draft, Writing – review & editing. TF: Data curation, Investigation, Methodology, Writing – review & editing. TS: Formal analysis, Methodology, Writing – review & editing. FZ: Formal analysis, Investigation, Methodology, Validation, Writing – review & editing. SI: Formal analysis, Methodology, Writing – review & editing. CC: Formal analysis, Methodology, Writing – review & editing. RM: Data curation, Investigation, Methodology, Supervision, Writing – review & editing. ND: Data curation, Funding acquisition, Investigation, Methodology, Supervision, Writing – review & editing. AB: Investigation, Supervision, Writing – review & editing. AC: Data curation, Investigation, Methodology, Software, Validation, Writing – original draft, Writing – review & editing. EN: Data curation, Formal analysis, Investigation, Methodology, Supervision, Writing – original draft, Writing – review & editing, Validation.
Funding
The author(s) declare financial support was received for the research and/or publication of this article. This work was financially supported by the PNRR project, Mission 4 project “Education and Research”- Investment Line 1.5, funded by the EU - “Next Generation EU”, D.D. MUR No. 1059 of 23/06/2022 “Sicilian MicronanoTech Research and Innovation Center - SAMOTHRACE (CUP: B63C22000620005). This research was also funded the by Italian Ministry for University and Research (MUR), PRIN2020, Project 2020AEX4TA “Natural products-assisted organic synthesis”.
Acknowledgments
The authors are grateful to Dr Francesco Mugheddu and Mr Antonio Greco for technical assistance. Thanks are also due to the Tomato+ (https://www.tomatopiu.com) company for providing hydroponic climate cabin and pods used in this work.
Conflict of interest
The authors declare that the research was conducted in the absence of any commercial or financial relationships that could be construed as a potential conflict of interest.
Generative AI statement
The author(s) declare that no Generative AI was used in the creation of this manuscript.
Any alternative text (alt text) provided alongside figures in this article has been generated by Frontiers with the support of artificial intelligence and reasonable efforts have been made to ensure accuracy, including review by the authors wherever possible. If you identify any issues, please contact us.
Publisher’s note
All claims expressed in this article are solely those of the authors and do not necessarily represent those of their affiliated organizations, or those of the publisher, the editors and the reviewers. Any product that may be evaluated in this article, or claim that may be made by its manufacturer, is not guaranteed or endorsed by the publisher.
Supplementary material
The Supplementary Material for this article can be found online at: https://www.frontiersin.org/articles/10.3389/fagro.2025.1653993/full#supplementary-material.
Abbreviations
HCA hydroxy cinnamic acid; A anthocyanin; VOC volatile organic compound; HS headspace; GC gas chromatography; HPLC high-performance Liquid Chromatography; UPLC/ESI/MS ultra high-performance liquid chromatography-electrospray ionization-mass spectrometry; MS mass Spectrometry.
References
Adams R. P. (2007). Identification of essential oil components by gas chromatography/mass spectrometry. 4th Edition (Carol Stream: Allured Publ.). Available online at: www.jiniperus.org.
Adefegha S. A. (2018). Functional foods and nutraceuticals as dietary intervention in chronic diseases; novel perspectives for health promotion and disease prevention. J. Diet Suppl. 15, 977–1009. doi: 10.1080/19390211.2017.1401573
Al-Huqail A., El-Dakak R. M., Sanad M. N., Badr R. H., Ibrahim M. M., Soliman D., et al. (2020). Effects of climate temperature and water stress on plant growth and accumulation of antioxidant compounds in sweet basil (Ocimum basilicum L.) leafy vegetable. Scientifica (Cairo) 2020, 1–12. doi: 10.1155/2020/3808909
Avgoustaki D. D. (2019). Optimization of photoperiod and quality assessment of basil plants grown in a small-scale indoor cultivation system for reduction of energy demand. Energies (Basel) 12, 3980. doi: 10.3390/en12203980
Coucquyt P., Lahousse B., and Langenbick J. (2020). The art and sciences of foodpairing: 10,000 flavor matches that will transform the way you eat (London,UK: Octopus Publ).
D’Aquino L., Cozzolino R., Malorni L., Bodhuin T., Gambale E., Sighicelli M., et al. (2024). Light flux density and photoperiod affect growth and secondary metabolism in fully expanded basil plants. Foods 13, 2273. doi: 10.3390/foods13142273
Despar Sicilia (2025). Fresh basil price, 15–20 g tray. Available online at: https://www.desparsicilia.it.
Dou H., Niu G., Gu M., and Masabni J. G. (2017). Responses of sweet basil to different daily light integrals in photosynthesis, morphology, yield, and nutritional quality. HortScience 52, 496–503. doi: 10.21273/HORTSCI12785-17
Dudareva N., Klempien A., Muhlemann J. K., and Kaplan I. (2013). Biosynthesis, function and metabolic engineering of plant volatile organic compounds. New Phytol. 198, 16–32. doi: 10.1111/nph.12145
El-Beshbishy H. and Bahashwan S. (2012). Hypoglycemic effect of basil (Ocimum basilicum) aqueous extract is mediated through inhibition of α-glucosidase and α-amylase activities. Toxicol. Ind. Health 28, 42–50. doi: 10.1177/0748233711403193
Fernandes F., Pereira E., Círić A., Soković M., Calhelha R. C., Barros L., et al. (2019). Ocimum basilicum var. purpurascens leaves (red rubin basil): a source of bioactive compounds and natural pigments for the food industry. Food Funct. 10, 3161–3171. doi: 10.1039/C9FO00578A
Filip S. (2017). Basil (Ocimum basilicum L.) a source of valuable phytonutrients. Int. J. Clin. Nutr. Dietetics 3, 118–123. doi: 10.15344/2456-8171/2017/118
Frąszczak B., Kałużewicz A., Krzesiński W., Lisiecka J., and Spiżewski T. (2011). Effect of differential temperature and photoperiod on growth of Ocimum basilicum. Žemdirbystė=Agriculture. 98 (4), 375–382.
Giachino R. R. A., Sönmez Ç., Tonk F. A., Bayram E., Yüce S., Telci I., et al. (2014). RAPD and essential oil characterization of Turkish basil (Ocimum basilicum L.). Plant Syst. Evol. 300 (8). doi: 10.1007/s00606-014-1005-0
Gomez K. A. and Gomez A. A. (1984). Statistical procedures for agricultural research (Hoboken, NJ, USA: John Wiley & sons).
Hammer Ø. and Harper D. A. T. (2001). Past: paleontological statistics software package for education and data analysis. Palaeontologia electronica 4, 1. Available online at: http://palaeo-electronica.org/2001_1/past/issue1_01.htm (Accessed September 23, 2025).
Harborne J. B. (1973). “Phenolic compounds,” in Phytochemical methods (Springer, Dordrecht). doi: 10.1007/978-94-009-5921-7_2
Jakovljević D., Stanković M., Warchoł M., and Skrzypek E. (2022). Basil (Ocimum L.) cell and organ culture for the secondary metabolites production: a review. Plant Cell Tissue Organ Culture (PCTOC) 149, 61–79. doi: 10.1007/s11240-022-02286-5
Jiang R., Liu J., Liu Q., Jin Z., Zhu H., Han H., et al. (2024). Comparative analysis of volatile components and sensory profiles of four basil varieties based on HS-SPME and SD coupled with GC-MS. Processes 12, 2789. doi: 10.3390/pr12122789
Kadan S., Saad B., Sasson Y., and Zaid H. (2016). In vitro evaluation of anti-diabetic activity and cytotoxicity of chemically analyzed Ocimum basilicum extracts. Food Chem. 196, 1066–1074. doi: 10.1016/j.foodchem.2015.10.044
Klimánková E., Holadová K., Hajšlová J., Čajka T., Poustka J., and Koudela M. (2008). Aroma profiles of five basil (Ocimum basilicum L.) cultivars grown under conventional and organic conditions. Food Chem. 107, 464–472. doi: 10.1016/j.foodchem.2007.07.062
Lee J. and Scagel C. F. (2009). Chicoric acid found in basil (Ocimum basilicum L.) leaves. Food Chem. 115, 650–656. doi: 10.1016/j.foodchem.2008.12.075
Lefsrud M. G., Kopsell D. A., Kopsell D. E., and Curran-Celentano J. (2008). Irradiance levels affect growth parameters and carotenoid pigments in kale and spinach grown in a controlled environment. Physiologia Plantarum 133, 611–621. doi: 10.1111/j.1399-3054.2006.00692.x
Łyczko J., Masztalerz K., Lipan L., Lech K., Carbonell-BarraChina Á.A., and Szumny A. (2020). Chemical determinants of dried Thai basil (O. basilicum var. thyrsiflora) aroma quality. Ind. Crops Products 155, 112769. doi: 10.1016/j.indcrop.2020.112769
Mister Natura (2025). Fresh basil price, 30 g package. Available online at: https://www.misternatura.it.
Mondello L., Zappia G., Cotroneo A., Bonaccorsi I., Chowdhury J. U., Yusuf M., et al. (2002). Studies on the essential oil-bearing plants of Bangladesh. Part VIII. Composition of some Ocimum oils O. basilicum L. var. purpurascens; O. sanctum L. green; O. sanctum L. purple; O. americanum L., citral type; O. americanum L., camphor type. Flavor Fragr. J. 17, 335–340. doi: 10.1002/ffj.1108
Mulugeta M., Gosztola B., and Radácsi P. (2024). Diversity in morphology and bioactive compounds among selected Ocimum species. Biochem. Systematics Ecol. 114, 104826. doi: 10.1016/j.bse.2024.104826
Özcan M. and Chalchat J.-C. (2002). Essential Oil Composition of Ocimum basilicum L. and Ocimum minimum L. @ in Turkey. Czech J. Food Sci. 20, 223–228.
Phippen W. B. and Simon J. E. (1998). Anthocyanins in basil (Ocimum basilicum L.). J. Agric. Food Chem. 46, 1734–1738. doi: 10.1021/jf970887r
Puccinelli M., Maggini R., Pardossi A., and Incrocci L. (2025). Continuous lighting improves the leaf quality of sweet basil (Ocimum basilicum L.) grown in a controlled environment. Adv. Hortic. Sci. 39, 21–30. doi: 10.36253/ahsc-16590
Pulvirenti L. and Paterna A. (2022). “Introduction to functional foods and nutraceuticals,” in Advances in nutraceuticals and functional foods. Ed. Sreerag Gopi P. B., (Massachusetts, USA: Cambridge) 1–28.
Romano R., De Luca L., Aiello A., Pagano R., Di Pierro P., Pizzolongo F., et al. (2022). Basil (Ocimum basilicum L.) leaves as a source of bioactive compounds. Foods 11, 3212. doi: 10.3390/foods11203212
Ronga D., Pellati F., Brighenti V., Laudicella K., Laviano L., Fedailaine M., et al. (2018). Testing the influence of digestate from biogas on growth and volatile compounds of basil (Ocimum basilicum L.) and peppermint (Mentha x piperita L.) in hydroponics. J. Appl. Res. Med. Aromat Plants 11, 18–26. doi: 10.1016/j.jarmap.2018.08.001
Ruberto G., Spadaro A., Piattelli M., Piozzi F., and Passannanti S. (1991). Volatile flavor components of Ocimum basilicum var. hispidum (lam.) Chiov. Flavor Fragr J. 6, 225–227. doi: 10.1002/ffj.2730060312
Rusu T., Cowden R. J., Moraru P. I., Maxim M. A., and Ghaley B. B. (2021). Overview of multiple applications of basil species and cultivars and the effects of production environmental parameters on yields and secondary metabolites in hydroponic systems. Sustainability 13, 11332. doi: 10.3390/su132011332
Sharma A., Hazarika M., Heisnam P., Pandey H., Devadas V. A. S. N., Kesavan A. K., et al. (2024). Controlled environment ecosystem: A cutting-edge technology in speed breeding. ACS Omega 9, 29114–29138. doi: 10.1021/acsomega.3c09060
Skrubis B. and Markakis P. (1976). The effect of photoperiodism on the growth and the essential oil of Ocimum basilicum (Sweet Basil). Econ Bot. 30, 389–393. doi: 10.1007/BF02904661
Spence C. (2024). Sweet basil: An increasingly popular culinary herb. Int. J. Gastron Food Sci. 36, 100927. doi: 10.1016/j.ijgfs.2024.100927
Strazzer P., Guzzo F., and Levi M. (2011). Correlated accumulation of anthocyanins and rosmarinic acid in mechanically stressed red cell suspensions of basil (Ocimum basilicum). J. Plant Physiol. 168, 288–293. doi: 10.1016/j.jplph.2010.07.020
Keywords: basil leaves, light exposure dependent growth, HPLC-UV, head space, polyphenols
Citation: Pulvirenti L, Ferreri T, Strano T, Zappalà F, Infantino S, Caruso C, Morrone R, D’Antona N, Barbera AC, Carrubba A and Napoli E (2025) Effects of photoperiod on phytochemical profiles of four Ocimum basilicum genotypes in a hydroponic climate chamber. Front. Agron. 7:1653993. doi: 10.3389/fagro.2025.1653993
Received: 25 June 2025; Accepted: 15 September 2025;
Published: 02 October 2025.
Edited by:
Fabio Gresta, University of Messina, ItalyReviewed by:
Rita Maggini, University of Pisa, ItalyArlan James Rodeo, University of California, Davis, United States
Copyright © 2025 Pulvirenti, Ferreri, Strano, Zappalà, Infantino, Caruso, Morrone, D’Antona, Barbera, Carrubba and Napoli. This is an open-access article distributed under the terms of the Creative Commons Attribution License (CC BY). The use, distribution or reproduction in other forums is permitted, provided the original author(s) and the copyright owner(s) are credited and that the original publication in this journal is cited, in accordance with accepted academic practice. No use, distribution or reproduction is permitted which does not comply with these terms.
*Correspondence: Luana Pulvirenti, THVhbmEucHVsdmlyZW50aUBjbnIuaXQ=