 Michael A. Portelli1†
 Kamini Rakkar1*†
 Sile Hu2Yike Guo2
 Ian M. Adcock3 on behalf of the U-BIOPRED Study Group and
  Ian Sayers1
- 1Centre for Respiratory Research, Translational Medical Sciences, School of Medicine, National Institute for Health Research Nottingham Biomedical Research Centre, Nottingham University Biodiscovery Institute, University of Nottingham, Nottingham, United Kingdom
- 2Data Science Institute, Imperial College London, London, United Kingdom
- 3The National Heart and Lung Institute, Imperial College London, London, United Kingdom
Asthma affects more than 300 million people globally and is both under diagnosed and under treated. The most recent and largest genome-wide association study investigating moderate to severe asthma to date was carried out in 2019 and identified 25 independent signals. However, as new and in-depth downstream databases become available, the translational analysis of these signals into target genes and pathways is timely. In this study, unique (U-BIOPRED) and publicly available datasets (HaploReg, Open Target Genetics and GTEx) were investigated for the 25 GWAS signals to identify 37 candidate causal genes. Additional traits associated with these signals were identified through PheWAS using the UK Biobank resource, with asthma and eosinophilic traits amongst the strongest associated. Gene expression omnibus dataset examination identified 13 candidate genes with altered expression profiles in the airways and blood of asthmatic subjects, including MUC5AC and STAT6. Gene expression analysis through publicly available datasets highlighted lung tissue cell specific expression, with both MUC5AC and SLC22A4 genes showing enriched expression in ciliated cells. Gene enrichment pathway and interaction analysis highlighted the dominance of the HLA-DQA1/A2/B1/B2 gene cluster across many immunological diseases including asthma, type I diabetes, and rheumatoid arthritis. Interaction and prediction analyses found IL33 and IL18R1 to be key co-localization partners for other genes, predicted that CD274 forms co-expression relationships with 13 other genes, including the HLA-DQA1/A2/B1/B2 gene cluster and that MUC5AC and IL37 are co-expressed. Drug interaction analysis revealed that 11 of the candidate genes have an interaction with available therapeutics. This study provides significant insight into these GWAS signals in the context of cell expression, function, and disease relationship with the view of informing future research and drug development efforts for moderate-severe asthma.
Introduction
Asthma is one the of most predominant non-communicable diseases throughout the world. It accounts for over 400,000 deaths per year and by World Health Organization estimates, 24.8 million disability adjusted life years (DALYS) were attributable to Asthma in 2016 (1). Although there is no cure for asthma, most symptoms can be managed well with medication. However, patients with severe asthma, which represent ~4% of all patients, suffer from uncontrolled symptoms and frequent exacerbations despite medication (2).
Over the years, many genome and phenome wide association studies (GWAS, PheWAS) have been completed resulting in a large number of signals mainly via single nucleotide polymorphisms (SNPs) associated with asthma relevant traits (3–7), which have been reviewed in detail (8, 9). GWAS and PheWAS (10–12) have greatly advanced asthma research and translating these signals into candidate causal genes is the next step in moving to greater mechanistic understanding of asthma, therapeutic targets and pathways for investigation. However, many single SNPs are largely defined and generally mapped to the closest gene, regardless of whether the SNP has any effect on the function of that gene e.g., expression. This ignores the complexity of the 3D architecture of DNA which may result in SNPs linearly far away from a gene being closer than thought in the 3D structure and having a functional role (13). Indeed, it has been shown that over 90% of disease-linked variants are located in non-coding regions of the genome (14). Therefore, accurately determining causal genes is important for understanding the biology underlying GWAS and PheWAS signals, especially within respiratory relevant tissues and compartments, including the lung. An additional layer of complexity is the possibility of specific SNP-tissue interactions, where SNP-gene regulation may occur differently in different tissues and environments (15, 16).
In this study, we investigated the 25 signals (including four novel signals; rs11603634, rs1090584, rs10905284, and rs61816761) identified in the recent Moderate to Severe Asthma GWAS (7). We aimed to identify candidate causal genes from these signals and understand their association with asthma, highlighting potential targets for downstream investigation utilizing unique [Unbiased biomarkers for the prediction of respiratory disease outcomes (U-BIOPRED)] and publicly available datasets. We then investigated these genes via multiple gene enrichment and interaction analyses and gene expression analysis in the lung and in whole blood. This study represents a significant advance in our understanding of the mechanistic underpinnings of these signals and provides candidate genes and pathways for future drug development in moderate-severe asthma.
Materials and Methods
Signal to Trait Association Analysis—PheWAS Analysis From GeneATLAS UK Biobank Data
To investigate traits associated with the signals, 25 signals taken from the Moderate to Severe Asthma GWAS were individually searched for in the online GeneATLAS database (17) according to the risk allele. This database of associations between traits and variants uses the UK Biobank cohort (18). It has 778 traits and therefore with Bonferroni correction an adjusted P-value of 6.42 × 10⁻⁵ was used to determine significance. Proxies were used for the following signals which were not present in the database: rs61816761 (rs61816766, R2 = 0.50), rs367983479 (rs1504215, R2 = 0.85), rs71266076 (rs7824993, R2 = 0.81), rs7305461 (rs1131017, R2 = 0.75), rs112502960 (rs62076439, R2 = 1.0), rs61840192 (rs1031163, R2 = 1.0), rs560026225 (rs72687036, R2 = 0.66), and rs776111176 (rs3997872, R2 = 0.82). Displayed traits were selected and broadly grouped into asthma, blood/immune cell, allergic, other respiratory, other inflammatory, and auto-immune categories. An overview of the project pipeline is provided in Figure 1.
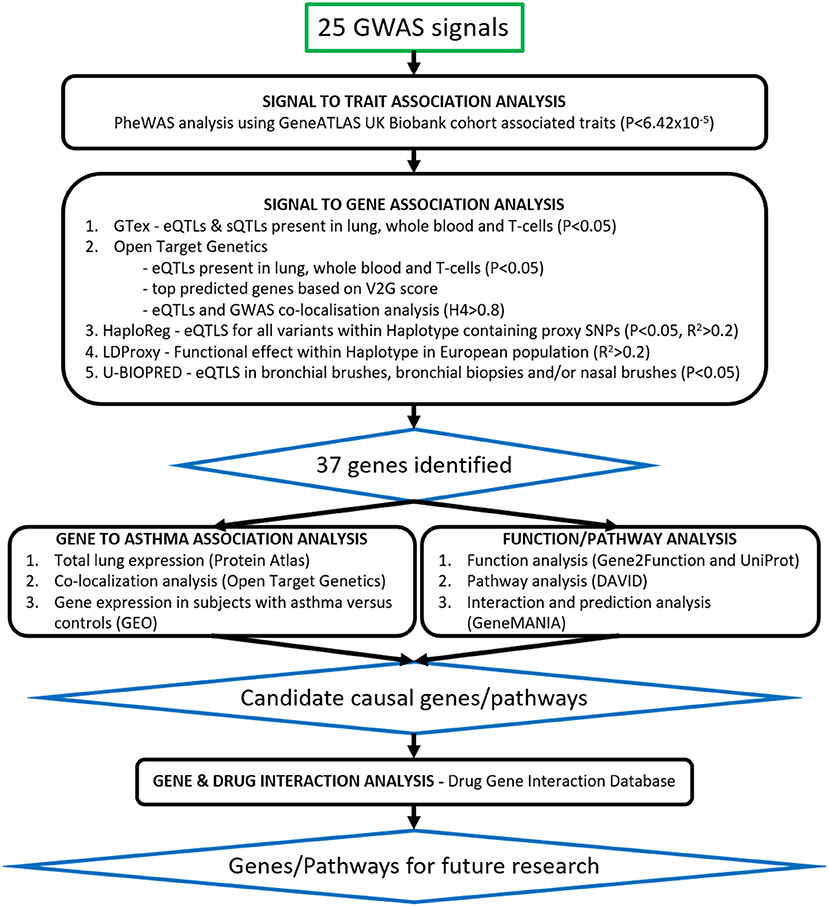
Figure 1. Translational analysis pipeline. Twenty-five signals from the Moderate to Severe Asthma GWAS were taken through signal to trait and signal to gene association analyses. Signals were searched for in publicly available databases such as GeneATLAS, PheWAS, Open Target Genetics, GTex, HaploReg and LDLink as well as our U-BIOPRED (UB) datasets of Bronchial Biopsies, Bronchial Brushes, and Nasal Brushes. Gene association was scored as per Table 3 and 37 genes were identified. Candidate causal genes were then searched for in gene expression datasets from subjects with asthma vs. controls and single-cell-RNA lung tissue datasets. Asthma related pathways and interactions between genes were identified using the DAVID Functional Annotation Tool and GeneMANIA prediction server and drug gene interactions were identified using the Drug Gene Interaction Database.
Signal to Gene Association Analysis
To determine likely signal to gene associations in lung tissue, T-cells and whole blood, we interrogated publicly available databases (GTEx V8, Open Target Genetics (OTG), HaploReg V4.1, LD Matrix 5.0), a unique dataset presenting expression quantitative trait loci (eQTLs) for bronchial epithelial brushes (n = 117), bronchial biopsies (n = 84), and nasal epithelial brushes (n = 75) (U-BIOPRED), as well as a general literature search for previously published associations. Using these datasets, we noted eQTLs [GTEx, OTG (19), HaploReg (20), U-BIOPRED], sQTLs (GTEx), variant 2 gene scores (OTG), Gene to eQTL localization (OTG), and tagged functional variation [LDLink (LDProxy) (21)] for the sentinel SNP reported for these signals in the original study or, in cases where the sentinel SNP was not covered, a proxy SNP. We used a corrected significance threshold of P < 0.05, as presented in each dataset, to identify eQTLs across all datasets, and a H4 > 0.8 threshold for the Gene to eQTL co-localization. Proxy SNPs were selected based on linkage disequilibrium R2 scores from the publicly available reference haplotypes for the EUR super population (CEU+GBR+TSI+FIN+IBS) from 1000_Phase 3 (Version 5) of the 1,000 Genomes Project accessed through LDLink, where the selected proxy was the SNP with the highest R2 value (minimum R2 = 0.2) that was present in the interrogated database.
Each signal to gene association identified was given a score point, with greater weighting given to U-BIOPRED eQTLs due to the specificity of the eQTLs to the respiratory related samples. This generated a total score, where genes scoring s ≥ 3 were selected for further downstream analysis. In cases where no genes achieved s ≥ 3 for a particular signal, the gene with the highest available score was selected. In the case of signal rs61816761, where all candidate genes scored below 3, FLG was selected as the most likely candidate causal gene due to existing literature (22, 23).
Gene Function and Disease Association Analysis
Gene function was determined using the Gene 2 Function (24) and UniProt (25) databases, and gene function and biological processes annotations were listed.
Total and Single Cell RNA Expression Analysis in Lung Tissue
To determine the candidate gene expression profile in lung tissue, the Human Protein Atlas (HPA, http://www.proteinatlas.org) resource was used (26). For total lung expression, normalized expression (NX) values were used. The HPA provides NX values through normalizing the average transcript per million (TPM) value of all individual lung samples from three transcriptomics datasets (HPA, GTEx, and FANTOM5). For single cell (sc) lung tissue gene expression, transcripts per million protein coding genes (pTPM) values were used. The HPA provides pTPM values through normalization of read counts from four lung tissue datasets (Single Cell Expression Atlas, the Human Cell Atlas, the Gene Expression Omnibus (GEO) and the European Genome-phenome Archive). Both NX and pTPM values were obtained for 36 candidate genes (FLG had no data available). log10(pTPM) values were used for the heatmap. Genes which showed enriched/enhanced expression for lung epithelial (blue bars) or blood/immune cells (red bars) were highlighted in the bar chart. Enriched/enhanced expression was determined by using the same scoring system as the HPA. Enriched/enhanced expression is defined by the HPA as having NX values at least four times of any other tissue/cell type from their full transcriptomics data of 37 tissues and 43 single cell types.
Co-localization Analysis of Tissue Gene Expression and the Reported Trait “Asthma”
To identify evidence linking gene expression across tissue/cell types with the asthma trait, the OTG portal was used. H4 scores for studies where asthma was the exclusive trait were obtained for the 37 candidate genes focusing on lung tissue and/or blood/immune cell types. Median H4 scores of all variants (signals) were plotted for each gene. Genes AAGAB, CD247, DEXI, FLG, GATA3, HLA-DQA1/A2, B2, IL33, KIF1A, KIAA1109, MSL1, MUC5AC, PGAP3, and ZBTB10 had no association data for lung/blood/immune cells/tissue and therefore have not been included in the analysis.
Differential mRNA Expression Analyses in Airway Epithelial Cells Isolated From Subjects With Asthma or Control Subjects
Genes which showed enriched epithelial expression in the HPA database and/or colocalization in lung tissue (median H4 > 0.8) were selected for further investigation to explore mRNA expression in bronchial epithelial cells isolated from subjects with asthma or control subjects. The freely available U-BIOPRED gene expression dataset, GSE43696, was used from the GEO resource (27), as it was the largest adult dataset available with a control group. The GSE43696 dataset comprises of Agilent Human GE 4×44K V2 Gene Expression data of bronchial epithelial cells for 20 control, 50 mild-moderate, and 38 severe asthma subjects (28, 29). In this dataset, mild-moderate asthma was defined as subjects having an FEV1 of >60% predicted, with/without low-moderate dose inhaled corticosteroids. Severe asthma was defined as subjects having severe refractory asthma, including the continuous use of high-dose inhaled corticosteroids and/or frequent use of oral corticosteroids with continuing symptoms and/or chronic airflow limitation. Control subjects had normal lung function, no history of respiratory disease or recent respiratory infection and no evidence of bronchial hyperresponsiveness. Expression values were plotted for each gene stratified by subject group. Data was statistically analyzed using a Kruskal-Wallis test with a two-stage linear step-up procedure of Benjamini, Krieger, and Yekutieli to control the FDR at 5%. P < 0.05 was considered significant.
Differential mRNA Expression Analyses in Blood Cells Isolated From Subjects With Asthma or Control Subjects
Candidate genes which showed enriched blood cell expression in the HPA database or colocalization in blood (median H4 > 0.8) were selected for further investigation to explore mRNA expression in blood cells between asthma and control subjects. The freely available gene expression dataset with adult subjects which also included a control group, GSE69683, was used from the GEO resource (27). The GSE69683 dataset comprises of Affymetrix HT HG-U133+ PM Array gene expression data of blood cell samples with 87 control, 77 mild-moderate, and 246 severe asthma subjects from the U-BIOPRED cohort (30). Samples were selected based on their non-smoker status (<5 pack-year smoking history). Mild-moderate asthma was defined as having controlled or partially controlled asthma symptoms, as defined by the Global Initiative for Asthma (GINA), whilst receiving a dose of <500μg fluticasone propionate/day or equivalent. Severe asthma was defined as having uncontrolled symptoms defined according to GINA guidelines and/or frequent exacerbations (more than two per year) despite high-dose inhaled corticosteroids (ICS) (ICS ≥ 1,000 μg fluticasone propionate/day or equivalent dose). Control subjects had no history of asthma or wheeze, had no other chronic respiratory disease, had never smoked and their prebronchodilator FEV1 was ≥ 80% predicted. Expression values were plotted for each gene stratified by subject group. Data was analyzed using the Shapiro-Wilk test to test for normality before using the Kruskal-Wallis test (non-normal distribution) or Welch's ANOVA (normal distribution) to analyze differences between groups. Only genes GSDMB and STAT6 had normally distributed data. Both statistical tests were combined with a two-stage linear step-up procedure of Benjamini, Krieger, and Yekutieli to control the FDR at 5%. P < 0.05 was considered significant.
Gene Functional Annotation Analysis
To identify gene or gene clusters in functional and disease related associations, the DAVID Bioinformatics Resource (31, 32) was used. The 37 candidate genes underwent enrichment analysis in the Genetic Association Database of complex diseases and disorders (GAD), Gene Ontology (GO) Term and KEGG and REACTOME pathway databases. The 37 genes were used as a set and clusters below 5% FDR were considered significant. The top 10 GAD terms were listed and fold enrichment (FE) scores were plotted against -log10(P-value) with the area of points representing the number of genes in the cluster for GO Terms and pathway analysis.
Gene Interaction Analysis
To identify and predict candidate causal gene interactions, the GeneMANIA prediction server was used which normalizes and weights interaction networks from various sources of data to build an interaction map (33). The 37 candidate genes were inputted as a set to produce a network map depicting physical interactions, co-localization, co-expression and predicted genes and interactions. Scores for predicted genes and the number of gene interactions were used to identify the strongest predicted genes.
Gene Drug Interaction Analysis
We used The Drug Gene Interaction Database (DGIdb) (34) to identify known drug interactions with the 37 genes highlighted by our signal to gene analysis and 5 predicted genes (CD274, IL37, IRAK4, PDCD1LG2, and ZAP70) which were found to have the strongest interactions through the gene interaction analysis. Drugs showing an interaction score, i.e., the numeric representation of publication count and source count, the ratio of average known gene partners for all drugs to the known partners for the given drug, and the ratio of average known drug partners for all genes to the known partners for the given gene, of >1.0 were selected. In addition we queried each gene at clinicaltrials.gov in order to identify drugs currently in Phase II, III, and IV trials for our identified genes as targets.
Results
PheWAS Analysis Indicates Signals Are Associated With Blood Cell Counts, Asthma, and Other Inflammatory Disorders
The GeneATLAS database identified traits associated with the risk allele of the 25 signals or proxies from the Moderate to Severe Asthma GWAS (Tables 1, 2). As expected, all signals showed association with asthma with odds ratios (OR) >1 (Figure 2). All signals, apart from rs61816761 (via proxy rs61816766), showed association with a blood/immune cell traits particularly eosinophil levels but also lymphocyte and neutrophil counts.
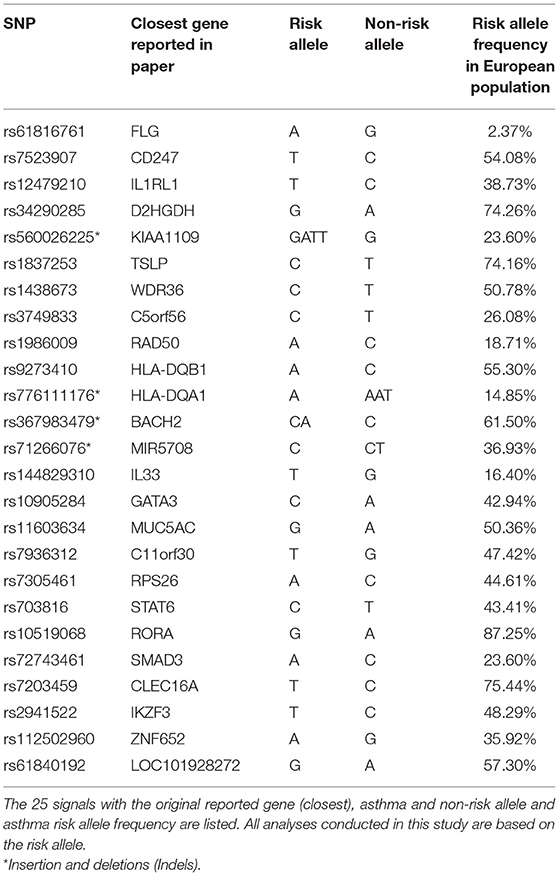
Table 1. The 25 signals from the moderate to severe asthma GWAS.
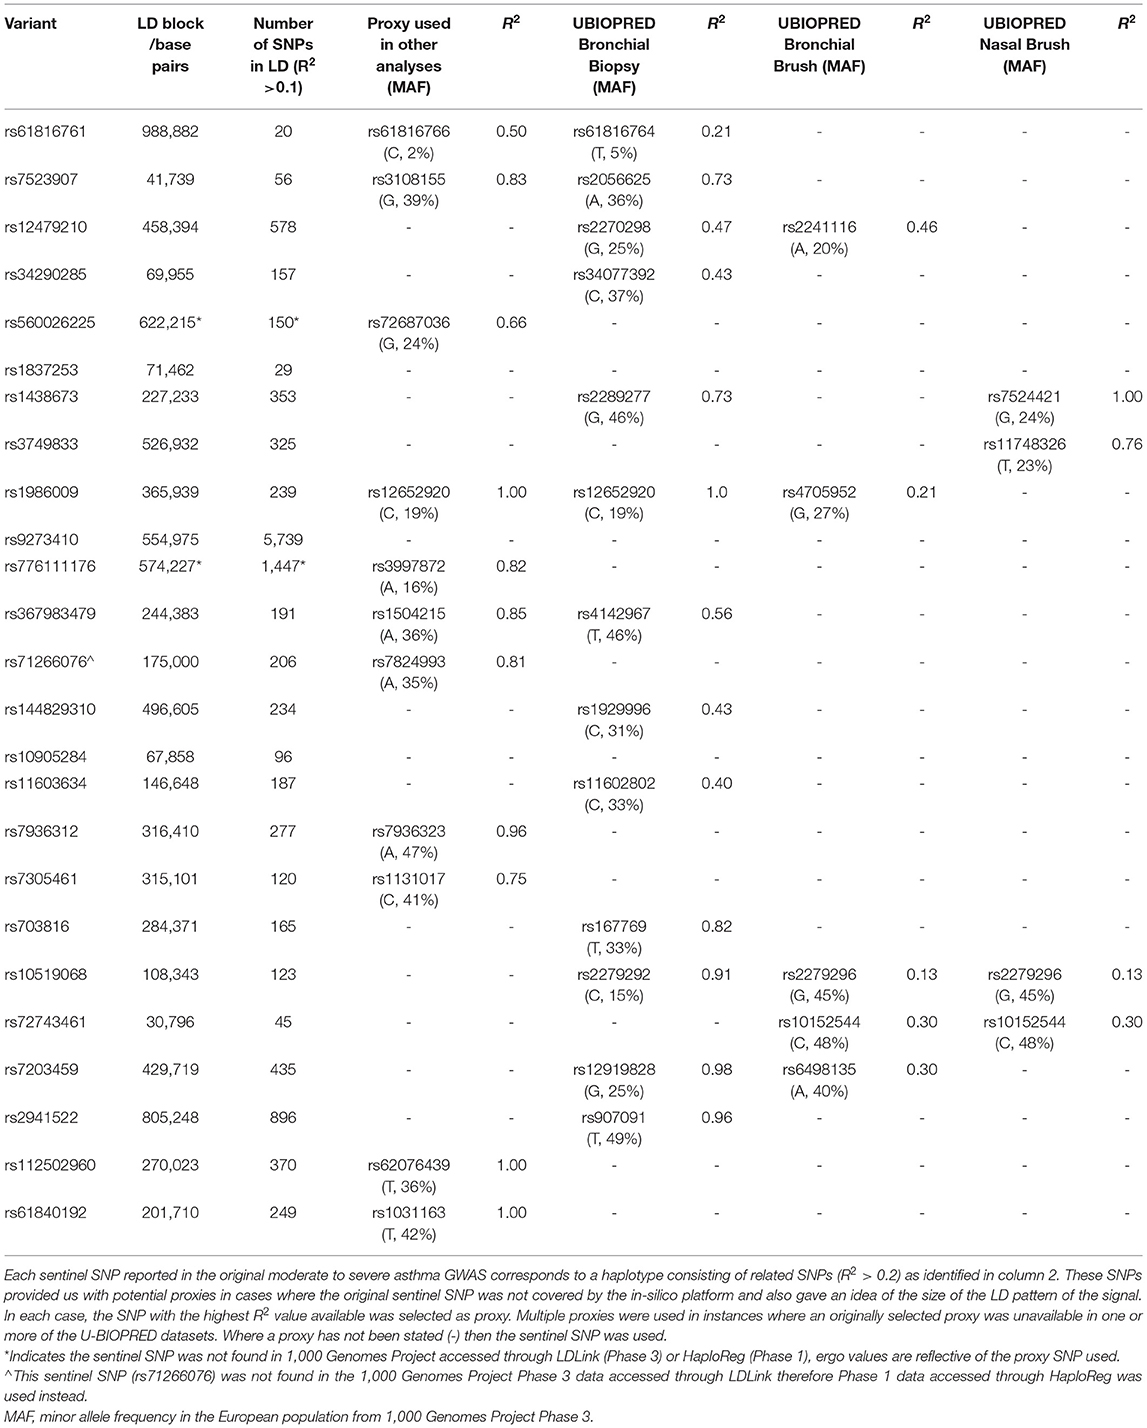
Table 2. SNPs utilized in pipeline analyses.
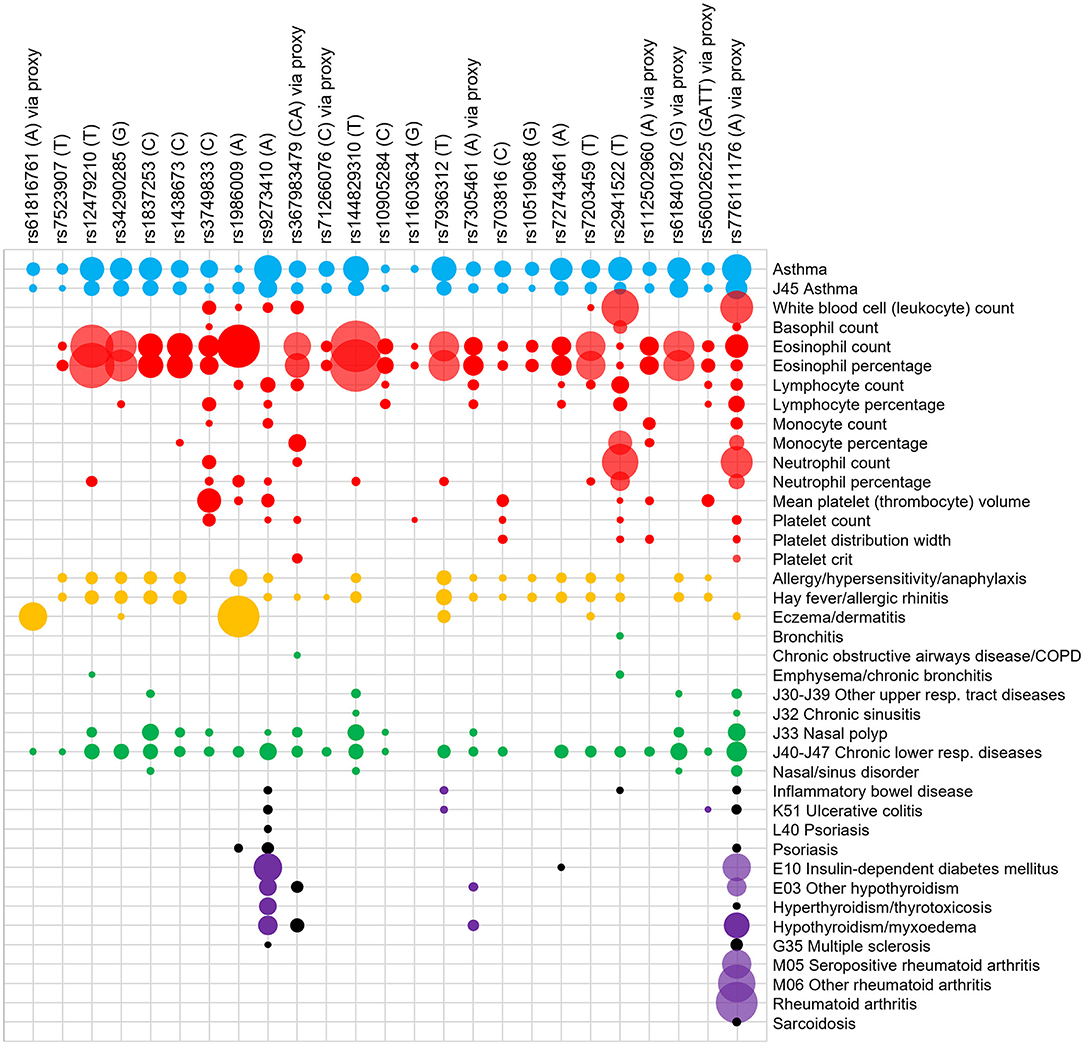
Figure 2. PheWAS of signals for moderate-severe asthma. Signals (risk allele in brackets) or their proxies were searched for in the GeneATLAS PheWAS database of the UK Biobank cohort. A Bonferroni adjusted p-value of 6.42 × 10⁻⁵ was used. The interaction between signals (top) and PheWAS traits (right) are represented on a grid and the area of the circle represents the -log10 (p-value) of the association. A larger area indicates a lower p-value. Only selected PheWAS traits have been displayed and organized into asthma (blue), blood/immune cell (red), allergy (yellow), other respiratory (green), inflammatory (purple), and auto-immune (gray) groups. The trait “basophil percentage” did not meet the Bonferroni corrected P-value for any of the signals and therefore was not included in the Figure. A full list of PheWAS terms and Beta and P-values are available in Supplementary Table 1. For disease traits (i.e., all except blood cell traits) a black dot represents an odds ratio of <1 with respect to the moderate to severe asthma risk allele. Proxies were used for the following signals which were not present in the database: rs61816761 (rs61816766, R2 = 0.50), rs367983479 (rs1504215, R2 = 0.85), rs71266076 (rs7824993, R2 = 0.81), rs7305461 (rs1131017, R2 = 0.75), rs112502960 (rs62076439, R2 = 1.0), rs61840192 (rs1031163, R2 = 1.0), rs560026225 (rs72687036, R2 = 0.66), and rs776111176 (rs3997872, R2 = 0.82).
Signal rs11603634 was relatively specific in showing only asthma, eosinophil percentage and platelet count associations. All signals apart from rs61816761 and rs9273410 showed association with eosinophil number and/or percentage highlighting the role of this cell type in asthma. All signals apart from rs61816761, rs3749833, rs10905284, rs11603634, rs112502960, and rs776111176 showed an association with allergy. Of these, signals rs3749833, rs10905284, rs11603634, rs112502960, and rs776111176 were associated with eosinophils but not allergy. Conversely rs9273410 was the only signal which showed an association with allergy but not eosinophils. These nuances in associations highlight the different asthma phenotypes.
Signals, rs1986009, rs9273410, rs7936312, rs776111176, and rs2941522 showed broad associations across many trait and trait groups. Signals rs9273410, rs776111176, and rs72743461 were the only ones associated with insulin-dependent diabetes. Signal rs776111176 was the only one associated with rheumatoid arthritis.
Some signals showed protective associations (OR < 1, black dots) for other disease traits such as rs2941522 (inflammatory bowel disease), rs72743461 (diabetes), rs1986009 (psoriasis) rs776111176 (inflammatory bowel diseases, ulcerative colitis, psoriasis, hyperthyroidism, multiple sclerosis, sarcoidosis), and rs9273410 (inflammatory bowel diseases, ulcerative colitis, psoriasis and multiple sclerosis). A full list of traits and ORs and P-values are available in Supplementary Table 1.
Signal to Gene Analysis Identifies 37 Candidate Causal Genes Associated With the 25 Moderate-Severe Association Signals
Using our scoring system for identifying candidate causal genes (Table 3) we identified 33 moderate to strong signal:gene relationships (s ≥ 3) for 21/25 signals (Table 4). The four remaining signals presented with weaker evidence of a relationship (s ≤ 2).
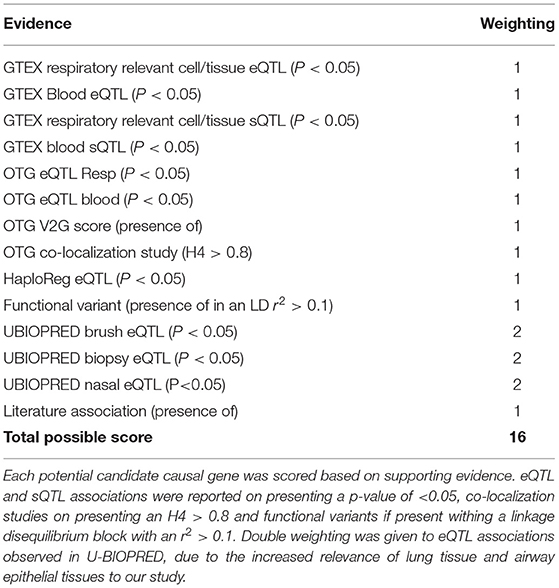
Table 3. Scoring system for signal to gene analyses.

Table 4. Selection of genes of interest relative to signal of association.
Relationships with the greatest score were observed for the signals tagged by rs12479210 (IL1RL1) and rs34290285 (D2HGDH) (score = 13) and multiple genes were identified for signals rs12479210, rs34290285, rs1438673, rs3749833, rs1986009, rs7305461, rs72743461, rs7203459, rs776111176, rs2941522, and rs112502960. We identified novel candidate causal signal:gene relationships for SNPs rs3749833, rs1986009, rs71266076, rs7936312, and rs2941522.
The strongest eQTLs, as defined by the most significant combined P and B-values for the risk allele, were observed in whole blood for rs2941522 (GSDMB & ORMDL3) and rs7305461 (RPS26 & STAT6) (Figure 3). Weaker associations (P-value) presenting with the greatest observed effect (B-value) were observed for rs776111176 in whole blood, lung (HLA-DQA2) and for signal rs9273410 in bronchial brushes (HLA-DQB1) and in whole blood and lung (HLA-DQB2) (Figure 3).
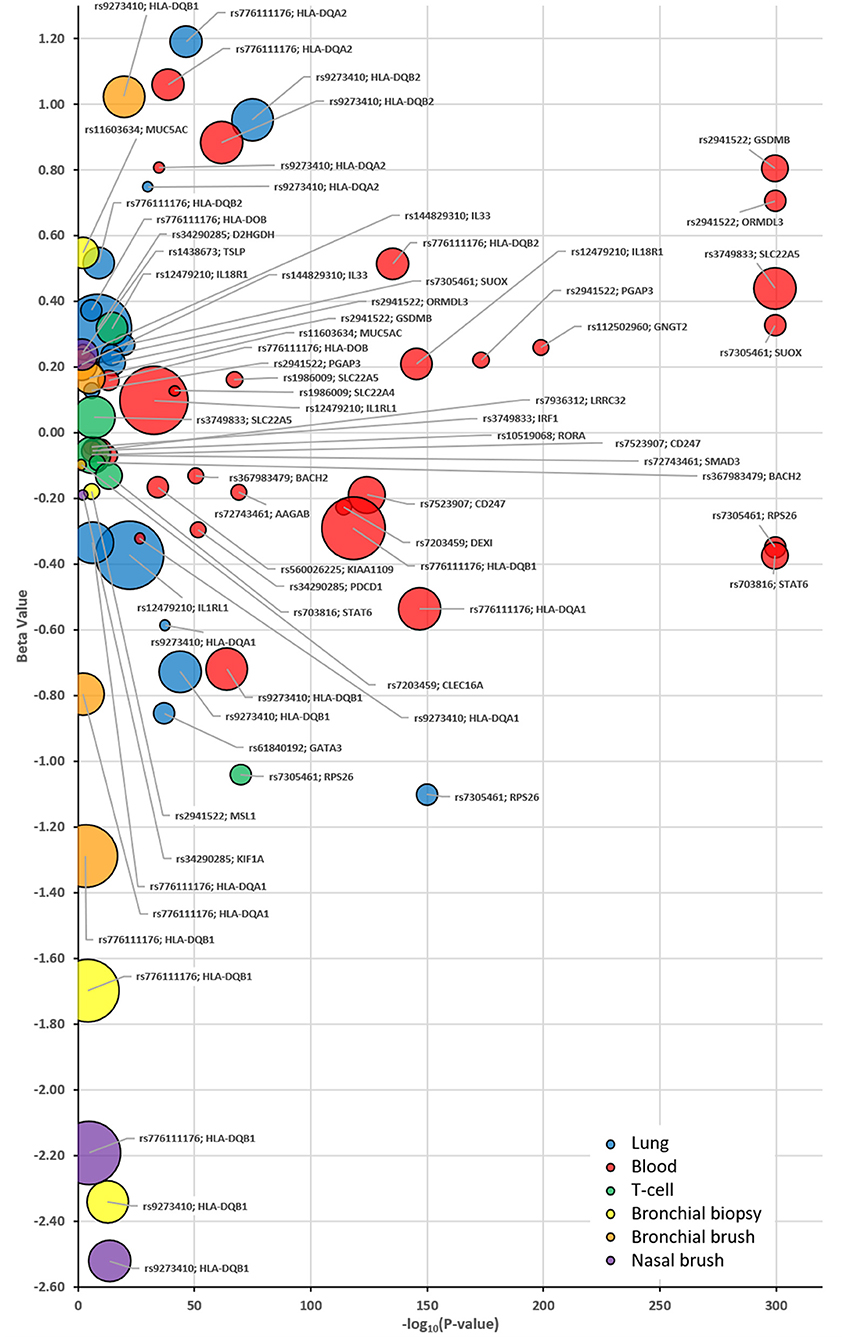
Figure 3. Bubble plots identifying the eQTL patterns for each selected SNP:Gene pairing as identified in Table 3 and tissue specific eQTLs. Plot identifies each eQTL P-value (x-axis) and B-value (y-axis) stratified based on the asthma risk allele for each identified compartment as denoted by the corresponding color; Blue = Lung, Red = Whole Blood, Green = T-cells, Yellow = U-BIOPRED Bronchial Biopsy, Orange = U-BIOPRED Bronchial Brush and Purple—U-BIOPRED Nasal Brush. The size of the bubble indicates the generated score in Table 3. EQTLs listed are those that achieved a P-value of P < 0.05 in one of the interrogated datasets.
Gene Function and Biological Processes Analysis Identifies Distinct Gene Groups
The largest gene function clusters were observed for genes involved in DNA/RNA binding (BACH2, GATA3, IRF1, RORA, RPS26, SMAD3, STAT6, and WDR36) or signal transduction (CD247, GNGT2, HLA-DQA1/A2/B1/B2, IL18R1, IL1RL1, IL33, LRRC32, PDCD1, and TSLP). Both FLG and MUC5AC are structural components involved in barrier formation and GSDMB is involved in cell death. Some genes such as DEXI, KIF1A, KIAA1109, ZBTB10, and ZNF652 had very limited or no information and as yet their function or involvement in biological processes is unknown. The gene function of implicated genes is described in Table 5.

Table 5. Gene function of candidate causal genes.
Single Cell RNA Expression in Lung Tissue Indicates Cell Type Specificity in Healthy Individuals
The HPA resource was used to look at overall and single cell type gene expression profile in lung tissue from healthy donors for the 37 candidate causal genes. Genes which showed enriched/enhanced expression (4-fold higher expression than in other cells/tissues) in epithelial or blood/immune cells were also identified. All genes except FLG showed expression in lung tissue and cells (Figure 4). KIF1A showed lower levels of lung expression and was undetectable in the cell types analyzed potentially due to the sensitivity of this technique. MUC5AC showed overall highest expression in lung tissue and along with IL33 and SLC22A4 was enriched in club and ciliated cells. IL33 also showed high expression in endothelial cells. Both IRF1 and RPS26 showed high lung cell type expression but no cell type specificity. CD247, GNGT2, HLA-DQB2, and PDCD1 were expressed at low levels in the datasets and were specific for T-cells and macrophages. HLA-DQA1/A2, HLA-DQB1 were highly expressed overall and specifically in macrophages, whereas IL18R1 and IL1RL1 showed greater expression in granulocytes. A full list of enriched tissues and cell types is available in Supplementary Table 2.
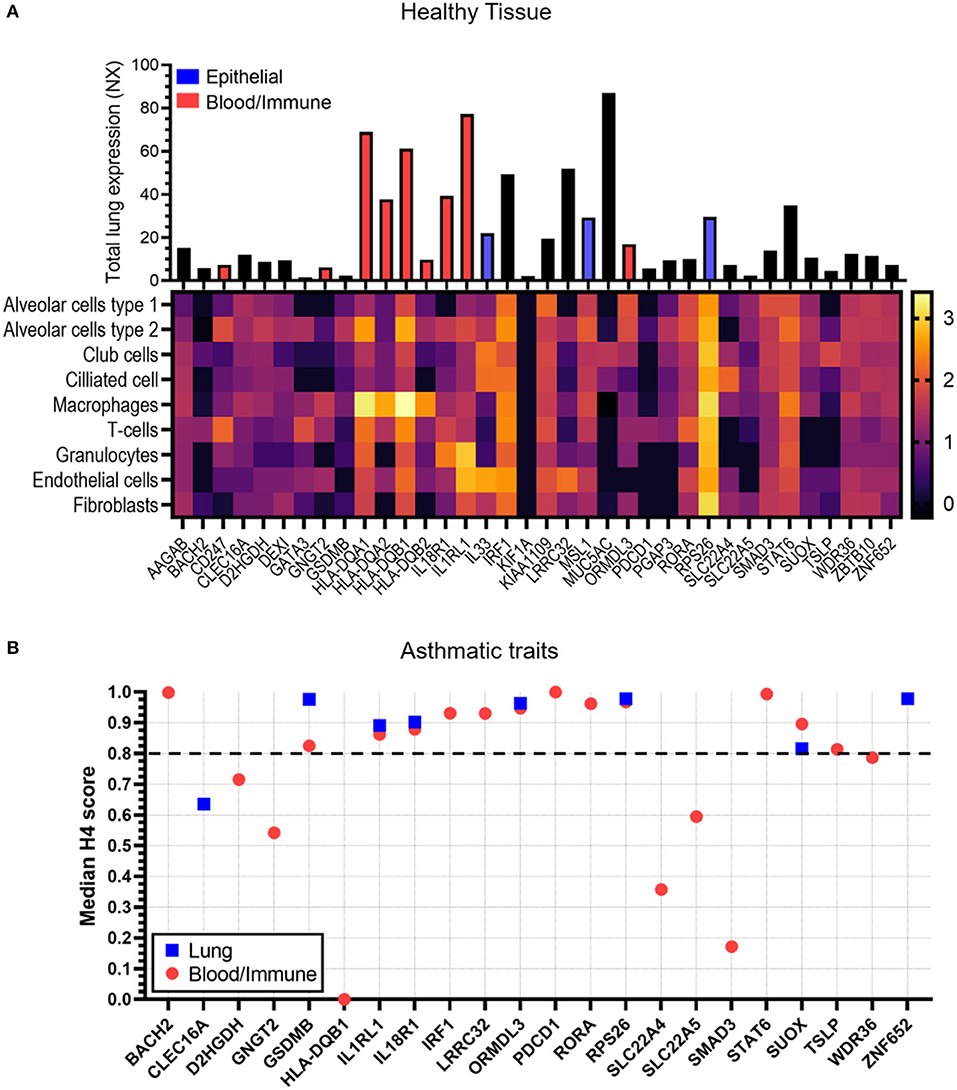
Figure 4. Tissue expression and colocalization analysis of candidate genes. (A) Data was taken from the Human Protein Atlas for both total lung RNA expression scores (bar chart, NX) and single cell RNA expression [heatmap, log10 (median transcripts per million protein coding genes)] in healthy tissue. Bar directly corresponds to gene in heatmap. The Human Protein Atlas was also analyzed for genes which showed enriched/enhanced gene expression in epithelial cells (blue bar) and blood/immune cells (red bar) compared to other cell types. A full list of enriched/enhanced tissue and cell gene expression data per gene is available in Supplementary Table 2. No data was available for FLG and therefore has not been shown. (B) Co-localization analysis (H4 scores) data was taken from the Open Target Genetics (OTG) platform for lung (blue squares) or blood/immune cells (red circles) in studies with the asthma trait (exclusive). Scores represent evidence of association between candidate gene, specific tissue and asthma trait. A higher score indicates greater association. Dotted line shows cut off value of 0.8. Candidate genes AAGAB, CD247, DEXI, FLG, GATA3, HLA-DQA1/A2, B2, IL33, KIF1A, KIAA1109, MSL1, MUC5AC, PGAP3, and ZBTB10 had no association data for lung/blood/immune cells/tissue in OTG and therefore have not been shown.
Co-localization Analysis Reveals Genes With High Asthma Trait Associations in Lung Tissues and Blood/Immune Cells
The OTG platform was used to investigate whether gene expression in lung tissue and/or blood immune/cells was associated with the asthma trait (Figure 4B). BACH2, IRF1, LRRC32, PDCD1, RORA, STAT6, and TSLP showed a strong link (H4 score>0.8) to blood/immune cells only, whereas ZNF652 was exclusively linked to lung tissue expression. Genes GSDMB, IL1RL1, IL18R1, ORMDL3, RPS26, and SUOX on the other hand showed strong association to both lung tissue and blood/immune cells.
Genes Show Differential Gene Expression in Bronchial Epithelial Cells Isolated From Subjects With Severe Asthma
From the above analyses, 10 genes (GSDMB, IL18R1, IL1RL1, IL33, MUC5AC, ORMDL3, RPS26, SLC22A4, SUOX, and ZNF652) showed enriched epithelial expression and/or co-localization of the asthma trait in lung tissue. These specific genes were further investigated in the bronchial epithelium of mild-moderate or severe asthma subjects compared to control subjects (Figure 5). Six of the 10 studied genes showed differential expression in asthma vs. control subject cells. Expression levels of IL18RL1 (P = 0.019, MA and 0.0008, SA), IL1RL1 (P = 0.0034, MA and 0.010, SA), and ORMDL3 (P = 0.040, MA and 0.0029, SA) were higher in both mild-moderate and severe asthma subjects compared to controls (Figures 5A,B,D) whereas expression levels of MUC5AC (P = 0.022) and RPS26 (P = 0.0004) were higher in severe asthma subjects only compared to controls (Figures 5C,E). Expression levels of SLC22A4 (P = 0.0051, MA and <0.0001, SA) was lower in both mild-moderate and severe asthma subjects compared to controls (Figure 5F). Expression levels of SLC22A4 (P = 0.0028) was decreased in severe asthma (Figure 5F) compared to mild-moderate asthma. Genes GSDMB, IL33, SUOX, and ZNF652 did not show any significant differences in expression across groups (Supplementary Figure 1).
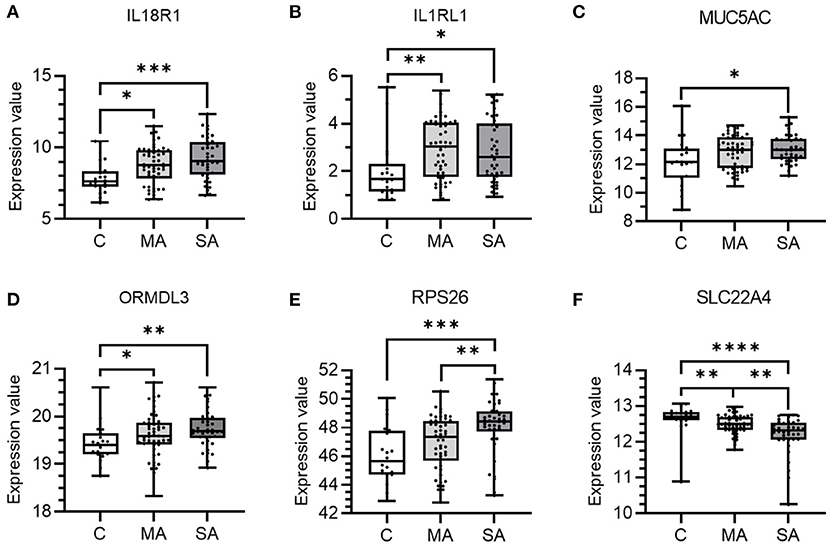
Figure 5. mRNA expression of candidate causal genes in bronchial epithelial cells taken from patients with asthma and controls. Boxes shows the median and IQR and the whiskers show the minimum and maximum data. Bronchial epithelial brush samples were from controls (C, n = 20) and patients with mild-moderate (MA, n = 50) and severe (SA, n = 38) asthma. Data is shown for (A) IL18R1, (B) IL1RL1, (C) MUC5AC, (D) ORMDL3, (E) RPS26, and (F) SLC22A4. Expression values were taken from the dataset and a Kruskal-Wallis test with a two-stage linear step-up procedure of Benjamini, Krieger and Yekutieli used to control the FDR at 5% was performed. *P < 0.05, **P < 0.01, ***P < 0.001, and ****P < 0.0001.
Genes Show Differential Gene Expression in Blood Cells Isolated From Subjects With Severe Asthma
From the above analyses, 18 genes (BACH2, CD247, HLA-DQA1/A2, IL1RL1, ORMDL3, RORA, STAT6, GNGT2, GSDMB, HLA-DQB1/B2, IL18R1, IRF1, LRRC32, PDCD1, RPS26, SUOX, and TSLP) showed enriched blood/immune expression and/or co-localization of the asthma trait in blood. These genes were further investigated in blood cells of mild-moderate or severe asthma subjects compared to control subject cells (Figure 6). Seven of the 18 genes studied showed differential expression across control and asthma subject groups. Expression levels of BACH2 (P = <0.0001 for both) and CD247 (P = 0.0002, vs. C and P = 0.0204 vs. MA for CD247) were significantly lower in severe asthma compared to controls and mild-moderate asthma (Figures 6A,B). Expression levels of HLA-DQA1/A2 (P = 0.0077), ORMDL3 (P = 0.0021), and RORA (P = 0.0005) were significantly lower in severe asthma subjects only compared to controls (Figures 6C–E). Expression levels of IL1RL1 (P = 0.0002 vs. MA, P = <0.0001 vs. SA) and STAT6 (P = 0.0079 vs. MA, P = <0.0001 vs. SA) were significantly higher in mild-moderate and severe asthma compared to controls (Figures 6F,G). Genes GNGT2, GSDMB, HLA-DQB1/B2, IL18R1, IRF1, LRRC32, PDCD1, RPS26, SUOX, and TSLP didn't show any significant differences in expression between groups (Supplementary Figure 2).
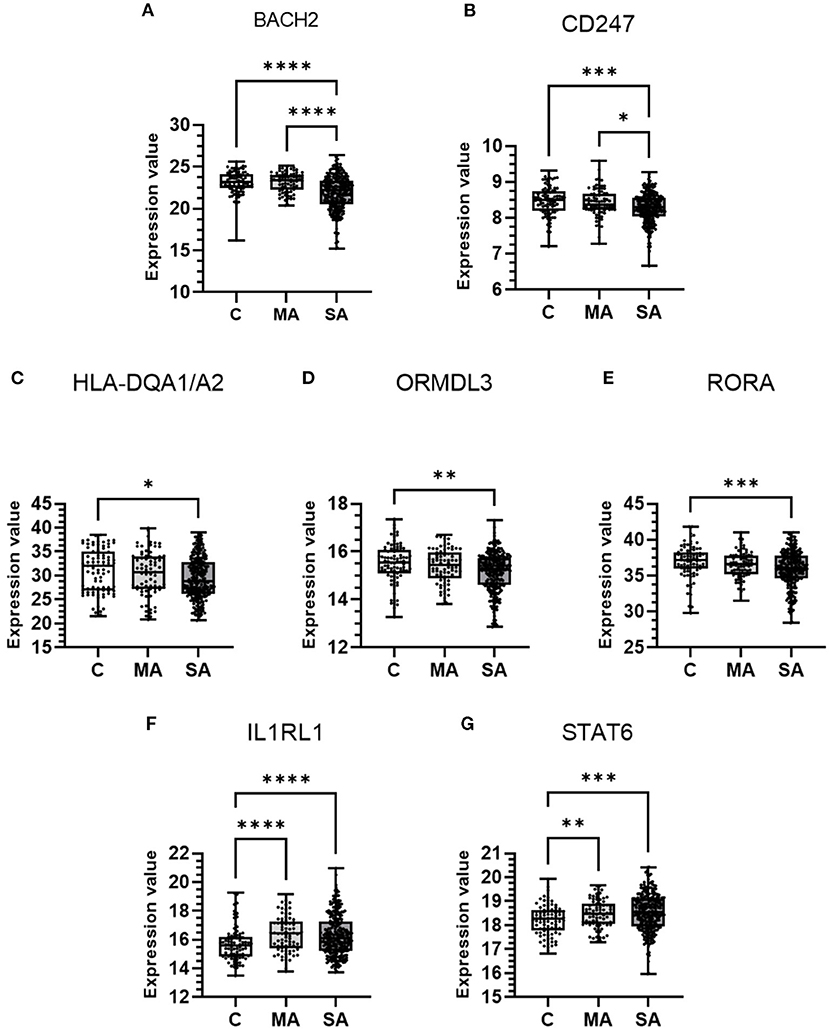
Figure 6. mRNA expression of candidate causal genes in blood cells taken from patients with asthma and controls. Boxes shows the median and IQR and the whiskers show the minimum and maximum data. Blood samples were from controls (C, n = 87) and patients with mild-moderate (MA, n = 77) and severe (SA, n = 246) asthma. Data is shown for (A) BACH2, (B) CD247, (C) HLA-DQA1/A2, (D) ORMDL3, (E) RORA, (F) IL1RL1, and (G) STAT6. Expression values were taken from the dataset and either a Kruskal-Wallis test or Welch's ANOVA (STAT6), both with a two-stage linear step-up procedure of Benjamini, Krieger and Yekutieli used to control the FDR at 5%, was performed. *P < 0.05, **P < 0.01, ***P < 0.001, and ****P < 0.0001.
Genetic Association Database of Complex Diseases and Disorders Identifies Genes Associated With Asthma
The DAVID functional annotation tool was used to perform enrichment analysis for the 37 candidate genes in the GAD. The top 10 gene clusters (5% FDR) are listed in Table 6. The full table is available in Supplementary Table 3. Asthma was significantly associated with the largest cluster of genes comprising of FLG, IL33, GSDMB, SLC22A5, SMAD3, TSLP, GATA3, SUOX, MUC5AC, IL1RL1, IRF1, ORMDL3, STAT6, HLA-DQA2, IL18R1, HLA-DQA1, and HLA-DQB1 (P = 1.78 × 10⁻¹⁵). Genes were also associated with other, predominantly autoimmune, diseases including Type 1 diabetes, Celiac disease, Crohn's disease, and rheumatoid arthritis which complements the findings of the PheWAS. There is considerable overlap between genes associated with asthma and other diseases with HLA-DQA1/B1 genes present in ~74% of significant terms (Supplementary Table 4).
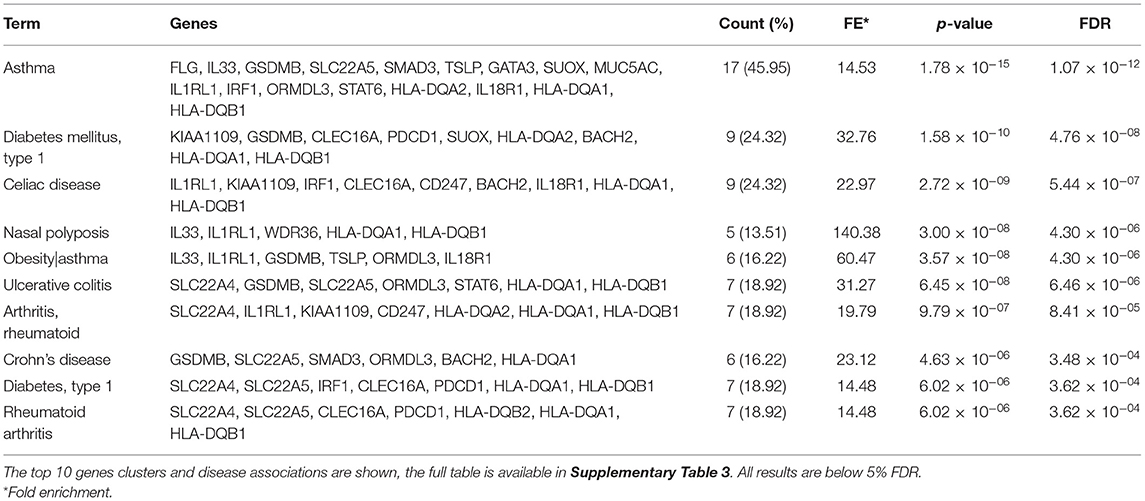
Table 6. DAVID functional annotation tool analysis of the genetic association database of complex diseases and disorders (GAD).
Pathway and Gene Ontology Term Enrichment Analysis Highlights Genes Involved in Asthma and the Strong Presence of a HLA-DQA1/A2/B1/B2 Cluster
GO term enrichment analysis (Figure 7A) identified a predominant gene cluster of HLA-DQA1/A2/B1/B2 genes. These genes were enriched mainly in processes involving MHC class II molecules and vesicle-membrane transport interactions. KEGG and REACTOME pathway analyses also identified this gene cluster as being involved in asthma, MHC class II antigen presentation, autoimmune processes, pathogenic infections, and diabetes (Figure 7B). PD-1 signaling was the most significant pathway identified which was enriched for CD247, PDCD1, HLA-DQA1/A2, and HLA-DQB1/2. Other significant pathways, including phosphorylation, translocation and generation of second messenger molecules, involved the CD247, HLA-DQA1/A2/B1/B2 genes. Full result tables are available in Supplementary Tables 5, 6.
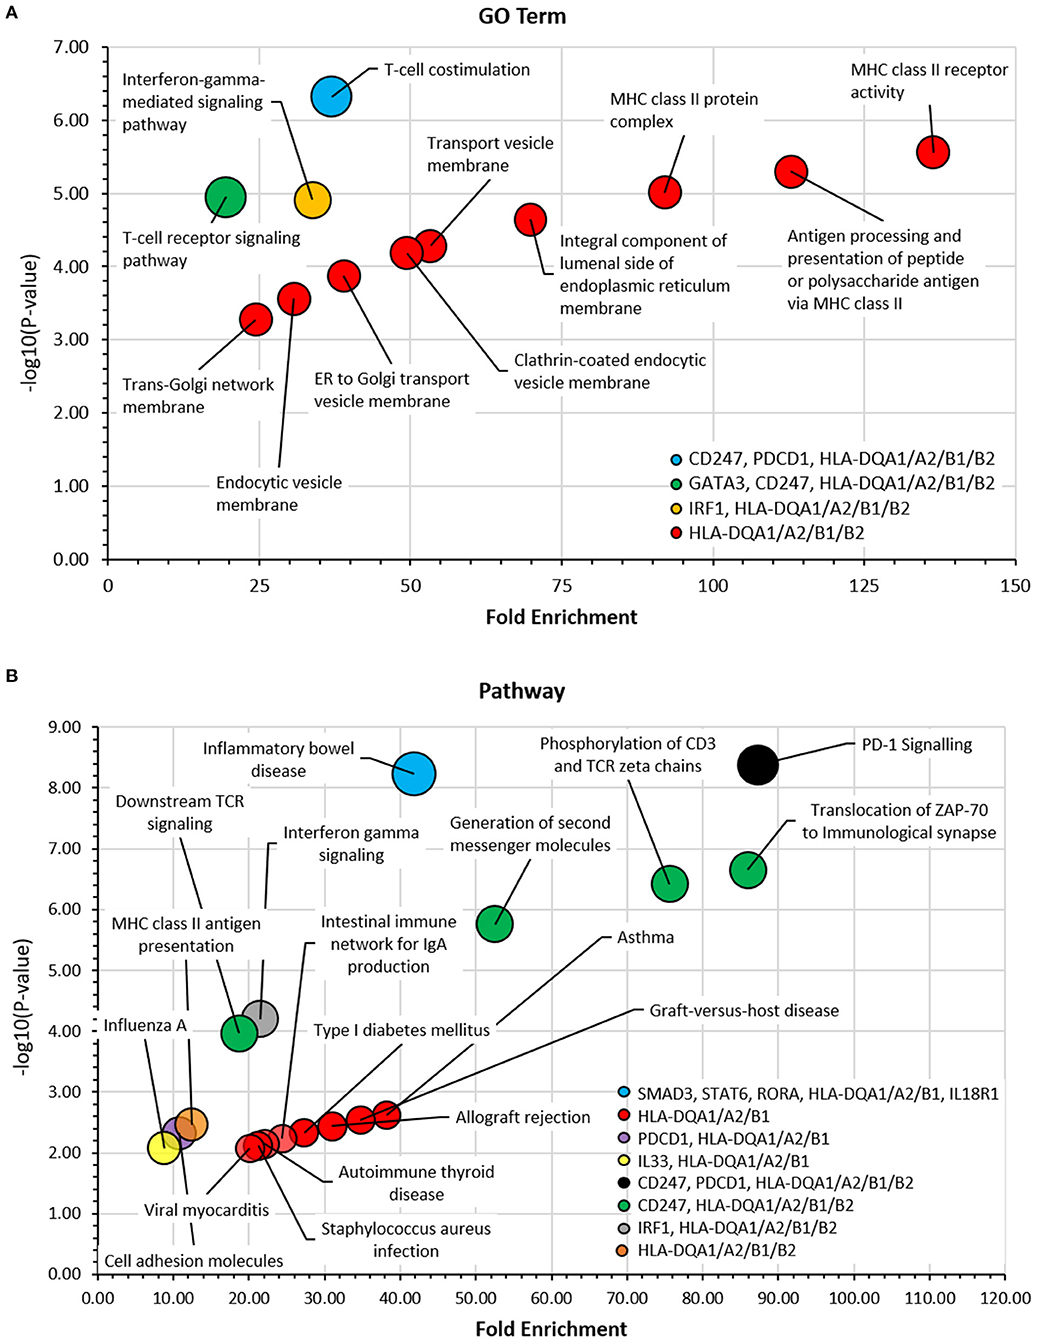
Figure 7. Gene ontology (GO) term and pathway analyses. The DAVID bioinformatic tools was used to assess candidate genes in (A) GO Term and (B) KEGG and REACTOME Pathway analyses. -log10 (p-value) was plotted against fold enrichment for gene groups and the area of the circle is proportional to number of genes in the group. 5% FDR. Full analyses can be viewed in Supplementary Tables 5, 6.
Gene Interactions Analysis Highlights Key Co-localization and Co-expression Relationships and Predicts Additional Related Genes
Gene interaction analysis of the 37 candidate genes identified that the strongest physical interactions were observed between HLA-DQA1 and B1, SMAD3 and SMAD4 (predicted gene), CD247 and ZAP70 (predicted gene), and FLG and CASP14 (predicted gene). IL33, LRRC32, IL18R1 and CD274 (predicted gene) were observed to have the greatest number of co-localized partners. GATA3 and IL18R1 were observed to have the greatest number of co-expressional partners. AAGAB, KIF1A, and KIAA1109 showed no interaction between any other gene (Figure 8). The predicted genes with the strongest interactions were CD274, IL37, IRAK4, PDCD1LG2, and ZAP70 (Supplementary Table 7).
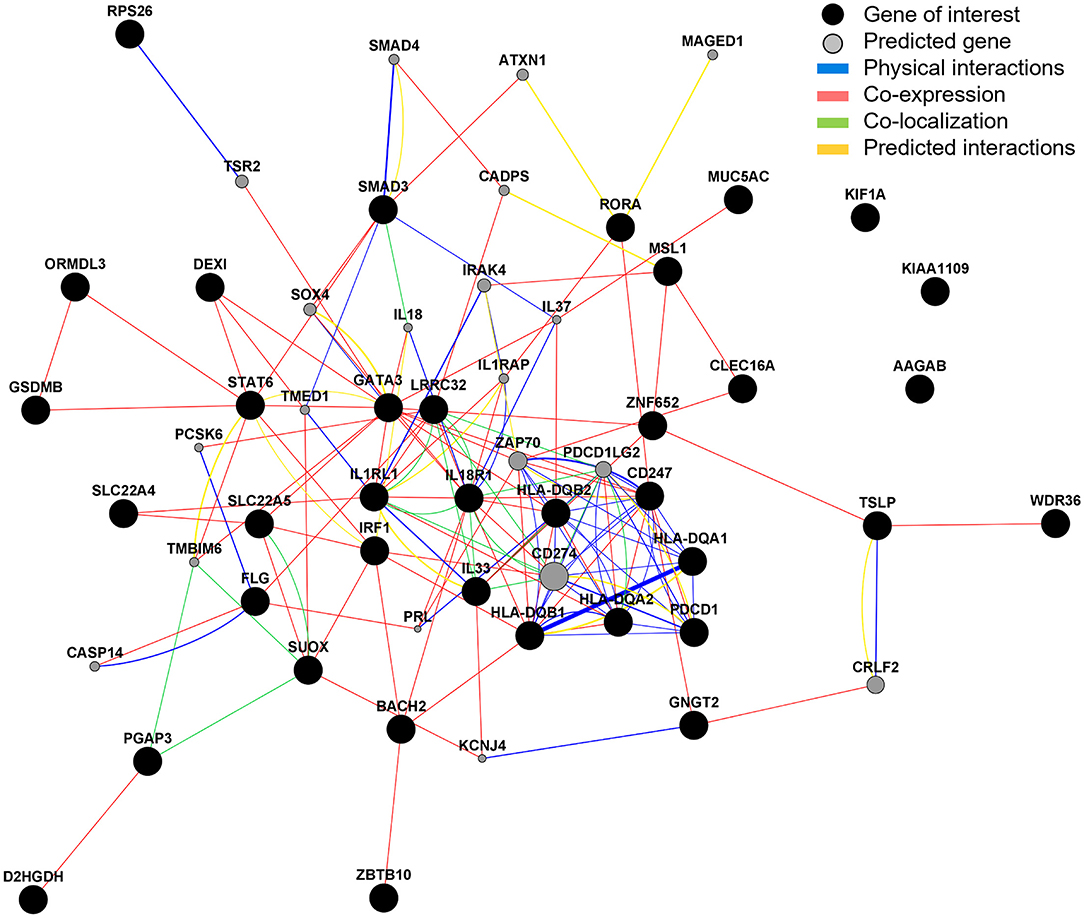
Figure 8. Gene interaction analysis. GeneMANIA was used to explore and predict gene interactions. Black circles represent inputted candidate genes and gray circles are predicted genes (selected to show top 20 with strongest predicted association). The area of the gray circle represents prediction scores and thickness of line represent interaction scores, with a larger area/thicker line representing stronger prediction/interaction.
Gene Drug Interaction and Clinical Trial Data Analyses Identifies 14 Genes Targeted by Licensed Therapeutics and 5 Genes Under Clinical Trials for Asthma
Of the 37 candidate causal genes and five predicted genes, DGIdb identified that 14 of the genes have known interactions with currently available therapeutics, with highest scoring genes being, SLC22A5 (Carnitine, 63.79), MUC5AC (Ensituximab, 31.9), and CD274 (Avelumab, 23.92). Novel inhibitory antibodies under Phase II/III/IV clinical trials have been identified as potential novel therapeutics for asthma using https://clinicaltrials.gov, for 5 of the highlighted genes [GATA3, IL1RL1, IL33, SMAD3, and TSLP (Table 7)].
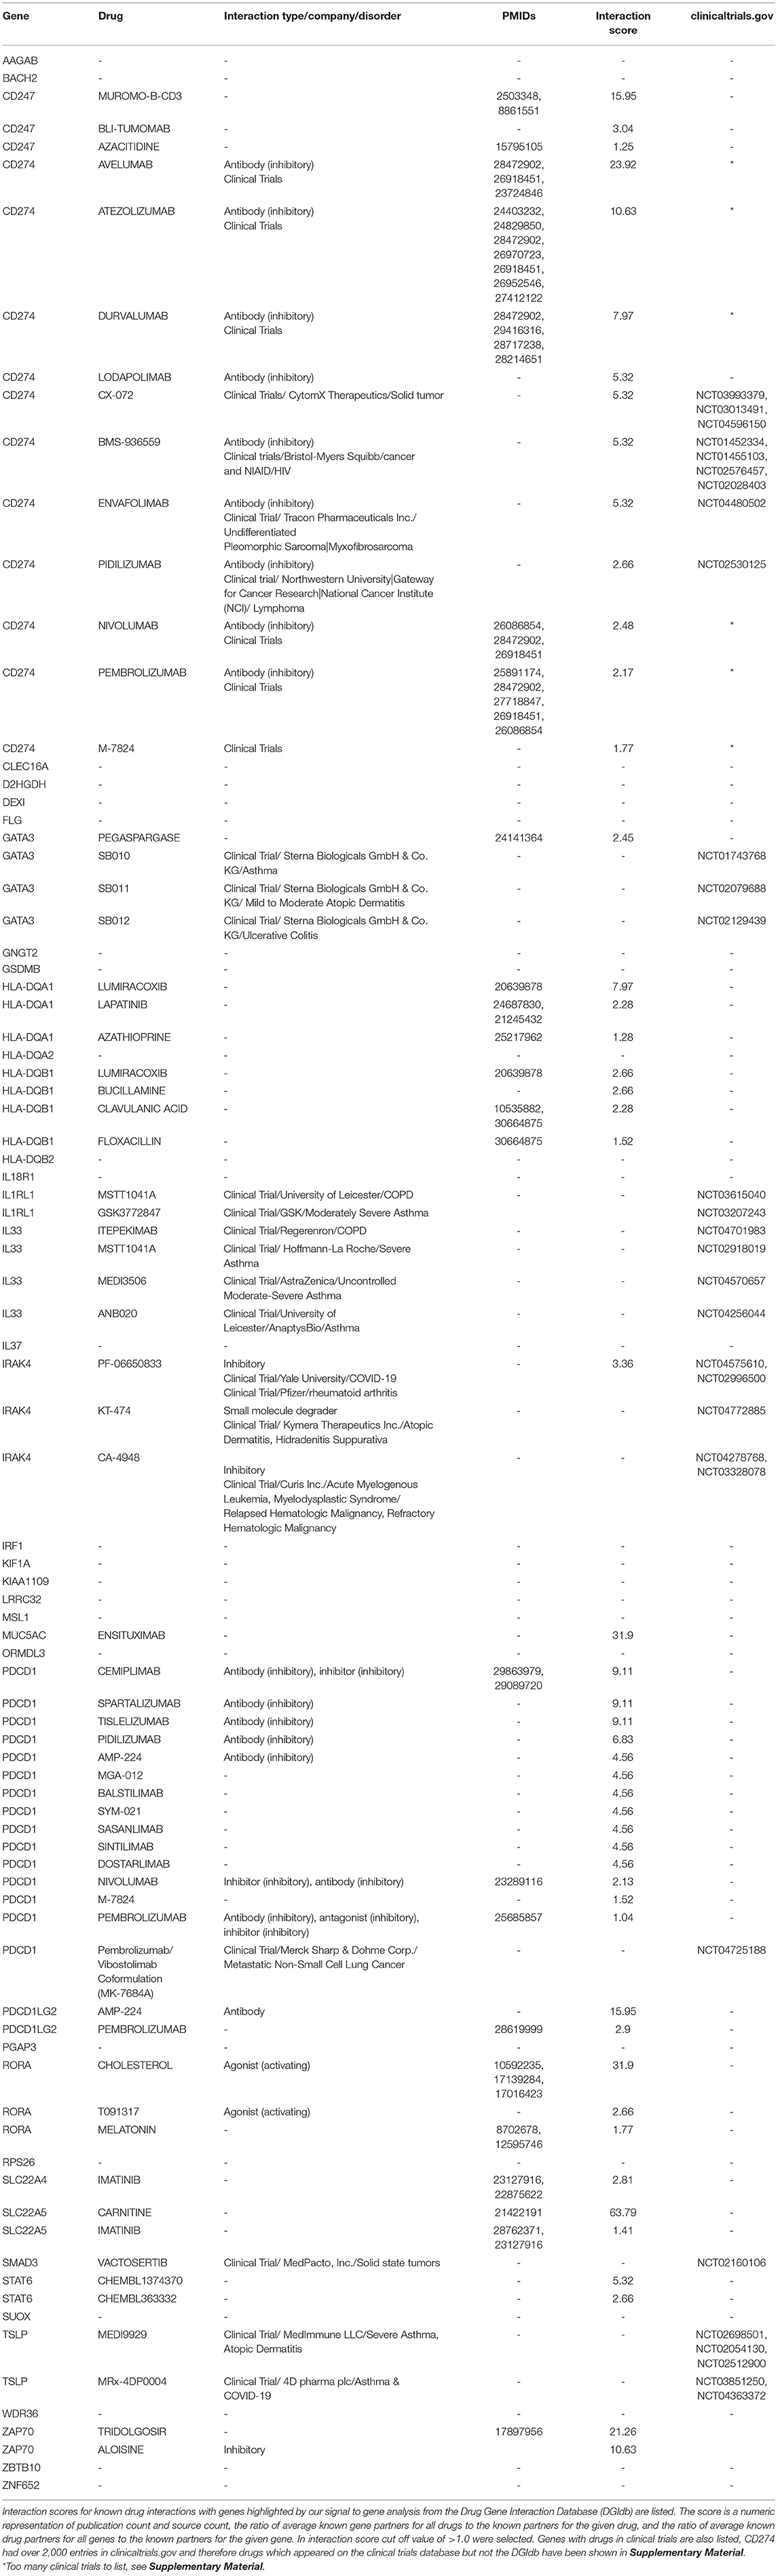
Table 7. Known drug interactions and molecules currently in clinical trials of 37 candidate causal genes and five predicted genes.
Discussion
Asthma is a heterogenous disease in which both genetic and environmental factors contribute to susceptibility and progression (35). Severe asthma, characterized by uncontrolled symptoms, a burden of medication and frequent exacerbations, remains inadequately managed in many patients (2). The current study aimed to provide significant translation of 25 genetic signals identified as risk factors for the development of moderate to severe asthma to new biological insight using a broad range of approaches and datasets. The main findings are (i) moderate-severe asthma genetic signals drive a large number of inflammatory cell traits particularly eosinophil levels and are risk factors for related traits such as atopic dermatitis and other inflammatory diseases, (ii) our signal to gene pipeline identified 37 candidate causal genes, (iii) genes show enrichment in lung tissue and inflammatory cells illustrating both the role in inflammation and structural changes in the airways, (iv) 32 of the 37 genes had additional support for a role in asthma including some with differential expression in the airways and blood cells of severe patients, (v) genes show enrichment for pathways relevant to T cell function, interferon signaling, endoplasmic reticulum (ER) biology and others, (vi) gene interaction analyses identified predicted genes already known to be involved in asthma and finally, (vii) these genes and pathways show potential as targets for novel drug development or repurposing.
PheWAS Identified Features of Asthma and Other Traits Driven by Moderate-Severe Asthma Signals
Our initial analysis focused on understanding the uniqueness of the moderate-severe asthma signals by testing for association with a large number other traits via PheWAS. This approach can identify novel associations with quantitative traits e.g., lung function and provide significant inference regarding the mechanisms underlying the original association. All signals showed associations with the asthma trait including the MUC5AC signal that was identified as a potential moderate-severe asthma signal originally (7) and blood/immune cell trait associations were very prominent. Recently, this MUC5AC signal has been identified as potentially more relevant to adult onset asthma (36), a phenotype that shares less overlap with atopic comorbidities than childhood onset asthma. This may explain, at least in part, the differential profile compared to many of the other signals which showed associations with e.g., atopic dermatitis.
Interestingly, some signals showed trait specificity whilst others had broader trait associations. Of particular note are signals rs9273410 and rs776111176 both corresponding to HLA-DQA1/A2/B1/B2 candidate genes, which had the widest disease associations including Hay fever, type 1 diabetes, inflammatory bowel disease, ulcerative colitis and psoriasis. The gene association for these results were confirmed in DAVID pathway and gene enrichment analysis where the HLA-DQA1/A2/B1/B2 gene cluster was present in ~74% of diseases and pathways. Interestingly, PheWAS analysis for these signals showed a protective effect for some auto-immune diseases. Previous studies of signals in this region have confirmed inverse disease dependence risk between asthma and autoimmune disease, for example signal rs2395185, the asthma risk allele T was shown to be protective for ulcerative colitis (37, 38). These differences in trait profiles across diseases may offer insight into disease pathophysiology for this gene cluster.
Another notable association with the majority of signals was the association with blood eosinophils levels, with eosinophils known to be an effector cell in asthma and linked to severe asthma pathology (39). Indeed, current treatments such as Mepolizumab, Benralizumab, and Reslizumab reduce exacerbations through blocking IL5/IL5 signaling and reducing eosinophil numbers (40–43).
Interestingly, signal rs2941522 corresponding to candidate genes ORMDL3, GSDMB, PGAP3, and MSL1 had the strongest association with neutrophil counts. This observation may point to a particular pathology for carriers of this variant and a role in non-eosinophilic or neutrophilic asthma (44, 45). Multiple GWAS and functional studies relate asthma to ORMDL3 and GSDMB (46, 47) however to our knowledge no studies have been published investigating this variant or linked genes with regards to neutrophils in asthma.
Signals, rs12479210, rs144829310, and rs1986009 had the strongest eosinophilic associations, corresponding to IL1RL1, IL18R1, SLC22A4/5, and IL33 candidate causal genes. IL18R1 and IL1RL1 have been shown in many studies to have variants associated with asthma as well as having altered expression profiles in asthmatic subjects (3, 28). Predictive interaction analysis revealed strong physical interactions between IL1RL1 and TMED1 which is unsurprising as both are related to IL33 signaling (48) which has been extensively researched in the context of asthma (49).
Signal to Gene Analyses Identifies 37 Plausible Candidate Causal Genes
The complexity of signals identified through GWAS highlight the importance of considering relevant tissue compartments when determining signal to gene associations. For many of the signals, we identified multiple plausible candidate causal genes to a single signal, with different genes acting as eQTLs in different cells and tissue types. This is potentially as anticipated as it is feasible that a signal may influence multiple genes and pathways. For example, considering signal rs12479210, we observe an eQTL for IL1RL1 in lung tissue but not in a T-cell population, where IL18R1 is the observed eQTL. This strongly suggests that a single signal may drive the differential expression of multiple genes and contribute to asthma mechanisms in multiple ways, the IL1RL1 signal remains one of the most reproducible asthma signals potentially for this reason (50). Additionally, we highlight that when eQTLs are common across different tissue types, these may present dramatically different effects on gene expression. For example, when considering the above locus of association, we observe a positive eQTL for IL1RL1 in whole blood (B = 0.1), but a negative eQTL effect in whole lung (B = −0.372). This emphasizes the need for further analysis on these identified eQTLs in order to unpick the relationship between the eQTLs and asthma relevant phenotypes (51). The 37 identified candidate causal genes broadly mapped to; barrier formation/defense, cell death, DNA/RNA binding, membrane binding and transport, metabolic processes, and signal transduction. Importantly, independent biological studies of asthma have identified a potential role for several of these pathways e.g., epithelial barrier/defense (52) and DNA/RNA binding (53), however more novel mechanisms identified require further investigation.
Gene to Asthma Analyses Provide Significant Support for a Role of Candidate Causal Genes in the Structural Changes in the Airways and Inflammation in Asthma
Structural remodeling is a major component of asthma pathophysiology resulting in the narrowing of the airways. Changes comprise of loss of ciliated cells, goblet cell metaplasia, increased sputum production, basement membrane thickening and smooth muscle cell hypertrophy, and hyperplasia leading to an overall decline in lung function (54–56). Airway remodeling is thought to occur in response predominantly to chronic inflammation, which is supported by studies showing that steroid treatment in asthmatic patients both reduces airway inflammation and has a positive effect on airway remodeling (57, 58). The strong association of these signals with inflammatory traits and a candidate causal genes list with genes predominantly involved in signal transduction indicates these signals may contribute to airway remodeling.
Immune cell infiltration of the lung epithelium is a magnifier of asthmatic inflammation (59). STAT6 expression was increased in the blood cells of asthmatic patients compared to controls in the dataset analyzed in this study. It is a transcription activator and has been linked to goblet cell metaplasia and an increase in MUC5AC production (60). The MUC5AC protein is a secreted gel forming mucin and its protein levels have also been shown to be increased in asthmatic airway mucus (61). Furthermore, in the airway epithelial dataset analyzed, MUC5AC showed a significant increase in gene expression in patients with severe asthma. Indeed, IL-13, an inflammatory cytokine highly associated with asthma induced activation of STAT6 has been shown to increase mucin expression and mucus metaplasia in both airway epithelial cells and submucosal glands in mice and has been linked to goblet cell hyper/metaplasia in humans (62). Both BACH2 and RORA are also DNA binding proteins, however in blood cells, their expression values were significantly lower in asthmatics. RORA has been shown to play a role in lung development (63) and childhood asthma (64) and studies in mice have shown BACH2 to repress T-cell cytokine production (65, 66) indicating lower levels of this protein in asthma may contribute to unregulated inflammation. Together, these findings suggest that imbalances in transcriptional regulators in inflammatory cells may, in part, contribute to asthma pathology possibly via downstream processes which affect multiple cells types including the airway epithelium. However, some caution is required as these expression datasets were from mixed cell populations, so we cannot exclude the influence of different cell populations between groups driving some mRNA level differences. Furthermore, the signal for the MUC5AC candidate gene, rs11603634, associated with the asthma, eosinophils and platelets traits only, indicating a role specific to severe/eosinophilic asthma that is potentially not driven by allergic mechanisms due to the lack of association with related traits in PheWAS.
Eosinophils, mast cells and T-helper (Th) cells are the key producers of inflammatory cytokines, IL-4, IL-5, and IL-13, associated with Th2 asthma (59, 67). From the signal association with eosinophils in the PheWAS analysis, it suggests inflammation plays a key role in asthma pathogenesis. Indeed, more than half of the 37 candidate causal genes were found, through gene function and pathway analyses, to be involved in signaling pathways related to inflammatory cytokines. Some genes such as TSLP, IL-33 and its receptor IL1RL1 have well-established asthma inflammatory roles (51, 68). IL1RL1, showed increased expression in both airway epithelium and blood of asthmatic patients compared to controls. Furthermore, inflammatory pathology is supported by the presence of GATA3 and STAT6 in asthma and inflammatory gene clusters in the pathway analysis. Both of these transcription factors have been shown to be vital for Th2 cell activation in asthma (69). Expression of IL18R1, a receptor for IL-18, was also increased in asthmatic airway epithelium. IL-18 has been shown to regulate both Th1 and Th2 immune responses (70, 71) through INFγ and IL-12 (72) and induce IgE production via IL-4 and STAT6 (73). Additionally, for IL1RL1 and IL18R1 colocalization analysis revealed strong association with both lung tissue and blood/immune cells indicating infiltration into the lung.
Gene Functional Annotation, Pathway, and Gene Interaction Analysis Provides Insight Into Asthma Mechanisms Including Prediction of Other Asthma Related Genes
Functional and pathway analysis has revealed that the 37 candidate genes are involved in predominantly transcriptional regulation, membrane interaction and cytokine signaling, indicating that these processes may be disrupted or imbalanced in patients with asthma. A strong HLA-DQA1/A2/B1/B2 gene cluster has emerged involving in a broad range of processes including auto-immune disease, viral and bacterial infection, antigen presentation and ER/Golgi/vesicle membrane interaction. If the gene cluster is broadened to include CD247, then combined these five genes are present in over 75% pathway and GO terms and processes. The HLA genes are part of a class of major histocompatibility complex (MHC) molecules which present exogenous allergen on airway dendritic cells and interact with CD247, part of the T-cell antigen receptor complex, to achieve T-cell activation (74, 75). From the blood dataset utilized in this study, both CD247 and HLA-DQA1/A2 gene expression were found to be decreased in asthmatic patients. Although studies in asthma are lacking, type 2 (non-insulin dependent) diabetics have shown chronic inflammation resulted in immunosuppression and CD247 downregulation (76). Seeing as chronic inflammation is also present in severe asthmatics, it is possible that a similar process is involved. Indeed, the signals, rs9273410 and rs776111176, for the HLA-DQ genes also had a strong risk association with diabetes albeit, type 1 (insulin-dependent) diabetes. Genetic variants in the HLA region have long been associated with asthma (77), however deconvolution of this region has been difficult.
Another feature which has appeared is the interaction/involvement of the candidate genes with the ER apparatus. The role of the ER, ER stress and the unfolded protein response (UPR) in asthma remains unclear. An increase in ER stress has been reported in asthma, and ER stress has also been shown in turn to increase mucin production, including MUC5AC, and airway remodeling (78, 79). In some studies, ORMDL3, an ER transmembrane protein, has been heavily implicated in asthma related ER stress (78, 79). ORMDL3 gene expression was shown to be increased in asthmatic airway epithelium but decreased in blood compared to controls in the datasets used in this study. In mice, ORMDL3 expression has been shown to be induced by allergen, IL-4 and IL-13 via STAT6 and in bronchial epithelial cells, overexpression of ORMDL3 has been shown to trigger activating transcription factor 6 (ATF6), which has also been implicated in airway remodeling in asthma (80). However, the role of ORMDL3 in ER driven asthma pathology remains to be resolved (81, 82).
Analyses of 42 Genes Identified in the Current Study Provide Significant Opportunities for Drug Development and Or/Repurposing
Of the 37 candidate genes and five strongest predicted genes, drugs for GATA3, IL33, IL1RL1, SMAD3, and TSLP are either already in use or in clinical trials for asthma, clearly validating these genes from our pipeline as therapeutic targets. Drugs supported by genetic evidence are twice as likely to go through the drug development pipeline, be successful in Phases II and III and ultimately go into clinic (83). Drugs that target MUC5AC (ENSITUXIMAB) and STAT6 (CHEMBL363332 and CHEMBL1374370) have emerged as potential avenues of future research via repurposing for severe asthma and show these two proteins are viable therapeutic targets. The PDCD1 and CD274 gene had the largest number of drug associations, albeit predominantly chemotherapy drugs. Although not a prominent gene to come out of this analysis, PDCD1 has been shown in a small study to be increased in asthma patients after whole lung allergen challenge (84). However, caution must be taken when interpreting drug-gene interactions. For example, there are many drugs available, which may offer a starting point for targeting of the HLA-DQA1/B1 genes such as azathioprine, which is an immunosuppressant already in use to treat rheumatoid arthritis, Crohn's disease and ulcerative colitis. However, in the blood cell dataset analysis, HLA-DQA1 was decreased in asthmatics indicating a lack of gene expression is linked to risk and therefore inhibitory drugs at best would be ineffective and at worst intensify the asthma phenotype.
A Move to Personalized Medicine
For any therapy to be truly effective in a disease such as asthma which is heterogenous, medicines need to be stratified based on evidence that that drug target and/or pathway is driving disease and genetic variants may help identify these individuals. The combination of variants may lead to a particular type of asthma such as IL33 high, which then may be amenable to therapy targeting IL33. Therefore, asthma studies which measure gene expression and also determine genotype offer the most comprehensive basis for understanding the effects of these signals and genes, as then risk allele, gene expression profile, and asthma phenotype can be bridged. For example, the rs11603634 signal, with candidate gene MUC5AC, is inherited in ~50% of the European population. The airway epithelium datasets analyzed in this study showed increased expression of MUC5AC and a brief analysis in the original GWAS paper has shown the individuals homozygous for the risk allele, A, show increased MUC5AC expression compared to homozygous non-risk allele, C, individuals (7). Together these results indicate MUC5AC is a strong candidate for inhibitor therapy particularly for individuals that carry the risk allele.
On the other hand, signal rs61816761 (candidate gene FLG) is inherited in ~2% of the European population and was highly specific in only associating with eczema/dermatitis in addition to asthma. This signal includes a loss of function variant and results from this study are consistent with the literature which indicate loss of function variants in the gene are associated with asthma in children with eczema (23). Therefore, therapy for these individuals would require restoring the loss of either FLG itself or of another molecule in its pathway but would probably only be effective in individuals with this variant. Prediction analysis in this study revealed novel physical interactions with CASP14 and PCSK6 and co-expressional interactions with PRL, CASP14, and LRRC32. These interactions may be compromised in subjects with this variant and are options for future exploration.
Therefore, any therapy, including those being investigated for repurposing in asthma, should be stratified and targeted to take into account the individual's genotype. There is previous proof of concept for this e.g., the prevention of asthma exacerbation by the IL4R antagonist, pitrakinra was shown to be effective in carriers of specific IL4R genotypes, although the specific mechanism is not known at this time (85).
Conclusions
The results from this study replicate and importantly extend previous GWAS translational study findings. A study by Dong et al. which integrated eQTL data and GWAS summary data, using Sherlock Bayesian analysis, identified 11 candidate genes implicated in severe asthma of which four genes (HLA-DQA1, GNGT2, STAT6, and SLC22A5) overlap with the genes identified through our pipeline (86). Furthermore, a study by El-Husseini et al. which focused on druggable candidate genes identified through GWAS and eQTL analysis also showed overlap with the genes identified in this study notably SLC22A4 and SUOX (87). Collectively, these results provide direct support for the role of 37 candidate causal genes in moderate to severe asthma pathological mechanisms and indirect evidence through interaction for an additional five genes. Overall, the findings demonstrate the contribution of altered airway structural cell and inflammatory cell mechanisms underlying asthma including novel inferences regarding genes not previously identified as potentially contributing to asthma. These genes and pathways can form the basis of novel drug development and/or drug repurposing with the aim to treat moderate to severe asthma where there is an unmet clinical need potentially in a stratified approach using genetics to guide therapy to the individual patient.
Data Availability Statement
Publicly available datasets were analyzed in this study. This data can be found at: GEO GSE69683; https://www.ncbi.nlm.nih.gov/geo/query/acc.cgi?acc=GSE69683, GEO GSE43696; https://www.ncbi.nlm.nih.gov/geo/query/acc.cgi?acc=GSE43696.
Author Contributions
IS conceived the study, contributed to the design, and contributed to writing the manuscript. SH, YG, and IA provided U-BIOPRED datasets and contributed to drafting the manuscript. MP and KR carried out the analysis and wrote the manuscript. All authors contributed to the article and approved the submitted version.
Funding
The IS laboratory receives grant support from Asthma UK, British Lung Foundation, NIHR, MRC, GSK, NC3Rs, BBSRC, and Boehringer Ingelheim. The U-BIOPRED initiative was funded by Innovative Medicines Initiative (EU-IMI 115010). The Genotype-Tissue Expression (GTEx) Project was supported by the Common Fund of the Office of the Director of the National Institutes of Health, and by NCI, NHGRI, NHLBI, NIDA, NIMH, and NINDS. The data used for the analyses described in this manuscript were obtained from the GTEx Portal on 16/06/2020.
Conflict of Interest
The authors declare that the research was conducted in the absence of any commercial or financial relationships that could be construed as a potential conflict of interest.
Publisher's Note
All claims expressed in this article are solely those of the authors and do not necessarily represent those of their affiliated organizations, or those of the publisher, the editors and the reviewers. Any product that may be evaluated in this article, or claim that may be made by its manufacturer, is not guaranteed or endorsed by the publisher.
Supplementary Material
The Supplementary Material for this article can be found online at: https://www.frontiersin.org/articles/10.3389/falgy.2021.738741/full#supplementary-material
References
1. Disease GBD, Injury I, Prevalence C. Global, regional, and national incidence, prevalence, and years lived with disability for 328 diseases and injuries for 195 countries, 1990-2016: a systematic analysis for the Global Burden of Disease Study 2016. Lancet. (2017) 390:1211–59. doi: 10.1016/S0140-6736(17)32154-2
2. Hekking PW, Wener RR, Amelink M, Zwinderman AH, Bouvy ML, Bel EH. The prevalence of severe refractory asthma. J Allergy Clin Immunol. (2015) 135:896–902. doi: 10.1016/j.jaci.2014.08.042
3. Moffatt MF, Gut IG, Demenais F, Strachan DP, Bouzigon E, Heath S, et al. A large-scale, consortium-based genomewide association study of asthma. N Engl J Med. (2010) 363:1211–21. doi: 10.1056/NEJMoa0906312
4. Torgerson DG, Ampleford EJ, Chiu GY, Gauderman WJ, Gignoux CR, Graves PE, et al. Meta-analysis of genome-wide association studies of asthma in ethnically diverse North American populations. Nat Genet. (2011) 43:887–92. doi: 10.1038/ng.888
5. Demenais F, Margaritte-Jeannin P, Barnes KC, Cookson WOC, Altmuller J, Ang W, et al. Multiancestry association study identifies new asthma risk loci that colocalize with immune-cell enhancer marks. Nat Genet. (2018) 50:42–53. doi: 10.1038/s41588-017-0014-7
6. Akhabir L, Sandford AJ. Genome-wide association studies for discovery of genes involved in asthma. Respirology. (2011) 16:396–406. doi: 10.1111/j.1440-1843.2011.01939.x
7. Shrine N, Portelli MA, John C, Soler Artigas M, Bennett N, Hall R, et al. Moderate-to-severe asthma in individuals of European ancestry: a genome-wide association study. Lancet Respir Med. (2019) 7:20–34. doi: 10.1016/S2213-2600(18)30389-8
8. Kim KW, Ober C. Lessons learned from GWAS of asthma. Allergy Asthma Immunol Res. (2019) 11:170–87. doi: 10.4168/aair.2019.11.2.170
9. Vicente CT, Revez JA, Ferreira MAR. Lessons from 10 years of genome-wide association studies of asthma. Clin Transl Immunol. (2017) 6:e165. doi: 10.1038/cti.2017.54
10. Claar DD, Larkin EK, Bastarache L, Blackwell TS, Loyd JE, Hartert TV, et al. A phenome-wide association study identifies a novel asthma risk locus near TERC. Am J Respir Crit Care Med. (2016) 193:98–100. doi: 10.1164/rccm.201507-1267LE
11. Roden DM. Phenome-wide association studies: a new method for functional genomics in humans. J Physiol. (2017) 595:4109–15. doi: 10.1113/JP273122
12. Diogo D, Tian C, Franklin CS, Alanne-Kinnunen M, March M, Spencer CCA, et al. Phenome-wide association studies across large population cohorts support drug target validation. Nat Commun. (2018) 9:4285. doi: 10.1038/s41467-018-06540-3
13. Bhatia S, Kleinjan DA. Disruption of long-range gene regulation in human genetic disease: a kaleidoscope of general principles, diverse mechanisms and unique phenotypic consequences. Hum Genet. (2014) 133:815–45. doi: 10.1007/s00439-014-1424-6
14. Maurano MT, Humbert R, Rynes E, Thurman RE, Haugen E, Wang H, et al. Systematic localization of common disease-associated variation in regulatory DNA. Science. (2012) 337:1190–5. doi: 10.1126/science.1222794
15. Li X, Hastie AT, Hawkins GA, Moore WC, Ampleford EJ, Milosevic J, et al. eQTL of bronchial epithelial cells and bronchial alveolar lavage deciphers GWAS-identified asthma genes. Allergy. (2015) 70:1309–18. doi: 10.1111/all.12683
16. Ghosh D, Ding L, Bernstein JA, Mersha TB. The utility of resolving asthma molecular signatures using tissue-specific transcriptome data. G3. (2020) 10:4049–62. doi: 10.1534/g3.120.401718
17. Canela-Xandri O, Rawlik K, Tenesa A. An atlas of genetic associations in UK Biobank. Nat Genet. (2018) 50:1593–9. doi: 10.1038/s41588-018-0248-z
18. Sudlow C, Gallacher J, Allen N, Beral V, Burton P, Danesh J, et al. UK biobank: an open access resource for identifying the causes of a wide range of complex diseases of middle and old age. PLoS Med. (2015) 12:e1001779. doi: 10.1371/journal.pmed.1001779
19. Carvalho-Silva D, Pierleoni A, Pignatelli M, Ong C, Fumis L, Karamanis N, et al. Open Targets Platform: new developments and updates 2 years on. Nucleic Acids Res. (2019) 47:D1056–D65. doi: 10.1093/nar/gky1133
20. Ward LD, Kellis M. HaploReg: a resource for exploring chromatin states, conservation, and regulatory motif alterations within sets of genetically linked variants. Nucleic Acids Res. (2012) 40:D930–4. doi: 10.1093/nar/gkr917
21. Machiela MJ, Chanock SJ. LDlink: a web-based application for exploring population-specific haplotype structure and linking correlated alleles of possible functional variants. Bioinformatics. (2015) 31:3555–7. doi: 10.1093/bioinformatics/btv402
22. Brown SJ, McLean WH. One remarkable molecule: filaggrin. J Invest Dermatol. (2012) 132:751–62. doi: 10.1038/jid.2011.393
23. Chan A, Terry W, Zhang H, Karmaus W, Ewart S, Holloway JW, et al. Filaggrin mutations increase allergic airway disease in childhood and adolescence through interactions with eczema and aeroallergen sensitization. Clin Exp Allergy. (2018) 48:147–55. doi: 10.1111/cea.13077
24. Hu Y, Comjean A, Mohr SE, FlyBase C, Perrimon N. Gene2 function: an integrated online resource for gene function discovery. G3. (2017) 7:2855–8. doi: 10.1534/g3.117.043885
25. UniProt C. UniProt: the universal protein knowledgebase in 2021. Nucleic Acids Res. (2021) 49:D480–D9.
26. Uhlen M, Fagerberg L, Hallstrom BM, Lindskog C, Oksvold P, Mardinoglu A, et al. Proteomics. Tissue-based map of the human proteome. Science. (2015) 347:1260419. doi: 10.1126/science.1260419
27. Edgar R, Domrachev M, Lash AE. Gene expression omnibus: NCBI gene expression and hybridization array data repository. Nucleic Acids Res. (2002) 30:207–10. doi: 10.1093/nar/30.1.207
28. Li X, Hawkins GA, Moore WC, Hastie AT, Ampleford EJ, Milosevic J, et al. Expression of asthma susceptibility genes in bronchial epithelial cells and bronchial alveolar lavage in the Severe Asthma Research Program (SARP) cohort. J Asthma. (2016) 53:775–82. doi: 10.3109/02770903.2016.1158268
29. Voraphani N, Gladwin MT, Contreras AU, Kaminski N, Tedrow JR, Milosevic J, et al. An airway epithelial iNOS-DUOX2-thyroid peroxidase metabolome drives Th1/Th2 nitrative stress in human severe asthma. Mucosal Immunol. (2014) 7:1175–85. doi: 10.1038/mi.2014.6
30. Bigler J, Boedigheimer M, Schofield JPR, Skipp PJ, Corfield J, Rowe A, et al. A severe asthma disease signature from gene expression profiling of peripheral blood from U-BIOPRED cohorts. Am J Respir Crit Care Med. (2017) 195:1311–20. doi: 10.1164/rccm.201604-0866OC
31. Huang da W, Sherman BT, Lempicki RA. Systematic and integrative analysis of large gene lists using DAVID bioinformatics resources. Nat Protoc. (2009) 4:44–57. doi: 10.1038/nprot.2008.211
32. Huang da W, Sherman BT, Lempicki RA. Bioinformatics enrichment tools: paths toward the comprehensive functional analysis of large gene lists. Nucleic Acids Res. (2009) 37:1–13. doi: 10.1093/nar/gkn923
33. Warde-Farley D, Donaldson SL, Comes O, Zuberi K, Badrawi R, Chao P, et al. The GeneMANIA prediction server: biological network integration for gene prioritization and predicting gene function. Nucleic Acids Res. (2010) 38:W214–20. doi: 10.1093/nar/gkq537
34. Griffith M, Griffith OL, Coffman AC, Weible JV, McMichael JF, Spies NC, et al. DGIdb: mining the druggable genome. Nat Methods. (2013) 10:1209–10. doi: 10.1038/nmeth.2689
35. Portelli MA, Hodge E, Sayers I. Genetic risk factors for the development of allergic disease identified by genome-wide association. Clin Exp Allergy. (2015) 45:21–31. doi: 10.1111/cea.12327
36. Ferreira MAR, Mathur R, Vonk JM, Szwajda A, Brumpton B, Granell R, et al. Genetic architectures of childhood- and adult-onset asthma are partly distinct. Am J Hum Genet. (2019) 104:665–84. doi: 10.1016/j.ajhg.2019.02.022
37. Li X, Ampleford EJ, Howard TD, Moore WC, Torgerson DG, Li H, et al. Genome-wide association studies of asthma indicate opposite immunopathogenesis direction from autoimmune diseases. J Allergy Clin Immunol. (2012) 130:861–8 e7. doi: 10.1016/j.jaci.2012.04.041
38. Silverberg MS, Cho JH, Rioux JD, McGovern DP, Wu J, Annese V, et al. Ulcerative colitis-risk loci on chromosomes 1p36 and 12q15 found by genome-wide association study. Nat Genet. (2009) 41:216–20. doi: 10.1038/ng.275
39. Bakakos A, Loukides S, Bakakos P. Severe eosinophilic asthma. J Clin Med. (2019) 8:91375. doi: 10.3390/jcm8091375
40. Leckie MJ, ten Brinke A, Khan J, Diamant Z, O'Connor BJ, Walls CM, et al. Effects of an interleukin-5 blocking monoclonal antibody on eosinophils, airway hyper-responsiveness, and the late asthmatic response. Lancet. (2000) 356:2144–8. doi: 10.1016/S0140-6736(00)03496-6
41. Khorasanizadeh M, Eskian M, Rezaei N. Reductions in eosinophil biomarkers by benralizumab in patients with asthma. Acta Med Iran. (2017) 55:352–3. doi: 10.1016/j.rmed.2016.01.003
42. Padilla-Galo A, Levy-Abitbol R, Olveira C, Valencia Azcona B, Perez Morales M, Rivas-Ruiz F, et al. Real-life experience with benralizumab during 6 months. BMC Pulm Med. (2020) 20:184. doi: 10.1186/s12890-020-01220-9
43. Virchow JC, McDonald M, Garin M, Korn S. Reslizumab as add-on therapy in patients with refractory asthma. BMJ Open Respir Res. (2020) 7:494. doi: 10.1136/bmjresp-2019-000494
44. Carr TF, Zeki AA, Kraft M. Eosinophilic and non-eosinophilic asthma. Am J Respir Crit Care Med. (2018) 197:22–37. doi: 10.1164/rccm.201611-2232PP
45. Crisford H, Sapey E, Rogers GB, Taylor S, Nagakumar P, Lokwani R, et al. Neutrophils in asthma: the good, the bad and the bacteria. Thorax. (2021). doi: 10.1136/thoraxjnl-2020-215986
46. Das S, Miller M, Broide DH. Chromosome 17q21 genes ORMDL3 and GSDMB in asthma and immune diseases. Adv Immunol. (2017) 135:1–52. doi: 10.1016/bs.ai.2017.06.001
47. Stein MM, Thompson EE, Schoettler N, Helling BA, Magnaye KM, Stanhope C, et al. A decade of research on the 17q12-21 asthma locus: Piecing together the puzzle. J Allergy Clin Immunol. (2018) 142:749–64 e3. doi: 10.1016/j.jaci.2017.12.974
48. Connolly DJ, O'Neill LA, McGettrick AF. The GOLD domain-containing protein TMED1 is involved in interleukin-33 signaling. J Biol Chem. (2013) 288:5616–23. doi: 10.1074/jbc.M112.403899
49. Makrinioti H, Toussaint M, Jackson DJ, Walton RP, Johnston SL. Role of interleukin 33 in respiratory allergy and asthma. Lancet Respir Med. (2014) 2:226–37. doi: 10.1016/S2213-2600(13)70261-3
50. Gordon ED, Palandra J, Wesolowska-Andersen A, Ringel L, Rios CL, Lachowicz-Scroggins ME, et al. IL1RL1 asthma risk variants regulate airway type 2 inflammation. JCI Insight. (2016) 1:e87871. doi: 10.1172/jci.insight.87871
51. Portelli MA, Dijk FN, Ketelaar ME, Shrine N, Hankinson J, Bhaker S, et al. Phenotypic and functional translation of IL1RL1 locus polymorphisms in lung tissue and asthmatic airway epithelium. JCI Insight. (2020) 5:132446. doi: 10.1172/jci.insight.132446
52. Heijink IH, Kuchibhotla VNS, Roffel MP, Maes T, Knight DA, Sayers I, et al. Epithelial cell dysfunction, a major driver of asthma development. Allergy. (2020) 75:1902–17. doi: 10.1111/all.14421
53. Holgate ST, Wenzel S, Postma DS, Weiss ST, Renz H, Sly PD. Asthma. Nat Rev Dis Primers. (2015) 1:15025. doi: 10.1038/nrdp.2015.25
54. Bergeron C, Tulic MK, Hamid Q. Airway remodelling in asthma: from benchside to clinical practice. Can Respir J. (2010) 17:e85–93. doi: 10.1155/2010/318029
55. Pascual RM, Peters SP. Airway remodeling contributes to the progressive loss of lung function in asthma: an overview. J Allergy Clin Immunol. (2005) 116:477–86. doi: 10.1016/j.jaci.2005.07.011
56. Fehrenbach H, Wagner C, Wegmann M. Airway remodeling in asthma: what really matters. Cell Tissue Res. (2017) 367:551–69. doi: 10.1007/s00441-016-2566-8
57. Chetta A, Zanini A, Foresi A, Del Donno M, Castagnaro A, D'Ippolito R, et al. Vascular component of airway remodeling in asthma is reduced by high dose of fluticasone. Am J Respir Crit Care Med. (2003) 167:751–7. doi: 10.1164/rccm.200207-710OC
58. Hoshino M, Nakamura Y, Sim JJ, Yamashiro Y, Uchida K, Hosaka K, et al. Inhaled corticosteroid reduced lamina reticularis of the basement membrane by modulation of insulin-like growth factor (IGF)-I expression in bronchial asthma. Clin Exp Allergy. (1998) 28:568–77. doi: 10.1046/j.1365-2222.1998.00277.x
59. Murdoch JR, Lloyd CM. Chronic inflammation and asthma. Mutat Res. (2010) 690:24–39. doi: 10.1016/j.mrfmmm.2009.09.005
60. Young HW, Williams OW, Chandra D, Bellinghausen LK, Perez G, Suarez A, et al. Central role of Muc5ac expression in mucous metaplasia and its regulation by conserved 5' elements. Am J Respir Cell Mol Biol. (2007) 37:273–90. doi: 10.1165/rcmb.2005-0460OC
61. Lachowicz-Scroggins ME, Yuan S, Kerr SC, Dunican EM, Yu M, Carrington SD, et al. Abnormalities in MUC5AC and MUC5B protein in airway mucus in asthma. Am J Respir Crit Care Med. (2016) 194:1296–9. doi: 10.1164/rccm.201603-0526LE
62. Atherton HC, Jones G, Danahay H. IL-13-induced changes in the goblet cell density of human bronchial epithelial cell cultures: MAP kinase and phosphatidylinositol 3-kinase regulation. Am J Physiol Lung Cell Mol Physiol. (2003) 285:L730–9. doi: 10.1152/ajplung.00089.2003
63. Melen E, Kho AT, Sharma S, Gaedigk R, Leeder JS, Mariani TJ, et al. Expression analysis of asthma candidate genes during human and murine lung development. Respir Res. (2011) 12:86. doi: 10.1186/1465-9921-12-86
64. Acevedo N, Saaf A, Soderhall C, Melen E, Mandelin J, Pietras CO, et al. Interaction between retinoid acid receptor-related orphan receptor alpha (RORA) and neuropeptide S receptor 1 (NPSR1) in asthma. PLoS ONE. (2013) 8:e60111. doi: 10.1371/journal.pone.0060111
65. Kuwahara M, Ise W, Ochi M, Suzuki J, Kometani K, Maruyama S, et al. Bach2-Batf interactions control Th2-type immune response by regulating the IL-4 amplification loop. Nat Commun. (2016) 7:12596. doi: 10.1038/ncomms12596
66. Yang L, Chen S, Zhao Q, Sun Y, Nie H. The critical role of Bach2 in shaping the balance between CD4(+) T cell subsets in immune-mediated diseases. Mediators Inflamm. (2019) 2019:2609737. doi: 10.1155/2019/2609737
67. Pelaia G, Vatrella A, Busceti MT, Gallelli L, Calabrese C, Terracciano R, et al. Cellular mechanisms underlying eosinophilic and neutrophilic airway inflammation in asthma. Mediators Inflamm. (2015) 2015:879783. doi: 10.1155/2015/879783
68. Marone G, Spadaro G, Braile M, Poto R, Criscuolo G, Pahima H, et al. Tezepelumab: a novel biological therapy for the treatment of severe uncontrolled asthma. Expert Opin Investig Drugs. (2019) 28:931–40. doi: 10.1080/13543784.2019.1672657
69. Lambrecht BN, Hammad H. The immunology of asthma. Nat Immunol. (2015) 16:45–56. doi: 10.1038/ni.3049
70. Zhu G, Whyte MK, Vestbo J, Carlsen K, Carlsen KH, Lenney W, et al. Interleukin 18 receptor 1 gene polymorphisms are associated with asthma. Eur J Hum Genet. (2008) 16:1083–90. doi: 10.1038/ejhg.2008.67
71. Nakanishi K, Yoshimoto T, Tsutsui H, Okamura H. Interleukin-18 regulates both Th1 and Th2 responses. Annu Rev Immunol. (2001) 19:423–74. doi: 10.1146/annurev.immunol.19.1.423
72. Dinarello CA. IL-18: A TH1-inducing, pro-inflammatory cytokine and new member of the IL-1 family. J Allergy Clin Immunol. (1999) 103:11–24. doi: 10.1016/S0091-6749(99)70518-X
73. Yoshimoto T, Mizutani H, Tsutsui H, Noben-Trauth N, Yamanaka K, Tanaka M, et al. IL-18 induction of IgE: dependence on CD4+ T cells, IL-4 and STAT6. Nat Immunol. (2000) 1:132–7. doi: 10.1038/77811
74. Smith-Garvin JE, Koretzky GA, Jordan MS. T cell activation. Annu Rev Immunol. (2009) 27:591–619. doi: 10.1146/annurev.immunol.021908.132706
75. Gelfand EW, Joetham A, Wang M, Takeda K, Schedel M. Spectrum of T-lymphocyte activities regulating allergic lung inflammation. Immunol Rev. (2017) 278:63–86. doi: 10.1111/imr.12561
76. Eldor R, Klieger Y, Sade-Feldman M, Vaknin I, Varfolomeev I, Fuchs C, et al. CD247, a novel T cell-derived diagnostic and prognostic biomarker for detecting disease progression and severity in patients with type 2 diabetes. Diabetes Care. (2015) 38:113–8. doi: 10.2337/dc14-1544
77. Kontakioti E, Domvri K, Papakosta D, Daniilidis M. HLA and asthma phenotypes/endotypes: a review. Hum Immunol. (2014) 75:930–9. doi: 10.1016/j.humimm.2014.06.022
78. Pathinayake PS, Hsu AC, Waters DW, Hansbro PM, Wood LG, Wark PAB. Understanding the unfolded protein response in the pathogenesis of asthma. Front Immunol. (2018) 9:175. doi: 10.3389/fimmu.2018.00175
79. Miao K, Zhang L, Pan T, Wang Y. Update on the role of endoplasmic reticulum stress in asthma. Am J Transl Res. (2020) 12:1168–83.
80. Miller M, Tam AB, Cho JY, Doherty TA, Pham A, Khorram N, et al. ORMDL3 is an inducible lung epithelial gene regulating metalloproteases, chemokines, OAS, and ATF6. Proc Natl Acad Sci USA. (2012) 109:16648–53. doi: 10.1073/pnas.1204151109
81. Hsu KJ, Turvey SE. Functional analysis of the impact of ORMDL3 expression on inflammation and activation of the unfolded protein response in human airway epithelial cells. Allergy Asthma Clin Immunol. (2013) 9:4. doi: 10.1186/1710-1492-9-4
82. Debeuf N, Zhakupova A, Steiner R, Van Gassen S, Deswarte K, Fayazpour F, et al. The ORMDL3 asthma susceptibility gene regulates systemic ceramide levels without altering key asthma features in mice. J Allergy Clin Immunol. (2019) 144:1648–59 e9. doi: 10.1016/j.jaci.2019.06.041
83. King EA, Davis JW, Degner JF. Are drug targets with genetic support twice as likely to be approved? Revised estimates of the impact of genetic support for drug mechanisms on the probability of drug approval. PLoS Genet. (2019) 15:e1008489. doi: 10.1371/journal.pgen.1008489
84. Esnault S, Kelly EA, Schwantes EA, Liu LY, DeLain LP, Hauer JA, et al. Identification of genes expressed by human airway eosinophils after an in vivo allergen challenge. PLoS ONE. (2013) 8:e67560. doi: 10.1371/journal.pone.0067560
85. Slager RE, Otulana BA, Hawkins GA, Yen YP, Peters SP, Wenzel SE, et al. IL-4 receptor polymorphisms predict reduction in asthma exacerbations during response to an anti-IL-4 receptor alpha antagonist. J Allergy Clin Immunol. (2012) 130:516–22 e4. doi: 10.1016/j.jaci.2012.03.030
86. Dong Z, Ma Y, Zhou H, Shi L, Ye G, Yang L, et al. Integrated genomics analysis highlights important SNPs and genes implicated in moderate-to-severe asthma based on GWAS and eQTL datasets. BMC Pulm Med. (2020) 20:270. doi: 10.1186/s12890-020-01303-7
Keywords: GWAS, causal genes, eQTL, SNP, moderate to severe asthma
Citation: Portelli MA, Rakkar K, Hu S, Guo Y, Adcock IM and Sayers I (2021) Translational Analysis of Moderate to Severe Asthma GWAS Signals Into Candidate Causal Genes and Their Functional, Tissue-Dependent and Disease-Related Associations. Front. Allergy 2:738741. doi: 10.3389/falgy.2021.738741
Received: 09 July 2021; Accepted: 06 September 2021;
Published: 18 October 2021.
Edited by:
Reinoud Gosens, University of Groningen, NetherlandsReviewed by:
Lena Uller, Lund University, SwedenJinming Gao, Peking Union Medical College Hospital (CAMS), China
Copyright © 2021 Portelli, Rakkar, Hu, Guo, Adcock and Sayers. This is an open-access article distributed under the terms of the Creative Commons Attribution License (CC BY). The use, distribution or reproduction in other forums is permitted, provided the original author(s) and the copyright owner(s) are credited and that the original publication in this journal is cited, in accordance with accepted academic practice. No use, distribution or reproduction is permitted which does not comply with these terms.
*Correspondence: Kamini Rakkar, a2FtaW5pLnJha2thcjJAbm90dGluZ2hhbS5hYy51aw==
†These authors have contributed equally to this work and share first authorship