 Megan Verdon
 Brian Horton
 Richard Rawnsley
- College of Science and Engineering, Tasmanian Institute of Agriculture, University of Tasmania, Hobart, TAS, Australia
Virtual fencing contains and controls grazing cattle using sensory cues rather than physical fences. The technology comprises a neckband-mounted device that delivers an audio cue when the animal nears a virtual boundary that has been set via global positioning system, followed by an electrical stimulus if it walks beyond the boundary. Virtual fencing has successfully been used to intensively graze cattle using a simple virtual front-fence, but a more complex intensive grazing system comprising moving virtual front and back-fences has not been assessed. We studied the effectiveness of virtual fencing technology to contain groups of Angus heifers within grazing cells defined by semi-permanent electric side-fences and virtual front and back-fences, compared to groups of heifers contained in cells defined only by electric fencing. Four groups of 10 Angus heifers were randomly allocated to a “control” (grazed with a conventional electric front and back-fence, n = 2 groups) or “virtual fence” treatment (grazed with a virtual front and back-fence, n = 2 groups). The groups of heifers grazed four adjacent experimental paddocks that were established using TechnoGrazing™ infrastructure. An estimated 9.5 kg pasture DM/heifer.day was offered in each of three 3 day allocations (9 day study period). Data collected include cues delivered by the neckbands, time beyond the virtual boundaries, pasture consumption for each allocation and heifer live weight changes over the study period. The virtual front and back-fences successfully contained one group of heifers in their grazing cell, but the second group of heifers spent an increasing amount of time in the exclusion zone during the second and third allocations and consequently received an increasing number of audio and electrical stimuli. There were no effects of electric or virtual-fence treatment on live weight change or pasture utilization. By grazing heifers in adjacent paddocks our experimental design may have produced a motivation for some heifers to cross the virtual boundary to regain close contact with familiar conspecifics. Despite this, valuable learnings were gained from this study. Most notably, virtual fencing should not be used to manage cattle that have close visual contact to other mobs. We conclude that the successful application of virtual fencing technology needs to accommodate the natural behaviors of cattle.
Introduction
Virtual fencing is an emerging technology that contains and controls grazing cattle using sensory cues rather than physical fences. The technology comprises a neckband-mounted device that delivers an audio cue when the animal nears a virtual boundary that has been set via global positioning system (e.g., Campbell et al., 2019; Lomax et al., 2019; Langworthy et al., 2021). An electrical stimulus is delivered by the device if, following the audio cue, the animal walks beyond the virtual boundary, but not if it stops walking or turns back. This type of training is termed positive punishment and is the same as that used to train cattle to electric fences. In both cases, administration of the aversive electrical stimulus following the undesired behavior (i.e., physical interaction with the electric fence or progressing beyond the virtual boundary after an audio cue) results in the behavior becoming less likely in the future. Cattle quickly learn the association between audio cue and a pending electrical stimulus, and over time increasingly respond to the audio cue alone (Campbell et al., 2019; Langworthy et al., 2021). Thus, virtual fencing affords a flexibility to grazing management that has the potential to revolutionize pastoral livestock production.
The productivity and profitability of grazing beef enterprises depend upon maximizing pasture consumption (Oddy and Allen, 2001). However, survey data suggests that only 30–35% of pasture grown on beef farms in southern Australia is utilized by the animals (Johnson, 2018). More intensive grazing techniques, such as rotational grazing, are one simple way of increasing pasture utilization (Stafford and Gregory, 2008; Baumont et al., 2014). Cell-grazing is an example of an intensified version of rotational grazing that groups cattle at high stocking densities and moves them through a series of small paddocks (i.e., cells). Techno-grazing™ infrastructure facilitates cell-grazing by dividing a larger paddock into lanes using semi-permanent electric fencing, with each lane capable of being further divided into cells using temporary electric front and back-fencing. This grazing system improves pasture utilization and beef production per hectare (Hebart et al., 2004), but uptake of the technology may be impeded by the increased labor and fencing requirements.
Virtual fencing could remove some of these barriers and facilitate the intensification of grazing management for grazing beef cattle. Australian research using an experimental prototype of virtual fencing technology (eShepherd®) shows that beef cattle in extensive grazing systems are successfully maintained behind a moving virtual front-fence (Campbell et al., 2017) and the technology can be used to exclude cattle from environmentally sensitive areas (Campbell et al., 2018, 2020), while dairy cattle in intensive grazing systems are prevented from accessing fresh pasture beyond a virtual front-fence (Lomax et al., 2019; Langworthy et al., 2021). The application of virtual fencing technology to intensively graze beef cattle has not been demonstrated, however, nor has it been applied to manage sophisticated grazing regimes such as those involving more than one virtual boundary.
The objective of this study was to utilize the pre-commercial eShepherd® system to cell-graze groups of Angus cattle in paddocks with established Technograzing™ infrastructure. Previous studies have successfully intensively grazed dairy cattle using a simple virtual front-fence, but a more complex intensive grazing system comprising moving virtual front and back-fences has not been assessed. Thus, the present study compared the effectiveness of virtual fencing technology to contain Angus heifers within grazing cells defined by semi-permanent electric side-fences and virtual front and back-fences to heifers contained in cells defined only by electric fencing. We predicted that the technology will limit cattle access to fresh pasture in the excluded area beyond the virtual fences with 99% efficacy (which is comparable to efficacies reported in dairy cattle, Lomax et al., 2019; Langworthy et al., 2021), resulting in similar pasture utilization and live weight changes between the groups.
Materials and Methods
Ethical Statement
All animal procedures were conducted with prior institutional animal ethics approval (University of Tasmania Animal Ethics Committee A0018282) under the requirement of the Tasmanian Animal Welfare Act (1993) in accordance with the National Health and Medical Research Council/Commonwealth Scientific and Industrial Research Organisation/Australian Animal Commission Australian Code of Practice for the Care and Use of Animals for Scientific Purposes.
Animals and Housing
This experiment was conducted over 25 days during early-spring at the Tasmanian Institute of Agricultural Dairy Research Facility (TDRF) (41°08′S, 145°77′E; 155.0 m a.m.s.l), Elliott, north-west Tasmania, Australia. Environmental conditions during the experimental period are detailed in Table 1.
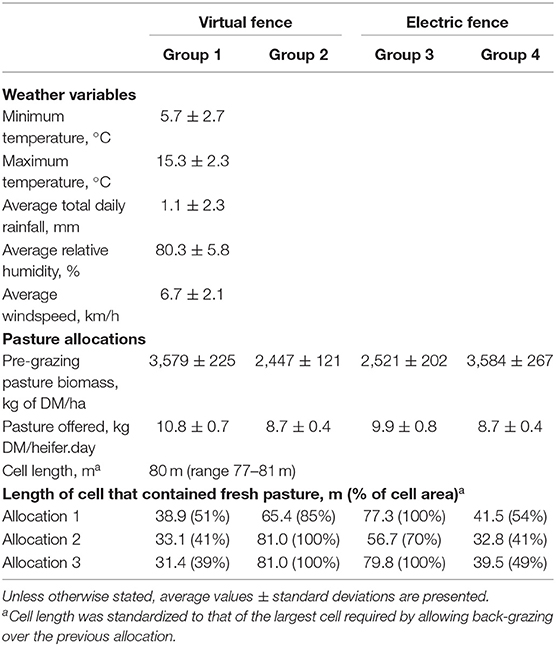
Table 1. Details relating to weather during the 25 day experimental period and pasture allocations for the four groups of heifers studied.
Forty Angus heifers (Bos taurus L.) that were naïve to virtual fencing were allocated to the experiment and grazed perennial ryegrass-based pastures for its duration (Lolium perenne L; ≥80%). A timeline of the experimental protocol is presented in Figure 1. The commercially reared animals were sourced from stock markets for the purpose of this experiment, meaning that their exact ages and origins were unknown. They were brought onto the research site 6 weeks prior to the commencement of the experiment and cell grazed using electric fencing for 4 weeks prior to the commencement of the experiment. Cell-grazing involves frequently moving animals through a series of small paddocks (i.e., cells) at high stocking densities. This pre-exposure ensured heifers were familiar with one another and experienced with intensive grazing and handling before introduction to virtual fencing technology. All heifers were weighed in a crush and fitted with eShepherd® neckbands (described below) 1 week prior to the commencement of the experiment. The neckband remained deactivated for this period. Heifer weights were obtained on day 1 of the experiment and used to assign animals to one of four groups of 10, ensuring that average weight and standard deviation in weight were comparable between the groups [average body weight ± standard deviation (sd) 399.1 ± 31.9 kg].
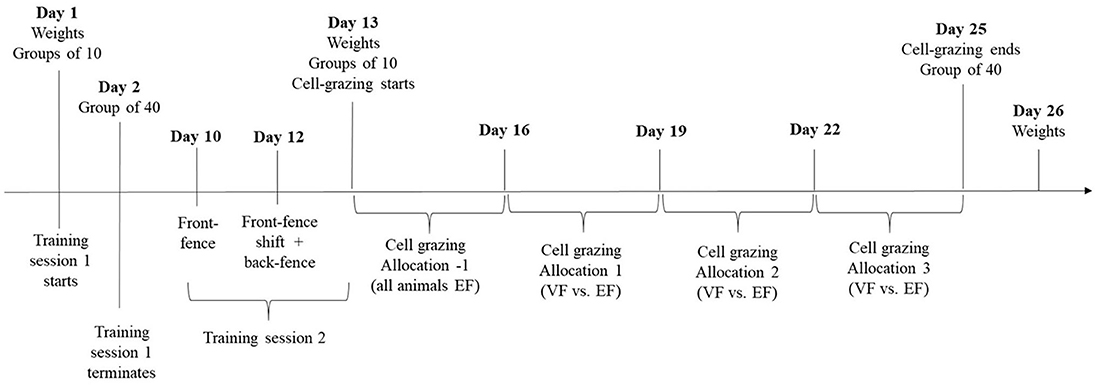
Figure 1. Experimental timeline. Four groups of 10 naïve heifers underwent an initial virtual fencing training session in four adjacent paddocks. This was canceled after 5.5 h when, for reasons unknown, there was movement of heifers beyond the virtual boundary. Heifers were returned to a single mob of 40 animals. A second and successful 3 day training session was conducted 8 days later. The modified training session incorporated a moving virtual front-fence and virtual back-fence. After training the 40 heifers were weighed and drafted into one of four groups of 10 animals. Groups were allocated to a virtual or electric-fence treatment before being moved to their respective paddocks and studied over four 3 day grazing allocations. All animals were contained with electric fencing for the first allocation which served as an adjustment period (allocation −1). Groups were managed with electric (EF) or virtual-fences (VF) for subsequent 3 day grazing allocations. Heifers were returned to a group of 40 animals and weighed at the end of the 12 days of cell-grazing.
The eShepherd® Neckbands
A virtual fencing pre-commercial prototype (eShepherd®, Agersens, Melbourne, VIC, Australia) system was used in this trial and has been described by Campbell et al. (2020). The neckband worn by the cattle consisted of a strap and hanging counterweight (total weight ~1.4 kg) and a unit (~725 g and dimensions 170 mm L × 120 mm W × 140 mm H), positioned on top of the animal's neck. The heifers wore eShepherd® neckbands for the entire experiment. Each neckband device used uncorrected global positioning system (GPS) fixes to determine the heifer's proximity to virtual fences (standard deviation in GPS position was 8 m). The location and activation status of virtual fences was controlled by a cloud-based web interface, which communicated with eShepherd® neckband devices via a wireless radio frequency link (base station). As a heifer approached the virtual fence boundary the neckband device emitted a distinctive but non-aversive audio tone within the animals hearing range. No electrical stimulus was applied if the audio cue caused the heifer to stop moving forward or turn away. If the heifer continued to move through the virtual fence into the exclusion zone, the unit delivered a short, sharp electrical pulse sequence in the kilovolt range. The intensity of the pulse stimulus delivered by the neckband was lower in energy than an electric fence. The precise values of the electrical pulse are commercial-in-confidence. This sequence of an audio followed by the electrical pulse was repeated if the heifer continued to walk through the fence line and further into the exclusion zone. No stimuli were applied if the heifer turned around to re-enter the inclusion zone. This algorithm design functions to “herd” the animals back out of the exclusion zone after entry. Stimuli were not applied if heifer movement occurred above a specified velocity (values are commercial-in-confidence). As a safety feature to limit the maximum number of consecutive pulses an animal could receive, the device entered standby mode and stimuli were not applied for a specified time frame if an individual received a specified number of pulses within a specified timeframe (all values are commercial-in-confidence). The natural grazing behavioral pattern of movement forward and then stopping can mimic a correct response by the animal to the audio cues, meaning an animal could slowly encroach further into the exclusion zone without receiving an electrical pulse. Therefore, if an animal received 3 consecutive audio cues while continuing to slowly move forward then stopping, an electrical pulse was applied. This sequence will hereon be called the “grazing function.” A base station was set up adjacent to the trial paddock that communicated with the neckbands, and animal activity was able to be monitored in real time through an online user-interface. The incidence and timing of the delivery of audio cues and electrical stimuli, the time heifers spent beyond the virtual boundary (i.e., in the exclusion zone) and GPS locations were stored on a removable SD card within the device for later download.
Training to Virtual Fencing
The training of heifers to the virtual fencing technology commenced at day 1 of the experiment. Four adjacent training paddocks were established using TechnoGrazing™ infrastructure, which uses permanent electric fences to divide a larger area of land into long narrow lanes. Temporary electric fencing can be placed across these lanes to create back and front-fences thereby forming a grazing cell. Perimeters of each long narrow paddock (width 38 m, length 365 m) were defined by a single-stranded galvanized electric fence and contained a minimum of 2,200 kg pasture DM/h. Water was provided ad libitum via water troughs.
At day 1 of the experiment, the mob of 40 heifers were drafted into their respective groups of 10 which were sequentially moved to one of the four paddocks for training. The final group of heifers entered their training paddock at 1540 h. A virtual front-fence was activated at 1630 h to create a 60 × 38 m cell for each group of 10 heifers. There was no visual indication of the location of this front-fence. For reasons that remain unknown, at around midnight there was a mass and rapid movement of all heifers beyond this virtual boundary (Supplementary Figure 1) during which animals moved up to 650 m out of their cell. Accordingly, the virtual fence was deactivated. It is important to note that the virtual fence had successfully contained animals in their cell up until this point. The following morning the animals were returned to their pre-experimental paddock and subjected to the pre-experimental management regime (cell-grazing as a single mob of 40 animals) for 8 days before undergoing a modified training protocol as described below.
The second training session was conducted over 3 days in a 2.3-ha paddock that was bordered by a minimum 3-strand galvanized electric fence. Heifers remained in a single mob of 40 animals for this training session. A virtual front-fence divided the training paddock so that animals were contained within a 1 ha inclusion zone (i.e., area in which animals could move freely) that had >3,000 kg pasture DM/ha. Water was provided ad libitum via water troughs within inclusion zones. After 2 days, the virtual front-fence was moved forward 50-meters so that animals were provided with access to fresh pasture. A virtual back-fence was activated once all the heifers had moved into the newly provided area, which took ~45 min. These steps introduced heifers to the concept of a moving virtual-fence and a back-fence, both of which are required for a successful cell-grazing regime. Heifers were left to graze in the new 1.2 ha inclusion zone for a further 24 h. All heifers had interacted with the virtual front-fence at the conclusion of training (i.e., received at least one audio cue). The average ± sd of total audio cues, total electrical pulses and ratio of electric pulses to audio cues over the 3 day training period were 60.2 ± 31.5, 8.9 ± 5.6 and 0.14 ± 0.05.
Cell-Grazing With Virtual or Electric-Fencing
Heifers were weighed in a crush and drafted into their four groups of 10 animals immediately following completion of the second training session (day 13, Figure 1). Groups were randomly assigned to one of two treatments (2 groups per treatment). Groups in the first treatment were cell-grazed using a conventional electric tape front and back-fence (control treatment). These animals continued to wear neckbands which enabled GPS tracking but no virtual fence was activated. Groups of heifers in the second treatment were cell-grazed using neckbands with a virtual front and back-fence activated (“virtual fence” treatment). As described in the first training attempt, four adjacent experimental paddocks were established using the TechnoGrazing™ system, but paddocks were in a different location to those used in the first training attempt. Perimeters of each long narrow paddock were defined by a single-stranded galvanized electric fence (width 38 m, length 650 m). Groups were sequentially moved to the experimental paddocks with the final group entering their cell at 1700 h. Paddocks 1 and 3 were designated as control treatments and paddocks 2 and 4 as virtual fence treatments.
Heifers were offered an estimated 9.5 kg pasture DM/heifer.day in four 3 day allocations (Figure 1). Water was always available ad libitum via water troughs. Considering the small group sizes in this experiment, a 3 day allocation was chosen to minimize the possible effects of a high stocking density and/or low total available area on the animal's ability to effectively respond to the technology. Heifers from both treatments were contained in their first allocation using an electric front and back-fence. This provided the animals opportunity to adjust to the new social grouping and paddock structure and will hereon be referred to as “allocation −1.” The next 3 day grazing allocation (hereon referred to as “allocation 1”) used a single front-fence and heifers were permitted to back-graze over their previous allocation. Subsequent 3 day grazing allocations (referred to as “allocation 2” and “allocation 3”) contained animals in cells with both a front and back-fence. Heifers were weighed at the end of the 12 days of cell-grazing.
Pre- and post-grazing pasture biomass estimates were taken immediately before and after each 3 day grazing allocation using an Ag Hub™ F200 electronic rising plate meter (Farmworks Systems, Feilding, New Zealand). In each cell, ~100 measurements of compressed pasture height were taken in a zigzag transact, averaged, and converted into pasture biomass (kg of DM/ha) using the following site-specific calibrated equation:
This equation was derived from Langworthy et al. (2021) and was created using perennial ryegrass swards taken in the same month of the previous year and at the same site as the present experiment. Estimated pasture intake for each group of heifers were then calculated from these data.
Movement of heifers to new pasture allocations proceeded as follows. Firstly, the amount of pasture DM in the cell to be grazed was determined allowing the length of the new grazing cell to be calculated. The positions of the front and back-fence (virtual or electric) for the new grazing allocations were then established. The length of each cell was standardized between groups by allowing groups in paddocks with a higher pasture biomass to back-graze over the previous allocation. Pre-grazing pasture biomass, length of fresh pasture offered (which may affect spatial distribution of cattle) and total cell length for each group of heifers are presented in Table 1. Heifers in the virtual-fence treatment were always moved before the control heifers by de-activating their current front-fence and activating the front-fence of the new cell. Heifers were monitored via the online user-interface and once they had moved into their new allocation the virtual back-fence was also activated. Only after this had happened was the electric front-fence removed for heifers in the control treatment, giving them access to their new pasture allocation. A new electric back-fence was then established.
Statistical Analysis
The neckbands did not record data on any day for two animals from VF group 2, or on experimental day 9 for one animal from VF group 1. These neckbands still delivered the signals to the animals but there were errors with internal data storage. All GPS data recorded by the neckbands were collated in a program written specifically for purpose in Free Pascal (www.freepascal.org). Spurious points outside the boundaries of the electric fence are known to be indicative of GPS drift and were removed. Due to the small dimensions associated with intensive grazing cells a total of 18% of GPS records were removed. It is important to note that GPS data were not analyzed and were only used for visual representation of the effectiveness of the virtual fences in containing cattle. Locational data were plotted using the same software program for each day in each allocation and for each group of animals. GPS data were recorded approximately once per second when animals were active within a specified distance from the virtual fence (value commercial-in-confidence), but this frequency reduced when the animals were inactive or at a distance from the virtual boundary (exact specifics of algorithm are commercial-in-confidence). Therefore, GPS positions were calculated as the mean position every 10 s.
The total number of audio cues and pulses received by each heifer per day and the total time heifers spent beyond the virtual boundary (i.e., in the exclusion zone) were calculated for the virtual fence groups. To prevent an inflation of correct responses to the audio cue, only one audio cue was retained for each activation of the grazing function. Grazing functions were identified as two or three audio cues separated by ≤ 25 s (the value determined to capture 95% of true grazing functions), which may or may not have been immediately followed by an electrical pulse. Like Campbell et al. (2020), pulses with values that fell 2 × sd below the average pulse value were deemed ineffective in their delivery due to technical failure and removed from the database (6% of pulse data).
Statistical analyses were carried out using linear mixed models (LMM) in the SPSS statistical software package (SPSS 26.0, SPSS Inc., Chicago, IL, USA). Variables were assessed for normality using visual methods (quantile-quantile plots and histograms) in combination with Shapiro-Wilks normality tests. Audio cue data were square root (plus one) transformed while data relating to the number of electrical stimuli and time spent in the exclusion zone were logarithmically (plus one) transformed prior to analysis so that residual variation was homogenous over allocations. The significance level α was set at P ≤ 0.05. To aid with interpretation, raw data are presented with transformed least square means (LSM) ± SEM (and backtransformed LSM) presented in Supplementary Table 1.
The number of audio cues and electrical stimuli received by heifers as well as time spent in the exclusion zone were analyzed for changes over grazing allocations (1 to 3) and days within grazing allocations (1 to 3). These analyses included the main effects of virtual fencing group (1 or 2), allocation, day, and their 2- and 3-way interactions. Non-significant interactions were removed from the model so that the main effects could be better interpreted. Each LMM accounted for repeated observations of heifers over days and allocations using a first order autoregressive matrix covariance. In the case of a significant effect the LSD test determined where LSM differed. The effects of treatment (electric vs. virtual fence) on end weight, weight change and estimated pasture consumption per heifer were analyzed with LMM. The individual animal was considered the experimental unit in the analysis of weight variables and each LMM included treatment as a fixed effect and group (1 to 4) as a random effect. The grazing cell was the experimental unit in the analysis of pasture consumption. This LMM included a fixed effect of treatment and accounted for repeated observations of groups over allocations using a first order autoregressive matrix covariance.
Results
Training
Heifers were successfully contained behind their virtual boundary for the first 5.5 h of the first training session. All but one heifer interacted with the virtual fence in this time, during which animals took an average (±sd) of 1.2 ± 0.6 interactions with the virtual fence to respond to the audio cue alone. This means that most animals responded appropriately to their first audio cue despite it never having been paired with an electrical pulse. Indeed, heifers did not experience an electrical pulse until they had interacted with the virtual fence on average (±sd) 3.4 ± 2.5 times. They took 2.4 ± 0.7 further interactions once they had experienced an audio cue paired with an electrical pulse to again respond to the audio cue alone. Over the entire 5.5 h period, the average proportion of interactions with the virtual fence that included an electrical pulse was 0.27 ± 0.15.
Average distance from the virtual fence and traveling speed of heifers in all four groups abruptly increased at ~90 s from midnight (Supplementary Figure 1). The reason for this behavioral change remains unknown but appears to have been initiated by heifers in group 4. The error bars from 23:58:40 in Supplementary Figures 1A,B suggests variation between individuals within a group in how fast and far animals moved into the exclusion zone, but all animals had crossed the virtual boundary by midnight.
Experience of the failed training session did not affect the ability of heifers to learn the association between audio and electrical stimuli in the second modified training session, as indicated by the low number of interactions with the virtual boundary before heifers responded to audio alone (means ± sd, 1.1 ± 0.36 interactions, range 1–3), the high number of interactions before they received their first pulse (5.9 ± 4.4 interactions, range 1–19) and the proportion of total interactions in which an electrical pulse was delivered (0.14 ± 0.04, range 0.07–0.22) over the 3 day training period.
Electric vs. Virtual-Fence
There were no effects of electric (EF) or virtual-fence (VF) treatment on heifer end weight [EF 445.5 ± 9.4 and VF 458.6 ± 7.9 kg; F(1, 38) = 1.1, P = 0.29], weight change [EF 8.1 ± 2.0 and VF 12.4 ± 1.5 kg; F(1, 37) = 1.2, P = 0.27] or estimated daily pasture consumption [EF 7.0 ± 0.19 and VF 7.2 ± 0.42 kg pasture per heifer; F(1, 3) = 0.39, P = 0.58].
Cell-Grazing With a Virtual Fence
The GPS plots presented in Figure 2 show the location of heifers in the virtual-fencing and control treatments for each day of each allocation. Heifers took on average (±sd) 1.4 ± 0.8 h to interact with the new virtual-front fence after the provision of a fresh allocation of pasture.
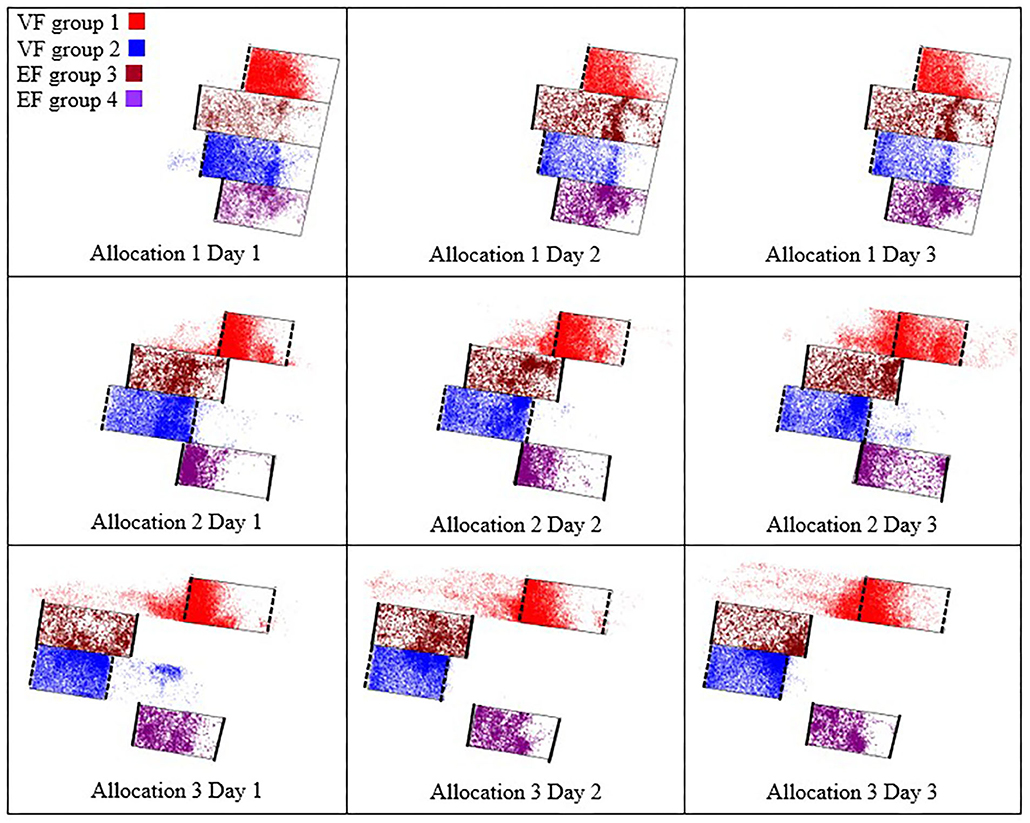
Figure 2. GPS locations of cattle recorded at 10 s intervals throughout each day. Left to right—day 1, 2, 3. Top to bottom—allocation 1, 2, 3. The external rectangle indicates the same relative GPS position for all days. Solid black lines indicate electric fences and dashed lines are virtual fences. GPS positions outside the boundaries of the electric fence are known to be incorrect readings and are not shown. The top left corner of each rectangle is latitude −41.0851, longitude 145.7723. The bottom right corner is 272 m east and 194 m south of that point.
The number of audio and electrical cues delivered to animals in the virtual fencing treatments was affected by a group × grazing allocation interaction [Audio: F(2, 120) = 4.7 P = 0.011; Electrical F(2, 117) = 4.1 P = 0.02; Figure 3]. An average of 114.3 audio cues and 42.3 electric pulses were delivered per heifer.day in VF group 1, compared to 48.1 audio cues and 9.1 electric pulses per heifer.day in VF group 2 (proportion of interactions that included an electric pulse of 0.81 and 0.63 for VF groups 1 and 2, respectively). The number of cues delivered during grazing allocation 1 were comparable between the two groups of VF heifers, but during allocations 2 and 3 heifers in VF group 1 received a higher number of audio and electrical cues than those in VF group 2. There was no effect of day within allocation on the number of cues delivered [Audio: F(2, 112) = 0.85 P = 0.43; Electrical: F(2, 111) = 2.5 P = 0.09]. As demonstrated in Supplementary Figure 2, interactions with the virtual fence followed a similar temporal pattern for heifers in both VF groups, peaking around sunset with fewer interactions overnight, and VF group 1 interacted with the virtual fence more than VF group 2 at all times of the day.
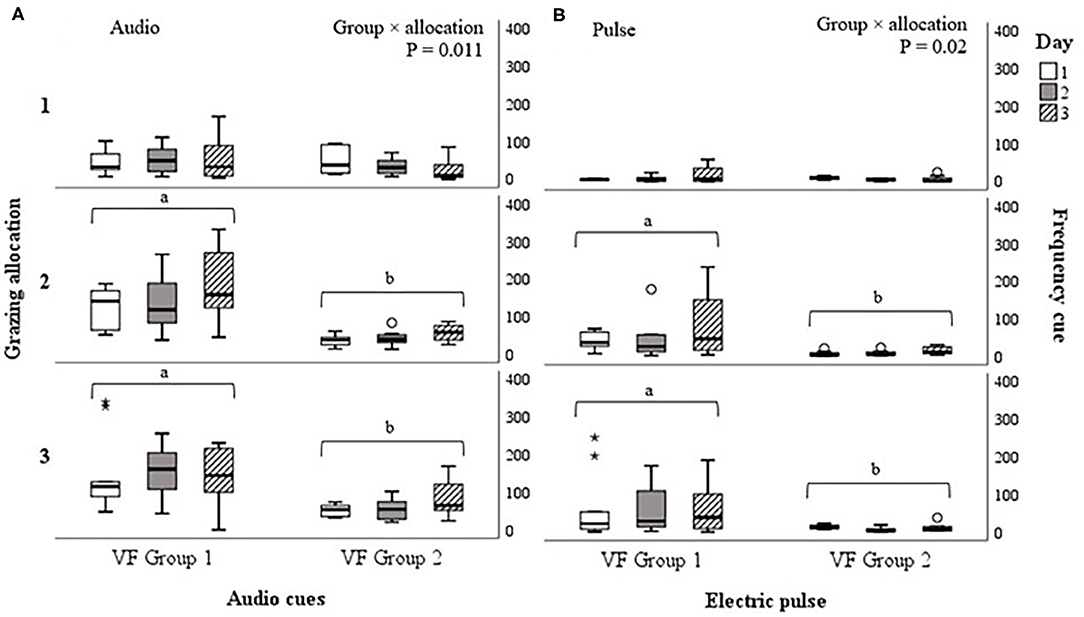
Figure 3. Number of (A) audio cues and (B) electric pulses delivered to heifers in VF group 1 and VF group 2, at each day (1, 2 or 3) of each grazing allocation (1, 2 or 3). Raw data are presented. Least square means ± standard errors are presented in Supplementary Table 1. Boxplots show the median and the first and third quartiles (25 and 75% of data), with whiskers extending to the lowest and highest values. Values >1.5 × the interquartile range (IQR) are indicated by 0 and >3 × the IQR are indicated by *. Different superscript lettersab show where means differ.
The time heifers spent beyond the virtual boundary (i.e., in the exclusion zone) was affected by a group × grazing allocation × day interaction [F(4, 114) = 7.6 P ≤ 0.001; Figure 4]. Heifers in both groups spent very little time beyond the virtual boundary during grazing allocation 1 (99.9% effective containment per day of allocation 1). Time in the exclusion zone increased during allocations 2 and 3, particularly for heifers in VF group 1. Effective containment per day for heifers in VF groups 1 and 2 were, respectively, 95 and 99% of time in allocation 2 and 92 and 98% of time in allocation 3 (see Figure 4). Heifers in VF group 2 spent an uncharacteristically large amount of time in the exclusion zone at day 1 of grazing allocation 3. An unexpected approaching vehicle startled heifers on this day, causing them to cross the virtual back-fence. Heifers then spent 90 min resting in the exclusion zone before the technology successfully herded them back into their cell.
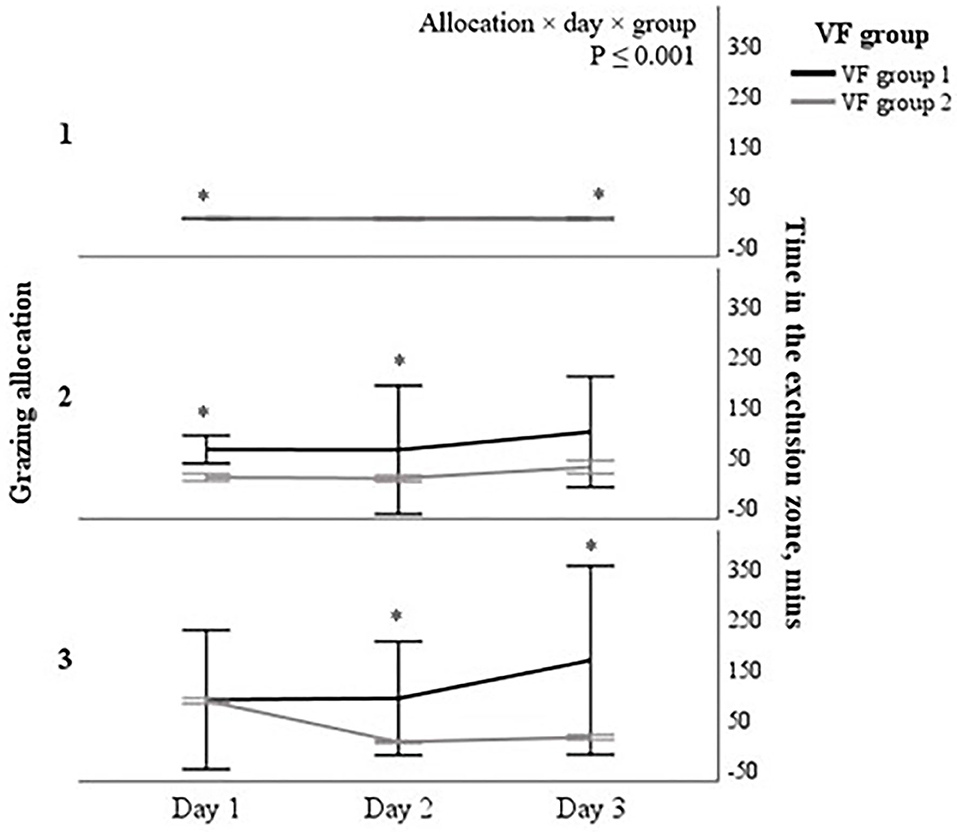
Figure 4. Time heifers in VF group 1 and VF group 2 spent beyond the virtual boundary (i.e., in the exclusion zone) at each day (1, 2, or 3) of each grazing allocation (1, 2, or 3). Raw means ± 1 sd are presented. Least square means ± standard errors are presented in Supplementary Table 1. Within days and allocations, differences between VF groups are indicated by *.
The high number of cues received by animals in VF group 1 were mostly associated with 4 individuals (heifers 7, 8, 9, and 10—Figure 5). These four heifers received 71 and 79% of total electrical stimuli delivered to VF group 1 in allocations 2 and 3, respectively. Interestingly, the average number of audio and electrical stimuli received by these four animals during the 3 day training period was around double that received by the remaining 36 animals (means ± sd for stimuli received by the four heifers during the training period were 79.5 ± 48.6 audio cues and 13.3 ± 7.8 electric pulses, compared to 45.0 ± 21.5 audio cues and 6.3 ± 3.3 electric pulses for the rest of the group), even though the ratio of electrical to audio stimuli were similar (means ± sd for the four heifers 0.18 ± 0.05 audio cues and 0.14 ± 0.04 for the rest of the animals). Heifer 9 appears to be the first animal in VF group 1 to repeatedly enter the exclusion zone (Figure 5). Sixty-seven percent of her virtual boundary crossings were made when no other animals were in the exclusion zone. By contrast, an average of 32% (range 21–53%) of boundary crossings by the remaining heifers were made when no other animals were in the exclusion zone.
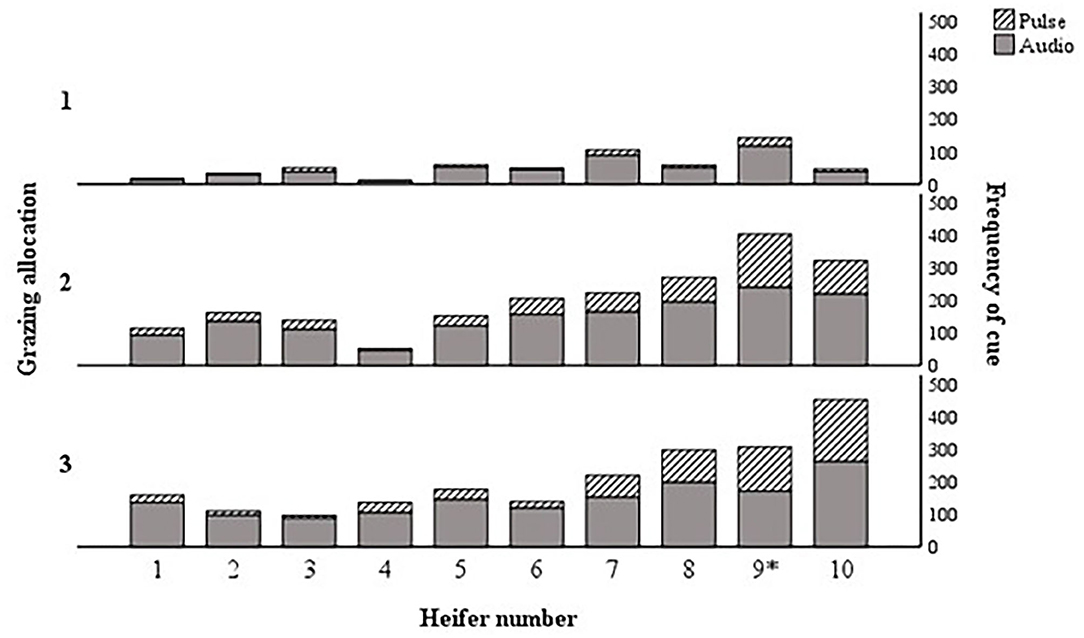
Figure 5. Frequency of audio and electrical stimuli delivered to individual heifers from VF group 1 in grazing allocations 1, 2, and 3. *The neckband of heifer 9 did not record stimuli data at day 3 of allocation 3. Frequency of cues delivered to heifer 9 may thus be higher in allocation 3 than reported.
Discussion
This is the first study to report on the application of virtual fencing technology to intensively cell-graze cattle, with variable success. The virtual front and back-fences successfully contained one group of heifers in their grazing cell (called “VF group 2”), but a second group of heifers (called “VF group 1”) spent an increasing amount of time in the exclusion zone over days and consequently received an increasing number of audio and electrical stimuli. Despite this, live weight changes and estimated pasture consumption did not differ between groups of heifers that were cell-grazed for 9 days using virtual front and back-fences and those cell-grazed using electric front and back-fences. These results highlight the potential of virtual fencing technology to aid the intensification of grazing beef enterprises, given that the system accommodates the animal's natural behaviors and motivations.
Interactions with the virtual fence did not increase over days within an allocation. Given that pasture within the cell would become increasingly depleted over days, this suggests that fresh pasture in the exclusion zone was not motivating heifers to cross the virtual boundary. The lack of treatment effect on pasture utilization or weight changes supports this interpretation, as does other research on dairy cattle in intensive grazing systems which show that a single virtual front-fence prevents animals from accessing fresh pasture in the exclusion zone for 99% of the time (Lomax et al., 2019; Langworthy et al., 2021). Heifers in VF group 1 of this research challenged the virtual boundary more when fence-line contact with animals in the adjacent paddock was limited (allocation 2) and then subsequently prevented (allocation 3), but visual contact maintained. By contrast, the second group of heifers (VF group 2) had continued fence-line contact with adjacent animals and were more successfully contained by virtual fencing. Cattle are a highly gregarious species and cohesion between members of a social group are largely based on preferential relationships that are characterized by spatial proximity, social tolerance, and positive interactions (Bouissou et al., 2001). Thus, a likely explanation for the findings of this study is that our experimental design produced a motivation for heifers in VF group 1 to cross the virtual boundary to regain close contact with familiar and perhaps preferred conspecifics, and that this motivation was stronger than that to avoid receiving an electrical stimulus.
We are unable to determine what impact, if any, the failed first training session had on the behavior of cattle. That all heifers were contained by the virtual fence and responsive to the audio cue during the second 3 day training session suggests that the associative learning process was not affected. Other research on naïve cattle (Lomax et al., 2019; Langworthy et al., 2021) and sheep (Marini et al., 2018) shows that most of the associative learning occurs within 24 h of exposure to a virtual fence. Experience of the first training session could have reduced the valance of the electrical stimulus, however, affecting how willing cattle were to tolerate the aversive cue. Our data cannot confirm whether a motivation to regain physical contact with conspecifics, an increased tolerance to electrical stimulus or both resulted in the reduced responsiveness of cattle in VF group 1 to the virtual fence. Thus, this study highlights the importance of an appropriate training protocol and grazing management regimes that accommodate the natural behaviors of cattle to the successful application of virtual fencing technology.
The greater success of virtual fencing to contain heifers in VF group 2 may similarly be attributed to animals being less motivated to challenge the virtual boundary because they were able to maintain fence-line contact with adjacent conspecifics. Heifers in VF group 2 were more responsive to the audio cue than those in group 1 (19 vs. 37% of interactions included an electrical pulse) and than Angus cattle managed under more extensive grazing conditions (reports that 26–29% of interactions include an electrical pulse—Campbell et al., 2018, 2019, 2020). Their responsiveness to the audio cue, however, was comparable to intensively grazed dairy cows, despite having a considerably higher number of interactions with the virtual fence per day (48.1 interactions per heifer.day in VF group 2 of the present study vs. 4–9.5 interactions per cow.day with 12–20% of interactions including an electrical pulse—Lomax et al., 2019; Langworthy et al., 2021). The more complex and intensive grazing system used in the present study may explain the higher number of interactions with the virtual fence compared to the previous research on dairy cows that used a simple virtual front-fence. Thus, in retrospect, grazing groups of heifers in adjacent paddocks prevents us from drawing conclusions regarding the efficacy of virtual fencing technology to cell-graze cattle. Future research on virtual fencing systems should prevent fenceline contact and limit visual contact between mobs of intensively grazing cattle.
Social facilitation of animal responses to the virtual fence is demonstrated by the failed first training session which was canceled following the rapid movement of all heifers into the exclusion zone. Within 40 s movement had spread from the originating group of heifers to the remaining three groups of animals housed in adjacent paddocks. Cattle are more responsive to the behavior of conspecifics when there is a virtual fence compared to when there is not, and will follow an individual into the exclusion zone during their first interactions with the virtual fence (Keshavarzi et al., 2020). Colusso et al. (2020) found that dairy cows trained to virtual fencing in a group were 88% more likely to receive stimuli when exposed to the technology as individuals, compared to only 36% of cows trained as individuals. The research by Keshavarzi et al. (2020) and Colusso et al. (2020) demonstrate that the response of cattle to virtual fencing technology is, at least in part, socially facilitated through observations of the reactions and behavior of conspecifics. This assertion is also supported by the finding of the present research and of others (Campbell et al., 2019; Keshavarzi et al., 2020) that some cattle respond to the benign audio cue several times before receiving their first electrical pulse. Rather than train animals to virtual fencing in situ as is done in more extensive systems (e.g., Campbell et al., 2018, 2019, 2020), cattle in intensive grazing systems will need to be trained in a specific paddock that has suitably strong structural perimeter fences and is located away from external stimuli that may provoke a flight response.
There is no evidence that the four heifers from VF group 1 which received over 70% of the electrical stimuli delivered to that group failed to effectively learn the association between audio and electrical stimuli. These animals were all appropriately responding to the audio cue by the end of the 3 day training session and at a comparable rate to the rest of the group. They were also effectively contained by the virtual front-fence during the first 3 day grazing allocation. A comprehensive examination of the data logs found no evidence that the technology was failing for these animals (e.g., timing out, connection or communication error, battery failure). Internal state (e.g., hunger) or temperamental pre-disposition may be more important than rate of learning in determining how individuals interact with the technology. Indeed, the four heifers that received most of the stimuli delivered to VF group 1 during the cell-grazing period also interacted with the virtual fence more than the other cattle during the training period. This consistency in how individual heifers interact with the virtual fence across contexts could point to an underlying temperamental pre-disposition. Cattle vary in their willingness to spend time away from the herd (Hirata et al., 2013; Xu et al., 2020), while ecological studies show that bolder, asocial and exploratory individuals are more likely to disperse from their resident social group (reviewed by Cote et al., 2014). Verdon et al. (2020) found bold heifers were more likely to ignore the audio and electrical stimuli delivered in a feed attractant trial. Variations in these characteristics could thus affect how frequently individuals encounter the virtual fence, which may have implications for the effectiveness of the technology and for animal welfare.
The movement of heifers from VF group 1 into the exclusion zone may have been initiated by a single animal that over time recruited others to also breach the virtual boundary. Some cattle in a herd are more successful at influencing group movement patterns than others (i.e., herd “leaders”—Reinhardt and Reinhardt, 1981; Dumont et al., 2005; Ramseyer et al., 2009; Keshavarzi et al., 2020; Xu et al., 2020). Leadership is not synonymous with dominance, but group leaders are likely to be animals that are less sociable, more bold and more explorative (Stricklin and Kautz-Scanavy, 1984; Ramseyer et al., 2009; Della-Rossa et al., 2013; Neave et al., 2018). The behavior of the herd leaders may disproportionately affect the success of virtual fencing technology. For example, other research has found variation between groups of cattle in the number of interactions with the virtual fence, the percentage of interactions with an electrical pulse and the socially facilitated behavioral response of cattle to the virtual fence (Campbell et al., 2019; Keshavarzi et al., 2020), suggesting effects of group composition. We encourage further research to explore the relationships between temperamental characteristics (i.e., boldness, sociability, explorativeness) and the response of individual cattle to virtual fencing technology.
Conclusions
This case study shows variable success in the intensive cell-grazing of Angus heifers with virtual fences. It is likely that our experimental design produced a motivation for some heifers to cross the virtual boundary to regain close contact with familiar conspecifics. This prevents us from drawing strong conclusions regarding the efficacy of virtual fencing technology to cell-graze cattle, however, there are valuable learnings to be gained from this case study that can support the successful application of virtual fencing technology to intensive grazing regimes. First, virtual fencing should not be used to manage cattle that have close visual contact to other mobs, particularly if animals have previously been housed as a single group. The minimum distance required to keep adjacent groups of grazing cattle separated using virtual fencing requires research. Second, rather than train animals to virtual fencing in situ as is done in more extensive systems, cattle in intensive grazing systems may need to be trained to virtual fencing in a dedicated paddock. Third, some cattle are more likely than others to breach the virtual fence. The relationships between temperamental characteristics, leadership and the response of individual cattle to virtual fencing technology require further investigation. We conclude that the successful application of virtual fencing technology needs to accommodate the natural behaviors of cattle.
Data Availability Statement
The raw data supporting the conclusions of this article will be made available by the authors, without undue reservation.
Ethics Statement
The animal study was reviewed and approved by University of Tasmanian Animal Ethics Committee.
Author Contributions
MV and RR contributed conception and design of the experiment. MV conducted the experiment, organized the database, performed the statistical analyses, and wrote the draft of the manuscript. BH collated, cleaned, and visually presented the GPS data. All authors contributed to manuscript revision, read, and approved the submitted version.
Funding
This research was funded by the Australian Commonwealth Government Department of Agriculture and Water Resources as part of its Rural R&D for Profit Programme, Grant Number 15-02-019.
Conflict of Interest
The authors declare that the research was conducted in the absence of any commercial or financial relationships that could be construed as a potential conflict of interest.
Acknowledgments
The authors thank Nathan Bakker, Thomas Snare, Jim Lea, Oliver Radford, Brad Millhouse, and the staff at TDRF and Agersens for their support in operating this project.
Supplementary Material
The Supplementary Material for this article can be found online at: https://www.frontiersin.org/articles/10.3389/fanim.2021.663963/full#supplementary-material
References
Baumont, R., Lewis, E., Delaby, L., Prache, S., and Horan, B. (2014). Sustainable intensification of grass-based ruminant production, in Proceedings of the 25th General Meeting of the European Grassland Federation (Aberystwyth), 7–11.
Bouissou, M.-F., Boissy, A., Le Neindre, P., and Veissier, I. (2001). The social behaviour of cattle, in Social Behaviour in Farm Animals, eds Keeling, L.-F., and Gonyou, H. W., (Oxon: CAB International), 113–145.
Campbell, D., Haynes, S., Lea, J., Farrer, W., and Lee, C. (2018). Temporary exclusion of cattle from a Riparian zone using virtual fencing technology. Animals 9:5. doi: 10.3390/ani9010005
Campbell, D., Lea, J., Farrer, W., Haynes, S., and Lee, C. (2017). Tech-savvy beef cattle? How heifers respond to moving virtual fence lines. Animals 7:72. doi: 10.3390/ani7090072
Campbell, D. L., Lea, J. M., Keshavarzi, H., and Lee, C. (2019). Virtual fencing is comparable to electric tape fencing for cattle behavior and welfare. Front. Vet. Sci. 6:445. doi: 10.3389/fvets.2019.00445
Campbell, D. L., Ouzman, J., Mowat, D., Lea, J. M., Lee, C., and Llewellyn, R. S. (2020). Virtual fencing technology excludes beef cattle from an environmentally sensitive area. Animals 10:1069. doi: 10.3390/ani10061069
Colusso, P. I., Clark, C. E., and Lomax, S. (2020). Should dairy cattle be trained to a virtual fence system as individuals or in groups? Animals 10:1767. doi: 10.3390/ani10101767
Cote, J., Clobert, J., Brodin, T., Fogarty, S., and Sih, A. (2014). Personality traits and spatial ecology in nonhuman animals, in Geographical Psychology: Exploring the Interaction of Environment and Behavior, ed Rentfrow, P. J., (Washington, DC: American Psychological Association), 89–112.
Della-Rossa, L., Chadœuf, J., Boissy, A., and Dumont, B. (2013). Leaders of spontaneous group movements influence whole-group social organization: an experimental study on grazing heifers. Behaviour 150, 153–173. doi: 10.1163/1568539X-00003043
Dumont, B., Boissy, A., Achard, C., Sibbald, A., and Erhard, H. (2005). Consistency of animal order in spontaneous group movements allows the measurement of leadership in a group of grazing heifers. Appl. Anim. Behav. Sci. 95, 55–66. doi: 10.1016/j.applanim.2005.04.005
Hebart, B., Cooper, J., and Carmichael, I. (2004). The use of Technograzing to increase beef production on dry land pastures in south-eastern Australia. Science Access 1:255. doi: 10.1071/SA0401100
Hirata, M., Taketomi, I., Matsumoto, Y., and Kubo, S. (2013). Trade-offs between feeding and social companionship in cattle: intra-animal consistency over short and extended periods. Appl. Anim. Behav. Sci. 146, 19–25. doi: 10.1016/j.applanim.2013.03.004
Johnson, T. (2018). Turning knowledge into practical benefit: a producer case-study increasing the return on investment in science. Anim. Prod. Sci. 58, 744–755. doi: 10.1071/AN16038
Keshavarzi, H., Lee, C., Lea, J. M., and Campbell, D. L. (2020). Virtual fence responses are socially facilitated in beef cattle. Front. Vet. Sci. 7:711. doi: 10.3389/fvets.2020.543158
Langworthy, A., Verdon, M., Freeman, M., Corkrey, R., Hills, J. L., and Rawnsley, R. (2021). Virtual fencing technology to intensively graze lactating dairy cattle I: effectiveness and pasture utilisation. J. Dairy Sci. doi: 10.3168/jds.2020-19796
Lomax, S., Colusso, P., and Clark, C. (2019). Doea virtual fencing work for grazing dairy cattle? Animals 9:429. doi: 10.3390/ani9070429
Marini, D., Llewellyn, R., Belson, S., and Lee, C. (2018). Controlling within-field sheep movement using virtual fencing. Animals 8:31. doi: 10.3390/ani8030031
Neave, H., Weary, D., and Von Keyserlingk, M. (2018). Individual variability in feeding behaviour of domesticated ruminants. Animal 12, s419–s430. doi: 10.1017/S1751731118001325
Oddy, H., and Allen, C. (2001). The importance of feed quality to animal performance, in Proceedings of the 16th annual conference of the Grassland Society of NSW, (Gundagai, NSW), 35–38.
Ramseyer, A., Boissy, A., Thierry, B., and Dumont, B. (2009). Individual and social determinants of spontaneous group movements in cattle and sheep. Anim. Int. J. Anim. Biosci. 3:1319. doi: 10.1017/S1751731109004790
Reinhardt, V., and Reinhardt, A. (1981). Cohesive relationships in a cattle herd (Bos indicus). Behaviour 77, 121–150. doi: 10.1163/156853981X00194
Stafford, K., and Gregory, N. (2008). Implications of intensification of pastoral animal production on animal welfare. N. Z. Vet. J. 56, 274–280. doi: 10.1080/00480169.2008.36847
Stricklin, W., and Kautz-Scanavy, C. (1984). The role of behavior in cattle production: a review of research. Appl. Anim. Ethol. 11, 359–390. doi: 10.1016/0304-3762(84)90043-9
Tasmanian Animal Welfare Act (1993). Tasmanian Animal Welfare Act. Available online at: https://www.legislation.tas.gov.au/view/html/inforce/current/act-1993-063 (accessed March 23, 2021).
Verdon, M., Lee, C., Marini, D., and Rawnsley, R. (2020). Pre-exposure to an electrical stimulus primes associative pairing of audio and electrical stimuli for dairy heifers in a virtual fencing feed attractant trial. Animals 10:217. doi: 10.3390/ani10020217
Keywords: associative learning, behavior, GPS, shock, social facilitation, Technograzing
Citation: Verdon M, Horton B and Rawnsley R (2021) A Case Study on the Use of Virtual Fencing to Intensively Graze Angus Heifers Using Moving Front and Back-Fences. Front. Anim. Sci. 2:663963. doi: 10.3389/fanim.2021.663963
Received: 04 February 2021; Accepted: 24 March 2021;
Published: 27 April 2021.
Edited by:
Luiz Brito, Purdue University, United StatesReviewed by:
Fabio Abeni, Consiglio per la Ricerca in Agricoltura e l'Analisi dell'Economia Agraria (CREA), ItalyInes Adriaens, Wageningen Livestock Research, Netherlands
Isabella Condotta, University of Illinois at Urbana-Champaign, United States
Copyright © 2021 Verdon, Horton and Rawnsley. This is an open-access article distributed under the terms of the Creative Commons Attribution License (CC BY). The use, distribution or reproduction in other forums is permitted, provided the original author(s) and the copyright owner(s) are credited and that the original publication in this journal is cited, in accordance with accepted academic practice. No use, distribution or reproduction is permitted which does not comply with these terms.
*Correspondence: Megan Verdon, bWVnYW4udmVyZG9uQHV0YXMuZWR1LmF1