 Min Jin
 Chunguang Wang1*
 Dan Børge Jensen
- 1College of Mechanical and Electrical Engineering, Inner Mongolia Agricultural University, Hohhot, China
- 2Department of Veterinary and Animal Sciences, Faculty of Health and Medical Sciences, University of Copenhagen, Copenhagen, Denmark
Classification of imbalanced datasets of animal behavior has been one of the top challenges in the field of animal science. An imbalanced dataset will lead many classification algorithms to being less effective and result in a higher misclassification rate for the minority classes. The aim of this study was to assess a method for addressing the problem of imbalanced datasets of pigs' behavior by using an over-sampling method, namely Borderline-SMOTE. The pigs' activity was measured using a triaxial accelerometer, which was mounted on the back of the pigs. Wavelet filtering and Borderline-SMOTE were both applied as methods to pre-process the dataset. A multilayer feed-forward neural network was trained and validated with 21 input features to classify four pig activities: lying, standing, walking, and exploring. The results showed that wavelet filtering and Borderline-SMOTE both lead to improved performance. Furthermore, Borderline-SMOTE yielded greater improvements in classification performance than an alternative method for balancing the training data, namely random under-sampling, which is commonly used in animal science research. However, the overall performance was not adequate to satisfy the research needs in this field and to address the common but urgent problem of imbalanced behavior dataset.
Introduction
Behavior is one of the most used and sensitive indicators which can reflect livestock's physical, physiological, and health status, as well as their reactions to the environment. Being able to acquire reliable information on animal behavior is therefore of great importance for decision making on livestock farms and for the improvement of animal welfare (Larsen et al., 2019a). Tri-axial accelerometers, fixed to the bodies of animals, have previously been applied for the collection of data used for animal behavior classification. As an example, Cornou et al. (2011) fitted accelerometers to the necks of sows to monitor the sows' lying patterns by distinguishing between when the sows were lying laterally on one side, on the other side, and sternally.
For the raw accelerometer data to become useful, it must undergo various steps of data preparations. One such step is often de-noising; the random noise generated from the physiological jitter of the animal, or the device being randomly shaken or impacted, will be added to the systematic signals that correspond to the various behaviors, thus reducing the signal-to-noise ratio of the raw data, and thus affecting the accuracy of the behavior classification typically performed in later steps.
An additional data preparation step is sometimes to balance the dataset. This problem of imbalanced dataset often occurs in animal behavior classification, since different behavioral states do not appear equally frequently (Homburger et al., 2014). For pigs specifically, they spend most of their time lying, while they spend less time standing or exploring, and they spend the least amount time walking (Li, 2014). In recent decades, many solutions have been proposed to deal with this problem. A commonly adopted strategy for imbalanced data is one of two broad re-sampling strategies: the first re-sampling strategy is to remove parts of the majority class to bring it closer to the number of observations in the minority class, i.e., under-sampling. The second is to carry out Bootstrap sampling for the minority class, thus bringing the size of the minority class closer to that of the majority class, usually by repeating randomly selected observations, i.e., over-sampling. Under-sampling has the drawback that when observations are removed from the majority class, potentially useful information is lost. The drawback of the commonly used simple over-sampling is that a large number of identical samples will be generated, which will cause the model to over-fit to those repeated observations (Barwick, 2020). In the field of livestock science, most researchers who address the problem of imbalanced data sets do so by applying the under-sampling solution (e.g., Smith et al., 2016; Abell et al., 2017; Sakai et al., 2019; Fogarty et al., 2020). Many researchers in this field, however, do not address this issue at all (e.g., Barwick, 2020), which suggests that this is an issue in need of more attention within the animal science community.
In other areas of research, different strategies have been developed to tackle the problem of imbalanced data sets. As an example, over-sampling with replacement was most used in the beginning, but related research by Japkowicz (2000) noted that it didn't significantly improve the identification of minority class. Then, inspired by a technique that proved successful in handwritten character recognition, a heuristic over-sampling algorithm called Synthetic Minority Over-sampling Technique (SMOTE) was proposed by Nitesh V. Chawla. This method generated new synthetic examples along the line between the minority examples and their selected nearest neighbors (Chawla et al., 2002). The experiments were initially conducted on a mammography dataset with 10,923 examples in the majority class and 260 examples in the minority class, and was finally tested on nine different datasets, with varying degrees of imbalance to verify its superiority. An extension of SMOTE is the Borderline-SMOTE, which was first introduced by Han et al. (2005). With this method, only observations of the minority class on the borderline between the minority and majority class are over-sampled, instead of all minority observations. Hui Han et al. reasoned that the minority class examples on and near the borderline to the majority class are more likely to be misclassified than the ones far from the borderline, and thus more important for classification.
Furthermore, to classify pigs' behaviors, an appropriate classification method is also of great significance. A fully connected feed-forward artificial neural network (ANN) has many advantages over traditional statistical methods for complex model fitting (Gardner and Dorling, 1998), as it is a universal function approximator, which can learn any arbitrary functional relationship between inputs and outputs. For this reason, fully connected feed-forward ANNs were applied in this study.
With this study, we had three aims: (1) to assess the value of de-noising the accelerometer data prior to training the ANN, (2) to assess the value of balancing the classes in the training data using Borderline-SMOTE before training the ANN, and (3) to compare the utility of Borderline-SMOTE to that of random under-sampling before training the ANN. The value of the pre-processing steps was assessed in terms of the performance of the trained ANN, when it was applied to an unseen test set.
Methods
Data Source
The experiment was carried out on a pig farm in Hohhot, Inner Mongolia, China (40°40′26”N, 111°21′46”E) from 8:00 to 18:00 every day between March 10th and April 17th, 2019. Three pigs at different fattening stages (initial weights of 35.8, 62.3, and 92.4 kg, respectively, referred to as pigs A, B, and C in the following sections) were monitored.
The pigs' activities were measured using a triaxial accelerometer with sampling frequency of 20 Hz (SW-J4601V, China), powered with 5 V lithium-ion batteries and controlled by CC2530F256 controller and ADXL325 chip. The triaxial accelerometer was placed in a waterproof box and tied to the back of the pigs. The installation direction of the triaxial accelerometer is shown in Figure 1.
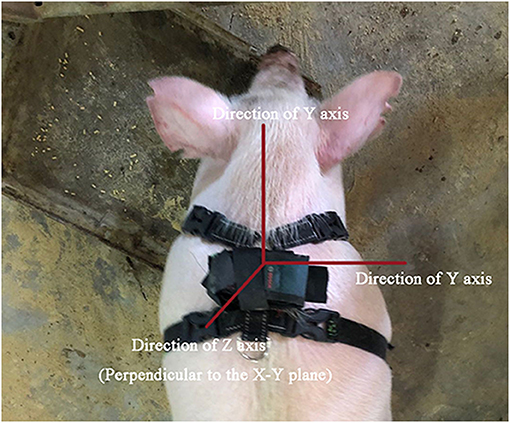
Figure 1. Direction of the back-mounted triaxial accelerometer. The X-axis pointed from the left to the right side of the pig's body, the Y-axis pointed from the tail to the head of the pig, and the Z-axis was perpendicular to the XY plane.
The pigs' behavior was video-recorded throughout the experiment, and the camera was time-synchronized to the computer used to initialize the accelerometers. For this study, we focused on four behaviors of the pigs: lying, standing, walking, and exploring. These are considered to be the main daily activities of pigs, and monitoring these behaviors can provide useful information for abnormal behavior warning and environment control. A video with examples of these behaviors for each of the pigs can be seen in Supplementary Video 1. The definitions and descriptions of these behavioral characteristics of the pigs are summarized in Supplementary Table 1.
Data Pre-processing
Data pre-processing was done using both R (R Core Team, 2013) and MATLAB (2017). Modeling and statistical analysis were done in R. Prior to all other pre-processing, the raw data were averaged per second.
Wavelet Filtering
Wavelet filtering was employed in this study to de-noise the original signal due to its multi-resolution analysis and self-similarity, which can effectively extract time-frequency characteristics of a signal by using wide and narrow windows in the low-frequency and high-frequency parts of the signal, respectively (Loyola-González et al., 2016). Threshold de-noising can be done using the wavelet toolbox and the function Wden in Matlab. For this study, the traditional soft threshold de-nosing with Db4 wavelet basis, Rigrsure threshold rule and six-layer decomposition was chosen based on initial tests.
Transformation by Summary Statistics
Six summary statistics (mean, median, minimum, maximum, the first quartile, and the third quartile) were calculated for rolling windows of the (denoised) acceleration data in the X, Y, and Z directions. Combined with the (denoised) X, Y, and Z values, these summary statistics formed a new 21-dimensional dataset. Each of the 21 variables were normalized to a range of [−1, 1] before being used in the later model building stage. Different lengths for the rolling time window (3, 4, and 5 s) were compared to test whether time window length influenced the results of the ANN classification of pigs' behavior. The decision to compare these three window lengths were based on the distribution of the number of consecutive seconds, which each pig spend on each type of activity. These distributions can be seen in the Supplementary Table 2.
Over-Sampling
The data used in this study were heavily imbalanced. Borderline-SMOTE (Han et al., 2005) was adopted as the method to augment our dataset by artificially creating new data points for the each of the minority classes by interpolating them between the real data points which exists near the border to each of the other three classes. The new samples were generated without affecting the majority class. In general, the examples on the borderline and the ones nearby are more apt to be misclassified than the ones far from the borderline, and thus more important for classification. Borderline-SMOTE constructs a set of border minority examples known as DANGER. Then, it applies SMOTE for each instance of the DANGER set. For this, we used the function BLSMOTE from the R package smotefamily. The purpose of this data augmentation was to be better able to distinguish all the different classes from each other. To this end, Borderline SMOTE-1 was iteratively applied to each minority class, in a way where the borders to all other classes were strengthened. This resulted in a new data set, where the previous minority classes all significantly outnumbered the previously largest majority class. This data set was rebalanced by selecting all of the original data points, along with a random sample of artificial data points from each class, so that all classes in the final data set were represented by the same total number of data points as was in the original overall majority class. When applying the algorithm, the number of nearest neighbors to be considered while synthesizing new observations (K) was set to 3. The parameter “dupSize” was set to 0, which indicates that the algorithm should stop creating new minority observations, when the number of minority observations was equal to the number of observations in the majority class that was used for a given iteration of the data augmentation.
Under-Sampling
As under-sampling is the most commonly used method of balancing data sets in animal science, it was decided to also include under-sampling in this study for the purpose of comparing it to our selected method of over-sampling.
Under-sampling was repeated 20 times, leading to 20 distinct under-sampled data set. For each under-sampled set, a random sample with a size equal to the size of the smallest minority class was taken from each of the four classes without replacement. The resulting 20 trained ANNs would then be applied to the relevant (unbalanced) test set, yielding 20 performance estimates, which were used to estimate the with corresponding 95% confidence intervals (CI). The final estimates of the under-sampled performance and the corresponding 95% CIs were made by taking the simple mean of the 20 different estimates per test set. These final 95% CIs were then used when comparing the performances with those resulting from training the ANNs on over-sampled and unbalanced data sets.
Artificial Neural Network Architecture
Fully connected feed-forward ANNs were trained using the back-propagation algorithm, using the function mx.model.FeedForward.create from R package mxnet.
The ANNs trained in this study consisted of an input layer, two hidden layers and an output layer. The number of neurons in the input layer was 21. We decided to use two hidden layers in the network in our study, as this structure is known to be more efficient than ANNs with only one hidden layer in terms of the number of parameters needed for the training (Tamura and Tateishi, 1997).
Rectified linear units (ReLU) was used as the activation function in the hidden layers, while the softmax function was used as the activation function in the output layer. The output layer had four nodes, corresponding to the four classes of behavior, which were considered in this study. The softmax functions adjusts the values of the four outputs, so that they are all between 0 and 1 and always sum to 1. Thus, each of the four output values can be interpreted as the probability of the respective behavior. The final prediction for a given observation was the behavior class with the highest probability value.
We optimized the number of nodes in the two hidden layers by following the example of Larsen et al. (2019b). The best combination for each ANN for was chosen based on the highest accuracy.
Model Training and Validation
In this study, per-pig cross validation was used to train and validate the models. The data relating to two pigs were iteratively used to train a model, which was then tested on unbalanced data from the remaining pig.
The main performance metric was the major mean accuracy; for each behavior class, the per-class accuracy was calculated as the fraction of observed instances of that class, which was correctly predicted to be of that class. The major mean accuracy was then calculated as the simple mean of the four per-class accuracies. Additionally, the 95% CI for the major mean accuracy was estimated via bootstrapping (Thomas and Efron, 1996). The performances of two trained ANNs were considered to be significantly different from each other, if the major mean accuracy of one ANN was not contained within the 95% CI of the other, and vice versa.
When over-sampled or under-sampled data were used, this was only the case during the training of the ANN. The trained ANNs would always only be tested on the original unbalanced data.
Results
Selection of Window Length
After comparison of the results of different window lengths (3, 4, and 5 s), it can be seen in the Supplementary Table 3 that better results, measured in terms of major mean accuracy, can be achieved when using a window length of 5 s.
Optimal Architecture of the ANN
Different combinations of each ANN and the corresponding performances can be seen in the Supplementary Table 4. The optimized architecture of the ANN is listed in Supplementary Table 5.
Data Distribution
The original imbalanced data statistics of all pigs can be seen in the Supplementary Table 6. For illustrative purposes, the original 1-day data of each pig and the balanced dataset after data augmentation of each pig are presented as Figure 2.
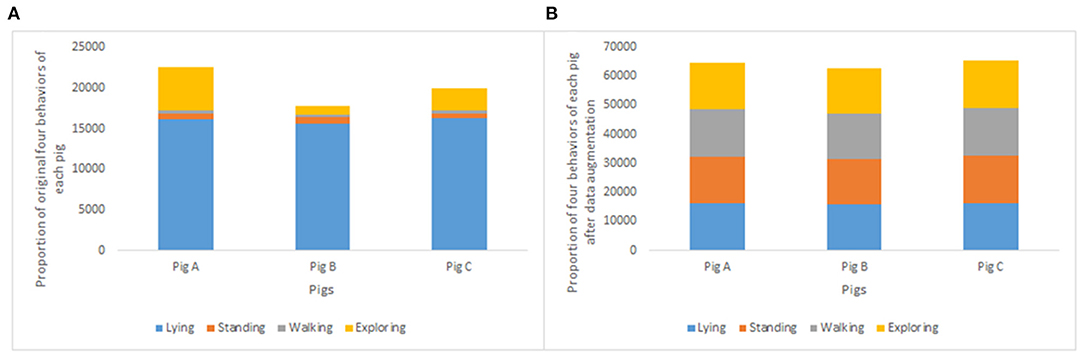
Figure 2. Proportion of original four behaviors of each pig (A) and proportion of four behaviors of each pig after data augmentation (B).
Per-Pig Cross-Validation Performance of the ANN
Table 1 shows the results of behavior classification using both Wavelet filtering and under-sampling, as well as the results of behavior classification depending on whether the training data were augmented using Borderline-SMOTE or not, and whether the training and test data were de-noised using wavelet filtering as part of the data pre-processing. Figure 3 shows both the normalized confusion matrices of the per-pig cross-validation with the under-sampled data (Figure 3A), and the normalized confusion matrices for the per-pig cross-validation, when both Wavelet filtering and data augmentation with BL-SMOTE was performed as part of the data pre-processing (Figure 3B).
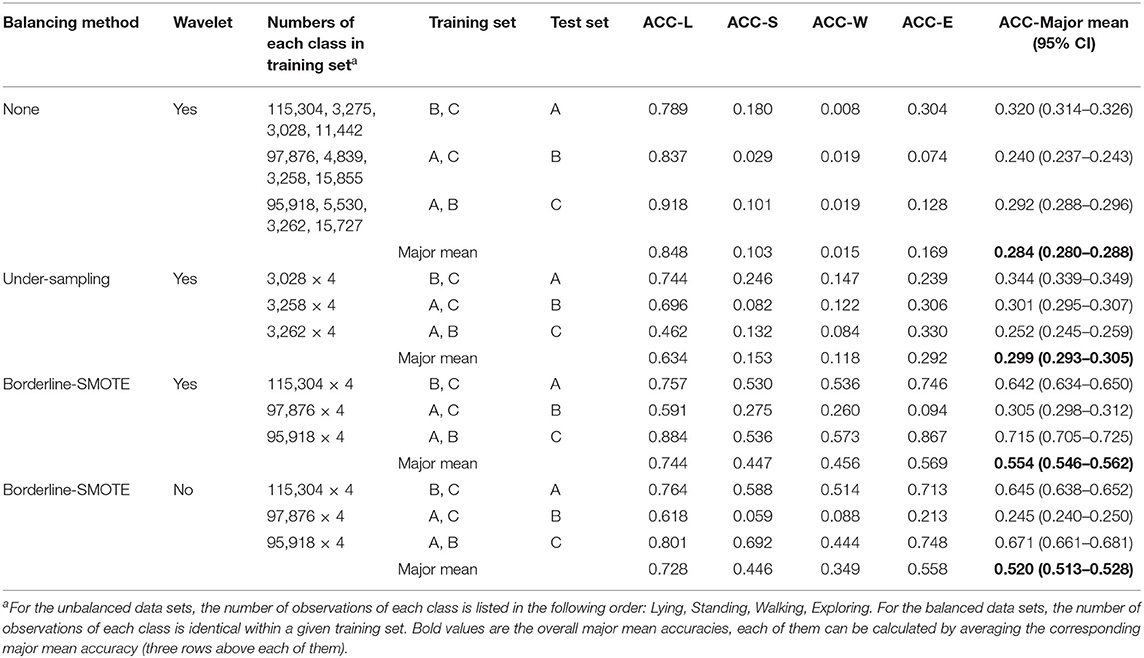
Table 1. Classification results by using wavelet filtering, under-sampling, and over-sampling with BL-SMOTE on the training data.
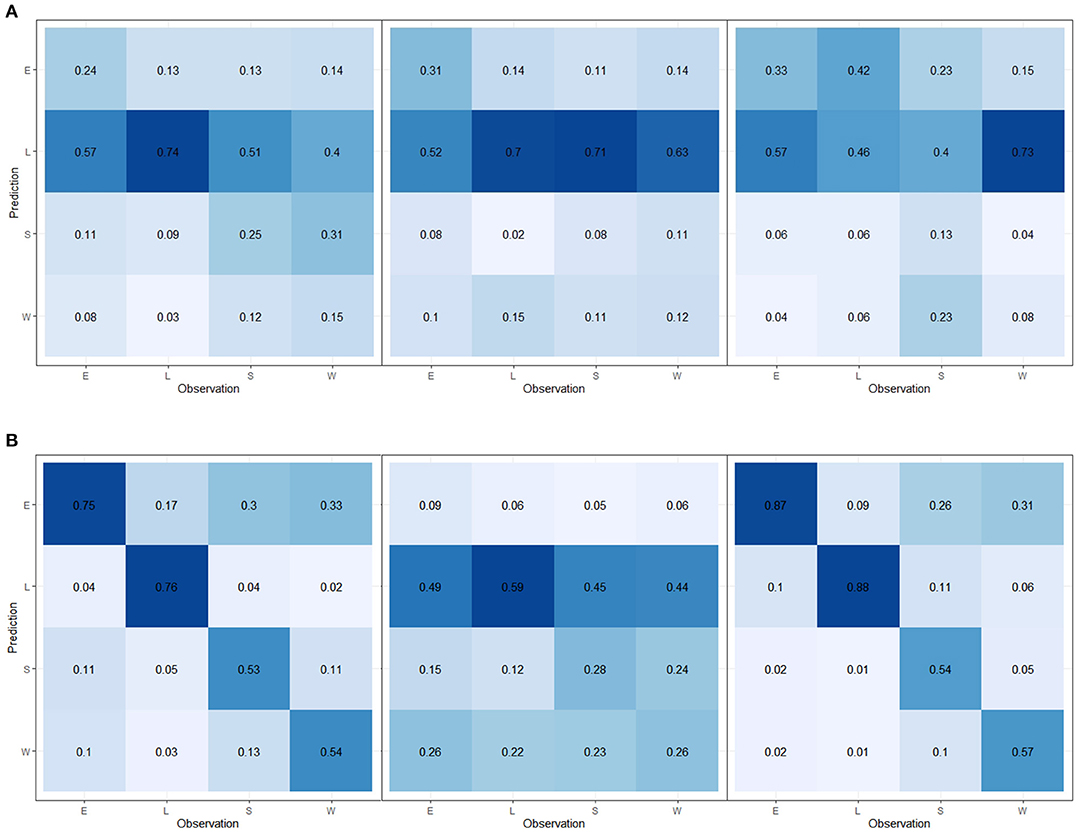
Figure 3. Normalized confusion matrix of behavior classification from the per-pig cross-validation after using Wavelet filtering and under-sampling (A). Left: tested on pig A. Middle: tested on pig B. Right: tested on pig C. Normalized confusion matrix of behavior classification from the per-pig cross-validation after data augmentation with BL-SMOTE and Wavelet filtering (B). Left: tested on pig A. Middle: tested on pig B. Right: tested on pig C.
Discussion
The problem of imbalanced data is, of course, not unique to the behavior of pigs, but is also seen in the behavior of cows (Homburger et al., 2014), calves (Abell et al., 2017), sheep (Fogarty et al., 2020), and goats (Sakai et al., 2019). Barwick (2020) used an imbalanced dataset directly as the training set to identify sheep activity from triaxial acceleration signals. Their results showed that lying behavior was predicted very poorly from the collar data with a sensitivity of 6%, since limited lying behavior was observed. The rest of the above listed studies all adopted random under-sampling to balance the training dataset of the animals' behavior. None of the studies on classification of animal behavior, which we were able to find, used over-sampling (random or otherwise).
The reason why under-sampling is often preferred to over-sampling is likely related to the risk that the simplest form of oversampling, i.e., over-sampling by simple random resampling, could lead to over-fitting. This is because the simple random resampling makes multiple exact copies of the minority class records (Mahani and Riad Baba Ali, 2019). However, because of the degree to which our data are imbalanced, as illustrated in Figure 2, using under-sampling meant removing more than 10,000 observations of the largest majority class (i.e., lying), in order for it to reach the same size as the smallest minority class (i.e., walking). The expected effect of this would be the loss of a great deal of information, which could otherwise prove useful for the classification.
In our study, a comparison between the performances achieved when the training data were balanced using under-sampling with the performances achieved without balancing the training data (Table 1), reveals that under-sampling improves the mean accuracies from 0.320 to 0.344 for pig A, from 0.240 to 0.301 for pig B, reduces from 0.292 to 0.252 for pig C, and the overall major mean accuracy improves from 0.284 to 0.299. These accuracies were all statistically significant based on their respective 95% CI. This suggests that balancing the training data by under-sampling is better than not balancing the training data at all. This is contrary to the findings of Sakai et al. (2019), who showed that their overall accuracy was reduced from 87 to 84% when training their model on under-sampled balanced data, compared to training on imbalanced data.
This being said, the improvements from under-sampling seen in our study are arguably very moderate from a practical perspective. Furthermore, even though under-sampling generally increased the mean per-class accuracies of the three minority categories (walking, standing, and exploring), the performance of lying was generally decreased. This is in concordance with the findings of Sakai et al. (2019), who showed that the F1 scores of the minority class improved only slightly from 58 to 59 when using under-sampling. We suspect that the reductions we see in the performance on the largest classes is the effect of the under-sampling removing large parts of useful information about these classes. The effects of removing a large amount of data was not assessed by Sakai et al. (2019). Fogarty et al. (2020) also acknowledged this potential issue with randomly removing observations from the majority class to make the dataset balanced, and they also noted that under-sampling may have impacted the results for the other behaviors such as lying by discarding potentially useful information. However, they did not assess the magnitude of the impact of this problem on their results.
Moreover, our chosen method of over-sampling, i.e., Borderline-SMOTE, does not simply duplicate observations from the minority classes, but generates new synthetic examples along the line between observations in the minority class and their selected nearest neighbors. As opposed to the original SMOTE algorithm, Borderline-SMOTE starts by identifying a set of minority examples on the border to a majority class. This set is known as the DANGER set. Then, it applies SMOTE for each instance of the DANGER set, but ignores the rest of the observations in the minority class. Two versions of Borderline-SMOTE exists, namely Borderline-SMOTE1 and Borderline-SMOTE2. Compared with Borderline-SMOTE1, Borderline-SMOTE2 does not only generate synthetic examples between the minority class points in the DANGER set, but also between members of the DANGER set and their nearest neighbors in the majority class. These synthetic observations are created in such a way that they are always closer to the point in the minority class than to its neighbor in the majority class. Unlike the original SMOTE, when Borderline-SMOTE is applied, new samples can be generated by using the minority class near the category boundary without affecting the majority class (Supplementary Figures 1, 2).
From our initial tests, we found that when the dataset is large, Borderline-SMOTE1 performed better in terms of CPU efficiency and was more robust, while Borderline-SMOTE2 was more time-consuming and would generate many missing values (data not shown). Consequently, Borderline-SMOTE1 was adopted as the method to augment our training datasets.
In this study, when Wavelet filtering and Borderline-SMOTE where both applied as part of the data pre-processing, the mean accuracies for pigs A, B, and C were 0.642, 0.305, and 0.715, respectively (Table 1). Lying was generally the most accurately predicted behavior (Figure 3). This is hardly surprising, as lying is the most distinct and simple of the four included behaviors. For pigs A and C, standing and walking were correctly classified 53–57% of the time. When these behaviors were misclassified, they were most commonly misclassified as exploring. This is most likely because exploring was more heavily represented in the unbalanced data than both walking and standing, as seen in Figure 2. This means that in the balanced training sets, exploring was represented by more variation than walking and standing, even though they were all represented by the same number of (synthetic) observations.
It can also be seen from Table 1 that the mean accuracy differs significantly at the 95% confidence level between all three pigs, depending on which pig was used as the test set. This also suggests that the three different pigs, which are at different stages in their respective growth periods, express different movement patterns from each other, e.g., in terms of movement amplitude (Supplementary Videos 2, 3). From the data, which were available for our study, it is impossible to say whether these differences are mainly due to completely individual character traits of the individual pig, or if they represent systematic effects of the ages of the pigs. If the differences in measured activity patters are strongly associated with the sizes and/or ages of the pigs, then future models for behavior classification will need to be able to combine data about such traits with the accelerometer data, and use data from many more pigs at different ages than what we had access to in this study. If, on the other hand, the differences reflect true individual patterns, then part of the pre-processing of the data could be to use other methods of time series filtering such as dynamic linear models, which could actively learn the normal behavior of the individual pig. This type of model has previously been used to actively learn e.g., the drinking behavior of specific groups of pigs for monitoring purposes (e.g., Larsen et al., 2019b; Jensen et al., 2017; Dominiak et al., 2019). Additionally, further research should also focus on comparing different machine learning methods, such as random forest and support vector machines, to try to improve the classification performance of each behavior class, e.g., by employing ensembles of multiple different types of machine learning models simultaneously.
As an alternative to balancing the data, further research should also investigate the effect of training the ANN with novel loss functions from the pure machine learning literature, such as focal losses (Lin et al., 2020), which down-weights the loss assigned to well-classified examples. A similar option for an adaptive loss function would be to weigh the calculated loss for different samples differently, depending on whether they belong to the majority or the minority classes. Such approaches were, however, outside the scope of this paper.
In conclusion, Wavelet filtering and data augmentation by Borderline-SMOTE were both found to consistently and significantly improve the classification accuracy of all four behavior classes considered for this study, with the effect of Borderline-SMOTE alone being greater than the effect of Wavelet filtering alone. The effect of using data augmentation by Borderline-SMOTE was more pronounced than balancing the training data by under-sampling. This appears to be the first time the use of this algorithm has been demonstrated within the field of animal science. However, the overall performance was not adequate to satisfy the research needs in this field and to address the common but urgent problem of imbalanced behavior dataset.
Data Availability Statement
The raw data supporting the conclusions of this article will be made available by the authors, without undue reservation.
Ethics Statement
The animal study was reviewed and approved by the Ethics Committee for Animal Welfare and Ethics of Inner Mongolia Agricultural University. Written informed consent for participation was not obtained from the owners because these animals were University owned livestock for research purposes.
Author Contributions
MJ and CW contributed to the conception and design of the experiment. DJ and MJ contributed to the statistical analysis and methodology. MJ wrote the first draft of the manuscript. DJ contributed to manuscript revision and validation. All authors contributed to the article and approved the submitted version.
Funding
This work was supported by the 12th Five-year National Science and Technology Support Program of China (Grant number: 2014BAD08B05), the Inner Mongolia Autonomous Region Graduate Student Scientific Research Innovation Projects (Grant number: B2018111948), the China Scholarship Council (Grant number: 201908150159), and the Green Development and Demonstration Programme under the Ministry of Food, Agriculture and Fisheries, Denmark (Grant numbers: 34009-17-1249 and 34009-18-1335, projects: Intelligent Ear Tags and IQinABox, respectively).
Conflict of Interest
The authors declare that the research was conducted in the absence of any commercial or financial relationships that could be construed as a potential conflict of interest.
Supplementary Material
The Supplementary Material for this article can be found online at: https://www.frontiersin.org/articles/10.3389/fanim.2021.666855/full#supplementary-material
References
Abell, K. M., Theurer, M. E., Larson, R. L., White, B. J., Hardin, D. K., and Randle, R. F. (2017). Predicting bull behavior events in a multiple-sire pasture with video analysis, accelerometers, and classification algorithms. Comput. Electron. Agric. 136, 221–227. doi: 10.1016/j.compag.2017.01.030
Barwick, J. (2020). Identifying sheep activity from tri-axial acceleration signals using a moving window classification model. Remote Sens. 12, 1–13. doi: 10.3390/rs12040646
Chawla, N. V., Bowyer, K. W., Hall, L. O., and Kegelmeyer, W. P. (2002). SMOTE: Synthetic Minority Over-sampling Technique. J. Artif. Intell. Res. 16, 321–357. doi: 10.1613/jair.953
Cornou, C., Lundbye-Christensen, S., and Kristensen, A. R. (2011). Modelling and monitoring sows' activity types in farrowing house using acceleration data. Comput. Electron. Agric. 76, 316–324. doi: 10.1016/j.compag.2011.02.010
Dominiak, K. N., Hindsborg, J., Pedersen, L. J., and Kristensen, A. R. (2019). Spatial modeling of pigs' drinking patterns as an alarm reducing method II. Application of a multivariate dynamic linear model. Comput. Electron. Agric. 161, 92–103. doi: 10.1016/j.compag.2018.10.037
Fogarty, E. S., Swain, D. L., Cronin, G. M., Moraes, L. E., and Trotter, M. (2020). Behaviour classification of extensively grazed sheep using machine learning. Comput. Electron. Agric. 169:105175. doi: 10.1016/j.compag.2019.105175
Gardner, M. W., and Dorling, S. R. (1998). Artificial neural networks (the multilayer perceptron) - a review of applications in the atmospheric sciences. Atmos. Environ. 32, 2627–2636. doi: 10.1016/S1352-2310(97)00447-0
Han, H., Wang, W., and Mao, B. (2005). “Borderline-SMOTE: a new over-sampling method in imbalanced data sets learning,” in Advances in Intelligent Computing. ICIC 2005. Lecture Notes in Computer Science, Vol. 3644, eds D. S. Huang, X. P. Zhang, and G. B. Huang (Berlin; Heidelberg: Springer), 878–887. doi: 10.1007/11538059_91
Homburger, H., Schneider, M. K., Hilfiker, S., and Lüscher, A. (2014). Inferring behavioral states of grazing livestock from high-frequency position data alone. PLoS ONE 9:e114522. doi: 10.1371/journal.pone.0114522
Japkowicz, N. (2000). “The class imbalance problem: significance and strategies,” in Proceedings of the 2000 International Conference on Artificial Intelligence (Halifax, NS), 111–117.
Jensen, D. B., Toft, N., and Kristensen, A. R. (2017). A multivariate dynamic linear model for early warnings of diarrhea and pen fouling in slaughter pigs. Comput. Electron. Agric. 135, 51–62. doi: 10.1016/j.compag.2016.12.018
Larsen, M. L. V., Bertelsen, M., and Pedersen, L. J. (2019a). Pen fouling in finisher pigs: changes in the lying pattern and pen temperature prior to fouling. Front. Vet. Sci. 6:118. doi: 10.3389/fvets.2019.00118
Larsen, M. L. V., Pedersen, L. J., and Jensen, D. B. (2019b). Prediction of tail biting events in finisher pigs from automatically recorded sensor data. Animals 9:458. doi: 10.3390/ani9070458
Li, Y. (2014). “Normal and abnormal behaviors of swine under production conditions,” in Pig site factsheet Pork Inf. Gatew. Available online at: https://thepigsite.com/articles/normal-and-abnormal-behaviours-of-swine-under-production-conditions
Lin, T. Y., Goyal, P., Girshick, R., He, K., and Dollar, P. (2020). Focal loss for dense object detection. IEEE Trans. Pattern Anal. Mach. Intell. 42, 318–327. doi: 10.1109/TPAMI.2018.2858826
Loyola-González, O., Martínez-Trinidad, J. F., Carrasco-Ochoa, J. A., and García-Borroto, M. (2016). Study of the impact of resampling methods for contrast pattern based classifiers in imbalanced databases. Neurocomputing 175, 935–947. doi: 10.1016/j.neucom.2015.04.120
Mahani, A., and Riad Baba Ali, A. (2019). “Classification problem in imbalanced datasets,” in Recent Trends in Computational Intelligence, eds A. Sadollah, and T. Sinha (London: IntechOpen Press), 1–23. doi: 10.5772/intechopen.89603
MATLAB (2017). MathWorks, 2017. Available online at: http://www.mathworks.com
R Core Team (2013). R: A Language and Environment for Statistical Computing, 2.15.3 ed. Vienna: R Foundation for Statistical Computing. Available online at: http://www.r-project.org
Sakai, K., Oishi, K., Miwa, M., Kumagai, H., and Hirooka, H. (2019). Behavior classification of goats using 9-axis multi sensors: the effect of imbalanced datasets on classification performance. Comput. Electron. Agric. 166:105027. doi: 10.1016/j.compag.2019.105027
Smith, D., Rahman, A., Bishop-Hurley, G, Hills, J., Shahriar, S., Henry, D., et al. (2016). Behavior classification of cows fitted with motion collars: decomposing multi-class classification into a set of binary problems. Comput. Electron. Agric. 131, 40–50. doi: 10.1016/j.compag.2016.10.006
Tamura, S., and Tateishi, M. (1997). Capabilities of a four-layered feedforward neural network : four layers versus three. IEEE Trans. Neural Netw. 8, 251–255. doi: 10.1109/72.557662
Keywords: behavioral classification, Borderline-SMOTE, data augmentation, fattening pigs, imbalanced dataset, Sus scrofa domesticus, triaxial accelerometer
Citation: Jin M, Wang C and Jensen DB (2021) Effect of De-noising by Wavelet Filtering and Data Augmentation by Borderline SMOTE on the Classification of Imbalanced Datasets of Pig Behavior. Front. Anim. Sci. 2:666855. doi: 10.3389/fanim.2021.666855
Received: 11 February 2021; Accepted: 10 May 2021;
Published: 31 May 2021.
Edited by:
Joao R. R. Dorea, University of Wisconsin-Madison, United StatesReviewed by:
Dario Augusto Borges Oliveira, University of Wisconsin-Madison, United StatesIngrid De Jong, Wageningen Livestock Research, Netherlands
Copyright © 2021 Jin, Wang and Jensen. This is an open-access article distributed under the terms of the Creative Commons Attribution License (CC BY). The use, distribution or reproduction in other forums is permitted, provided the original author(s) and the copyright owner(s) are credited and that the original publication in this journal is cited, in accordance with accepted academic practice. No use, distribution or reproduction is permitted which does not comply with these terms.
*Correspondence: Chunguang Wang, amR3Y2dAaW1hdS5lZHUuY24=