 Jerine A. J. van der Eijk1*
 Oleksiy Guzhva2
 Alexander Voss3
 Matthias Möller3
 Mona F. Giersberg4
 Leonie Jacobs5
 Ingrid C. de Jong1*
- 1Animal Health and Welfare, Wageningen Livestock Research, Wageningen, Netherlands
- 2Biosystems and Technology, Swedish University of Agricultural Sciences, Alnarp, Sweden
- 3CLK GmbH Bildverarbeitung & Robotik, Altenberge, Germany
- 4Animals in Science and Society, Department Population Health Sciences, Faculty of Veterinary Medicine, Utrecht University, Utrecht, Netherlands
- 5Department of Animal & Poultry Sciences, Virginia Tech, Blacksburg, VA, United States
Routine monitoring of broiler chickens provides insights in the welfare status of a flock, helps to guarantee minimum defined levels of animal welfare and assists farmers in taking remedial measures at an early stage. Computer vision techniques offer exciting potential for routine and automated assessment of broiler welfare, providing an objective and biosecure alternative to the current more subjective and time-consuming methods. However, the current state-of-the-art computer vision solutions for assessing broiler welfare are not sufficient to allow the transition to fully automated monitoring in a commercial environment. Therefore, the aim of this study was to investigate the potential of computer vision algorithms for detection and resource use monitoring of broilers housed in both experimental and commercial settings, while also assessing the potential for scalability and resource-efficient implementation of such solutions. This study used a combination of detection and resource use monitoring methods, where broilers were first detected using Mask R-CNN and were then assigned to a specific resource zone using zone-based classifiers. Three detection models were proposed using different annotation datasets: model A with annotated broilers from a research facility, model B with annotated broilers from a commercial farm, and model A+B where annotations from both environments were combined. The algorithms developed for individual broiler detection performed well for both the research facility (model A, F1 score > 0.99) and commercial farm (model A+B, F1 score > 0.83) test data with an intersection over union of 0.75. The subsequent monitoring of resource use at the commercial farm using model A+B for broiler detection, also performed very well for the feeders, bale and perch (F1 score > 0.93), but not for the drinkers (F1 score = 0.28), which was likely caused by our evaluation method. Thus, the algorithms used in this study are a first step to measure resource use automatically in commercial application and allow detection of a large number of individual animals in a non-invasive manner. From location data of every frame, resource use can be calculated. Ultimately, the broiler detection and resource use monitoring might further be used to assess broiler welfare.
Introduction
Broilers may experience major welfare problems, which are caused by genetic selection, management and housing conditions adapted for efficient growth (Bessei, 2006; EFSA, 2010). Routine monitoring of broilers provides insights into the actual welfare status of a flock, helps to guarantee minimum defined levels of animal welfare and assists farmers in taking remedial measures at an early stage (EFSA, 2012). Current methods of identifying broiler welfare are often based on human observation, for example, the Welfare Quality® protocol (Welfare Quality®, 2009) and the AWIN transect method (Marchewka et al., 2013). The Welfare Quality® protocol provides precise information on the prevalence of welfare issues, but stakeholders have criticized it for being too time-consuming (de Jong et al., 2016). The transect method is less time consuming, but it lacks information on the specific prevalence of gait scores and does not include broiler behaviour (Ben Sassi et al., 2016). Moreover, for both protocols, assessors need to be trained, and outcomes may still be subjective, depend on the quality of the assessor, and biosecurity may be at risk (Ben Sassi et al., 2016). Therefore, these current welfare assessment protocols are not widely applied in practice.
The development of computer vision techniques for automated welfare assessment offers exciting potential for improvement and routine assessment of broiler chicken welfare (Ben Sassi et al., 2016; Li et al., 2020b). Continuous, automated monitoring of commercial broiler flocks provides an objective alternative to the current more subjective and time-consuming methods. With modern broiler houses often including thousands of chickens, the use of cameras and computer vision is a promising method to monitor commercial farms remotely and continuously. In addition, computer vision techniques provide a non-invasive and biosecure method for assessing broiler welfare. However, the current state-of-the-art computer vision solutions for assessing broiler welfare are not readily used in a commercial environment, likely due to the complexity of such an environment with many individuals moving simultaneously, often in difficult lighting conditions, setting extremely high requirements for hardware and software components.
Previous studies have used computer vision to identify broiler welfare and health. Most have focused on assessing activity and distribution either in an experimental (Bloemen et al., 1997; Calvet et al., 2009; Kristensen and Cornou, 2011; Youssef et al., 2015; Pereira et al., 2020) or commercial setting (Kashiha et al., 2013; Fernandez et al., 2018). Others focused on assessing gait score, contact dermatitis or health status, mainly in relation to activity and distribution, in an experimental (Aydin et al., 2010; Aydin et al., 2013; Aydin et al., 2015; Aydin, 2017a; Aydin, 2017b; Nääs et al., 2018) or commercial setting (Dawkins et al., 2009; Dawkins and Layton, 2012; Colles et al., 2016; Dawkins et al., 2017; Silvera et al., 2017; Van Hertem et al., 2018; Dawkins et al., 2021). Some have even used computer vision techniques to assess behaviour in an experimental setting (Pereira et al., 2013; Zhuang and Zhang, 2019; Li et al., 2021b). However, monitoring resource use (i.e., use of feeders, drinkers, enrichments, etc.) has received limited attention. In commercial broiler flocks, specific resource use can be used to evaluate flock health and welfare. Welfare criteria that can be assessed through resource use are the absence of prolonged hunger or thirst (i.e., feeding and drinking), and the expression of appropriate behaviour (i.e., species-specific natural behaviours, such as perching or making use of bale) (Welfare Quality®, 2009). These behaviours are an essential part of welfare and have been previously related to broiler health (Weeks et al., 2000; Abeyesinghe et al., 2021), making them relevant for broiler welfare assessment. Monitoring resource use of broilers can further be used to improve housing design, allocate resources more optimally and provide warnings of equipment malfunctioning (Kashiha et al., 2013). Recent studies have used computer vision techniques to detect the number of chickens drinking and feeding with high accuracy in an experimental setting (Guo et al., 2020; Li et al., 2020a). However, the challenge remains to validate these methods in larger groups of broilers and at higher stocking densities, which are common in a commercial setting. Fernandez et al. (2018) did monitor drinking and feeding behaviour in a broiler flock by selecting specific zones and using a model with correlations between activity and occupation. However, they did not specifically identify the number of broilers actually making use of the resources.
There is also a sub-set of studies exploring different segmentation techniques to monitor area usage and environmental effects through activity and distribution indices (Fang et al., 2020; Pereira et al., 2020; Del Valle et al., 2021). These studies used segmentation techniques requiring the removal of different resources of interest (e.g., feeders, drinkers) during the pre-processing stage (Li et al., 2020a; Del Valle et al., 2021), or applying several additional filtering techniques, thus potentially increasing the computational times and limiting image processing at high stocking density scenes. The instance segmentation approach (e.g., based on Mask R-CNN) is potentially more suitable in a commercial setting since it can handle the varying number of individuals in the scene as well as additional objects of interest, and performs well when trained on smaller custom datasets (e.g. which is the case for most studies within the animal science domain). The aim of this study was to investigate the potential of computer vision algorithms for detection and resource use monitoring of broilers housed in both experimental and commercial settings while also assessing the potential for scalability and resource-efficient implementation of such solutions.
Materials and methods
Ethical approval
The experiment procedures were checked with the national legislation on animal experiments by the Animal Welfare Body. Because the procedures were non-invasive, this study was not considered to be an animal experiment under the Law on Animal Experiments, as confirmed by the local Animal Welfare Body (25th of February 2020, Wageningen, The Netherlands). Housing and management complied with the Dutch law on animal wellbeing.
Animals and housing
Research facility
Day-old broiler chickens (Ross 308) from a commercial hatchery were housed in two groups of 24 chickens with an exact 50%/50% male/female distribution in 6.0m2 pens (length: 3m x width: 2m). Wood shavings were provided as litter material. To stimulate a wide range of natural behaviours, pens further included a lucerne bale, a dustbathing area filled with peat (length: 1m x width: 1m), a perch (length: 1.5m, height: 5cm), and grains were distributed daily. Management was according to commercial practice with ad libitum access to feed (a standard 3-phase commercial diet) and water. Standard temperature, relative humidity, lighting and vaccination schedules were applied. Two subsequent cycles of 38 days were run at the research facilities of Wageningen University and Research, after which broilers were slaughtered.
Commercial farm
Approximately 28,000 day-old broilers (Ross 308, as-hatched) from a commercial hatchery were housed in a concrete-floored commercial broiler house of 1530m2 (length: 85m x width: 18m) located in the Netherlands. Two cycles of 43 days were run at the commercial poultry farm. Crushed straw pellets were provided as litter material. Management was according to commercial practice with ad libitum access to feed (a standard 3-phase commercial diet) and water. Standard temperature, relative humidity, lighting and vaccination schedules were applied. For an overview of the different environments, see Table 1.
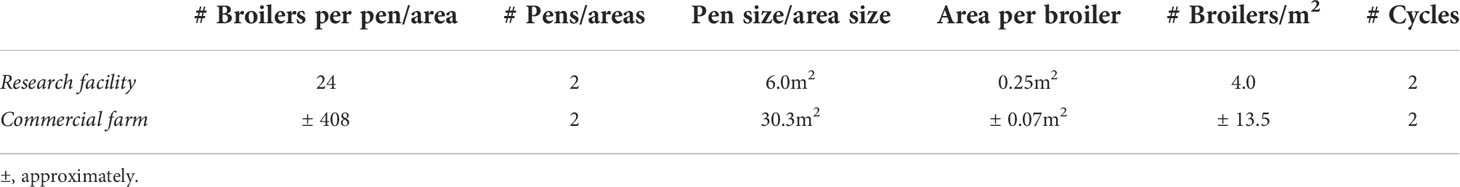
Table 1 Information of different cycles at the research facility and commercial farm.
Data collection and preparation
A 2D (Near InfraRed) camera (acA2040-25gmNIR – CMV400, Basler AG, Germany) was mounted above each pen/area, providing a top-down view, and recorded 8 hrs per day during the experiment (camera height: 3m for the research facility and 3.4m for the commercial farm). At the research facility, one camera was installed to cover one whole pen with two pan feeders and three nipple drinkers with cups. At the commercial farm, one camera was installed covering one area (approximately 30.3 m2 and including on average 408 broilers) with a perch, wood shavings bale, feeder and drinker lines, with approximately six pan feeders and 50 nipple drinkers with cups visible. The video frames had a resolution of 2048 x 2048 pixels and were recorded at a framerate of 8 Frames Per Second (FPS). In total, 336 hrs of recordings were collected from the research facility and 576 hrs of recordings from the commercial farm. Cameras were connected to a desktop PC and videos were stored on hard disk.
Frames were annotated using Computer Vision Annotation Tool (CVAT) distributed under an open MIT license (Computer Vission Annotation Tool (CVAT)). One annotation class (broiler) was used, and all broilers present in each pre-selected frame were annotated by manually drawing their contour. Different segmentation models were evaluated to assure the best broiler detection results possible under varying circumstances: using frames from the research facility (model A), using frames from the commercial farm (model B), and a combination of these two (model A+B).
The dataset for model A contained annotations of randomly selected frames from broilers between 14 and 37 days of age housed in the research facility. The images chosen for annotation were representative of all days of age (day 14-37) and uniformly selected from all recorded hours. Model A dataset consisted of 259 manually annotated frames (containing 5574 annotated broilers in total).
The dataset for model B consisted of 15 randomly selected frames (containing 6686 annotated broilers in total) from broilers between 14 and 17 days of age housed in the commercial farm and pre-selected uniformly from all recorded hours. Only images of young broiler chicks were included as we experienced issues with correct segmentation of young chicks compared to older chicks for the research facility. Only 15 images were manually annotated due to a very high broiler stocking density in each frame, requiring substantial time for creating the reference images.
Model A+B consisted of broiler annotations from the research facility and the commercial farm, with 274 annotated frames in total (259 used for model A + 15 used for model B).
For all three segmentation models, frames were split into 70% training data, 20% validation data and 10% test data.
Object detection
Due to this study’s explorative and comparative nature, different segmentation models were used to investigate the performance and potential caveats of computer vision-based resource usage monitoring in different settings and at different stocking densities. There are several ways to address the challenge of automated resource use monitoring in broilers – with and without individual identification. Both approaches might provide data necessary for quantitative assessment of resource usage, but might differ in requirements needed for the initial algorithm implementation as well as potential repeatability and flexibility across different scenarios. Annotated images from the research facility were used to train a segmentation algorithm (U-Net) based on a convolutional neural network architecture and which operates on a pixel level, assigning the specific class value to each pixel in an image (e.g., broiler, feeder etc.). The segmentation result was then used in a postprocessing step to split up groups of broilers to identify a single broiler in the image. U-Net is one of the most popular image segmentation techniques used for semantic segmentation (Ronneberger et al., 2015). For the commercial farm images, stocking density was higher than at the research facility and the initial U-Net-based segmentation approach did not perform well. Therefore, annotated images from the commercial farm were used to train a different segmentation algorithm (Mask R-CNN). Mask R-CNN is a deep neural network aimed to solve instance segmentation problems in machine learning or computer vision (He et al., 2020) and is an extension of another object detection algorithm (Faster R-CNN) with an extra mask head. The main difference between semantic and instance segmentation techniques is that the latter not only differentiates between foreground/class pixels and background pixels, but also allows within-class differentiation. Such within-class differentiation allows the localization of individual broilers and improves the object separation in highly occluded scenes (e.g., high stocking density). Mask R-CNN adds a branch/layer to its architecture that deals with the prediction of segmentation masks in a pixel-to-pixel manner. This results in fewer trainable parameters, which reduces the computational and inference times while also greatly improving accuracy. In a scenario where the algorithm needs to handle different broiler ages in different production environments, this extra (RoI Allign) layer of Mask R-CNN allows higher segmentation accuracy under strict localization metrics (IoU > 0.50).
U-Net segmentation model implementation
The U-Net model was implemented in python programming language, using Keras and Tensorflow Deep Learning libraries for GPU (Yakubovskiy, 2019). The U-Net model with MobileNetV2 backbone, pre-trained on ImageNet weights was fine-tuned to utilize the images from our custom dataset and re-trained with randomly initialized decoder in order not to damage the weights of properly trained encoder. The model was trained with the batch size of two for 40 epochs with horizontal and vertical flipping applied to images as an additional augmentation step. The results of the U-Net segmentation model training can be seen in Figure 1A.
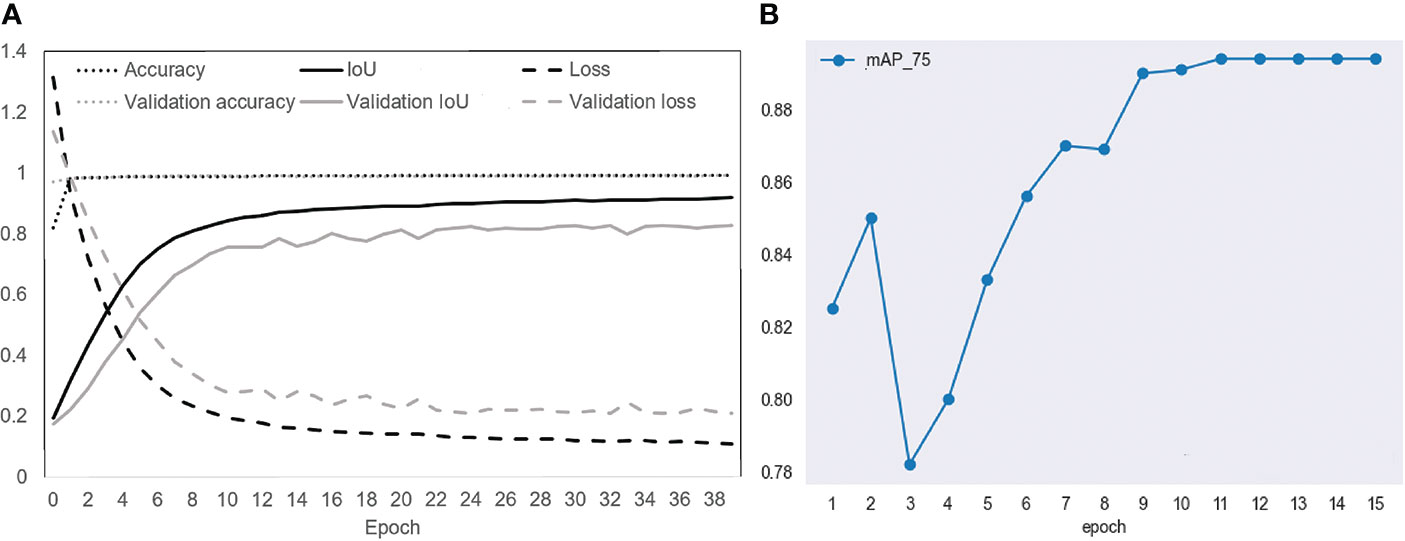
Figure 1 (A) Results of the U-Net segmentation model training with accuracy, intersection over union (IoU) score, and loss in black or in grey for validation. (B) The evaluation results of the Mask R-CNN model using IoU of 0.75.
Mask R-CNN segmentation model implementation
The Mask R-CNN model was implemented in python programming language, using PyTorch Deep Learning library for GPU (Chen et al., 2019) hosted by OpenMMLab, which is an open-source object detection toolbox with models optimized for transfer learning. The cascade Mask R-CNN model with ResNeXt (X-101-32x4d-FPN) backbone, pre-trained on COCO dataset was fine-tuned to utilize the images from our custom dataset and re-trained with adjustments made to number of classes in the mask head (only two classes used – broiler/background, compared to COCO dataset containing 80 different object classes).
The input images for Mask R-CNN were tiled into 2x2 tiles, with 60 overlapping tiles in total, to assure optimized hardware usage during algorithm training as well as to prevent overfitting. Each tile had a fixed resolution of 1075 x 1075 pixels. The overlapping window with a width and height of 102 pixels was larger than the pixel mask representing an individual broiler. For each tile, all the broilers were individually segmented, and those localized in the overlapping margin were therefore segmented twice. These broiler masks were then post-processed to merge the instances of the same broiler to have only one broiler region instead of two in an output image.
The model was trained for 15 epochs and the final model performance was evaluated at AP IoU 0.75. The AP IoU 0.75 is so called strict challenge model performance metric, commonly used in object detection challenges to further investigate the generalization capabilities of the final model. The evaluation results can be seen in Figure 1B.
The following GPU was used for the training of both segmentation models: Nvidia GeForceGTX 1070 with 8GB of VRAM.
Resource use monitoring
In order to monitor the usage of different resources (i.e., drinkers, feeders, perch, bale), these resource zones were manually defined as regions of interest (ROI) in the original image (i.e., pixels that belong to a resource zone were manually marked and assigned a specific resource label). The use of a resource was defined by the number of broilers present/detected in that specific resource zone at a frame-to-frame basis allowing time-based quantification. All broilers in each input image were segmented by Mask R-CNN algorithms and then assigned to a specific zone. To assign segmented broilers to specific resources, zone-based classifiers were developed. These classifiers were rule-based to allow greater variability in potential monitoring scenarios as well as to assure that different complexity in user-defined resource zone related behaviours could be achieved. For example, for bale use, only broilers whose centre of gravity (central point in individual mask representing broiler as a unique segmentation object) was localized inside the defined bale ROI were considered as those using a bale. In contrast, broilers with an intersection area of at least 100 pixels between their individual masks and masks of the feeder or drinker were assigned to those resource zones.
In the commercial farm images, broilers could be below the perch but still intersect with the perch zone. Therefore, all broilers intersecting with the perch needed to be classified into ‘perching’ or ‘not perching’ (Figure 2). For the perching broilers, the difference between the region of the broiler and the perch was calculated. This led to two sub-regions for each broiler. If these two regions had an area ratio of ≥ 0.3, a broiler was counted as a candidate for perching. In the next step, the broiler’s surface area was used to extract two surface features (grey value of pixels, as broiler and perch differ in colour) which were used to train a linear classifier to distinguish between perching and not perching. In total, 268 instances of broilers ‘not perching’ and 220 instances of broilers ‘perching’ were used for the training.
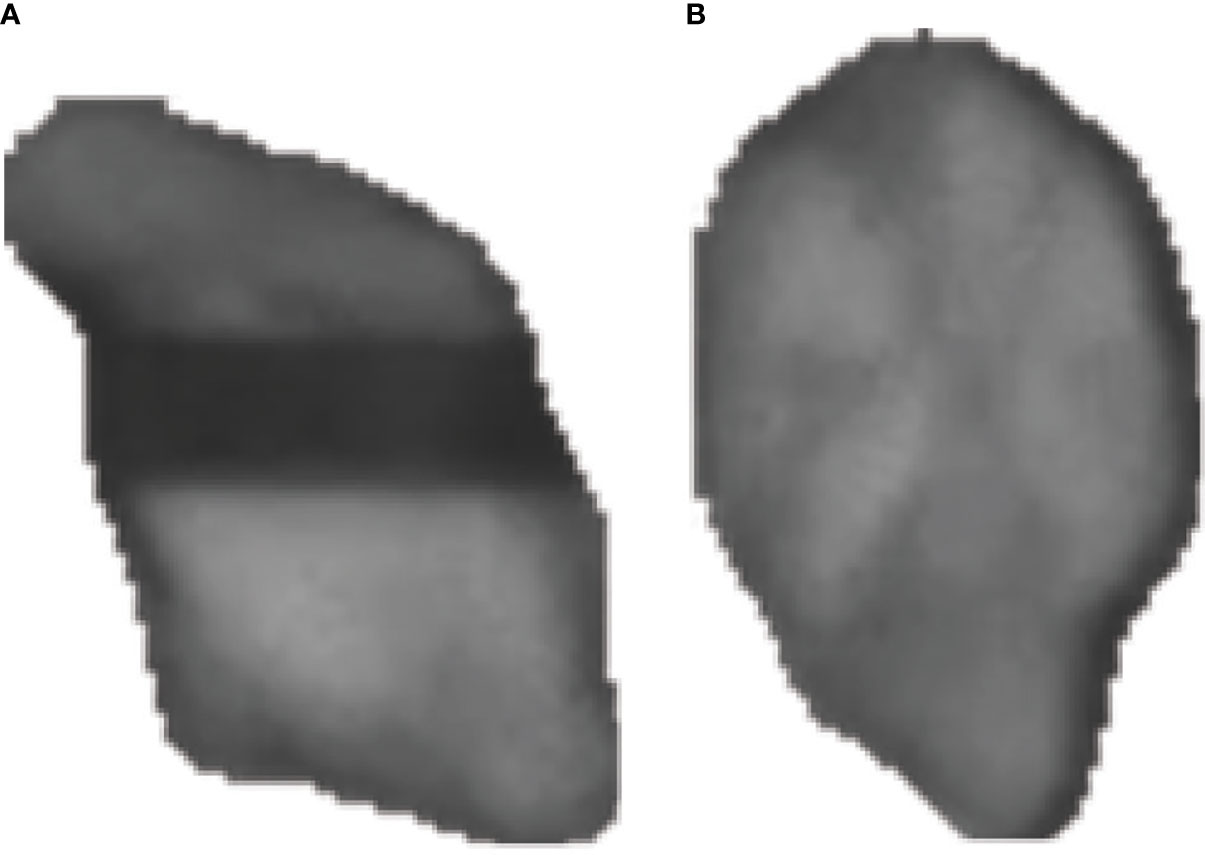
Figure 2 Example of (A) not perching broiler and (B) perching broiler.
In addition, some resource zones were not stationary in the commercial farm, i.e., feeders, drinkers and perches are often suspended from the roof and can therefore move in and out of the image. To overcome this issue, an alternative approach was developed where the initial detection and segmentation of the feeders were performed and followed by the broiler-to-specific-resource zone assignment using the newly detected feeder zone ROI (Figure 3). In other words, the Intersection over Union (IoU) of the ROI of the detected feeder and the ROI of the broiler was calculated. For this, a segmentation network based on U-Net architecture was trained.
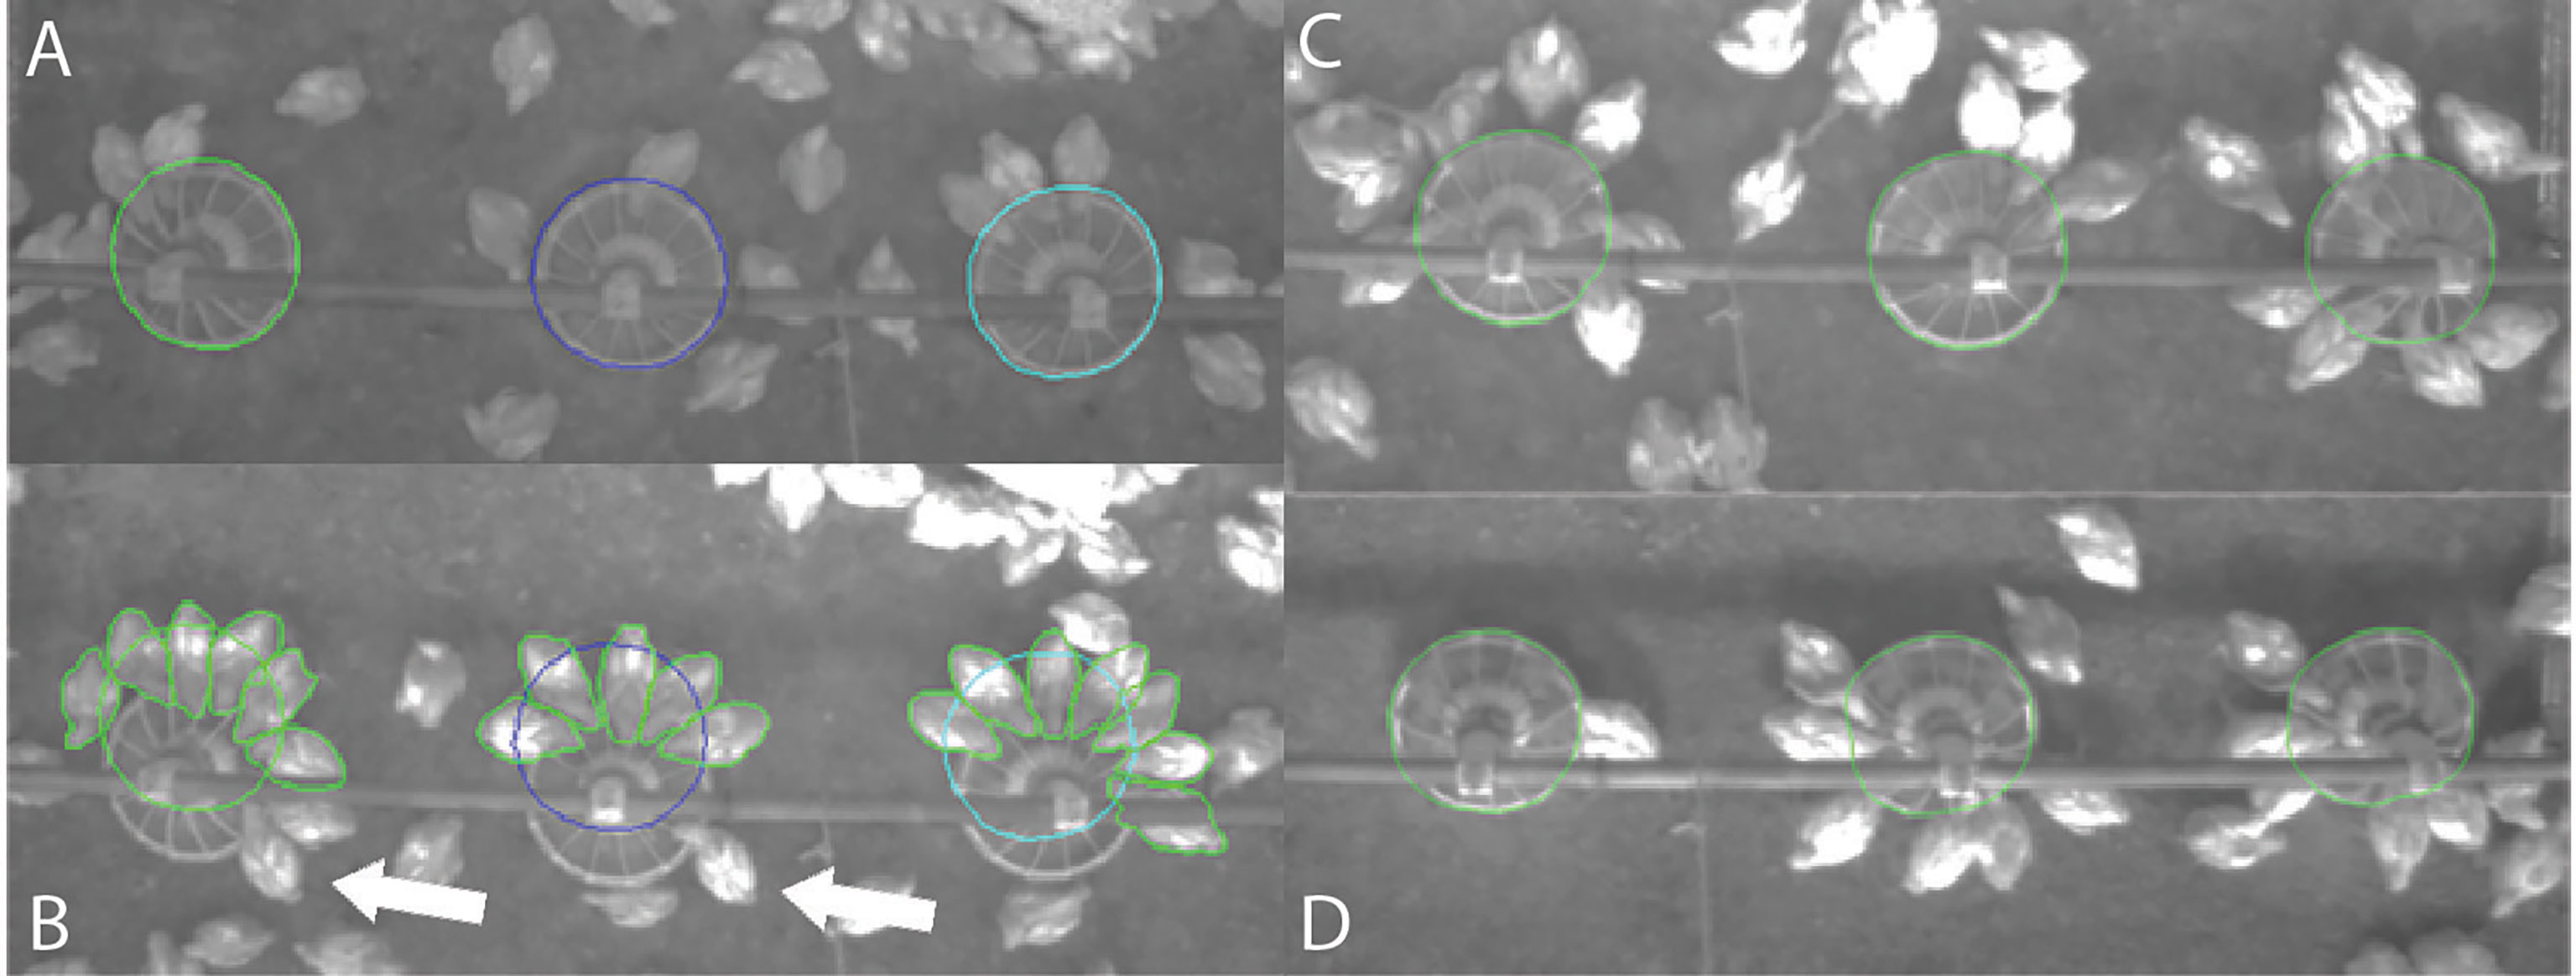
Figure 3 (A) Defined static feeder region of interest (ROI) indicated by green, dark blue and light blue circles, (B) moved feeders where some chicks are not assigned to the static feeder ROI (indicated with arrows), (C, D) automatically detected (dynamic) feeders with ROI.
Model evaluation
Object detection
As the U-Net segmentation approach did not perform well on the commercial farm data, only the Mask R-CNN segmentation approach was evaluated for those images. To evaluate the quality of segmentation produced by U-Net and Mask R-CNN segmentation models, the IoU metric, also known as the Jaccard index (Jaccard, 1912) was used. IoU is calculated as the area of the intersection divided by the area of the union of a predicted contour (Cp) and a ground-truth contour (Cgt):
The IoU metric ranges between values 0 and 1, where 0 is no overlap and 1 is perfect overlap. Another criterion determining whether detection is a True Positive (TP) or a False Positive (FP) is a confidence score which is the probability that a Bp contains an object or how certain the model is about it. So, for the detection to be considered a TP the following three conditions should be satisfied: the confidence score is greater than the detection threshold, the predicted class matches the class of ground truth, and finally, the IoU value is greater than a defined threshold (e.g., 0.50). Two different values for the IoU threshold were used for the segmentation model evaluation 0.50 and 0.75.
In order to evaluate the overall segmentation model performance, the F1 score metric was used:
*FN = False Negative
Resource use monitoring
For evaluation of resource usage, all broilers within a specific resource zone were manually marked by experienced observers. Observers marked broilers using the CVAT tool by adding a centre point (cyan solid circle) to each individual broiler, which was then compared with the centre point created by the segmentation/detection algorithm (red open circle) (Figure 4). The actual resource usage was treated as a binary classification problem (i.e., within the resource zone, outside the resource zone), and the comparison between the ground truth and segmentation model prediction was used to calculate the number of TP, FP, True Negative (TN) and False Negative (FN) cases. The F1 score metric was used to evaluate the overall resource use performance.
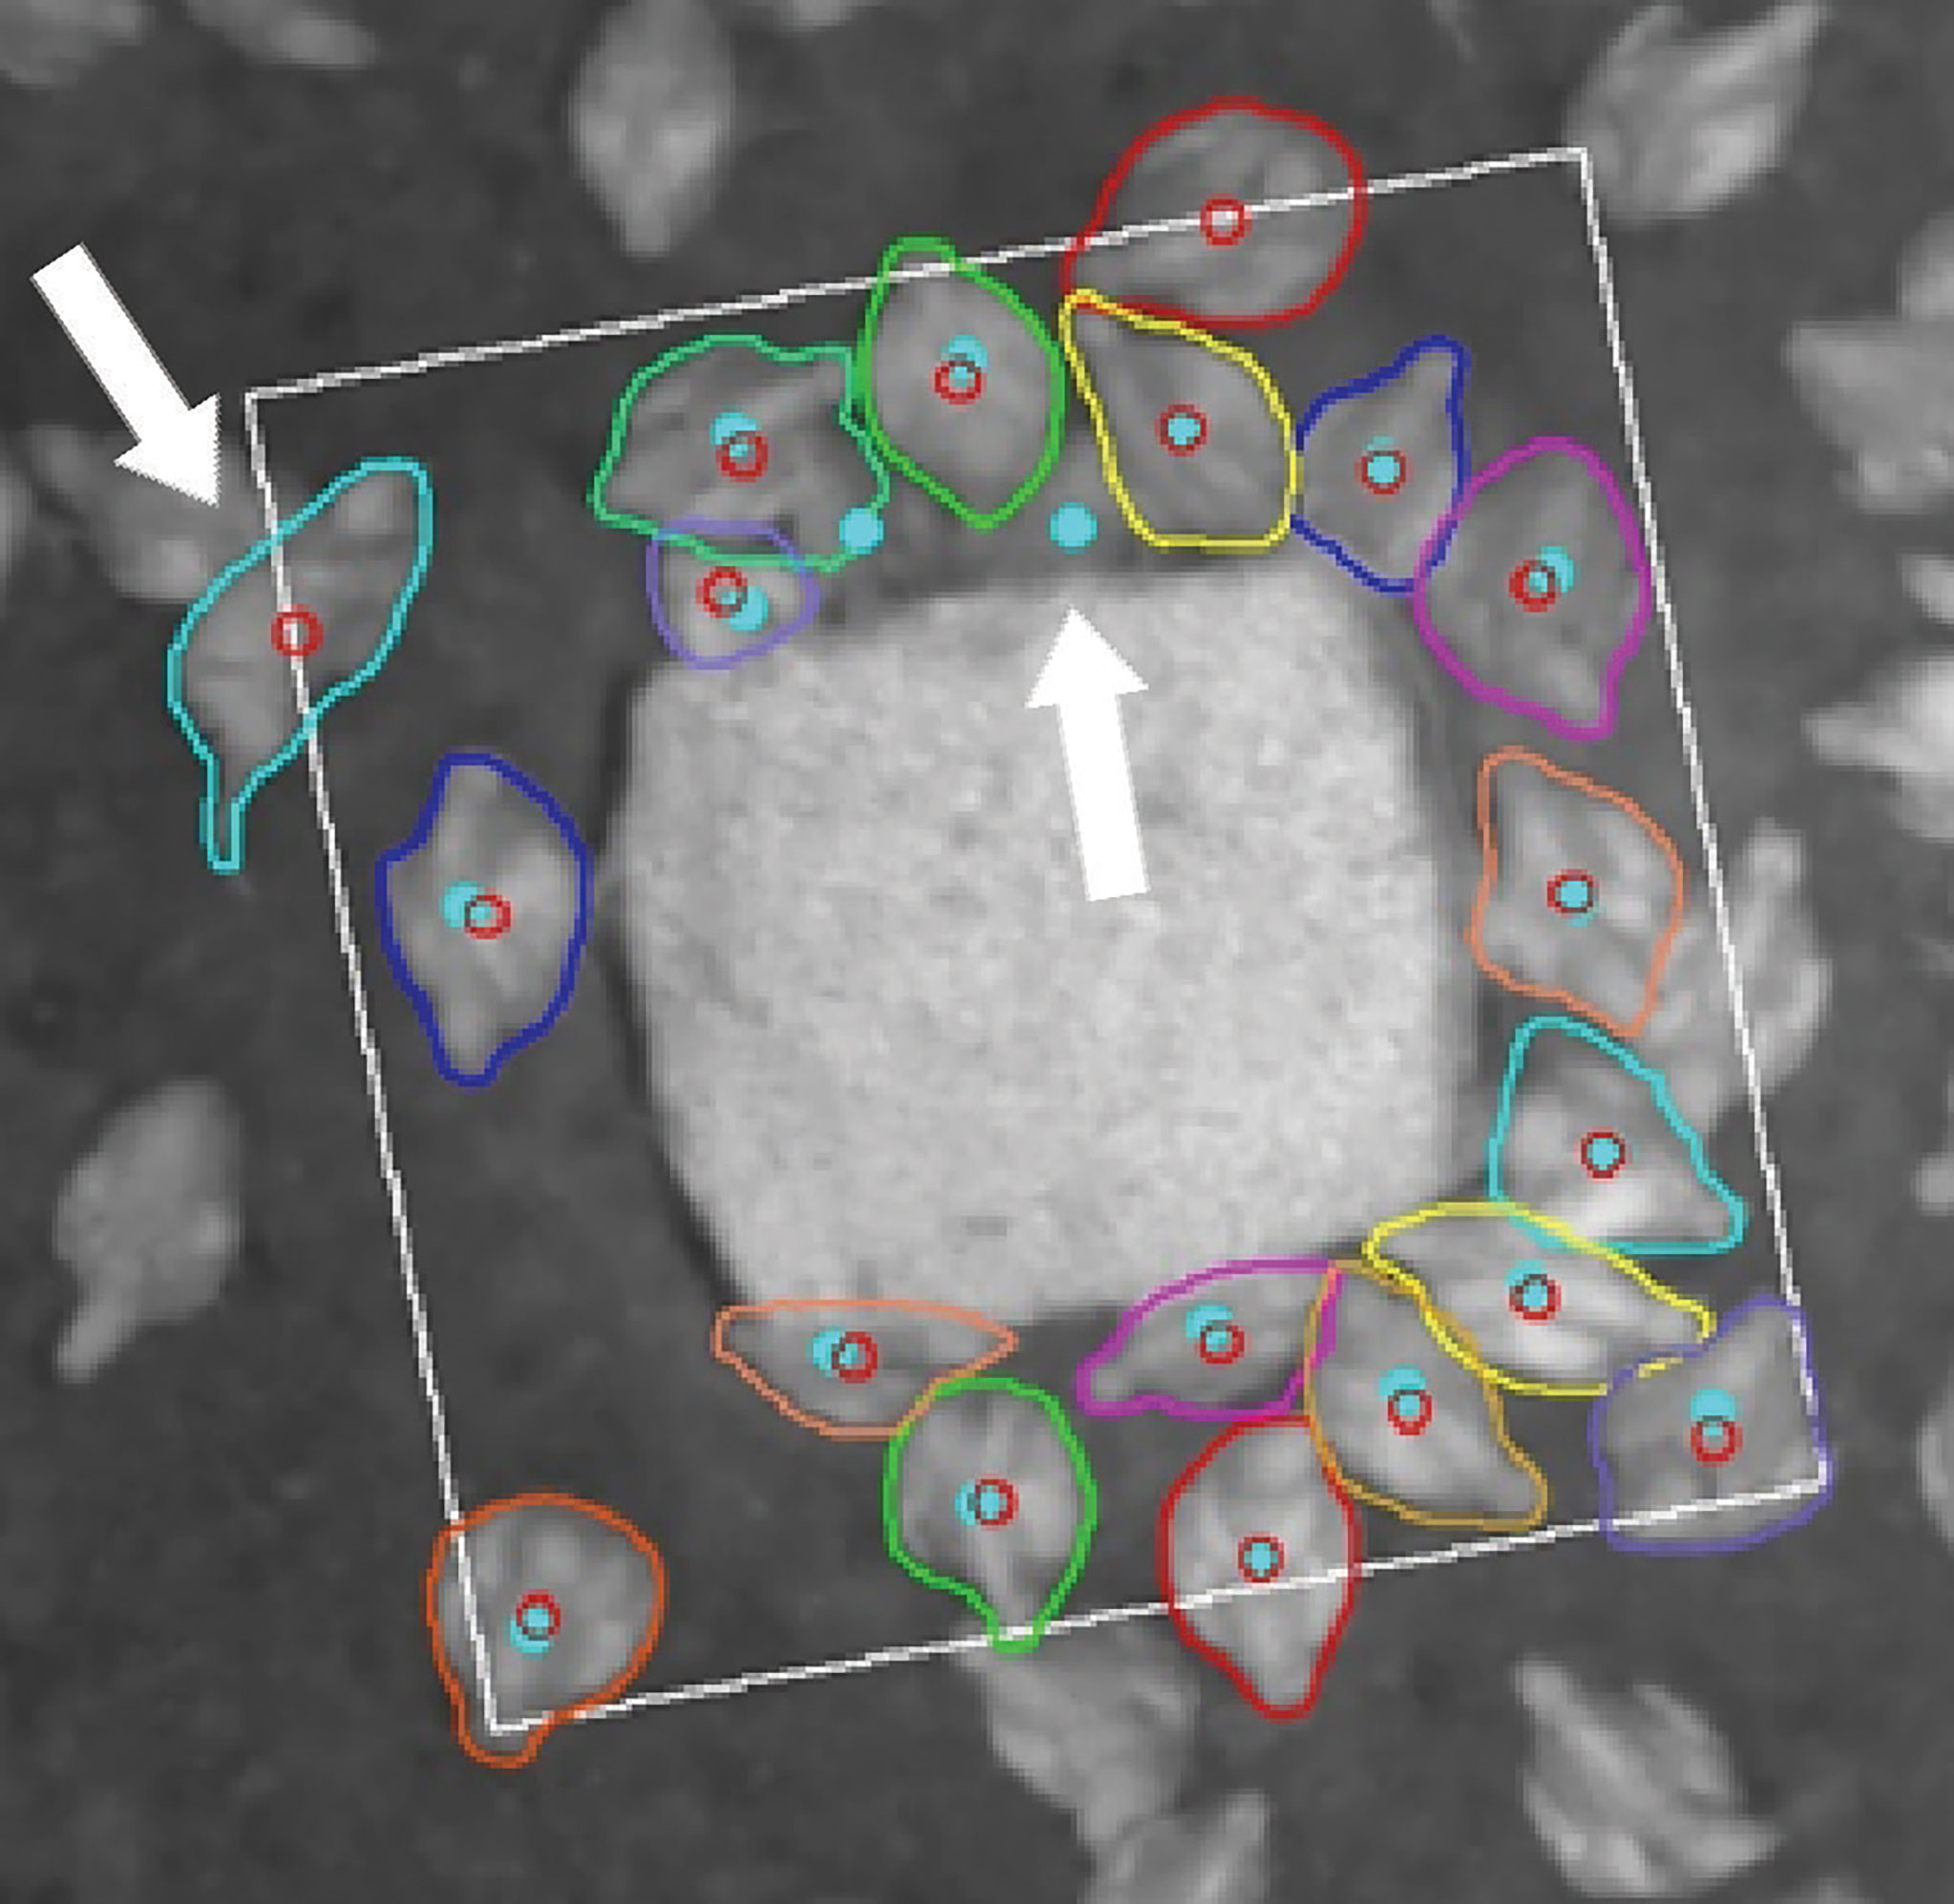
Figure 4 Example of evaluation method for bale use. Manually annotated broilers are marked with a solid cyan dot, detected broilers using the bale are marked with an open red circle. Some broilers were not detected and assigned to the bale zone, and some were assigned to the zone which were on the zone edge and were not manually annotated (indicated with arrows).
Results
Object detection
The segmentation performance for all three segmentation models is shown in Table 2, using an IoU threshold of 0.50 or 0.75. With an IoU threshold set to 0.50, the F1 score was above 0.90 in both environments. Model A+B reached an F1 score above 0.95. With the IoU threshold set to 0.75, differences in detection consistency become clearer. For the research facility images, the F1 score was higher when using Mask R-CNN compared to U-Net and for model A compared to model A+B (Mask R-CNN only). For the commercial farm images, the F1 score was higher for model A+B compared to model B.
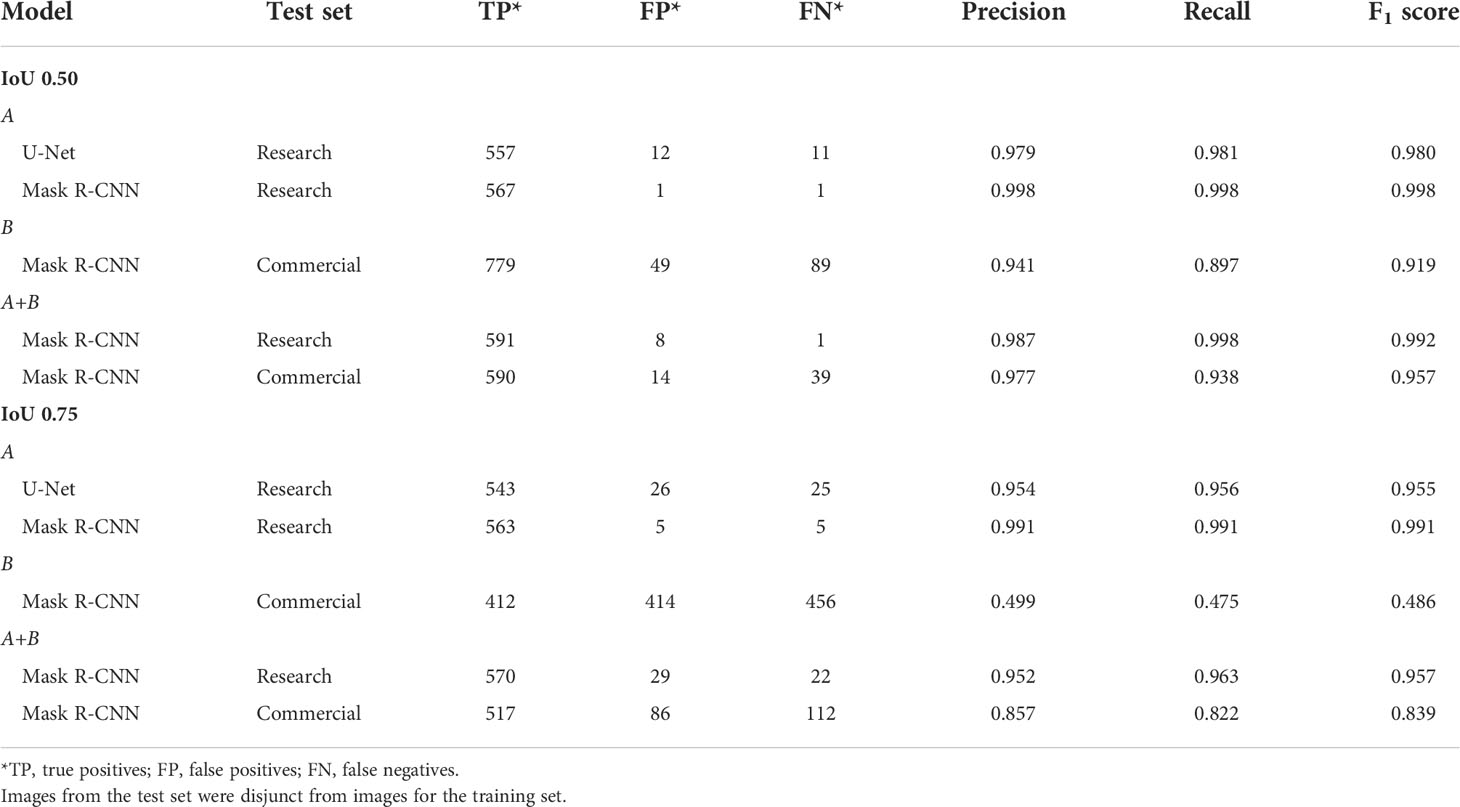
Table 2 Segmentation quality at intersection over union (IoU) of 0.50 and 0.75 for all three detection models (A, B, A+B) with the used approach specified (U-Net or Mask R-CNN) and test set.
For both IoU of 0.50 and 0.75, we see that the number of FP and FN dropped drastically when model A+B was used for commercial farm images compared to when model B was used. In contrast, for both IoU, we see that the number of FP and FN dropped drastically when model A was used for research facility images compared to model A+B, where this decrease was greater at IoU 0.75 than at IoU 0.50 and greater for FP than FN. Model A was used for resource use assessment in the research facility, while model A+B was used in the commercial farm as these performed best in the respective environments for both IoU thresholds.
Figure 5 shows an example frame to compare segmentation results of the exact same frame of the research facility using U-Net and Mask R-CNN. The U-Net approach performs worse when broilers are clustered closely together, whereas the Mask R-CNN has no issues with separating individual broilers within a cluster. Similarly, Figure 6 shows two identical frames to compare segmentation results of the commercial farm using either model B or model A+B with the Mask R-CNN approach. Model B performed worse compared to model A+B, as more broilers are individually recognized in the frame using model A+B.
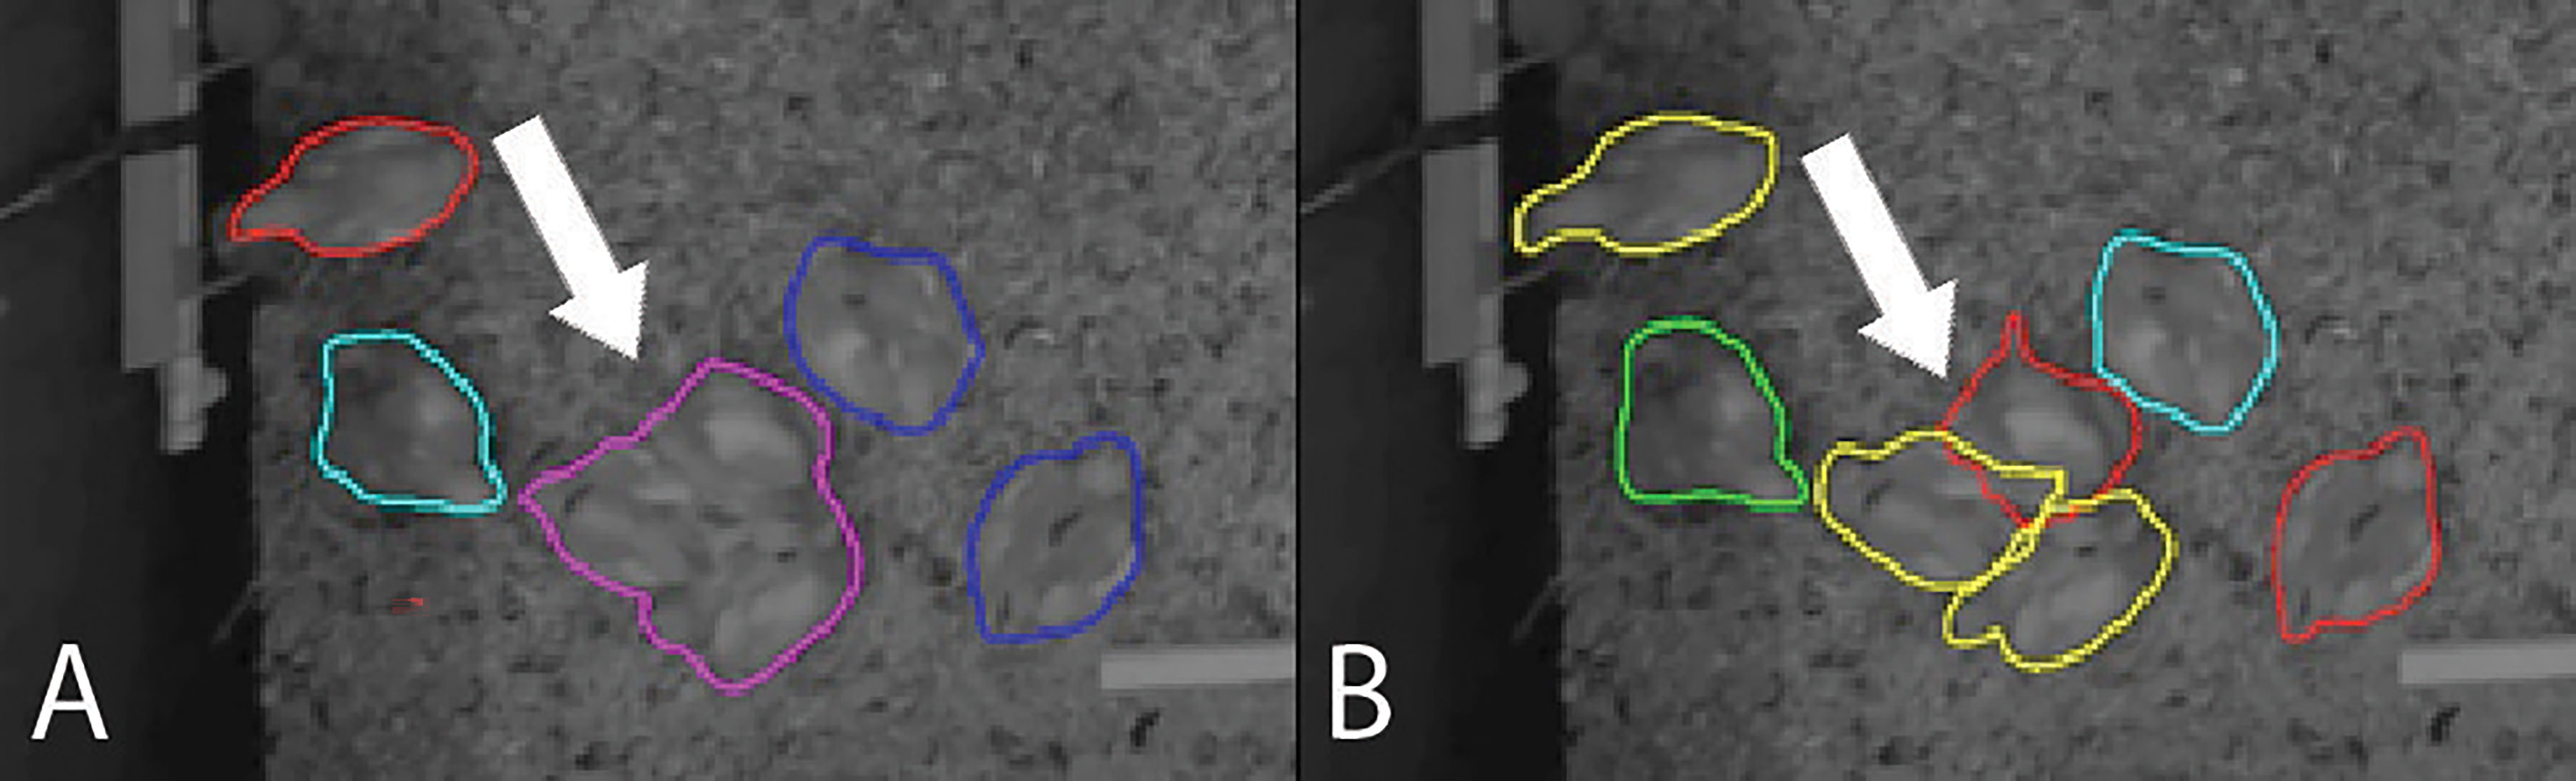
Figure 5 Comparison of segmentation results for the research facility using (A) U-Net or (B) Mask R-CNN approach. The purple segmentation in (A) shows a cluster of three broilers that were wrongly annotated as a single broiler.
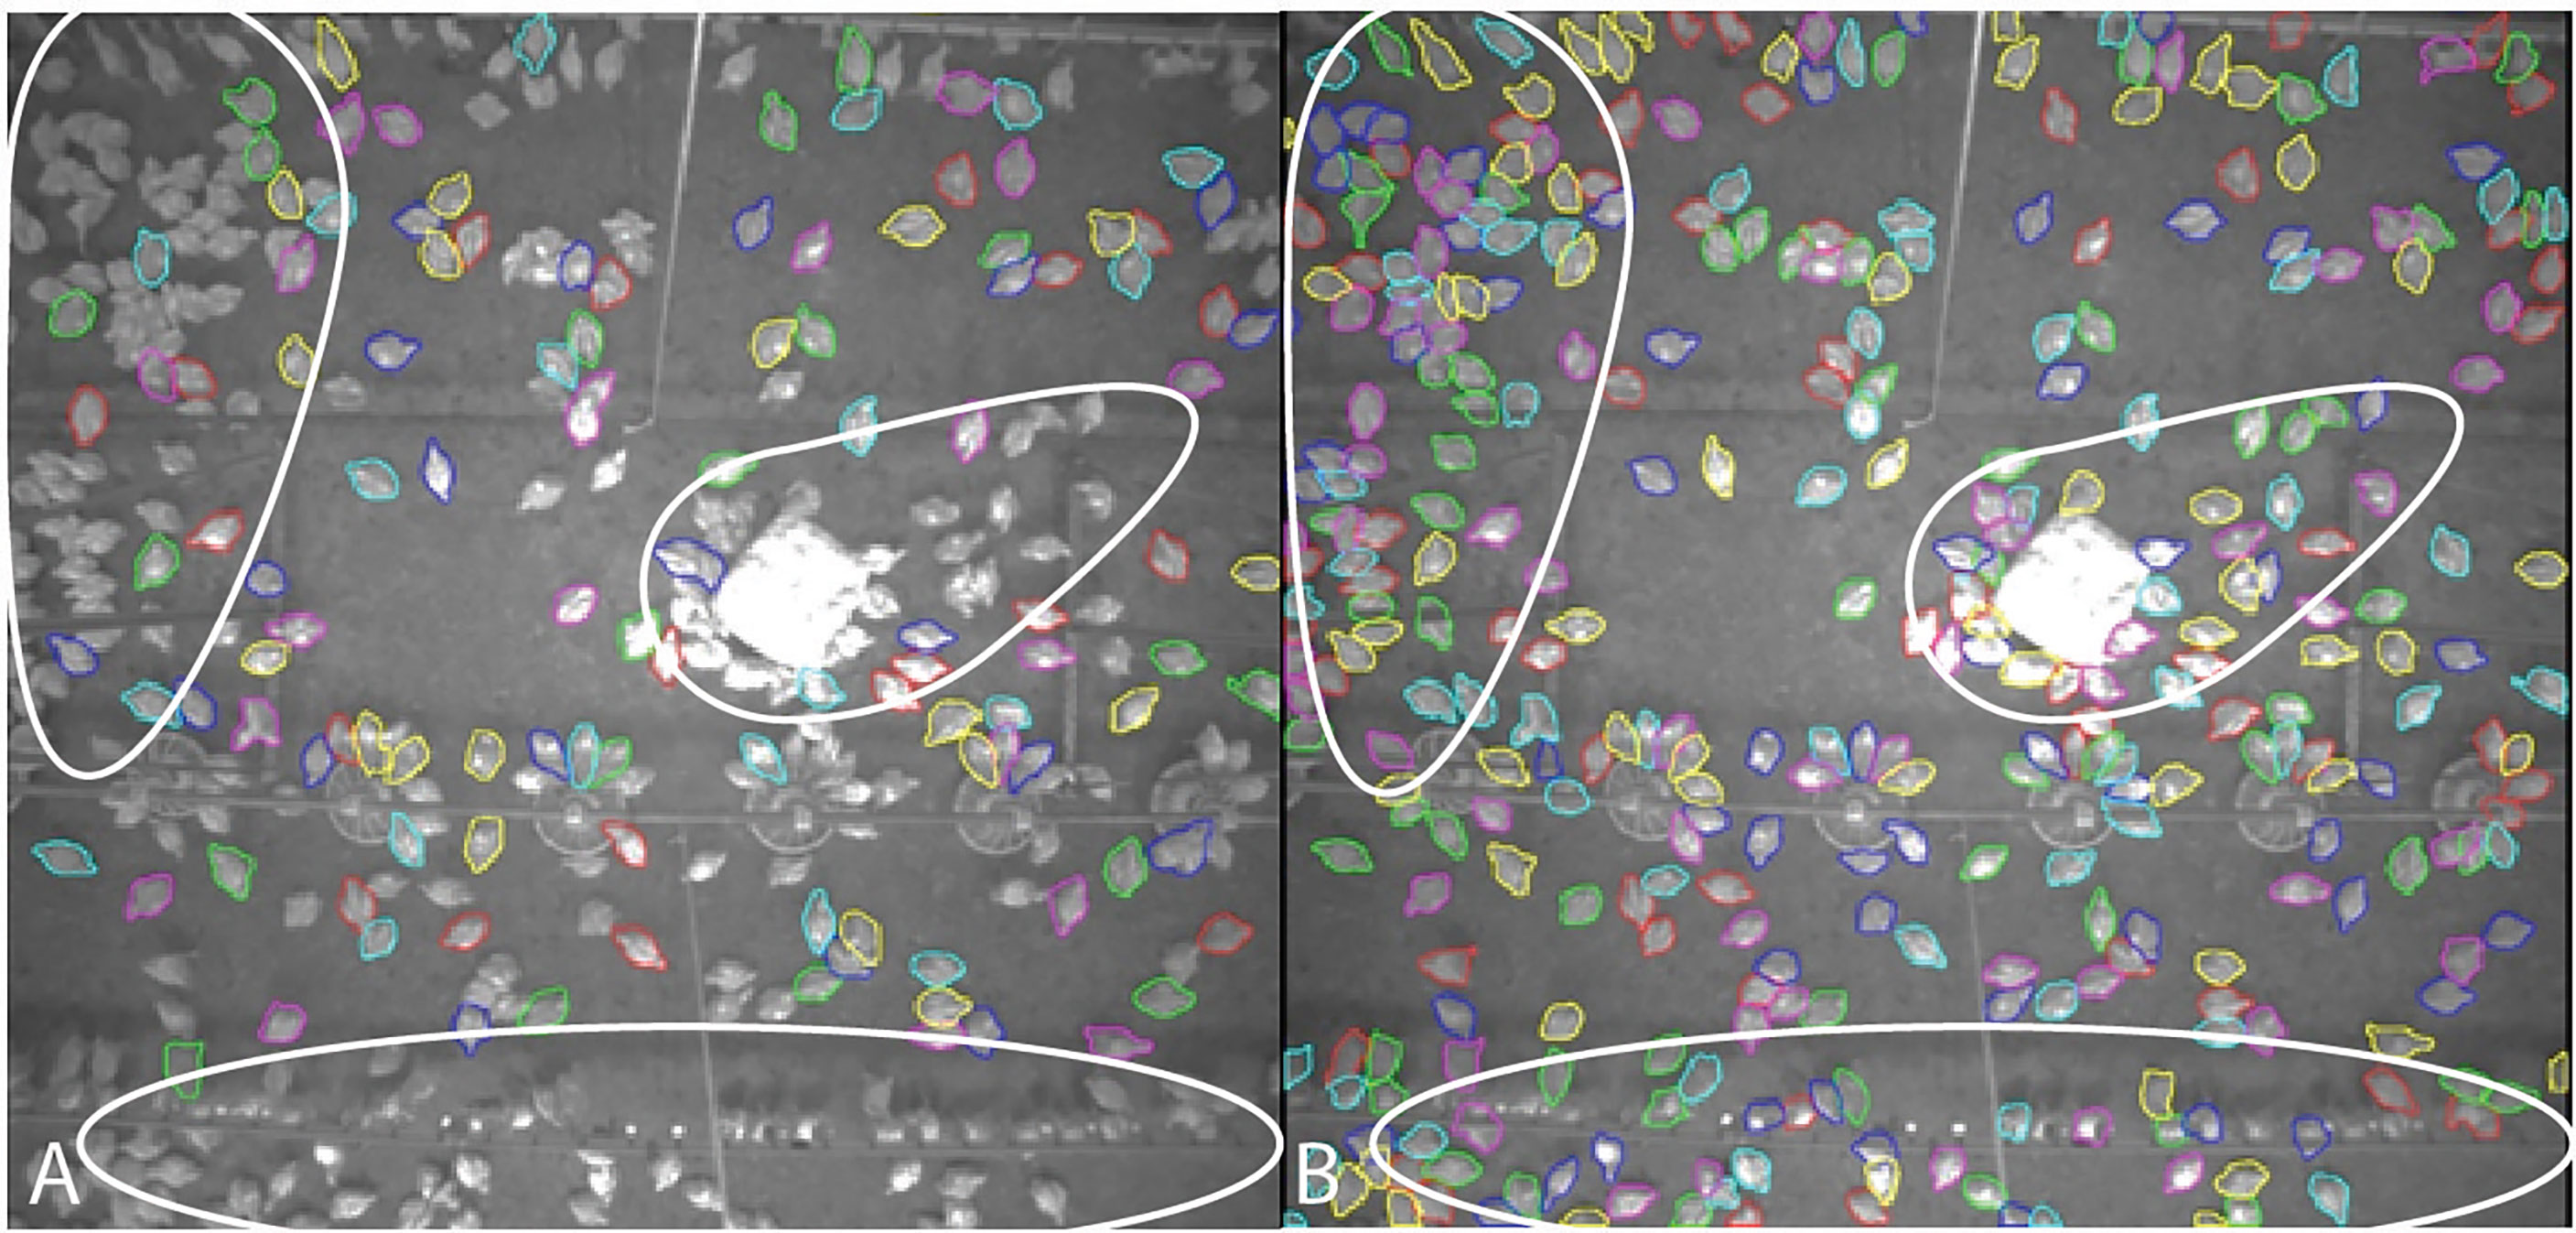
Figure 6 Comparison of segmentation results for the commercial farm using (A) model B or (B) model A+B with the Mask R-CNN approach. Circles indicate where broilers were not segmented by model B but were segmented by model A+B.
Resource use monitoring
Figure 7 shows example frames where resource use (i.e., feeders, drinkers, perch, bale) is indicated for both the research facility and commercial farm. Figure 8 displays the number of broilers per hour using specific resources at a young age for the research facility and commercial farm. The resource use performance for the commercial farm images are shown in Table 3, with detections produced using the combined segmentation model. The F1 score was above 0.93 for all zones, except for the drinker zone, where the score was 0.28.
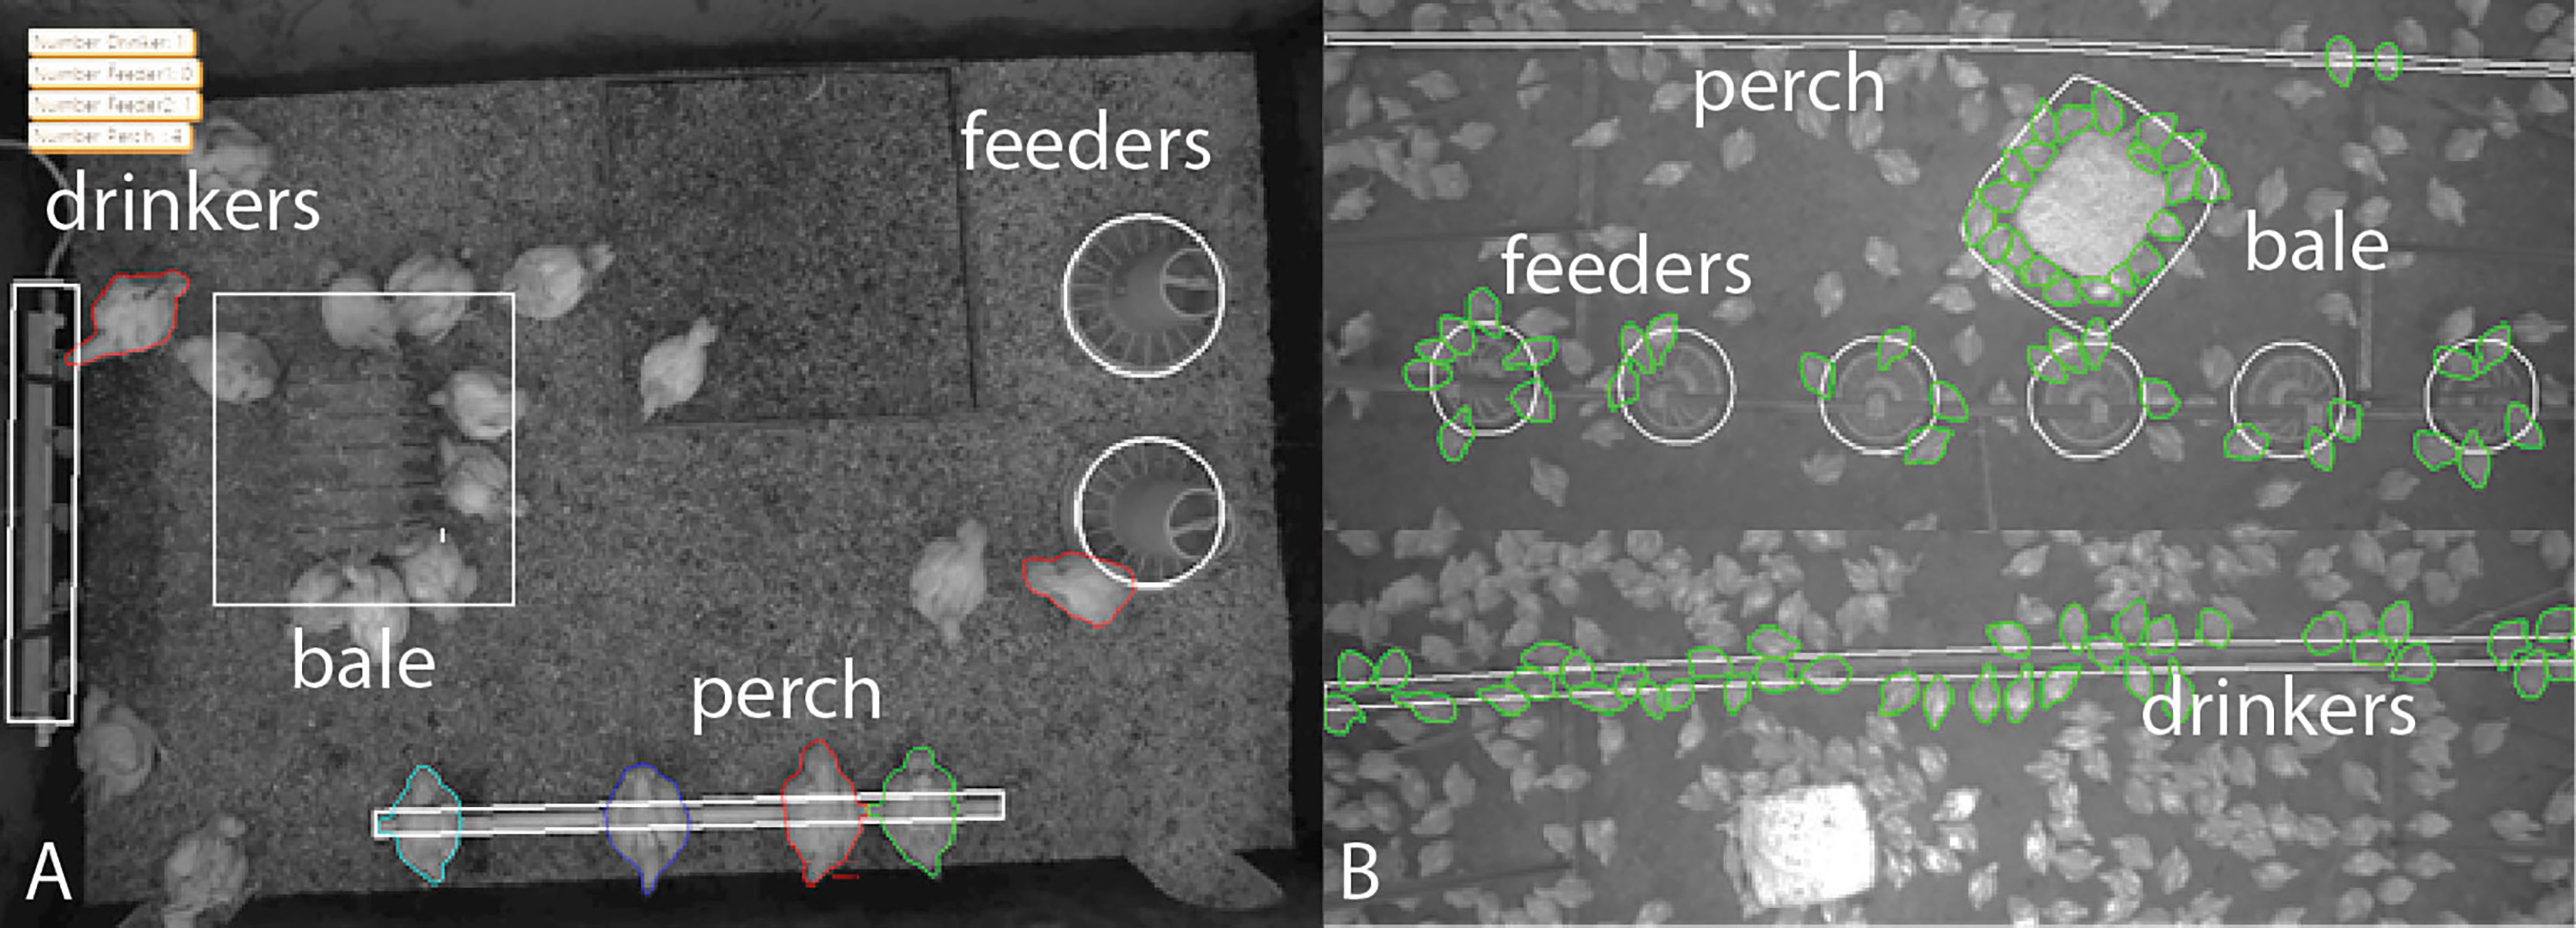
Figure 7 Examples of resource use in the (A) research facility and (B) commercial farm, the zones are visualized in white, the assigned broilers in colour.
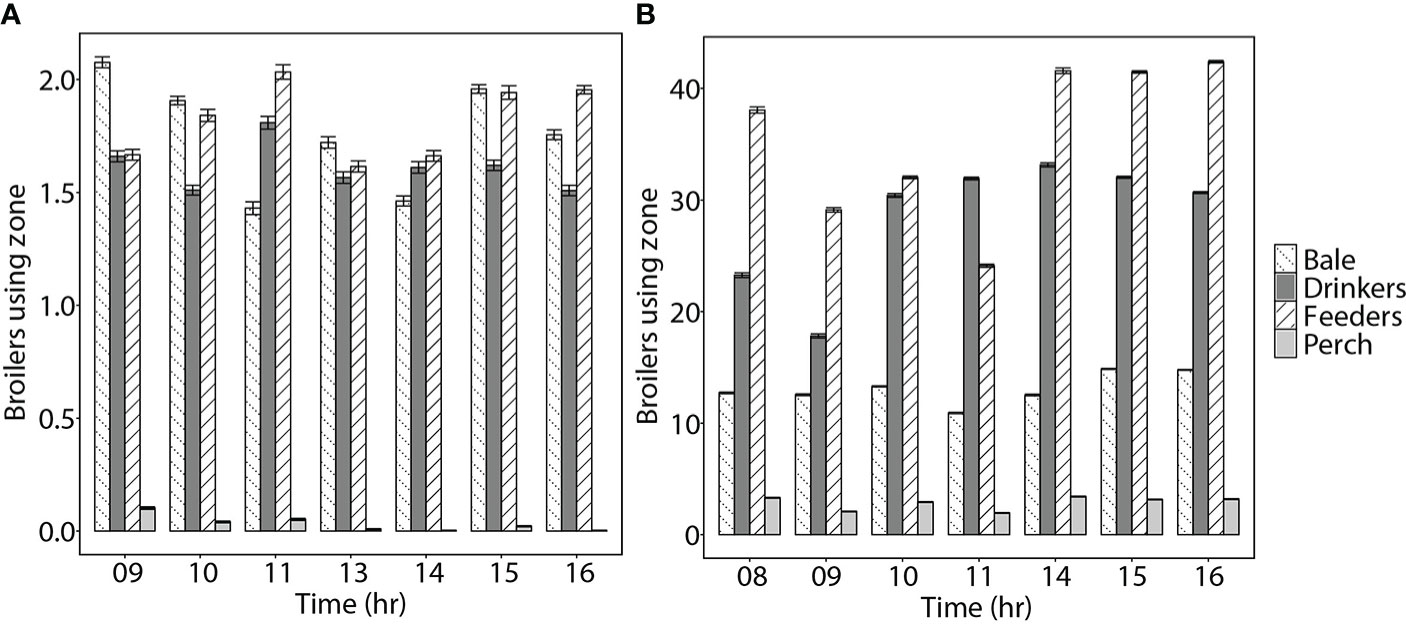
Figure 8 Mean ± standard errors for number of broilers per hour (only light phase is included) using specific resource zones (bale, drinkers, feeders, perch), for the (A) research facility at 16 days of age and (B) commercial farm at 14 days of age.
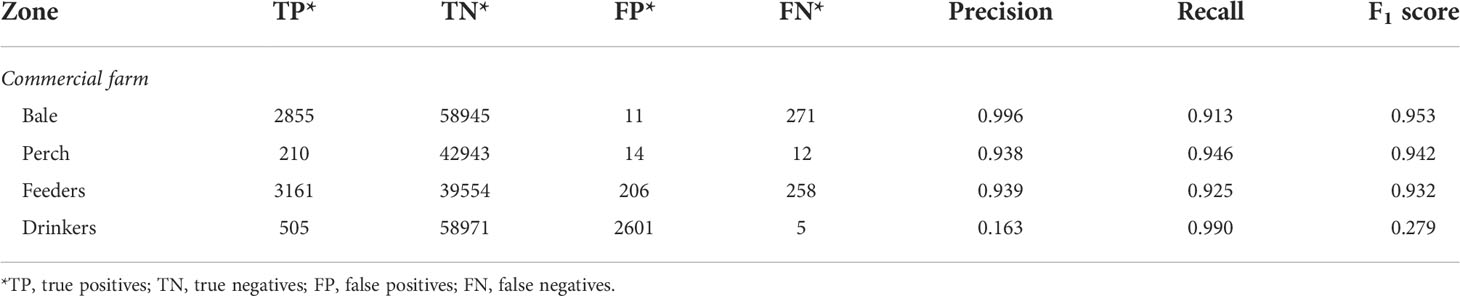
Table 3 Resource use monitoring quality for the commercial farm based on Mask R-CNN segmentation model.
Discussion
The aim of this study was to investigate the potential of computer vision algorithms for detection and resource use monitoring of broilers housed in both experimental and commercial settings while also assessing the potential for scalability and resource-efficient implementation of such solutions. This study showed the potential of state-of-the-art computer vision algorithms for individual broiler detection and resource use monitoring.
The algorithms developed in the current study for individual broiler detection performed well for both the experimental facility (model A, F1 score > 0.99) and commercial farm (model A+B, F1 score > 0.83) (Table 2). Previous studies have mainly used individual chicken detection in small groups. For example, in small chicken flocks, detection accuracy of 92.2% was reached using YOLOv3 (Yao et al., 2020), and in an experimental setting with 8-12 chickens, detection accuracies of 90.1% and 92.2% were reached using Mask R-CNN and U-Net, respectively (Li et al., 2021c). In a study on broilers, the correlation between the actual and predicted number of broilers in a pen (group size of 19) was 0.996 (Guo et al., 2020). Similarly, an F1 score of 0.92 was reached for images from a commercial broiler house, although here it should be noted that probabilities of 50% or higher were already considered as detections (Novas and Usberti, 2017). Furthermore, a mean average precision (mAP) above 93% was found with IoU of 0.50, and above 64% with IoU of 0.80 (group size not provided) (Zhuang and Zhang, 2019). Automated object detection in poultry production is challenging because of the high stocking density, which might lead to occlusion and overlapping between broilers, as well as low light intensity which can lead to more complex, noisier images (Okinda et al., 2020). It should be noted that we focused on a specific area within the commercial farm, which resulted in an average stocking density of 13.5 broilers/m2 (0.07m2/broiler) for that specific area (as counted by the algorithm for the image frames from 2 weeks of age). This was lower than the actual stocking density in the whole commercial farm, being 18.3 broilers/m2 (0.05m2/broiler), and the difference might be explained by the fact that we only included images when broilers were still relatively small (around 2 weeks old). In this study, we showed that in a commercial setting an F1 score above 0.95 could be reached with IoU of 0.50, and above 0.83 with IoU of 0.75 (Table 2). Thus, our detection algorithm performed well in a commercial setting with room for improvement.
The algorithms developed to monitor resource use performed well for the use of feeders, bale and perch in the commercial farm (F1 score > 0.93) but not for the drinkers (F1 score = 0.28) (Table 3). Similar to broiler detection, previous studies have mainly focused on classification and resource use monitoring in small groups. For example, the correlation between the actual and predicted number of broilers at the feeders and drinkers was above 0.94 (group size 19) (Guo et al., 2020), and for single caged hens accuracy of eating and drinking was above 94% (total of eight cages) (Xiao et al., 2019). In slightly larger groups, accuracy was above 88% for detecting the number of broilers feeding and drinking (group size 60) (Li et al., 2020a). The first attempt of monitoring feeding and drinking in a commercial flock used activity and occupation indices, where performance was above 62% when including the first half of the cycle but above 37% when including the complete cycle (Fernandez et al., 2018). In our study, the algorithm had a worse performance for the use of drinkers, which is likely caused by our evaluation method. For the evaluation set, an observer only marked chickens that were actually drinking, while the algorithm detected all chickens in the drinker zone even though some chickens might just be resting underneath the drinkers. To improve performance and accuracy, posture estimation could be integrated into the proposed algorithm for a more accurate estimation of drinking broilers. However, it can be questioned whether such accuracy would actually be needed in a commercial setting. Still, for the other resources (feeders, bale and perch), our model performed well with an F1 score > 0.93 (Table 3). This demonstrates the potential of our model to monitor resource use at a high stocking density, with the potential to combine such data with data on feed and water intake.
Despite certain progress and recent advances in computer vision applications for detection and resource use monitoring in poultry (Guo et al., 2020; Li et al., 2021a; Li et al., 2021b; Neethirajan, 2022), there are still no studies approaching the problem of large-scale monitoring or providing solutions that could perform well across varying housing conditions where different types of resources or different stocking densities negatively impact the detection and tracking performance. As Li and colleagues state (Li et al., 2021a; Li et al., 2021b), their solutions based on Faster R-CNN architecture and greyscale image pre-processing do not handle the occlusion well and show lower precision in crowded scenes. According to (Zhao et al., 2019), the majority of object detection solutions are built around classical (e.g. Otsu greyscale thresholding) handcrafted features and pre-processing techniques and rely on shallow CNN architectures. Deep learning and high-level semantic features are required to overcome complex scenery problems and handle the varying size of objects to be detected (broilers of different ages).
Another potential issue hindering the development of computer vision-based tools for flock monitoring is the size and quality of datasets used for algorithm training. Guo et al. (2020) used a pre-selected set of images for training, excluding the examples where the scenery was overcrowded with broilers or where occlusion occurred. By limiting the variability of examples representing different scenarios and ages, the requirements for a larger number of uniform annotated images increase while performance might stagnate. Li and colleagues (Li et al., 2021a; Li et al., 2021b) based their findings on informative region selection, where bounding boxes represented the broilers and relations between bounding box coordinates and ROIs were used to estimate zone use. Such an approach might become computationally heavy when the number of objects to be detected increases. In the animal science domain, where large pre-annotated datasets are non-existent, supervised pre-training/transfer learning is often used to deal with scarce data samples. So when ordinary CNNs (e.g. Faster R-CNN, Yolov3) are used for object detection and/or segmentation, it often becomes a two-step process which still struggles with overlapping instances and precise object allocation (as Li and colleagues stated). There is a history of using semantic and instance segmentation architectures (U-Net, Mask R-CNN) in medical imaging, where there is usually a very limited number of images available for training and validation. According to Bardis et al. (2020), high levels of segmentation accuracy could be achieved with small datasets. One of the major factors impacting the performance of segmentation algorithms is not the dataset size itself but rather the variation in the annotated data. This is supported by findings presented by Althnian et al. (2021), concluding that the representation of the real-world problems during the dataset annotation and curation has direct effects on the final algorithm performance. As our results show, high F1 scores are possible with relatively small adjustments to the training data in a scenario where an algorithm for object segmentation is applied in different environments. The combined dataset described in our study, which includes images of broilers segmented at different ages, in different environments, at different heights and, even more important, at different stocking densities, could be used as an example of the resource-efficient approach for vision applications. Another difference between our methodology and current state-of-the-art solutions is that we tested different scenarios, which included higher IoU/confidence thresholds (0.50 and 0.75). As Table 2 shows, there might not be a big difference between F1 scores when comparing U-Net and Mask R-CNN architectures under the experimental conditions. However, when stocking density, occlusion, and size of ROIs increase, architectural differences between shallow CNNs and their more advanced variants (as well as variability in annotations) come into play. Where there might not be a significant difference between algorithms operating at IoU 0.50, numbers of FP and FN might be lower at IoU 0.75 and higher when using Mask R-CNN.
Still, further research and development of algorithms are needed, as different ages were included for the detection method of the research facility but not for the commercial farm (ranging between 14-17 days of age). It should be noted that segmentation is most difficult at a young age, as chicks are quite small and therefore more difficult to detect compared to older broilers. On the other hand, broilers might also be more difficult to detect at an older age as inter-bird space will decrease with age as they occupy a larger area, which is more challenging for the algorithm. For example, the prediction of live broiler weights had a higher error % at older ages than younger ages (Mollah et al., 2010). Most studies to date have focused only on a specific age period, with broilers being older than 17 days of age (Xiao et al., 2019; Guo et al., 2020; Li et al., 2020a), except for one study that used continuous recordings but did not compare performance at different ages (Fernandez et al., 2018). Thus, further research is needed to assess the performance of detection algorithms at different ages and if necessary, to improve their performance. Monitoring algorithms could further be improved by including automatic detection of resources, such as for bales, drinkers and perch lines. This automatic detection was already developed for feeders in the current monitoring algorithm used. Since drinkers and perch lines often move because they are hanging from the ceiling in commercial farms, it is important that these resources are accurately identified by the algorithm. Similarly, bales can also differ in size, as they are being used by broilers and disintegrate over time. Including automatic detection of resources would increase the accuracy and quality of the resource use monitoring algorithm.
Automated detection and monitoring of poultry can potentially provide farmers with valuable information that they can use to make decisions on how to manage their flocks for better health and welfare. For example, farmers can monitor if there is a high occupation of broilers around enrichments, they can decide to provide more enrichments. With such a data-driven decision support, farmers are still in control but are given an extension of their own expertise in the form of the continuously operating algorithm when they cannot be present (Wurtz et al., 2019). However, to date, most computer vision algorithms have been developed in small-scale, controlled experimental settings. To improve broiler health and welfare, these algorithms should function in commercial practice and bring an added value to the farmer. Here, we assessed the potential for scalability and resource-efficient implementation of our computer vision algorithms, but for real integration of the computer vision approach into practice, more aspects should be considered. One of the potential solutions which could allow a higher degree of digitalization of broiler chicken production is a step-wise research and design process. Such a step-wise approach could be built around modular, highly specific, independent solutions for detection, tracking, and resource use monitoring, combined in different ways depending on constraints of the environment. Another important aspect is maintenance and ease of component exchange, since the cameras in poultry houses require regular cleaning, at least to remove dust and insects from lenses to ensure unimpaired vision.
To make our system more viable, we are looking into integrating several systems. The goal is to automatically detect and monitor resource use of broilers and combine this with automatic flock activity, distribution and gait assessment. In the future, as computer vision technology and cameras get cheaper, and as systems are indeed integrated to offer multiple benefits in one package, these benefits likely outweigh their cost. One could even think about completely integrating all systems in a poultry house, where computer vision algorithms are integrated with existing climate control, feed, water and light systems. However, to make sure such technologies will actually be used in commercial practice, it is important to engage the end-users of these technologies in order to develop user-friendly and informative decision support systems supplied to the devices that they find convenient to use (smartphone, tablet or PC) (Van Hertem et al., 2017; Wurtz et al., 2019).
Conclusions
The aim of this study was to investigate the potential of state-of-the-art computer vision algorithms using Mask R-CNN for broiler detection and resource use monitoring in broilers. Results showed that individual broilers could be detected and monitored for their resource use in a commercial environment with high stocking density. The algorithms used in this study are a first step to measure resource use automatically in commercial application and might further be used to assess broiler chicken welfare. Overall, this algorithm allows detection of a larger number of individual animals in a non-invasive manner. From location data of every frame, resource use can be calculated.
Data availability statement
The raw data supporting the conclusions of this article will be made available by the authors, without undue reservation.
Data are available from the authors upon reasonable request.
Ethics statement
The experiment procedures were checked with the national legislation on animal experiments by the Animal Welfare Body. Because the procedures were non-invasive, this study was not considered to be an animal experiment under the Law on Animal Experiments, as confirmed by the local Animal Welfare Body (25th of February 2020, Wageningen, The Netherlands). Housing and management complied with the Dutch law on animal wellbeing. Written informed consent was obtained from the owners for the participation of their animals in this study.
Author contributions
IJ and OG contributed to conception and design of the study. JE, MG, and LJ conducted the animal experiment and annotated images. AV and MM developed and evaluated algorithms. JE and OG wrote the first draft of the manuscript. AV and MM wrote sections of the manuscript. All authors reviewed and edited the manuscript revision. All authors contributed to the article and approved the submitted version.
Funding
The present study was supported by the Foundation for Food & Agriculture Research (FFAR) and McDonald’s within the SMART broiler program under award number Sb-0000000016.
Acknowledgments
Stephanie Melis, Henk Gunnink, and Sonja Roeske are acknowledged for their help with annotating images. The caretakers of the research facility and poultry farmer are acknowledged for their assistance with taking care of broilers. Plukon Food Group and the poultry farmer are acknowledged for enabling the study on the commercial farm.
Conflict of interest
AV and MM are employed by CLK GmbH Bildverarbeitung & Robotik.
The remaining authors declare that the research was conducted in the absence of any commercial or financial relationships that could be construed as a potential conflict of interest.
Publisher’s note
All claims expressed in this article are solely those of the authors and do not necessarily represent those of their affiliated organizations, or those of the publisher, the editors and the reviewers. Any product that may be evaluated in this article, or claim that may be made by its manufacturer, is not guaranteed or endorsed by the publisher.
Author’s disclaimer
The content of this publication is solely the responsibility of the authors and does not necessarily represent the official views of the Foundation for Food & Agriculture Research or McDonald’s.
References
Abeyesinghe S. M., Chancellor N. M., Hernandez Moore D., Chang Y. M., Pearce J., Demmers T., et al. (2021). Associations between behaviour and health outcomes in conventional and slow-growing breeds of broiler chicken. Animal 15, 100261. doi: 10.1016/j.animal.2021.100261
Althnian A., AlSaeed D., Al-Baity H., Samha A., Dris A.B., Alzakari N., et al. (2021). Impact of dataset size on classification performance: An empirical evaluation in the medical domain. Appl. Sci. 11, 1–18. doi: 10.3390/app11020796
Aydin A. (2017a). Development of an early detection system for lameness of broilers using computer vision. Comput. Electron. Agric. 136, 140–146. doi: 10.1016/j.compag.2017.02.019
Aydin A. (2017b). Using 3D vision camera system to automatically assess the level of inactivity in broiler chickens. Comput. Electron. Agric. 135, 4–10. doi: 10.1016/j.compag.2017.01.024
Aydin A., Bahr C., Berckmans D. (2015). Automatic classification of measures of lying to assess the lameness of broilers. Anim. Welf. 24, 335–343. doi: 10.7120/09627286.24.3.335
Aydin A., Cangar O., Ozcan S. E., Bahr C., Berckmans D. (2010). Application of a fully automatic analysis tool to assess the activity of broiler chickens with different gait scores. Comput. Electron. Agric. 73, 194–199. doi: 10.1016/j.compag.2010.05.004
Aydin A., Pluk A., Leroy T., Berckmans D., Bahr C. (2013). Automatic identification of activity and spatial use of broiler chickens with different gait scores. Trans. ASABE 56, 1123–1132. doi: 10.13031/trans.56.9987
Bardis M., Houshyar R., Chantaduly C., Ushinsky A., Glavis-Bloom J., Shaver M., et al. (2020). Deep learning with limited data: Organ segmentation performance by U-net. Electron 9, 1–12. doi: 10.3390/electronics9081199
Ben Sassi N., Averos X., Estevez I. (2016). Technology and poultry welfare. Anim. An. Open Access J. MDPI. 6, 1–21. doi: 10.3390/ani6100062
Bessei W. (2006). Welfare of broilers: A review. World. Poult. Sci. J. 62, 455–466. doi: 10.1079/wps2005108
Bloemen H., Aerts J. M., Berckmans D., Goedseels V. (1997). Image analysis to measure activity index of animals. Equine. Vet. J. Suppl. 23, 16–19. doi: 10.1111/j.2042-3306.1997.tb05044.x
Calvet S., Van den Weghe H., Kosch R., Estellés F., Estelles F. (2009). The influence of the lighting program on broiler activity and dust production. Poult. Sci. 88, 2504–2511. doi: 10.3382/ps.2009-00255
Chen K., Wang J., Pang J., Cao Y., Xiong Y., Li X, et al. (2019). MMDetection: Open MMLab detection toolbox and benchmark. ArXiv. Prepr.
Colles F. M., Cain R. J., Nickson T., Smith A. L., Roberts S. J., Maiden M. C. J., et al. (2016). Monitoring chicken flock behaviour provides early warning of infection by human pathogen campylobacter. Proc. R. Soc B-Biol. Sci. 283, 1–6. doi: 10.1098/rspb.2015.2323
Dawkins M. S., Layton R. (2012). Breeding for better welfare: genetic goals for broiler chickens and their parents. Anim. Welf. 21, 147–155. doi: 10.7120/09627286.21.2.147
Dawkins M. S., Lee H.j., Waitt C. D., Roberts S. J. (2009). Optical flow patterns in broiler chicken flocks as automated measures of behaviour and gait. Appl. Anim. Behav. Sci. 119, 203–209. doi: 10.1016/j.applanim.2009.04.009
Dawkins M. S., Roberts S. J., Cain R. J., Nickson T., Donnelly C. A. (2017). Early warning of footpad dermatitis and hockburn in broiler chicken flocks using optical flow, bodyweight and water consumption. Vet. Rec. 180, 499–U60. doi: 10.1136/vr.104066
Dawkins M. S., Wang L., Ellwood S. A., Roberts S. J., Gebhardt-Henrich S. G. (2021). Optical flow, behaviour and broiler chicken welfare in the UK and Switzerland. Appl. Anim. Behav. Sci. 234, 105180. doi: 10.1016/j.applanim.2020.105180
de Jong I. C., Hindle V. A., Butterworth A., Engel B., Ferrari P., Gunnink H., et al. (2016). Simplifying the welfare Quality® assessment protocol for broiler chicken welfare. Animal 10, 117–127. doi: 10.1017/s1751731115001706
Del Valle J. E., Pereira D. F., Mollo Neto M., Gabriel Filho L. R. A., Salgado D. D. A. (2021). Unrest index for estimating thermal comfort of poultry birds (Gallus gallus domesticus) using computer vision techniques. Biosyst. Eng. 206, 123–134. doi: 10.1016/j.biosystemseng.2021.03.018
EFSA (2010). Scientific opinion on the influence of genetic parameters on the welfare and the resistance to stress of commercial broilers. Efsa. J. 8, 1–82. doi: 10.2903/j.efsa.2010.1666
EFSA (2012). Scientific opinion on the use of animal-based measures to assess welfare of broilers. EFSA. J. 10, 2774. doi: 10.2903/j.efsa.2012.2774
Fang C., Huang J., Cuan K., Zhuang X., Zhang T. (2020). Comparative study on poultry target tracking algorithms based on a deep regression network. Biosyst. Eng. 190, 176–183. doi: 10.1016/j.biosystemseng.2019.12.002
Fernandez A. P., Norton T., Tullo E., van Hertem T., Youssef A., Exadaktylos V., et al. (2018). Real-time monitoring of broiler flock’s welfare status using camera-based technology. Biosyst. Eng. 173, 103–114. doi: 10.1016/j.biosystemseng.2018.05.008
Guo Y., Chai L., Aggrey S. E., Oladeinde A., Johnson J., Zock G. (2020). A machine vision-based method for monitoring broiler chicken floor distribution. Sensors 20, 3179. doi: 10.3390/s20113179
He K., Gkioxari G., Dollar P., Girshick R. (2020). Mask r-CNN. IEEE Trans. Pattern Anal. Mach. Intell. 42, 386–397. doi: 10.1109/TPAMI.2018.2844175
Jaccard P. (1912). The distribution of the flora in the alpine zone.1. New Phytol. 11, 37–50. doi: 10.1111/j.1469-8137.1912.tb05611.x
Kashiha M., Pluk A., Bahr C., Vranken E., Berckmans D. (2013). Development of an early warning system for a broiler house using computer vision. Biosyst. Eng. 116, 36–45. doi: 10.1016/j.biosystemseng.2013.06.004
Kristensen H. H., Cornou C. (2011). Automatic detection of deviations in activity levels in groups of broiler chickens - a pilot study. Biosyst. Eng. 109, 369–376. doi: 10.1016/j.biosystemseng.2011.05.002
Li G., Huang Y., Chen Z., Chesser G. D., Purswell J. L., Linhoss J., et al. (2021a). Practices and applications of convolutional neural network-based computer vision systems in animal farming: A review. Sensors 21, 1–42. doi: 10.3390/s21041492
Li N., Ren Z., Li D., Zeng L. (2020b). Review: Automated techniques for monitoring the behaviour and welfare of broilers and laying hens: Towards the goal of precision livestock farming. Animal 14, 617–625. doi: 10.1017/S1751731119002155
Li W., Xiao Y., Song X., Lv N., Jiang X., Huang Y., et al. (2021c). Chicken image segmentation via multi-scale attention-based deep convolutional neural network. IEEE Access 9, 61398–61407. doi: 10.1109/ACCESS.2021.3074297
Li G., Zhao Y., Porter Z., Purswell J. L. (2021b). Automated measurement of broiler stretching behaviors under four stocking densities via faster region-based convolutional neural network. Animal 15, 100059. doi: 10.1016/j.animal.2020.100059
Li G., Zhao Y., Purswell J. L., Du Q., Chesser G. D., Lowe J. W. (2020a). Analysis of feeding and drinking behaviors of group-reared broilers via image processing. Comput. Electron. Agric. 175, 105596. doi: 10.1016/j.compag.2020.105596
Marchewka J., Watanabe T. T. N., Ferrante V., Estevez I. (2013). Welfare assessment in broiler farms: Transect walks versus individual scoring. Poult. Sci. 92, 2588–2599. doi: 10.3382/ps.2013-03229
Mollah M. B. R., Hasan M. A., Salam M. A., Ali M. A. (2010). Digital image analysis to estimate the live weight of broiler. Comput. Electron. Agric. 72, 48–52. doi: 10.1016/j.compag.2010.02.002
Nääs I., de A., Lozano L. C. M., Abdanan Mehdizadeh S., Garcia R. G., Abe J. M. (2018). Paraconsistent logic used for estimating the gait score of broiler chickens. Biosyst. Eng. 173, 115–123. doi: 10.1016/j.biosystemseng.2017.11.012
Neethirajan S. (2022). ChickTrack – A quantitative tracking tool for measuring chicken activity. Meas. J. Int. Meas. Confed. 191, 110819. doi: 10.1016/j.measurement.2022.110819
Novas R. V., Usberti F. L. (2017). Live monitoring in poultry houses: A broiler detection approach. Proc. - 30th. Conf. Graph. Pat. Imag. SIBGRAPI. 2017., 216–222. doi: 10.1109/SIBGRAPI.2017.35
Okinda C., Nyalala I., Korohou T., Okinda C., Wang J., Achieng T., et al. (2020). A review on computer vision systems in monitoring of poultry: A welfare perspective. Artif. Intell. Agric. 4, 184–208. doi: 10.1016/j.aiia.2020.09.002
Pereira D. F., Lopes F. A. A., Filho L. R. A. G., Salgado D. D. A., Neto M. M. (2020). Cluster index for estimating thermal poultry stress (gallus gallus domesticus). Comput. Electron. Agric. 177, 105704. doi: 10.1016/j.compag.2020.105704
Pereira D. F., Miyamoto B. C. B., Maia G. D. N., Tatiana Sales G., Magalhães M. M., Gates R. S. (2013). Machine vision to identify broiler breeder behavior. Comput. Electron. Agric. 99, 194–199. doi: 10.1016/j.compag.2013.09.012
Ronneberger O., Fischer P., Brox T. (2015). “U-Net: Convolutional networks for biomedical image segmentation,” in Medical image computing and computer-assisted intervention – MICCAI 2015. Eds. Navab N., Hornegger J., Wells W. M., Frangi A. F. (Cham: Springer International Publishing), 234–241.
Silvera A. M., Knowles T. G., Butterworth A., Berckmans D., Vranken E., Blokhuis H. J. (2017). Lameness assessment with automatic monitoring of activity in commercial broiler flocks. Poult. Sci. 96, 2013–2017. doi: 10.3382/ps/pex023
Van Hertem T., Norton T., Berckmans D., Vranken E. (2018). Predicting broiler gait scores from activity monitoring and flock data. Biosyst. Eng. 173, 93–102. doi: 10.1016/j.biosystemseng.2018.07.002
Van Hertem T., Rooijakkers L., Berckmans D., Fernandez A.p., Norton T., Berckmans D., et al. (2017). Appropriate data visualisation is key to precision livestock farming acceptance. Comput. Electron. Agric. 138, 1–10. doi: 10.1016/j.compag.2017.04.003
Weeks C. A., Danbury T. D., Davies H. C., Hunt P., Kestin S. C. (2000). The behaviour of broiler chickens and its modification by lameness. Appl. Anim. Behav. Sci. 67, 111–125. doi: 10.1016/S0168-1591(99)00102-1
Welfare Quality® (2009). Welfare quality® assessment protocol for poultry (broilers, laying hens) Welfare Quality® consortium (Lelystad, The Netherlands).
Wurtz K., Camerlink I., D’Eath R. B., Fernández A. P., Norton T., Steibel J., et al. (2019). Recording behaviour of indoor-housed farm animals automatically using machine vision technology: A systematic review. PLoS ONE 14, 1–35. doi: 10.1371/journal.pone.0226669
Xiao L., Ding K., Gao Y., Rao X. (2019). Behavior-induced health condition monitoring of caged chickens using binocular vision. Comput. Electron. Agric. 156, 254–262. doi: 10.1016/j.compag.2018.11.022
Yao Y., Yu H., Mu J., Li J., Pu H. (2020). Estimation of the gender ratio of chickens based on computer vision: Dataset and exploration. Entropy 22, 1–16. doi: 10.3390/e22070719
Youssef A., Exadaktylos V., Berckmans D. A. (2015). Towards real-time control of chicken activity in a ventilated chamber. Biosyst. Eng. 135, 31–43. doi: 10.1016/j.biosystemseng.2015.04.003
Zhao Z.-Q., Zheng P., Xu S.-T., Wu X. (2019). Object detection with deep learning: A review. IEEE Trans. Neural Networks Learn. Syst. 30, 3212–3232. doi: 10.1109/TNNLS.2018.2876865
Keywords: broiler, computer vision, detection, resource use, animal welfare
Citation: van der Eijk JAJ, Guzhva O, Voss A, Möller M, Giersberg MF, Jacobs L and de Jong IC (2022) Seeing is caring – automated assessment of resource use of broilers with computer vision techniques. Front. Anim. Sci. 3:945534. doi: 10.3389/fanim.2022.945534
Received: 16 May 2022; Accepted: 19 July 2022;
Published: 08 August 2022.
Edited by:
Luiz Brito, Purdue University, United StatesReviewed by:
Haipeng Yu, Iowa State University, United StatesArthur Francisco Araujo Fernandes, Cobb-Vantress, United States
Copyright © 2022 van der Eijk, Guzhva, Voss, Möller, Giersberg, Jacobs and de Jong. This is an open-access article distributed under the terms of the Creative Commons Attribution License (CC BY). The use, distribution or reproduction in other forums is permitted, provided the original author(s) and the copyright owner(s) are credited and that the original publication in this journal is cited, in accordance with accepted academic practice. No use, distribution or reproduction is permitted which does not comply with these terms.
*Correspondence: Jerine A. J. van der Eijk, amVyaW5lLnZhbmRlcmVpamtAd3VyLm5s; Ingrid C. de Jong, aW5ncmlkLmRlam9uZ0B3dXIubmw=