Abstract
The primary barrier to research into feed efficiency of Atlantic salmon (Salmo salar) is the lack of a reliable method to assess individual feed intake in large cohorts of fish over a growth period. A method with potential is the X-ray method, which images radio-opaque markers (beads) in feed consumed by fish. However, the time taken to count the markers in the digestive tract of fish is extremely onerous and the method has previously been shown to have low repeatability. Furthermore, the method has not been assessed and optimized for Atlantic salmon. Firstly, we made use of image analysis to count beads within the digital radiographs, which was highly correlated to manual counting by human observers (R2 = 0.99). Remarkably, image counting was up to 6 times faster than human counting when the number of beads per fish was high (> 300 per fish). We investigated the potential effect of different sources of error on the feed mass to bead count calibration equation and found the effects of X-ray exposure setting and the position of pellets on the X-ray plate to be negligible on the bead counts of both human and image analysis. We tested different feeding periods with the time of the X-ray images to minimize the loss of beads through defecation. We found that fish should be X-rayed within 6.5–11 hours of first being offered feed for a 6-hour feeding period which fed the entire daily ration. Lastly, we assessed the repeatability of feed intake over a 70-day growth period from 80–300 grams and found feed intake to be significantly and moderately repeatable (r = 0.45 ± 0.11), indicating developments in the method result in a consistent ranking of individual fish based on feed intake from three repeated measurements. The X-ray method combined with image analysis greatly reduces counting time without compromising accuracy, achieves promising repeatability, and is feasible in Atlantic salmon parr.
1 Introduction
Feed plays a key role in the economic and environmental performance of Atlantic salmon production, with the cost of feed accounting for over 50% of the total production cost (Iversen et al., 2020) and 73–80% of the carbon footprint (Winther et al., 2020). Improving the amount of edible product relative to the feed input of Atlantic salmon (i.e. feed efficiency) offers considerable potential to improve both profitability and environmental sustainability without harming overall production (Kause et al., 2006b). There is evidence of genetic variation in feed efficiency of Atlantic salmon (Thodesen et al., 1999; Thodesen et al., 2001; Kolstad et al., 2004; Dvergedal et al., 2019) as well as other salmonids (Kinghorn, 1983; Kinghorn, 1983; Hatlen et al., 1997; Hatlen et al., 1997; Henryon et al., 2002; Henryon et al., 2002; Kause et al., 2006a; Kause et al., 2006a). Thus, selective breeding is one possible strategy for improving feed efficiency, but obtaining records on individual feed intake is a serious bottleneck.
The practical difficulties with recording feed intake of individual fish in diverse aquatic and production environments have resulted in several methods of recording feed intake in fish, each with its own set of advantages, disadvantages, and constraints (Jobling et al., 2007; de Verdal et al., 2018). The X-ray method has shown potential, as it allows for non-invasive and repeated recordings of large numbers of fish without the need for individual confinement, sacrificing or starving the fish as well as eliminating the need for handling radioactive or chemical agents. The X-ray method estimates individual feed intake through the use of radio-opaque markers in the pelleted feed and a calibrated radio-opaque marker technique (Talbot and Higgins, 1983). Fish are anesthetized and radiographed after they have been offered feed containing beads. The number of beads in the radiograph is manually counted and used to estimate the mass of consumed feed. Research scale genetic evaluations using this method have not been conducted in Atlantic salmon. The largest drawback to the X-ray method is that human observers are required to count the number of beads in the radiographs which is tedious, time-consuming, and can be error-prone (Jobling et al., 1993). When conducted in large-scale genetic evaluations, the counting time alone can take hundreds of personnel hours, greatly increasing the costs of measurement. Whilst image analysis tools offer the possibility to semi-automate counting, their use has not been validated (Walker et al., 2012).
When adapting a method to a new species, consideration must be given to how species biology and technical aspects of a method interact. The time between the fish first being offered feed containing radio-opaque beads and the time of X-ray, needs to be optimized to ensure the fish have sufficient time to consume the daily ration of feed, whilst preventing markers from being defecated (Jobling et al., 2007). The relationship between the number of markers and the feed mass is particularly important as this is used to predict the mass of consumed feed in the fish’s digestive tract through a calibration equation. Lastly, high intraindividual variation in feed intake between days has been reported for salmonids, resulting in low repeatability of the method (Toften et al., 1997; Kause et al., 2006a). As repeatability is the upper threshold for heritability, it is necessary to evaluate the repeatability of the X-ray technique before expansion to large-scale selection experiments. Lastly, the repeatability of a method can also inform the optimal number of X-ray images per individual needed for a given grow-out period.
Thus, the objectives of the current study were to 1) Test an image analysis program for the counting of radio-opaque beads in Atlantic salmon, 2) Assess the relative error of the calibration equation for feed mass of the extruded feed between the manual and the image analysis bead counts, 3) Determine the length of time between feeding periods and X-ray times in relation to gastrointestinal passage rate for Atlantic salmon, 4) Evaluate the repeatability of daily feed intake in Atlantic salmon over the freshwater growth period.
2 Materials and methods
This study is comprised of three separate experiments which are described chronologically below and graphically summarized in Figure 1. The three experiments were all conducted on the same experimental fish, which were fed the same feed and X-rayed using the same radiographic equipment. For the sake of brevity, we will describe the commonalities between the three experiments followed by the individual experiments. The first experiment X-rayed known masses of feed and the number of markers was counted by a manual observer or using image analysis to compare the accuracy and time of both methods. In addition, the influence of position on the X-ray plate or the X-ray exposure setting was investigated on beads counts. In the second experiment, groups of fish were offered the entire daily ration of feed containing radio-opaque markers for different periods and then X-rayed at different time increments to contrast the percentage of beads in the distal intestine as a proxy for passage rate. In the third experiment, fish were X-rayed on three occasions over 70 days and the repeatability of feed intake, body length, and body weight was estimated.
Figure 1
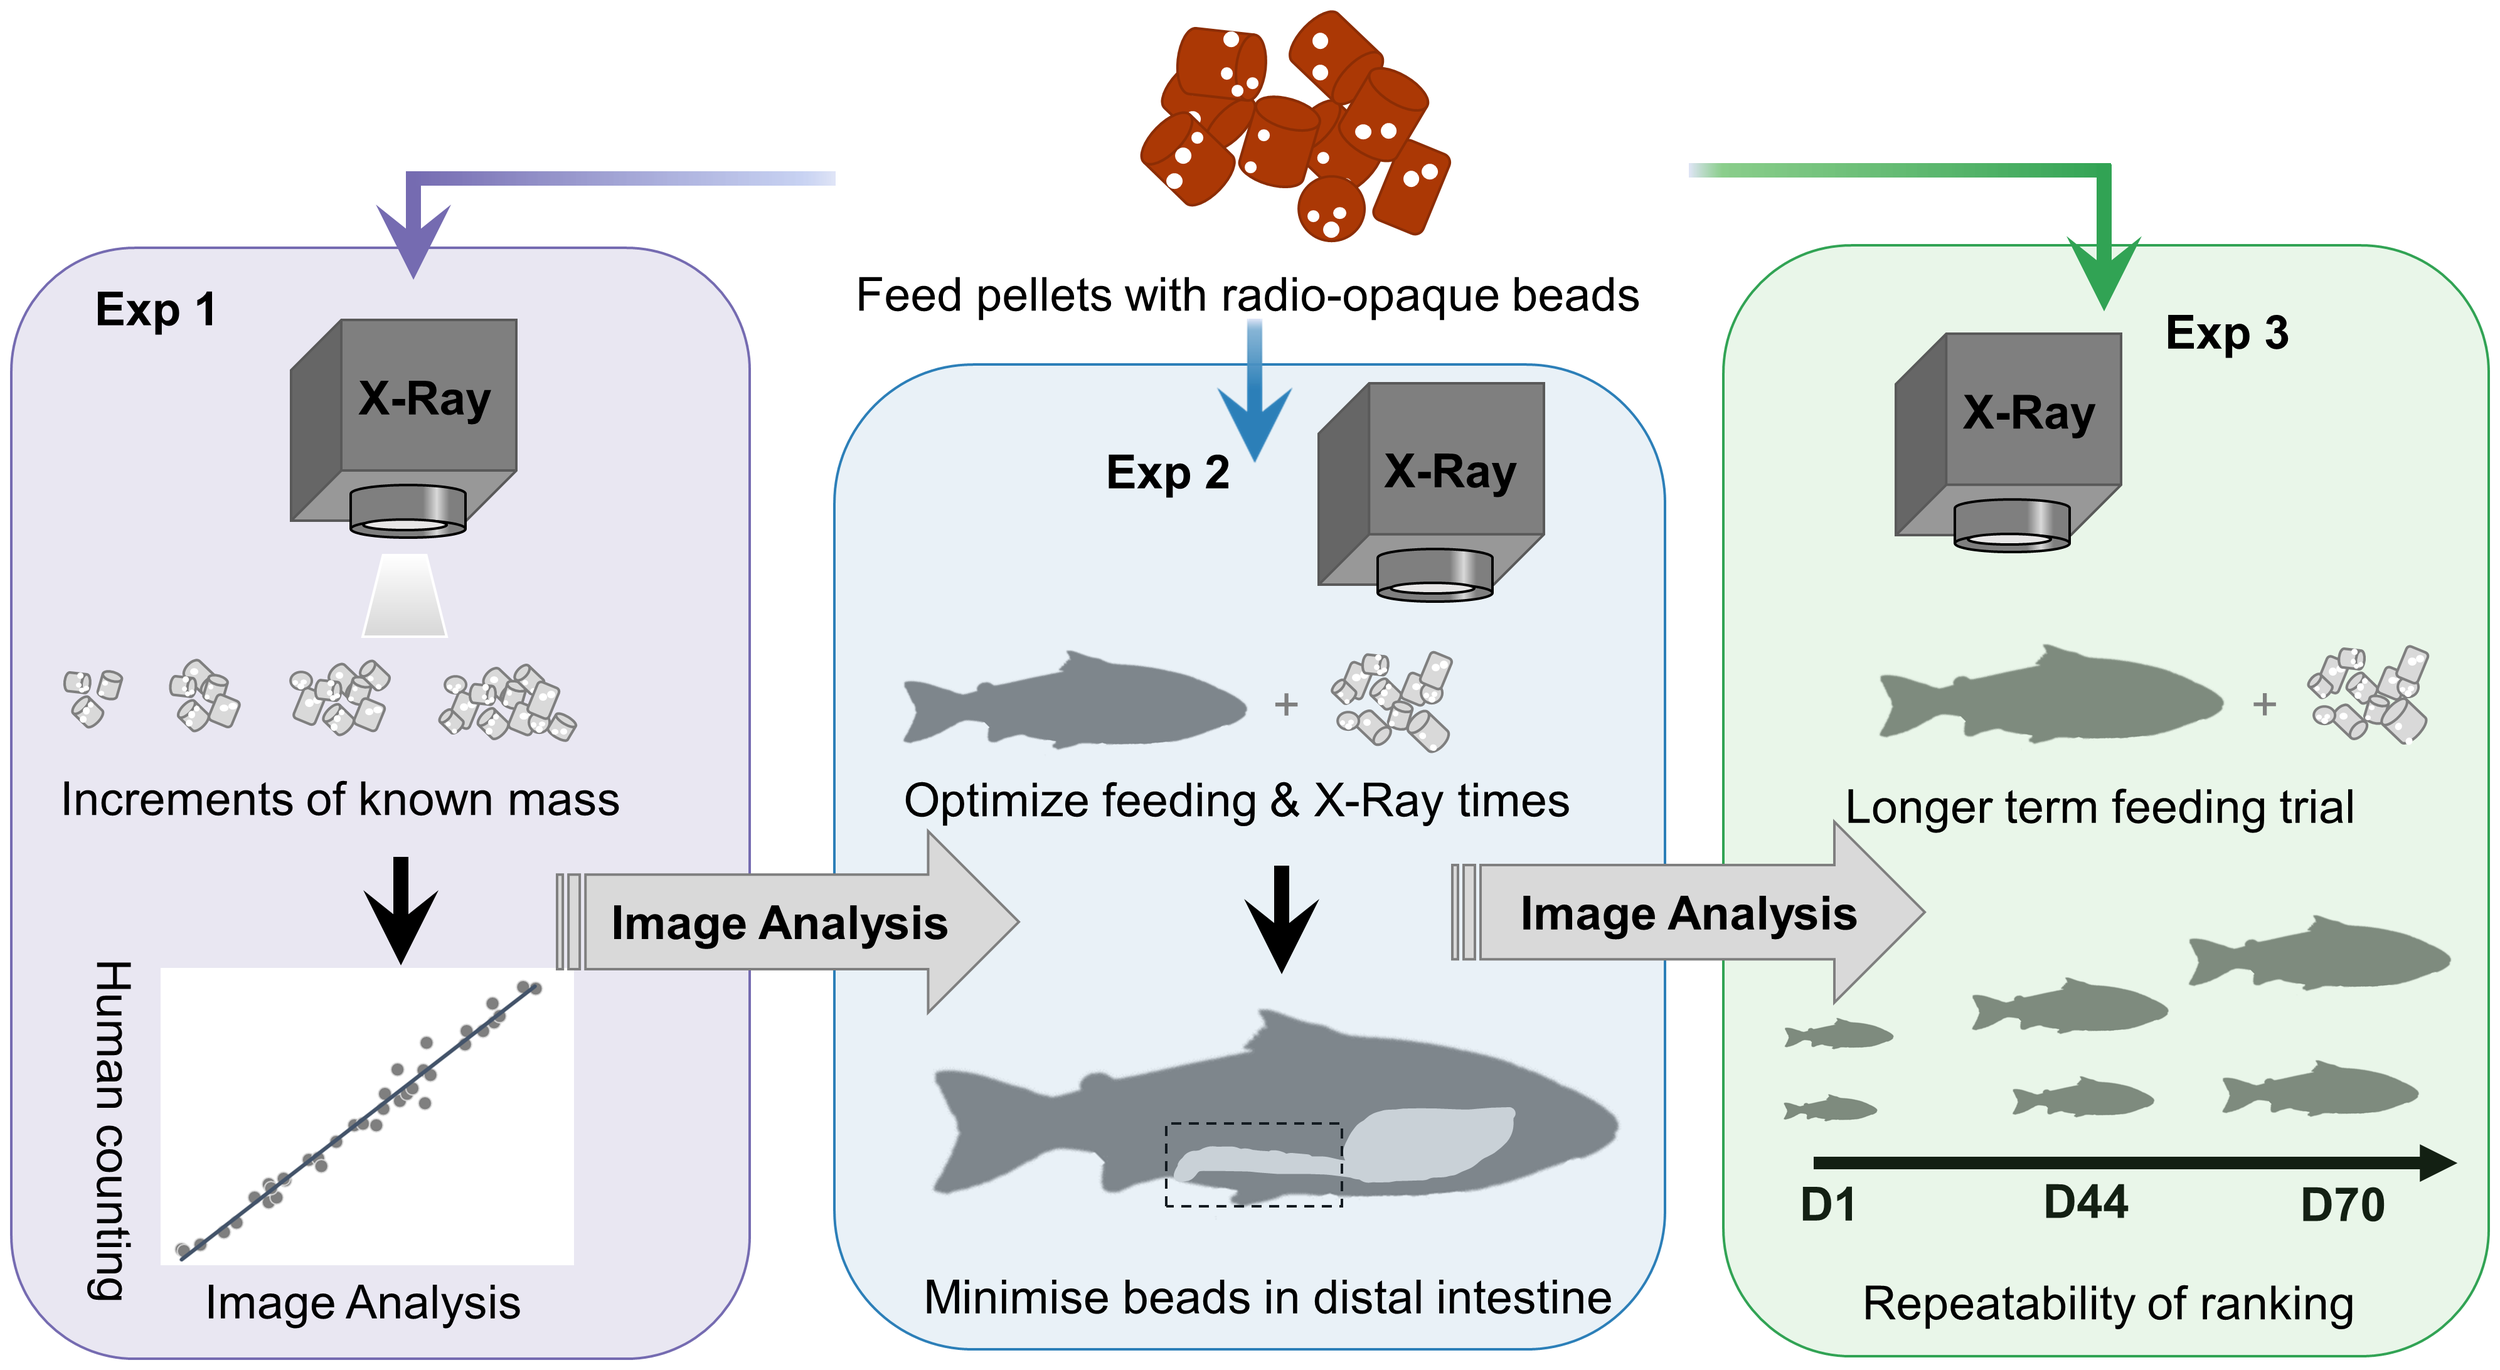
Graphical summary of each of the three sequential experiments conducted to adapt and assess the use of the X-ray method in Atlantic salmon.
2.1 Animal ethics statement
This study used measurements taken from a family-based genetics experiment carried out at the Research Station for Sustainable Aquaculture (59.66°N, 10.76°E) (Nofima AS, Sunndalsøra, Norway). The study was conducted in strict compliance with the regulations for experiments on live animals in Norway (FOR-2015-06-18-761) and the EU (Directive 2010/637EU). The experiment was approved by the Norwegian Food Safety Authority (FOTS ID 23718).
2.2 Feed production
Feed was produced by extrusion using a Wenger TX-52 twin screw extruder (Wenger manufacturing INC, Sabetha, USA) at the Feed Technology Centre (Nofima AS, Bergen, Norway) to meet the known requirements of salmonid fish. Two types of feed were produced; a control feed and a radio-opaque feed (same as the control feed) containing 3.0% radio-opaque glass beads (0.4–0.6 mm Ø) (Jobling et al., 2007) (Table S1) (Sigmund Lindner GmbH, Warmensteinach, Germany). The control feed is fed to the fish the majority of the time and the radio-opaque feed is only fed before X-ray imaging. Both feeds were extruded through die holes with a 2.5 mm diameter, giving a final pellet of approximately 3mm. To ensure the feeds had identical ingredients, the beads were added to the last 50kg of the mixture used to produce the control feed and mechanically mixed in the extruder to ensure the consistency of beads within the feed.
A feed sample of 500 g was taken from both feeds and stored at 4°C for chemical analyses. The formulation and chemical composition of the two feeds are given in Table S2, both were analyzed for dry matter (drying at 103°C to stable weight; ISO 6496:1999), crude fat (Soxhlet, with acid hydrolysis; EC 152/200), crude protein (Kjeldahl analysis, ISO 5983, 2005), ash (combustion at 550°C, ISO 5984:2002) and gross energy (bomb calorimetry; ISO 9831:1998).
2.3 Design and fish
As part of a larger trial, a total of 700 Atlantic salmon parr were individually tagged with passive integrated transponders (PIT-tags) (HPT12 12mm, Biomark Ltd, Boise, USA, www.biomark.com) by MOWI Genetics AS (MOWI ASA, Øyerhamn, Norway). In August 2020 at an average weight of 48.9 ± 7.9 grams (mean ± standard deviation), the fish were delivered to the Research Station for Sustainable Aquaculture. The fish were reared in two freshwater flow-through tanks (volume = 3.2 m3, diameter = 2m) each containing 350 fish. The water temperature was maintained at 12°C with a tolerance of ± 1°C and the dissolved oxygen ranged from 94–115%.
2.4 X-ray facilities
All X-rays were taken within the radiology unit at the Research Station for Sustainable Aquaculture within a lead-shielded room. The X-ray source is an IMS Giotto mammography system (model number 6020/3, IMS Giotto, Bologna, Italy) equipped with a computer radiology system comprised of an FCR Profect image plate reader and FCR Console (Fuji Medical Inc., Japan). The X-ray source was set to 22 kVp/50 mAs with a resolution of the system of 20 pixels/mm.
2.5 Image processing and bead counting algorithm
Using the radiographs generated in this study and the manual counts of a human observer, a bead-counting algorithm was developed, within IDL (Exelis Visual Information Solutions, Bracknell, United Kingdom). The software allows the user to load X-ray radiographs and rapidly select the area of interest containing the beads through a graphical user interface, and the number of beads within the user-defined area is automatically counted. The image processing is conducted stepwise through the following steps and visually demonstrated in Figures 2A–F. Each X-ray file stored as .jpg is individually read and the region of interest (ROI) containing beads is selected (Figure 2A). The median filtered image (31 x 31 kernel) is subtracted from the original image to highlight the beads (Figure 2B). The pixel values were then standardized to range from zero to one by subtracting the minimum values and diving by the maximum value. A threshold was set to 0.25 to discriminate the bimodal distributions of pixels originating from beads or other materials in the X-ray image (Figure 2C). Lastly, irregular shaped objects were removed using a convolution with a circular kernel (diameter 7 pixels), followed by a threshold and label region operation. Irregular objects will then have few pixels and can be removed (Figure 2D). All remaining objects in the ROI are then counted and counted objects are shown in blue with a red outline (Figure 2E). The user-defined area is then reproduced in a separate window with the potential beads overlayed in blue with a red outline. The user can successively view the image after each step in the image processing software Figures 2A–E, and can also juxtapose the original radiograph with the image-processed radiograph to manually correct the count in the case of errors (Figure 2F). For example, two overlayed beads might only be detected as one bead.
Figure 2
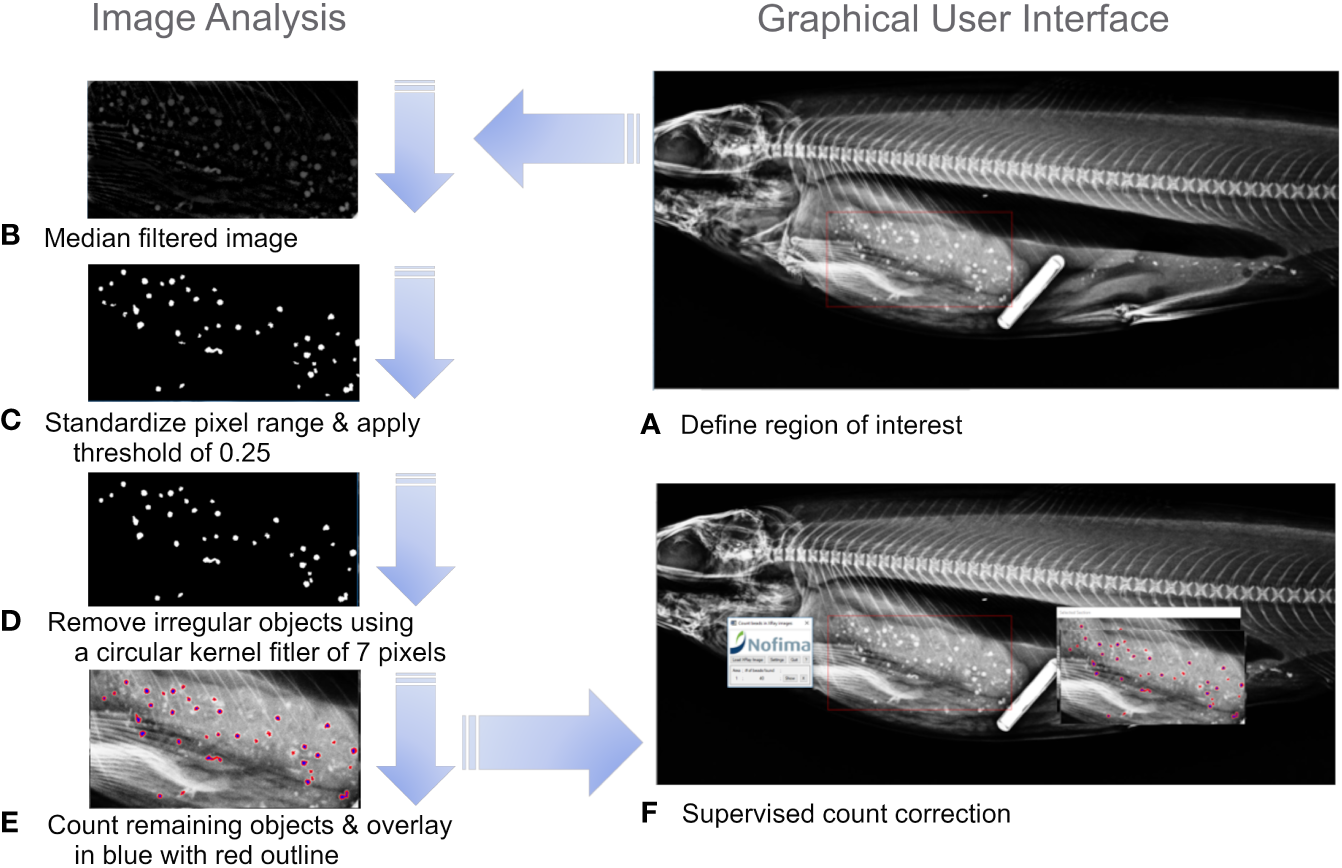
Schematic of image analysis steps used in bead counting (A) define the region of interest, (B) Median filtered image, (C) Standardized pixel range from 0 to 1 and apply a threshold of 0.25, (D) Remove irregular objects using a circular kernel of 7 pixels. (E) Count remaining objects and overlay counted objects on the original image in blue with red outline, (F) supervised bead count correction.
2.6 Experiment 1: Calibration of bead count to feed mass and sources of error
Radio-opaque feed samples with ten different known masses were obtained using a calibrated digital mass balance (Mettler AE260 DeltaRange analytical balance; Mettler, Toledo, Switzerland). The mass balance has an operational range of 50 mg to 205 g with an estimated standard deviation of 0.1 mg on each measurement. Three repeated feed samples were prepared for each mass of the ten masses in the calibration series which ranged from 0.2 g to 2.2 grams in increments of 0.2 g (i.e. 10 masses in triplicate adding up to a total of 30 feed samples). The chosen range of feed masses is approximately the expected feed intake per day of individual salmon in the freshwater phase from parr to smolt. The feed samples were placed in a sealable plastic bag and labeled.
First (Experiment 1) an estimate of different sources of variation in the number of beads counted was obtained by X-raying each feed sample twice with the standard exposure setting, during which each sample was removed from the sample area and then vigorously agitated before placing it back on the radiograph plate for taking the next radiograph; and thereafter twice with the maximum exposure setting ‘zoom’ using the same remove/replace procedure. This followed a nested design as proposed by (Gjerde and Martens, 1987).
The same human observer manually counted the number of beads for each feed sample and recorded the amount of time taken to count the beads in each of the samples. The same human observer then used the bead counting algorithm to predict the number of beads for each feed sample and recorded the time taken to do so for each of the samples.
2.6.1 Statistical analysis of experiment 1
Variance components for the effect of feed mass, feed sample nested within feed mass, exposure setting nested within feed sample and feed mass, and the repeated position of each feed sample within exposure setting and feed mass on the bead counts from the manual counting and the software counting were analyzed using the following bivariate linear mixed model (Eq. 1) by Mixed Procedure of SAS (ver. 9.4; SAS Institute Inc., Cary, NC):
where and are the manual and software bead count, respectively of lth (l = 1, 2) replicate bead count of the kth exposure setting (k = 1, 2), of jth feed sample (j=1, 2 or 3) and of ith feed mass (j = 1, 2,…, 10). The random effects of feed mass (), feed sample (s), and exposure setting () are assumed to be normally distributed around a mean of zero with variances structure ~ND(0, ), ~ND(0, ) and ~ND(0, ), respectively. Similarly, the residual error term; i.e., the effect of the lth repeated position of the jth feed sample and the ith feed mass, is assumed to be ~ND(0, ). The estimated variance components were used to calculate the intraclass or repeatability coefficient for:
The correlation coefficient between the manual and software bead counts was calculated as , where the subscript m and i represent the parameter estimates for the manual and the image analysis counting, respectively.
The parameter estimates of the calibration equations of feed mass on bead counts in feed were obtained separately for each method of counting as the linear regression of average bead count on the feed mass of the 10x3 feed samples.
2.7 Experiment 2: Passage rate and optimization of feeding times
Seven different groups of fish (n = 10 per group) were created by a combination of different lengths (9 hours) versus short (6 hours) feeding regimes, over a single day or two consecutive days, and varying the time between the start of feeding and the X-ray measurements. The fish were anesthetized using M-222 (Finquel, USA) 160mg/L, then X-ray imaged, and returned to a separate oxygenated tank for recovery to anesthesia. The same manual observer then used the bead counting algorithm to count the total number of beads in the gastrointestinal tract and the distal intestine of each of the X-rayed fish. The percentage of the total beads within the distal intestine was used as a proxy for the passage rate.
2.7.1 Statistical analysis of experiment 2
The differences in the percentage of beads in the distal intestine between the seven treatment groups were estimated using a nested ANOVA with treatment groups nested within feeding regimes. This was then followed by post hoc multiple comparisons correction by the Benjamini-Hochberg procedure (Benjamini and Hochberg, 1995).
2.8 Experiment 3: Repeatability of feed intake in Atlantic salmon
A randomly sampled subset of 30 fish, 15 in one tank and 15 in another tank were repeatedly X-rayed on three occasions, each over two consecutive days. This resulted in measurements corresponding to days 1 & 2, days 43 & 44, and days 70 & 71, between 6 October and 15 December 2020. The body weights of the fish (mean ± SD) were 81.5 ± 14.9, 200 ± 37.6, and 300 ± 61.7 grams, at each measurement respectively. Based on the findings of experiment 2, the fish on each of the three occasions were X-rayed within 11 hours of first being offered feed on a 6-hour feeding regime. The same manual observer then used the bead counting algorithm to count the total number of beads in the gastrointestinal tract of each of the X-rayed fish. The number of beads was then converted to estimated feed intake in grams per day using the prediction (calibration) equation from experiment 1.
2.8.1 Statistical analysis of experiment 3
A repeatability animal model was run using linear mixed effect models with AI-REML in DMU v6.5 (Madsen and Jensen, 2014) of the following form:
Where yijk is the trait of interest (feed intake, body length, body weight), Tanki is the fixed effect of tank (I = 1, 2), Dayij is the fixed effect of day of recording within tank (j = 1, 2, 3) and ak is the random effect of the kth animal ~ ND (0,) where I is an identity matrix and the individual random variation due to animal (inter-individual variance), and eijkis the random residual term ~ ND (0, ); i.e. the intra-individual variance due to random error. A fixed linear regression of the time of X-ray within the sampling day was tested, but was not statistically significant for any of the three variables (p > 0.05; results not shown). Repeatability or intraclass correlation; i.e. the correlation among the three repeated feed intake, body length, or body weight measurements on the same animals, was computed with the following equation using the variance components estimated in Eq. 5
3 Results
3.1 Experiment 1: Calibration of bead count to feed mass and sources of error
In general, manual counting by a human observer or algorithm counting of counting beads were extremely similar both for accuracy (mean) and precision (standard deviation) over the 30 feed samples (Table 1). The ranking of the 10 feed masses for bead count was identical between the methods as seen by the correlation coefficient close to unity (Table 1). Both methods predominately captured variation in different amounts of feed mass, with feed mass explaining 97.8% of the variation in manual counts and 98.9% of the variation in algorithm counts. Both methods were largely unaffected by radiograph exposure or the random positioning of the beads within the feed sample at X-ray, as seen by the close-to-unity intraclass correlation coefficients for samples, exposure settings, and position for both the manual and algorithm counting (Table 1).
Table 1
| Counting method | Descriptive statistics | Variance components | Intraclass correlation coefficients | ||||||
|---|---|---|---|---|---|---|---|---|---|
| Mean ± SD | Min–Max | Mass | Sample | Exposure | Residual | rsample | rexp | rpos | |
| Manual | 111.8 ± 58.8 | 13–224 | 3678 | 36.25 | 23.11 | 23.55 | 0.980 ± 0.010 | 0.989 ± 0.005 | 0.995 ± 0.003 |
| Image | 113.8 ± 60.0 | 13–214 | 3865 | 29.15 | 3.86 | 8.32 | 0.991 ± 0.005 | 0.997 ± 0.001 | 0.998 ± 0.001 |
Descriptive statistics for bead counts using manual and image algorithm counting across the ten different masses of feed, the two X-ray exposure settings, and the positioning of the two feed samples on the X-ray plate.
rsample = repeatability of masses of feed, rexp = repeatability of X-ray exposure setting within masses and rpos = repeatability of positioning within masses and exposure setting.
The parameter estimates of the calibration equations for converting the number of beads counted in the X-ray to feed mass are given in Table 2. Both methods had very similar intercepts and slopes with the algorithm method having marginally lower standard errors and explaining a marginally larger variation of the total bead counts (R2 = 0.98) as compared to the manual counting (R2 = 0.97).
Table 2
| Trait | Units | Intercept ± S.E. | Slope ± S.E. | R2 |
|---|---|---|---|---|
| Manual counting | Count | 2.10 ± 1.93 | 90.4 ± 1.41 | 0.97 |
| Algorithm counting | Count | 2.20 ± 1.64 | 92.6 ± 1.21 | 0.98 |
Calibration equations of feed mass from the number of beads for the manual or image algorithm counting methods in X-rays.
S.E. = standard error, R2 = coefficient of determination.
However, the counting times of the two methods differed drastically (Figure 3). The time taken to count beads manually increased linearly from 20 seconds to over 350 seconds per radiograph with the increasing number of beads in the increasing feed masses. Whilst for the Algorithm counting this remained largely stable at approximately 54 seconds per image irrespective of the number of beads or feed mass.
Figure 3
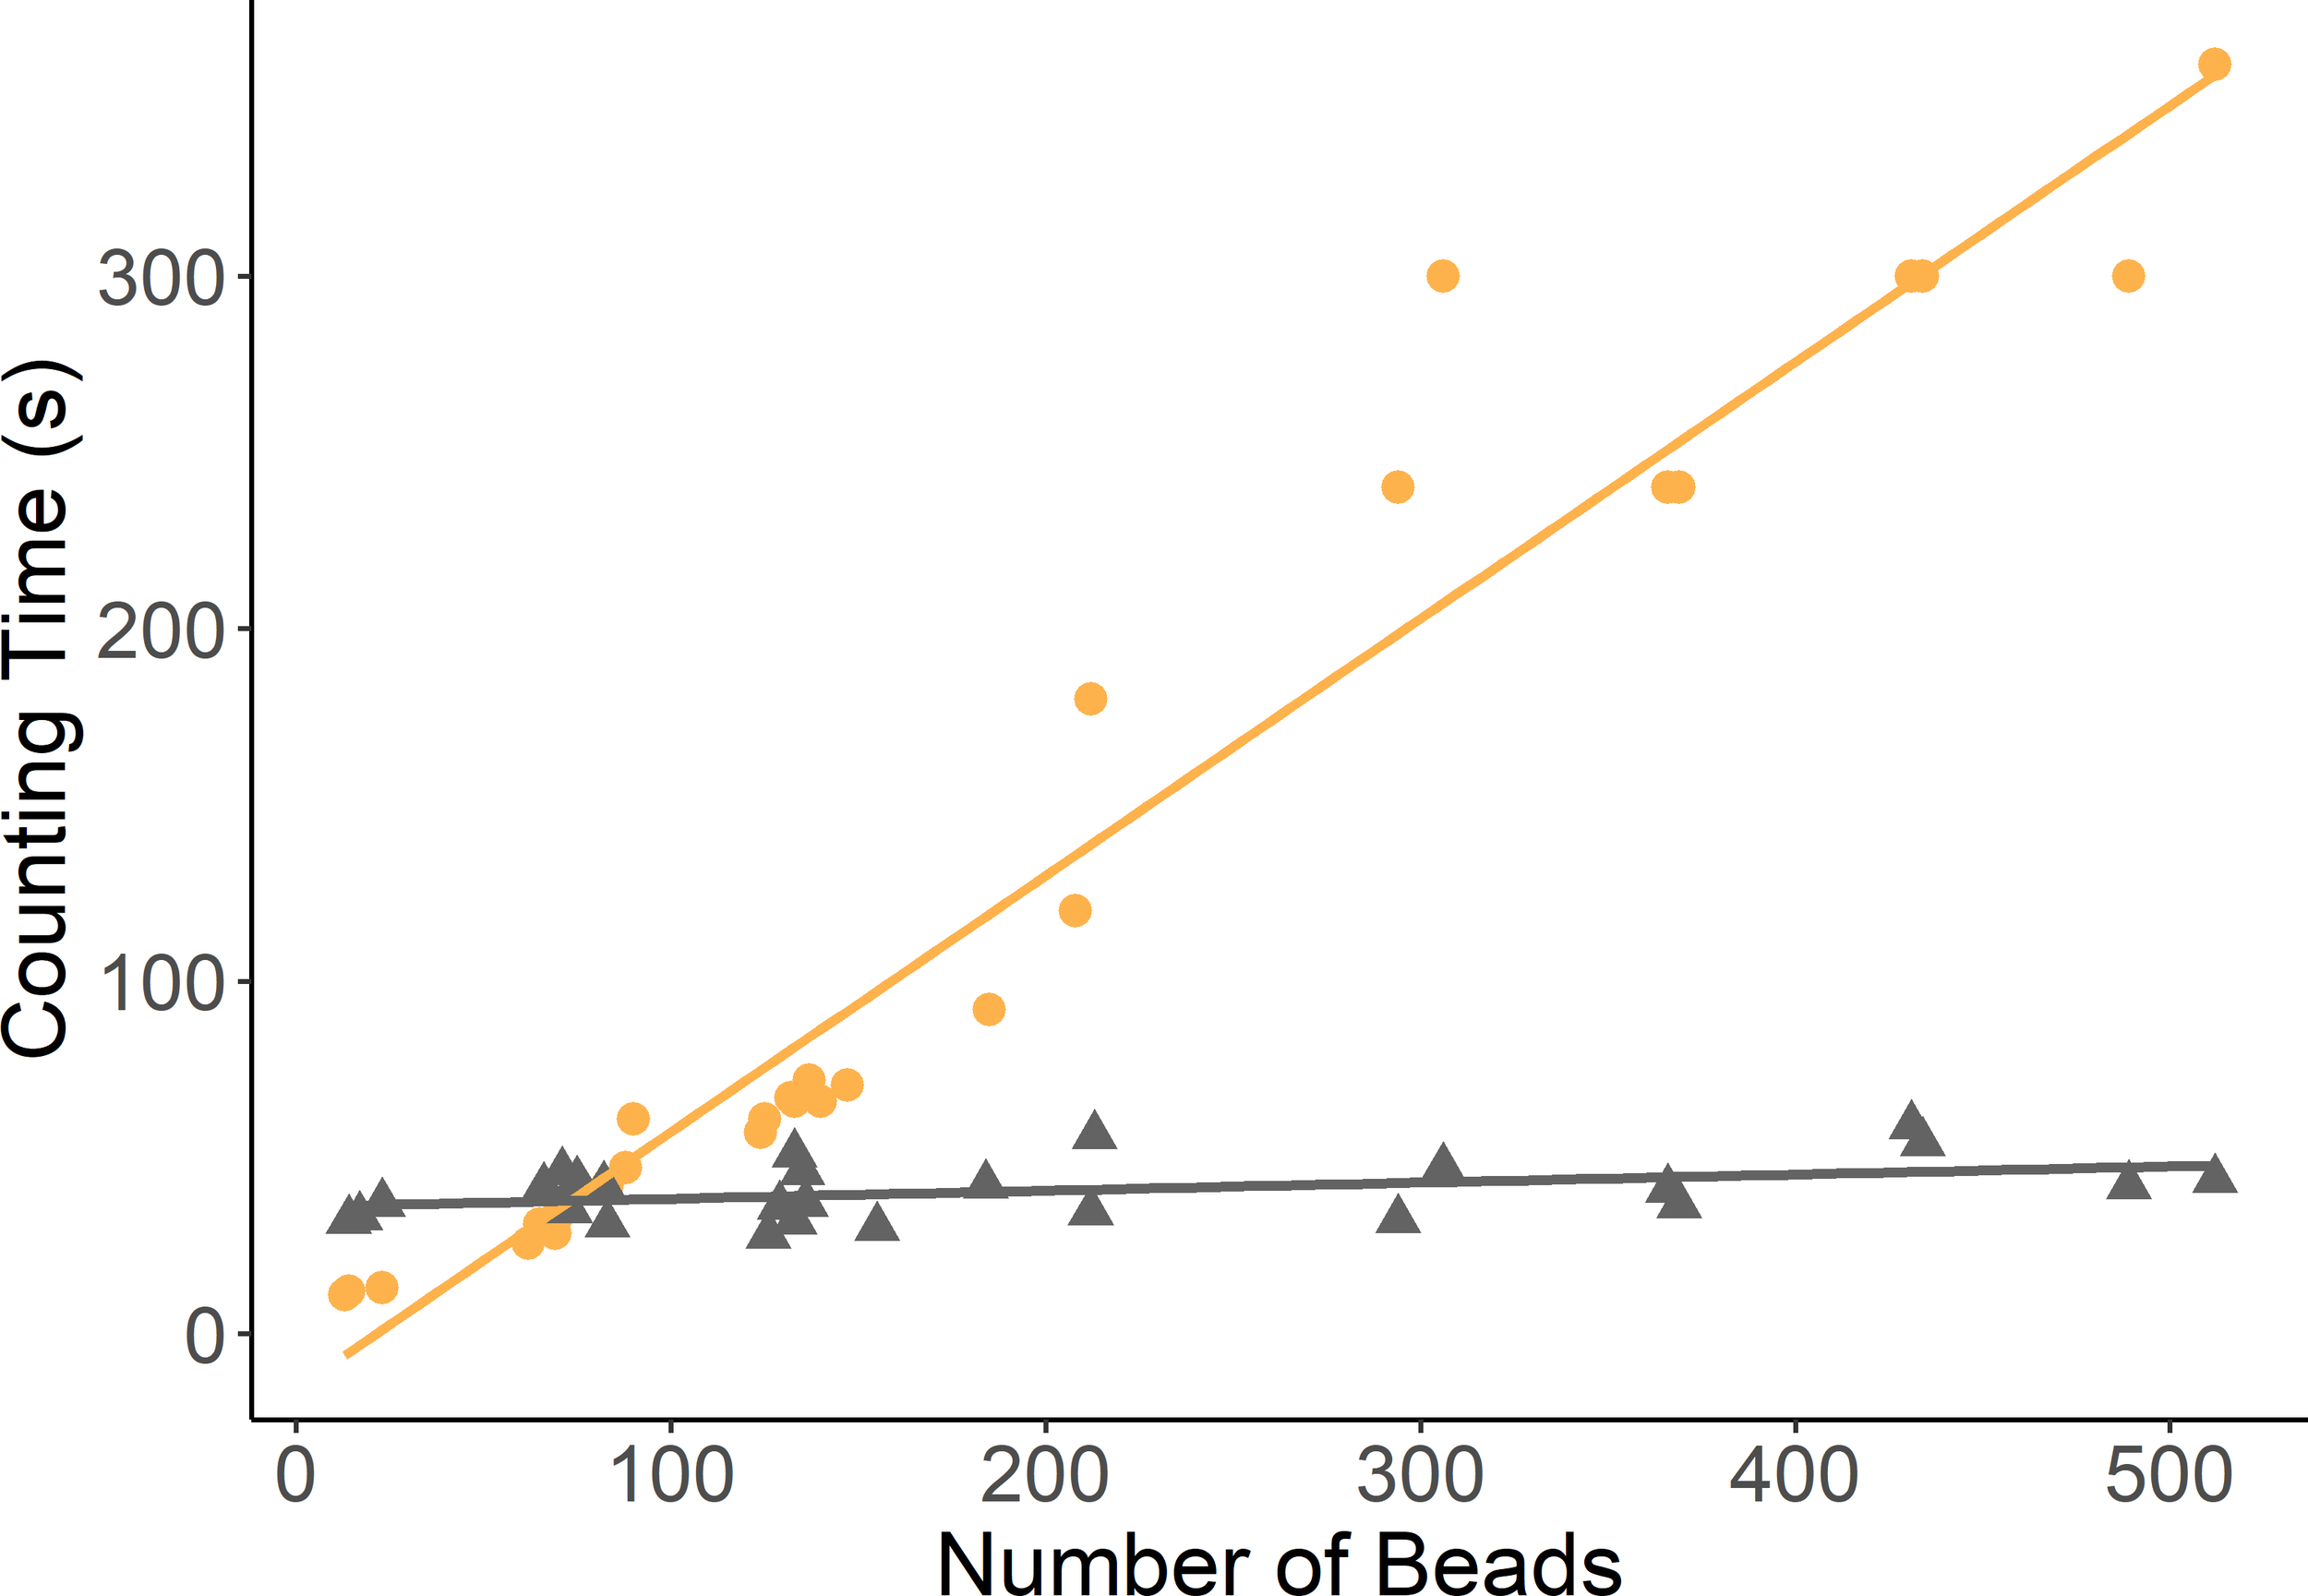
Scatter plot of the time taken to count the beads from X-ray images feed samples of increasing masses. (Manual counting times denoted in orange by full circles. Image analysis algorithm counting times denoted by triangles in grey).
3.2 Experiment 2: Passage rate and optimization of feeding times
The positive control group, where bead evacuation was known to have occurred had 15.3% beads in the distal intestine after being on a 9-hour feeding regime for two consecutive days (Table 3). Importantly this group was not significantly different from the groups fed on 9-hour feeding regimes and imaged 12.5–17 hours after first being offered feed (17.1–20.5%). Demonstrating bead evacuation is likely to have occurred already at 12.5 hours after first being offered feed. Interestingly, the groups fed over a 6-hour feeding period and imaged 6.5–11 hours after first being offered feed were not significantly different from each other (1.5–6.6%) beads in the distal intestine but were significantly different from those imaged 12.5 to 27 hours after first being offered feed (Table 3; Figure 4).
Table 3
| Days of feeding | Feeding regime (hrs) | The time between X-ray and first offer of feed (hrs) | Beads in the distal intestine (%), mean (SE)* | Coefficient of variation (%) |
|---|---|---|---|---|
| 2 | 9 | 27 | 15.3b (2.3) | 48.4 |
| 1 | 9 | 17 | 20.5b (1.7) | 21.1 |
| 1 | 9 | 12.5 | 17.1b (2.4) | 45.0 |
| 1 | 6 | 11 | 5.5a (1.4) | 83.3 |
| 1 | 6 | 10 | 6.6a (0.7) | 34.8 |
| 1 | 6 | 8 | 2.4a (0.8) | 108.6 |
| 1 | 6 | 6.5 | 1.5a (0.5) | 93.3 |
The effect of the time of X-ray relative to the time of first being offered feed and the length of feeding regime for receiving the entire daily ration of feed on the percentage of total beads in the distal intestine.
* SE, Standard Error.
Figure 4
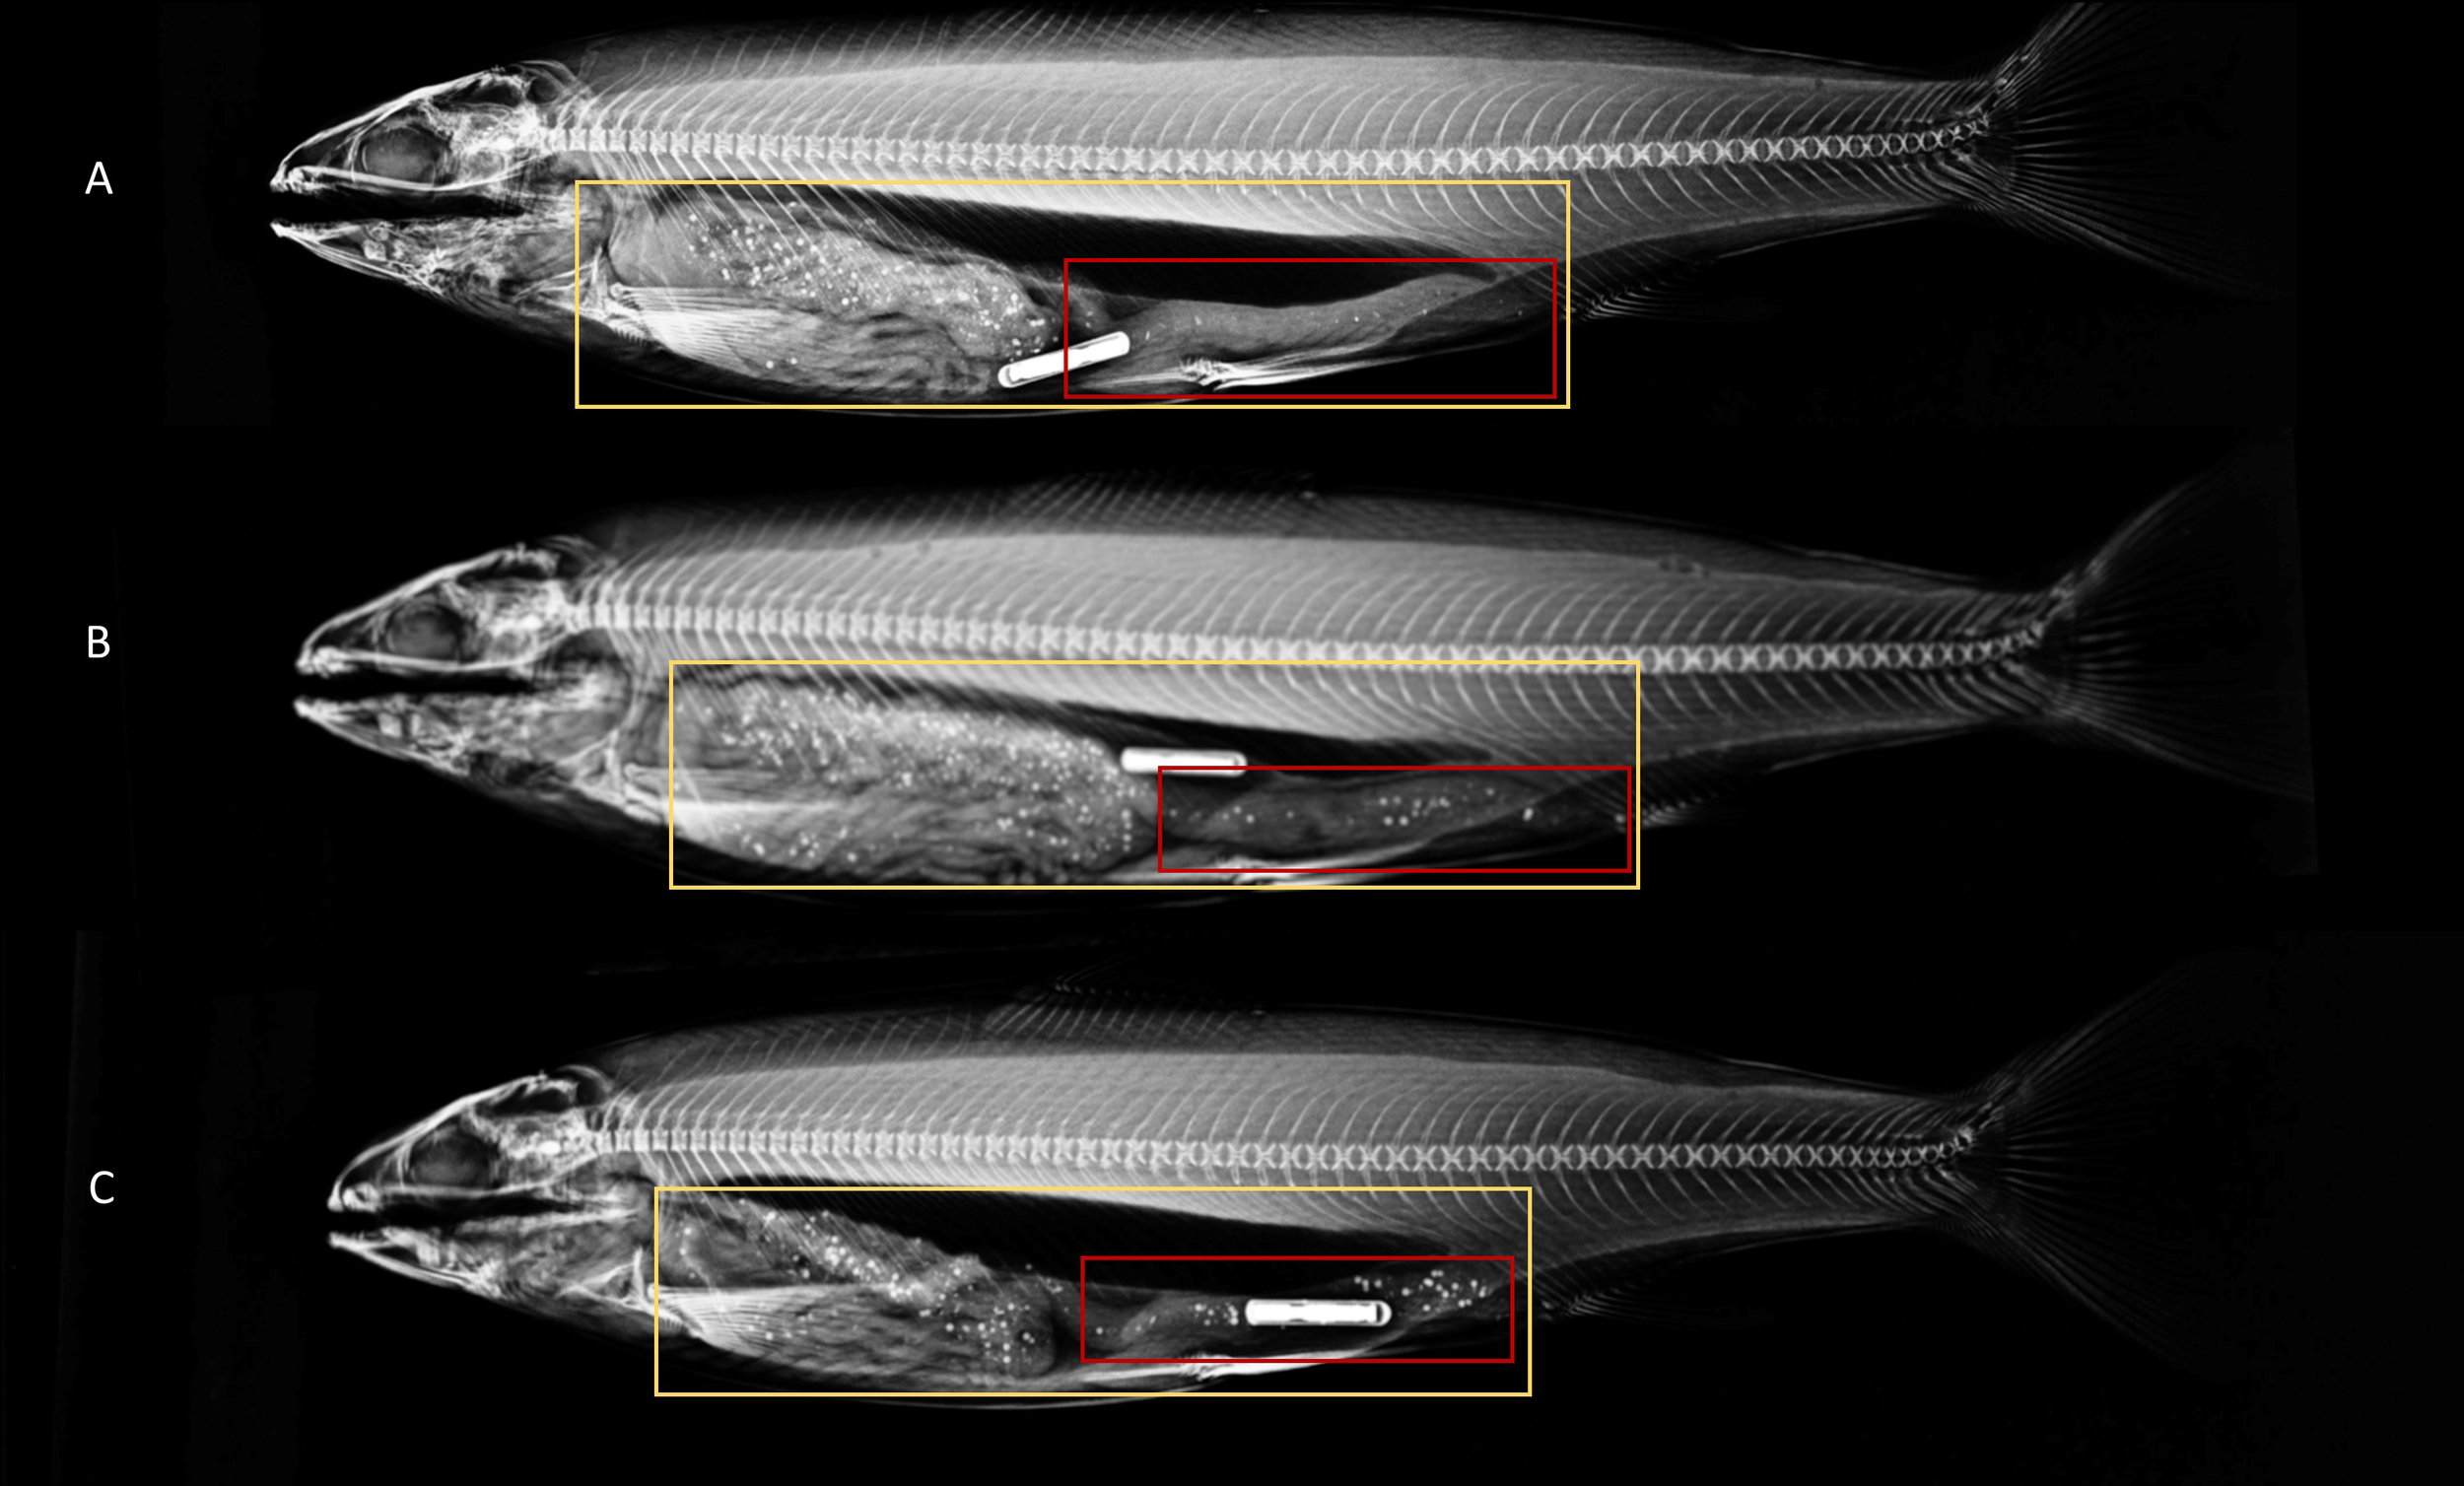
X-ray images of Atlantic salmon with regions of interest selected for entire gastrointestinal tract (yellow), and distal intestine (red) at differing times since first being offered feed containing radio-opaque beads (A) 6.5 hours since being offered feed (B) 11 hours since first being offered feed and (C) 27 hours since first being offered feed. The image is altered to fit all three radiographs in one image.
3.3 Experiment 3: Repeatability of feed intake in Atlantic salmon
At each of the three recordings feed intake showed larger individual variation (CV 27–33%) than body weight (CV 18.3–20.6%). Body length displayed the lowest coefficient of variation (CV 6.7–7.1%) consistent with body length being a singular dimension trait whilst feed intake and body weight are mass traits with higher variation. All three traits were significantly repeatable over the entire 70 day trial period (Table 4). Feed intake was the least repeatable at (0.45 ± 0.11), followed by body weight (0.63 ± 0.09) and lastly length was very highly repeatable at 0.92 ± 0.02.
Table 4
| Trait | Individual variance () | Residual variance () | r ± S.E |
|---|---|---|---|
| Feed intake (g) | 0.14 | 0.17 | 0.45 ± 0.11 |
| Body length (mm) | 241.64 | 22.0 | 0.92 ± 0.02 |
| Body weight (g) | 1150.5 | 667.4 | 0.63 ± 0.09 |
Variance components and repeatability (r) for feed intake, body length, and body weight of Atlantic salmon over 70 days.
r, repeatability; S.E., standard error.
4 Discussion
4.1 Sources of error in manual counting
The accuracy of the X-ray method starts with accurately estimating the feed mass to the number of radio-opaque markers, and this is partly influenced by the degree of homogenous mixing of the marker within the feed, manual counting by a human observer, and the accuracy with which the mass of feed is measured (Jobling et al., 2007). To investigate this, we X-rayed three replicated samples of ten known feed masses across the range of 0.2 grams to 2.2 grams, manually counted the markers for each of the 30 radiographs, and estimated the marker-to-feed relationship. It was found that 97% of the variation among the ten feed masses was explained by the marker counts. This finding is congruent with previous studies in salmonids (R2 = 0.90–0.99) (Talbot and Higgins, 1983; Kause et al., 2006a; Handeland et al., 2008; Esmaeili et al., 2021). Since feed pellets are three-dimensional objects which are captured in two dimensions in the radiograph, we hypothesized that the positioning of pellets in the radiograph may influence the marker counts as beads higher in the pellet might obscure those located below. Furthermore, we hypothesized that the exposure or zoom of the X-ray may influence the human observer’s ability to count. However, as the intraclass correlation coefficient for both position and exposure were close to unity for both the manual and the image analysis counting. Therefore the positioning, and exposure settings can only be negligible sources of variation. Similarly, the intraclass correlation for each combination of exposure setting, zoom, and feed mass was also close to unity for both the manual and image analysis counting which indicates that the accuracy of the recorded sample masses within the ten different feed masses was very high. It appears that the small deviation in the coefficient of determination from 1 of the calibration equation for feed mass in the present study must be attributed to other unknown sources of experimental error. Thus, the current experimental conditions appear to be robust against the abovementioned sources of errors.
4.2 Image analysis to improve throughput and accuracy
Numerous applications which rely on manual counting by human observers have reported systematic and random biases due to observers, especially when numbers of markers are in the order of magnitude of 102 or higher (for instance, counting salmon lice (Lepeophtheirus salmonis) (Heuch et al., 2011; Elmoslemany et al., 2013). A study estimating fry counts of European seabass (Dicentrurchus labrax) by manual counting or from images, found the human counting error for manual counting to be between 8 and 21% with increasing group sizes of fish from 100 to 3000 individuals, whilst human counting error from photographs remained at around 1% regardless of group size (Chatain et al., 1996). Typically, in the X-ray method the marker is included within the feed to achieve a range of 30–300 markers per fish (Jobling et al., 2007), which challenges human observers to be objective and reproducible, especially under this time-consuming and tedious task. The use of image analysis for marker counting has been limited (Walker et al., 2012) and the comparison with manual counting for accuracy, precision, and throughput has not been documented before. Encouragingly we found that image analysis achieved very similar results as manual counting, albeit with marginally better performance.
The largest advantage of using image analysis for counting markers appears to be the time saved, particularly when the number of markers is large (Figure 3). In applications where thousands of fish need to be X-rayed and the markers counted, e.g. large-scale genetic cohorts or commercial-scale feeding trials, the time taken by human observers to accurately count markers is prohibitive. While it is possible to save time by reducing the number of markers in the feed, this increases the uncertainty in the calibration equation, particularly at the lower levels of the range and around the intercept negatively impacting the accuracy (McArdle, 2003). Thus, there is a trade-off in total method accuracy between increasing markers in the feed to ensure calibration equation accuracy and increased counting burden which may reduce manual counting accuracy and counting times. This trade-off is largely overcome by employing image analysis and thus large-scale evaluations of aquaculture species for feed intake with the X-ray method are feasible.
4.3 Optimizing X-ray imaging time with salmon feeding times
The X-ray method requires that the markers are retained within the gastrointestinal tract for some time between the end of the feeding period and the time of X-ray imaging. If any markers are lost through the feces by the time the fish is X-rayed, this will lead to an underestimation of the feed intake (Jobling et al., 2007). Furthermore, if the goal is to determine the daily feed intake of Atlantic salmon, then the entire daily feed ration needs to be delivered over a reduced feeding period before the X-ray. However, if the feeding period is too short the feed intake estimate may not reflect the ‘true’ daily feed intake, and if the start of the feeding period and time until X-ray imaging is too long there may be defecation of markers and thus an underestimation of daily feed intake.
Several studies investigated the use of the X-ray method for quantifying individual feed intake or gastric evacuation and intestinal passage rates in Atlantic salmon (Talbot and Higgins, 1983), arctic charr (Jobling et al., 1993), and Atlantic cod (dos Santos and Jobling, 1991). However, this was not done to optimize the X-ray method for Atlantic salmon. From these previous studies, it is clear the rate of passage of the marker through the digestive tract and evacuation are affected by factors including water temperature, feed, marker type, and the size and life stage of the fish (Jobling et al., 1993; Storebakken et al., 1999; Handeland et al., 2008; Hatlen et al., 2015). This highlights the need to optimize the feeding period and X-ray times for each species under typical rearing conditions. The above-mentioned studies did indicate that feed can be evacuated in the range of 9 to 18 hours after the first offering of feed in juvenile salmonids.
In experiment 2, the percentage of feed in the distal intestine was lowest (1.5–6.6%) in groups of fish X-rayed between 6.5 and 11 hours after first being offered feed on a 6-hour feeding regime (Figure 4). Although within this time frame the percentage of beads in the distal intestine was very low, the loss of markers through feces can still occur. Interestingly there was substantial individual variation in the passage rate of markers to the distal intestine (CV = 21.1–108.6%), but these estimates must be interpreted with care as they can be affected by the time the fish started to feed within the feeding period. Thus, differences between individuals reflect not only the rate of passage but also the fish’s feed requirement and feeding times within the actual feeding regime. Based on the time taken to X-ray image fish in the current experimental setting we estimate it is possible to image up to 400 Atlantic salmon within 6.5–11 hours of first being offered feed on a 6-hour feeding regime. Thus, genetic evaluations of thousands of individual Atlantic salmon are feasible if multiple tanks of hundreds of fish are used over consecutive days.
4.4 Ranking individual Atlantic salmon for feed intake
In many applications, it is of interest to rank individual fish based on their feed intake, for instance, to obtain an estimate of their feed efficiency. The X-ray method offers a single ‘snapshot’ measurement each time a fish is X-rayed, and it is not feasible to X-ray fish too frequently without impairing growth and appetite due to handling stress. Moreover, earlier studies in arctic charr (Salvelinus alpinus) found the intra-individual variation for daily feed intake with the X-ray method to be much larger than for body weight (Jobling et al., 1989), indicating a single snapshot measurement is unlikely to be representative of the entire growth period. Several authors have estimated the repeatability of feed intake measurements over a growth period in other salmonids. Repeatability can take a value between 0 and 1, where 1 indicates all variance is between individuals and thus ranking of individuals is consistent over replicated measurements and 0 indicates all variation is within individuals and thus ranking is inconsistent. The repeatability estimate also gives the theoretical upper limit for heritability (Falconer and Mackay, 1996; Wolak et al., 2012). Comparing repeatability estimates between studies is challenging, as the estimate is specific to the individual variation within the population under study, the measurement errors associated with phenotyping methods, the number of repeated measurements, and the number of days between these.
Nonetheless, studies have found the repeatability of feed intake using the X-ray method to be low (0.09–0.32) (Kause et al., 2006a; Grima et al., 2008). In the most comprehensive study to date, (Kause et al., 2006a) X-rayed rainbow trout (n=405-639) on nine occasions, corresponding to three consecutive weekly measurements for fish at three different mean body weights of 140, 750, and 2000 grams over approximately 488 days. In that study, the repeatability of feed intake was between 0.09 and 0.32, whilst repeatability for body weight was between 0.69 and 0.96 (Kause et al., 2006a). Similarly, (Grima et al., 2008) found the repeatability of feed intake using the X-ray method to be low (r = 0.13 ± 0.06) for 365 rainbow trout originating from 10 clonal lines X-rayed on three occasions over a 43-day growth period. In a study where the feed intake of Nile tilapia (Oreochromis niloticus) (n = 102) in aquaria was video recorded, by counting the number of pellets consumed by each individual at each meal, the estimated repeatability of feed intake was r = 0.42 over 10 days. Encouragingly, in the present study of Atlantic salmon, we found feed intake to be significantly and moderately repeatable (r = 0.45 ± 0.11) when recorded three times over a 70-day growth period. In agreement with the trend of previous studies, the repeatability estimate of body weight over the same period was higher (r = 0.63 ± 0.09). Whilst it is not possible to determine the cause of the increased repeatability in the current study, it may be due to a combination of technological improvements in digital X-ray over the last decades and the use of image analysis for counting markers.
In the study of Kause et al. (2006a), they found that taking the average feed intake over three consecutive weeks increased the repeatability from 0.1 to 0.25 for fish fed a normal protein diet and from 0.3 to 0.56 for fish fed a high protein diet. This is because the variance around repeated measurements which are replicated closely in time (temporally) reflects to a large extent measurement error (imprecision), which is reduced through taking an average of replicate measurements (Kause et al., 2006a; Adolph and Hardin, 2007; Difford et al., 2018; Difford et al., 2021). The proportional reduction in the total variance due to reducing the intra-individual variance by taking an average of several replicates is given by 100-100 × ((1+ r(n-1))/n) (Falconer and Mackay, 1996; Kause et al., 2006a) where r is the repeatability and n is the number of repeated measurements. Thus, lower repeatability traits (r) gain a proportionally higher reduction in intra-individual variance by increasing the number of replicate measurements. Kause et al. (2006a) found theoretical evidence, using another form of this equation (r_ave=nr/((1+ (n-1)r))), that 6 replicate measurements were needed per recording period to obtain a repeatability of 0.42 for the normal protein diet and 0.72 for the high protein diet. In the present study, we found a repeatability of 0.45 with three measurements over 70 days, and would theoretically need four measurements to obtain a repeatability of 0.77 and five measurements for a repeatability of 0.80. The comparatively lower number of repeated measurements required to obtain repeatability estimates comparable to those of body weight is encouraging. However, it is important to note that there are biological limitations to increasing the number of repeated X-ray measurements. This is related to observations of the feed and waste spill that indicated that it took more than one week for the fish group to obtain feed intake to levels before each X-ray recording. Hence increasing the number of X-ray records cannot exceed the time taken for feed intake to return to pre-X-ray levels.
5 Conclusion
Image analysis for counting beads was found to be very accurate and similar to that of manual counting (R2 = 0.98) but was between 1 – 6 times faster than manual counting. The position of feed pellets on the X-ray and the X-ray exposure setting resulted in negligible errors in the bead count. For the first time, the X-ray method was found to be feasible for recording feed intake in Atlantic salmon with minimal loss of markers through defecation, by imaging them between 6.5 and 11 hours after first being fed the feed containing radio-opaque beads. Crucially, feed intake was significantly repeatable (0.45 ± 0.11) over the 70-day growth period, indicating the method can be used to rank fish for feed intake and may hold promise as a phenotype in genetic evaluations and other applications where fish are ranked for feed intake and/or feed efficiency.
Statements
Data availability statement
The raw data supporting the conclusions of this article will be made available by the authors, without undue reservation.
Ethics statement
The animal study was reviewed and approved by Norwegian Food Safety Authority (FOTS ID 23718).
Author contributions
GD, BH, BG, AN and AS contributed to the conception and design of the study and obtained funding. GD, BH, GB, KH, SL, BE, KG and OR contributed to the methodology and participated in the investigation. GB and KG captured the X-ray images. OR and BH produced the feed. KH and S-KL developed software. GD and BG conducted the statistical analysis. BE practiced animal husbandry. GD curated data and wrote the first draft. All authors contributed to the manuscript revision, and read, and approved the submitted version.
Funding
Funding for conducted the research was provided by the Research Council of Norway through grant 194050 for Nofima internal research project 12918 PrecisionVision, EU Horizon 2020 projects grant projects ‘AquaIMPACT’ under grant No 818367 and ‘NewTechAqua’ under grant No 862658.
Acknowledgments
The authors would like to acknowledge the efforts of the staff at the Research Station for Sustainable Aquaculture, Nofima, Sunndalsøra, and MOWI Genetics ASA for animal husbandry and meticulous animal recording. The authors are grateful to Dr. Aikaterina Kousoulaki for sharing experiences with extruding feeds and glass beads and Dr. Per Brunsvik for advice on Atlantic salmon feeding and passage rate.
Conflict of interest
The authors declare that the research was conducted in the absence of any commercial or financial relationships that could be construed as a potential conflict of interest.
Publisher’s note
All claims expressed in this article are solely those of the authors and do not necessarily represent those of their affiliated organizations, or those of the publisher, the editors and the reviewers. Any product that may be evaluated in this article, or claim that may be made by its manufacturer, is not guaranteed or endorsed by the publisher.
Supplementary material
The Supplementary Material for this article can be found online at: https://www.frontiersin.org/articles/10.3389/fanim.2023.1177396/full#supplementary-material
References
1
AdolphS. C.HardinJ. S. (2007). Estimating phenotypic correlations: Correcting for bias due to intraindividual variability. Funct. Ecol.21, 178–184. doi: 10.1111/j.1365-2435.2006.01209.x
2
BenjaminiY.HochbergY. (1995). Controlling the false discovery rate: a practical and powerful approach to multiple testing. J. R. Stat. Soc. B57, 289–300. doi: 10.2307/2346101
3
ChatainB.DebasL.BourdillonA. (1996). A photographic larval fish counting technique: Comparison with other methods, statistical appraisal of the procedure and practical use. Aquaculture141, 83–96. doi: 10.1016/0044-8486(95)01206-0
4
de VerdalH.KomenH.QuilletE.ChatainB.AllalF.BenzieJ. A. H.et al. (2018). Improving feed efficiency in fish using selective breeding: a review. Rev. Aquac10, 833–851. doi: 10.1111/raq.12202
5
DiffordG. F.Díaz-GilC.Sánchez-MoyaA.AslamM. L.HornS. S.RuyterB.et al. (2021). Genomic and phenotypic agreement defines the use of microwave dielectric spectroscopy for recording muscle lipid content in European seabass (Dicentrarchus labrax). Front. Genet.12. doi: 10.3389/fgene.2021.671491
6
DiffordG. F.OlijhoekD. W.HellwingA. L. F.LundP.BjerringM. A.de HaasY.et al. (2018). Ranking cows’ methane emissions under commercial conditions with sniffers versus respiration chambers. Acta Agriculturae Scandinavica A: Anim. Sci.68, 25–32. doi: 10.1080/09064702.2019.1572784
7
dos SantosJ.JoblingM. (1991). Gastric emptying in cod, Gadus morhua L.: Emptying and retention of indigestible solids. Journal of Fish Biology38 (2), 187–197
8
DvergedalH.ØdegårdJ.ØverlandM.MydlandL. T.KlemetsdalG. (2019). Selection for feed efficiency in Atlantic salmon using individual indicator traits based on stable isotope profiling. Genet. Selection Evol.51, 1–14. doi: 10.1186/s12711-019-0455-9
9
ElmoslemanyA.WhyteS. K.RevieC. W.HammellK. L. (2013). Sea Lice monitoring on Atlantic salmon farms in new Brunswick, Canada: Comparing audit and farm staff counts. J. Fish Dis.36, 241–247. doi: 10.1111/jfd.12051
10
EsmaeiliM.CarterC. G.WilsonR.WalkerS. P.MillerM. R.BridleA.et al. (2021). Proteomic investigation of liver and white muscle in efficient and inefficient Chinook salmon (Oncorhynchus tshawytscha): Fatty acid metabolism and protein turnover drive feed efficiency. Aquaculture542, 736855. doi: 10.1016/j.aquaculture.2021.736855
11
FalconerD.MackayT. (1996). “Introduction to quantitative genetics,” in Fourth (Harlow, Essex, United Kingdom: Longman Scientific and Technical).
12
GjerdeB.MartensH. (1987). Predicting carcass composition of rainbow trout by near‐infrared reflectance spectroscopy. J. Anim. Breed. Genet.104, 137–148. doi: 10.1111/j.1439-0388.1987.tb00116.x
13
GrimaL.QuilletE.BoujardT.Robert-GraniéC.ChatainB.MambriniM. (2008). Genetic variability in residual feed intake in rainbow trout clones and testing of indirect selection criteria (Open access publication). Genet. Selection Evol.40, 607–624. doi: 10.1051/gse:2008026
14
HandelandS. O.ImslandA. K.StefanssonS. O. (2008). The effect of temperature and fish size on growth, feed intake, food conversion efficiency and stomach evacuation rate of Atlantic salmon post-smolts. Aquaculture283, 36–42. doi: 10.1016/j.aquaculture.2008.06.042
15
HatlenB.ArnesenA. M.JoblingM.SiikavuopioS.BjerkengB. (1997). Carotenoid pigmentation in relation to feed intake, growth and social interactions in Arctic charr, salvelinus alpinus (L.), from two anadromous strains. Aquac Nutr.3, 189–199. doi: 10.1046/j.1365-2095.1997.00087.x
16
HatlenB.NordgreenA. H.RomarheimO. H.AasT. S.ÅsgårdT. (2015). Addition of yttrium oxide as digestibility marker by vacuum coating on finished pellets - a method for assessing digestibility in commercial salmon feeds? Aquaculture435, 301–305. doi: 10.1016/j.aquaculture.2014.10.008
17
HenryonM.JokumsenA.BergP.LundI.PedersenP. B.OlesenN. J.et al. (2002). Genetic variation for growth rate, feed conversion efficiency, and disease resistance exists within a farmed population of rainbow trout. Aquaculture209, 59–76. doi: 10.1016/S0044-8486(01)00729-3
18
HeuchP. A.GettinbyG.RevieC. W. (2011). Counting sea lice on Atlantic salmon farms - empirical and theoretical observations. Aquaculture320, 149–153. doi: 10.1016/j.aquaculture.2011.05.002
19
IversenA.AscheF.HermansenØ.NystøylR. (2020). Production cost and competitiveness in major salmon farming countries 2003–2018. Aquaculture522, 735089. doi: 10.1016/j.aquaculture.2020.735089
20
JoblingM.BaardvikB. M.JørgensenE. H. (1989). Investigation of food-growth relationships of Arctic charr, salvelinus alpinus l., using radiography. Aquaculture81, 367–372. doi: 10.1016/0044-8486(89)90160-9
21
JoblingM.ChristiansenJ. S.JørgensenE. H.ArnesenA. M. (1993). The application of x-radiography in feeding and growth studies with fish: A summary of experiments conducted on arctic charr. Rev. Fisheries Sci.1, 223–237. doi: 10.1080/10641269309388543
22
JoblingM.CovsD.DamsgrdB.KristiansenH. R.KoskelaJ.PetursdottirT. E.et al. (2007). “Techniques for measuring feed intake,” in Food intake in fish, (John Wiley & Sons)49–87. doi: 10.1002/9780470999516.ch3
23
KauseA.TobinD.DoblyA.HoulihanD.MartinS.MäntysaariE. A.et al. (2006a). Recording strategies and selection potential of feed intake measured using the X-ray method in rainbow trout. Genet. Selection Evol.38, 389–409. doi: 10.1051/gse:2006011
24
KauseA.TobinD.HoulihanD. F.MartinS. A. M.MäntysaariE. A.RitolaO.et al. (2006b). Feed efficiency of rainbow trout can be improved through selection: Different genetic potential on alternative diets1. J. Anim. Sci.84, 807–817. doi: 10.2527/2006.844807x
25
KinghornB. (1983). Genetic variation in food conversion efficiency and growth in rainbow trout. Aquaculture32, 141–155. doi: 10.1016/0044-8486(83)90276-4
26
KolstadK.Grisdale-HellandB.GjerdeB. (2004). Family differences in feed efficiency in Atlantic salmon (Salmo salar). Aquaculture241, 169–177. doi: 10.1016/j.aquaculture.2004.09.001
27
MadsenP.JensenJ. (2014). A user’s guide to DMU, version 6, release 5.0 Vol. 50 (Tjele Denmark: Center for Quantitative Genetics and Genomics Dept. of Molecular Biology and Genetics, University of Aarhus Research Centre Foulum Box), 8830.
28
McArdleB. H. (2003). Lines, models, and errors: Regression in the field. Limnol Oceanogr48, 1363–1366. doi: 10.4319/lo.2003.48.3.1363
29
StorebakkenT.KvienI. S.ShearerK. D.Grisdale-HellandB.HellandS. J. (1999). Estimation of gastrointestinal evacuation rate in atlantic salmon (Salmo salar) using inert markers and collection of faeces by sieving: Evacuation of diets with fish meal, soybean meal or bacterial meal. Aquaculture172, 291–299. doi: 10.1016/S0044-8486(98)00501-8
30
TalbotC.HigginsP. J. (1983). A radiographic method for feeding studies on fish using metallic iron powder as a marker. J. Fish Biol.23, 211–220. doi: 10.1111/j.1095-8649.1983.tb02896.x
31
ThodesenJ.GjerdeB.Grisdale-HellandB.StorebakkenT. (2001). Genetic variation in feed intake, growth and feed utilization in Atlantic salmon (Salmo salar). Aquaculture194, 273–281. doi: 10.1016/S0044-8486(00)00527-5
32
ThodesenJ.Grisdale-HellandB.HellandS. J.GjerdeB. (1999). Feed intake, growth and feed utilization of offspring salmo, from wild and selected Atlantic salmon (Salmo salar). Aquaculture180, 237–246. doi: 10.1016/S0044-8486(99)00204-5
33
ToftenH.JoblingM.ToftenH. (1997). Feed intake and growth of Arctic charr, salvelinus alpinus (L.), fed diets supplemented with oxytetracycline and squid extract. Aquac Nutr.3, 255–259. doi: 10.1046/j.1365-2095.1997.00098.x
34
WalkerS. P.IngramM.BaileyJ.DoddsK. G.FisherP. J.AmerP. R.et al. (2012). Chinook Salmon (Oncorhynchus tshawytscha) feed conversion efficiency: evaluation and potential for selection. Proc. New Z. Soc. Anim. Production72, 227–230.
35
WintherU.HognesE. S.JafarzadehS.ZieglerF. (2020). Greenhouse gas emissions of Norwegian seafood products in 2017.
36
WolakM. E.FairbairnD. J.PaulsenY. R. (2012). Guidelines for estimating repeatability. Methods Ecol. Evol.3, 129–137. doi: 10.1111/j.2041-210X.2011.00125.x
Summary
Keywords
feed intake, X-ray method, image analysis, passage rate, feed efficiency, Atlantic salmon
Citation
Difford GF, Hatlen B, Heia K, Bæverfjord G, Eckel B, Gannestad KH, Romarheim OH, Lindberg S-K, Norris AT, Sonesson AK and Gjerde B (2023) Digital phenotyping of individual feed intake in Atlantic salmon (Salmo salar) with the X-ray method and image analysis. Front. Anim. Sci. 4:1177396. doi: 10.3389/fanim.2023.1177396
Received
01 March 2023
Accepted
27 March 2023
Published
14 April 2023
Volume
4 - 2023
Edited by
Yuliaxis Ramayo Caldas, Institute of Agrifood Research and Technology (IRTA), Spain
Reviewed by
H-Michael Habte-Tsion, University of Maine, United States; Lynn Weber, University of Saskatchewan, Canada
Updates
Copyright
© 2023 Difford, Hatlen, Heia, Bæverfjord, Eckel, Gannestad, Romarheim, Lindberg, Norris, Sonesson and Gjerde.
This is an open-access article distributed under the terms of the Creative Commons Attribution License (CC BY). The use, distribution or reproduction in other forums is permitted, provided the original author(s) and the copyright owner(s) are credited and that the original publication in this journal is cited, in accordance with accepted academic practice. No use, distribution or reproduction is permitted which does not comply with these terms.
*Correspondence: Bjarne Hatlen, Bjarne.hatlen@nofima.no
This article was submitted to Animal Breeding and Genetics, a section of the journal Frontiers in Animal Science
Disclaimer
All claims expressed in this article are solely those of the authors and do not necessarily represent those of their affiliated organizations, or those of the publisher, the editors and the reviewers. Any product that may be evaluated in this article or claim that may be made by its manufacturer is not guaranteed or endorsed by the publisher.