 Nick Hockings
 Michael Iwersen
 Andrew Hancock4
 Maciej Oczak
- 1Department for Farm Animals and Veterinary Public Health, The University of Veterinary Medicine Vienna (Vetmeduni Vienna), Precision Livestock Farming Hub, Vienna, Austria
- 2Institute of Animal husbandry and Animal Welfare, Department for Farm Animals and Veterinary Public Health, University Veterinary Medicine, Vienna, (Vetmeduni Vienna), Vienna, Austria
- 3Clinical Unit for Herd Health Management in Ruminants, University Clinic for Ruminants, Department for Farm Animals and Veterinary Public Health, University of Veterinary Medicine Vienna, (Vetmeduni Vienna), Vienna, Austria
- 4Outcomes Research, Zoetis Center of Excellence, Zoetis, Dublin, Ireland
Causal search techniques enable inference from observational data, such as that produced in Precision Livestock Farming. The Peter-Clark algorithm was used to produce four causal models, for the risk of ketosis in individual cows. The data set covered 1542 Holstein-Friesian cows on a commercial dairy farm in Slovakia, over a period of 18 months and had 483 variables, split into four samples for four-way cross validation. The cow data was sorted into quartiles by predicted postpartum blood ketone value. The observed incidences of ketosis by quartile were 3.14%, 6.35%, 6.77%, 15.1%. To test the effect of intervention on the reduction of ketosis cases on the farm, we predicted the expected effect of 20% lower dry matter in the total mixed ration over the 6 months pre-partum. Predicted reductions in incidence of ketosis for the highest risk (4th) quartile were -4.96%, -7.4%, -11.21%, and -11.07% of animals in the herd, respectively for the four models. The different predictions were due to the different causal structures estimated from the four data samples by the Peter-Clark causal model search algorithm. To accurately predict the effect of intervention for automatic optimization of herd performance it is necessary to determine the correct causal structure of the model. Collinearity of inputs due to e.g. grouping by pens, reduced the conditional independence of their effects, and therefore the ability of the Peter-Clark algorithm to determine the correct causal structure. To reduce the collinearity of variables, we recommend causal search on datasets from multiple farms or multiple years.
1 Introduction
Precision Livestock Farming (PLF) is the management of livestock farming by means of automatic, real-time monitoring and control of livestock production, reproduction, health, welfare and environmental impacts (Berckmans, 2017). The purpose of PLF is to guide farm management actions, to minimize input costs and disease while optimizing production and potential profit (Polson and Alonso, 2022). This requires models that predict not simply the expected rates of disease and production as a passive observer, but predict the expected outcome of alternative interventions by farm management (Norton et al., 2019).
Subclinical ketosis (SCK) (≥1.2 mmol of β-hydroxybutyrate (BHBA)/L of serum) is a common metabolic disease in early lactation of dairy cows (Suthar et al., 2013), that increases the risk of secondary diseases and directly reduces milk yield (Duffield et al., 2009), (Vanholder et al., 2015), and reduces fertility (Walsh et al., 2007). Algorithms to predict the risk of SCK from farm management and continuous sensor data are an active area of research with widely varying results, for example Sturm et al. (2020) report sensitivity 67.0% and specificity 73.6% for their best model using a time series classifier of their own design, while Schodl et al. (2022) using a decision tree algorithm report sensitivity 14.3% and specificity 94.0% for their best model, and several null results for models with sensitivity 0%. Slob et al. (2021) provide a systematic review of machine learning in dairy farm management, and Lei and Simões (2021) review ketosis diagnosis and monitoring in dairy cows.
Models which predict the outcome of actions are causal models. They differ from models that forecast from purely observational data, because they must correctly resolve different causal relations that may produce similar statistical relations, e.g. a cockerel crowing predicts the sunrise, but waking the cockerel in the night will not cause the sun to rise. This requires some additional information, either a reliable assumption about the direction of at least one causal relation, or at least one variable that can be experimentally manipulated (Pearl, 2009). The process of discovering correct causal models from observational or mixed observational and interventional data, is “causal structure search”. Given particular constraints, there are mathematically proven algorithms for valid and efficient causal structure search from observational data.
Causal modeling, prediction and search methods, including graphical model search methods extensively described in Spirtes et al. (2001); Peters et al. (2017); Pearl (2009) and Glymour et al. (2019) have not been applied so far in the context of ketosis detection. However, casual modeling methods were applied in livestock agriculture and precision arable farming interventions. The conceptual framework for inferring causal effects from observational data was introduced into livestock research by Bello et al. (2018). Chitakasempornkul et al (2019; 2020) applied structural equation models (SEMs) and an inductive causation algorithm in the analysis of reproductive performance traits in gilts and sows. SEMs were used for Genome-Wide Association Studies of the genomic architecture of milk proteins in dairy cattle by Pegolo et al. (2021). Causal structure search algorithms were reviewed by Rosa and Valente (2013) for the goal of inferring causal effects from observational data in livestock. The Causal Forest technique was demonstrated on synthetic data for estimating site-specific economically optimal nitrogen rates in an arable farming scenario by Kakimoto et al. (2022). Grounding abstract causal structure search, on physical perception from video and other PLF data, for automated monitoring and intervention in PLF, was proposed by Hockings et al. (2022).
The objectives of this study were to determine the feasibility of using causal structure search on archive data to generate a predictive model for SCK, and to generate predictions of the expected effect of potential management interventions to reduce the incidence of SCK. Because of ethical concerns of research on live animals the study is intended to test causal structure search techniques on archive data prior to designing a study with live farm animals.
2 Materials and methods
2.1 Animals and housing
The archive data set came from a commercial dairy farm in Slovakia, collected in 2016-2017 (Sturm et al., 2020). Animal sampling and data collection were approved by the institutional ethics committee of the University of Veterinary Medicine Vienna, Austria (ETK-09/02/2016) as well as the Slovakian Regional Veterinary Food Administration. Animals were housed in ventilated freestall barns with group pens or cubicles, with rubber mats bedded with dried slurry separator material. The composition of the basal diet, mainly based on corn silage, alfalfa silage, wet distillers grains with solubles, corn gluten meal, corn‐cob mix, rapeseed extraction meal and beet pulp silage, was adjusted during the study period based on regular analyses of the total mixed ration (TMR), (Süss et al., 2019). TMR was offered twice per day and adjusted daily to achieve refusals of 5–10%. After removing corrupted entries, the dataset covered 1542 Holstein-Friesian cows over a period of 18 months.
2.2 Dataset
Postpartum blood ketone measurement for all cows was taken at day six post-partum (day five of lactation) using commercially available handheld devices (FreeStyle Precision Xtra, Abbott GmbH and Co. KG, Wiesbaden, Germany) previously evaluated for use on farms (Iwersen et al., 2013). Some cows had additional blood ketone tests at variable dates postpartum. Where multiple measurements were taken, the highest blood ketone result was used. Cows with blood ketones greater than 1.2mmol/l were diagnosed as ketotic. In this study no distinction was made between subclinical versus clinical ketosis. Body condition score (BCS) was visually estimated according to Edmonson et al. (1989). Cow activity was monitored post-partum and in the last month pre-partum using ear-tag accelerometers, (SMARTBOW, Zoetis LLC, Parsippany, NJ, USA). Activity was classified by the manufacturer on three aspects (i) lying/not lying, (ii) ruminating/not ruminating, (iii) inactive/active/highly active (Sturm et al., 2020). Ambient temperature and humidity in the cow barn were automatically logged hourly (Tinytag 2 Plus, Gemini Data Loggers Ltd., Chichester, West Sussex, UK). Temperature-humidity index (THI)
where T = air temperature (°C) and RH = relative humidity (%), (Kendall and Webster, 2009), was calculated and the daily max and min values of THI and humidity were found. Records of milk yield at twice daily milkings, and monthly lab testing for milk composition and somatic cell count (SCC) (DHIA, Dairy Herd Improvement Association Bavaria, Munich, Germany), for each cow were extracted from the records. Feeding records included the quantity of each ingredient used to compose the total mixed ration, for each group of cows at each feeding, as well as the %dry matter and the average dry matter feed per cow for the pen. Additionally 50 stored frozen feed samples from the study were analyzed in 2022 by the University Clinic for Ruminants, VetMedUni, using NIR spectroscopy, using X-NIR™ Portable NIR Analyzer (Dinamica Generale S.p.A., Poggio Rusco, Italy). Other health and farm management records exported from DairyComp 305 (Valley Agricultural Software, Tulare, USA), (from routine commercial operation) included the (i) reproductive events (dry, fresh, open, bred, pregnant), (ii) diseases detected by farm staff (lameness, mastitis, metritis, paresis, cystitis, endometritis, milk fever, pneumonia), (iii) treatments given, and (iv) when the cow was moved to a different pen number, depending on her production stage or health status (e.g. in case of mastitis). In total the dataset was composed of 483 variables, which were later used for causal model search.
2.2.1 Data aggregation
For each partus, data up to six months pre-partum was extracted, together with the post-partum blood ketone measurements, making one case. Cows were identified by a combination of national animal IDs, and non-unique barn animal IDs combined with birth dates. A series of Python scripts were written to parse the data into Pandas dataframes, collate data by national Cow ID, and clean the data formats. The scripts, and both the raw data and the collated, cleaned data, are archived by VetMedUni, and accessible by request to the Clinical Unit for Herd Health Management in Ruminants and the PLF Hub. The aggregated database had 483 variables. Over half the variables were the various crops used as ingredients for the total mixed ration. The production cycles of the cows were identified by their calving dates and days-in-milk/days-pre-partum. Each variable for each cow was summed for each month pre/post-partum.
With the cases sorted by national cow registration number, the data-set was split two ways (i) 1st & 2nd half, samples A & B, and (ii) odd and even cases, samples C & D, to create two pairs of datasets. Sixty seven cases were dropped because blood ketone measurements were not recorded for them. This gave final case counts of 771 sample A, 762 in sample B, 769 in sample C, and 764 in sample D. These were used for 4-way internal cross validation of the results. Models trained on sample A were tested on sample B and vice versa, and likewise between samples C and D.
2.3 Preliminary investigation
2.3.1 Temporal distribution of ketosis and calving
The distribution by calendar date, and by days postpartum were plotted for ketosis tests and cases and number of cows calving (Figures 1A–D). All detected ketosis cases occurred in the two weeks following partus (Figure 1B). There was significant seasonality (p>0.05, on t-test) (Figure 1D) and a long term declining trend due to cows leaving the study group (Figure 1C). For this reason, calving season (date of calving in absolute number of days before or after 1st of July) was added to the study data.
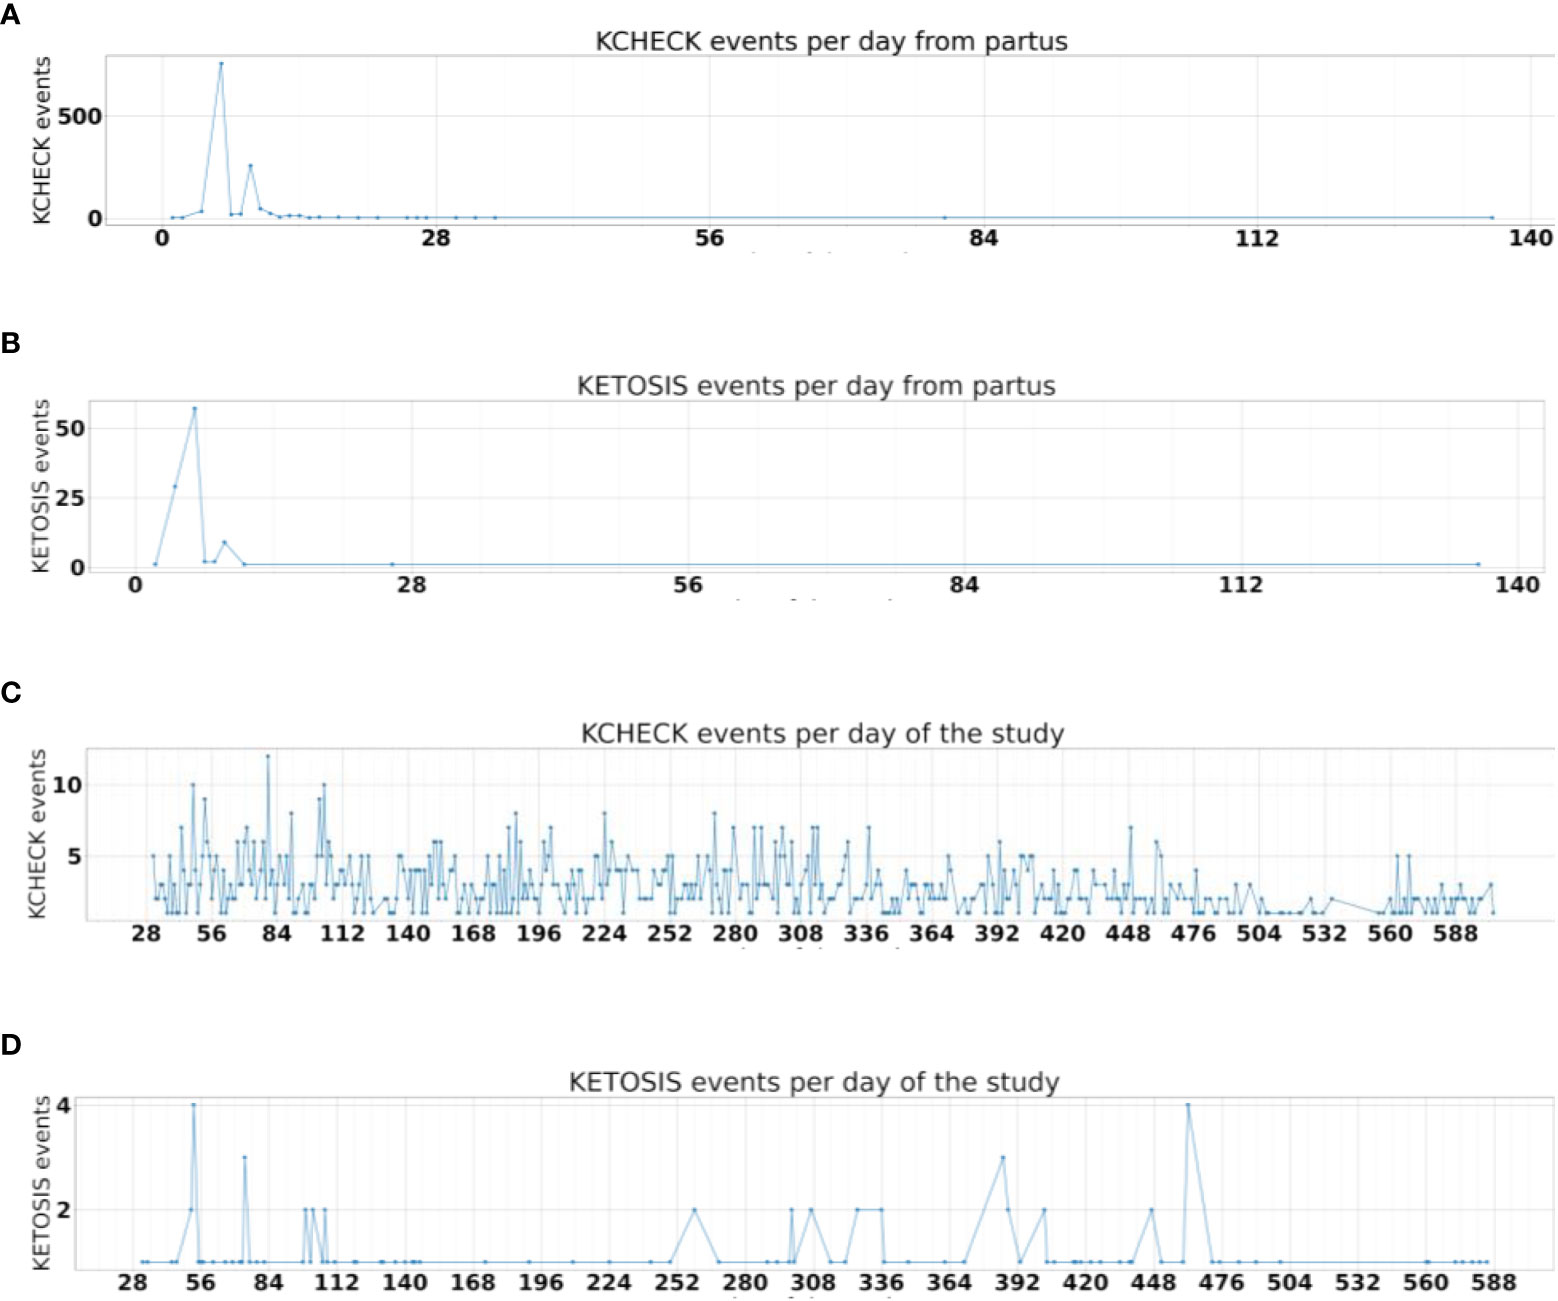
Figure 1 (A) The distribution blood ketone tests per day after partus. (B) The distribution of ketosis cases (blood ketones >1.2mmol/l) after partus. (C) The declining number of cows in the study, demonstrated by the number of postpartum ‘KCHECK’ blood ketone measurements each day from the start of the study. Note many cows were tested more than once. (D) The seasonal distribution of ketosis cases, in days from the start of the study. These plots are for group D, i.e. even numbered cases from the dataset.
2.3.2 Selection of significant variables
The number of variables was reduced from 483 to 112, by selecting only those that showed significant (p>0.05, on t-test) linear correlation with postpartum blood ketone concentration. This eliminated most of the individual feed ingredients. Absolute date of partus was replaced by days from 1st July, (Calving season summer/winter) to represent the seasonality of ketosis.
2.4 Causal structure search and prediction of expected effects
The Peter-Clark (PC) causal structure search algorithm (Ch 5.4.2, Spirtes et al., 2001), implemented in the Tigramite software package (Runge, 2018; Runge et al., 2019; Runge, 2022), was used with the linear partial-correlation conditional independence test. A time lag (Tau) of zero was used because the temporal structure was given by the prior knowledge graph. The PC ‘alpha’ parameter for the maximum p-value of links to be retained, was set to 0.2. The PC algorithm’s parameter for “maximum dimensions of conditional independence” was set to 1. These very permissive settings were required to ensure a meaningful result with this dataset, (see the discussion of collinearity in section 4).
2.4.1 Prior knowledge
A total of 112 variables were used, (Table 1). A directed graph of plausible causal edges was given to restrict the scale of the causal structure search. Summary graphs are shown in Figure 2. The full text of the graph is in the supplementary material. Prior knowledge used included (i) temporal order, and (ii) variables acted directly on peak postpartum blood ketones, via their influence on body condition score, or via cow activity in the last month prepartum. This provided a graph as the start point for PC search, with 536 edges between 113 variables, as opposed to 112*113 = 12,656 edges for a fully connected graph.
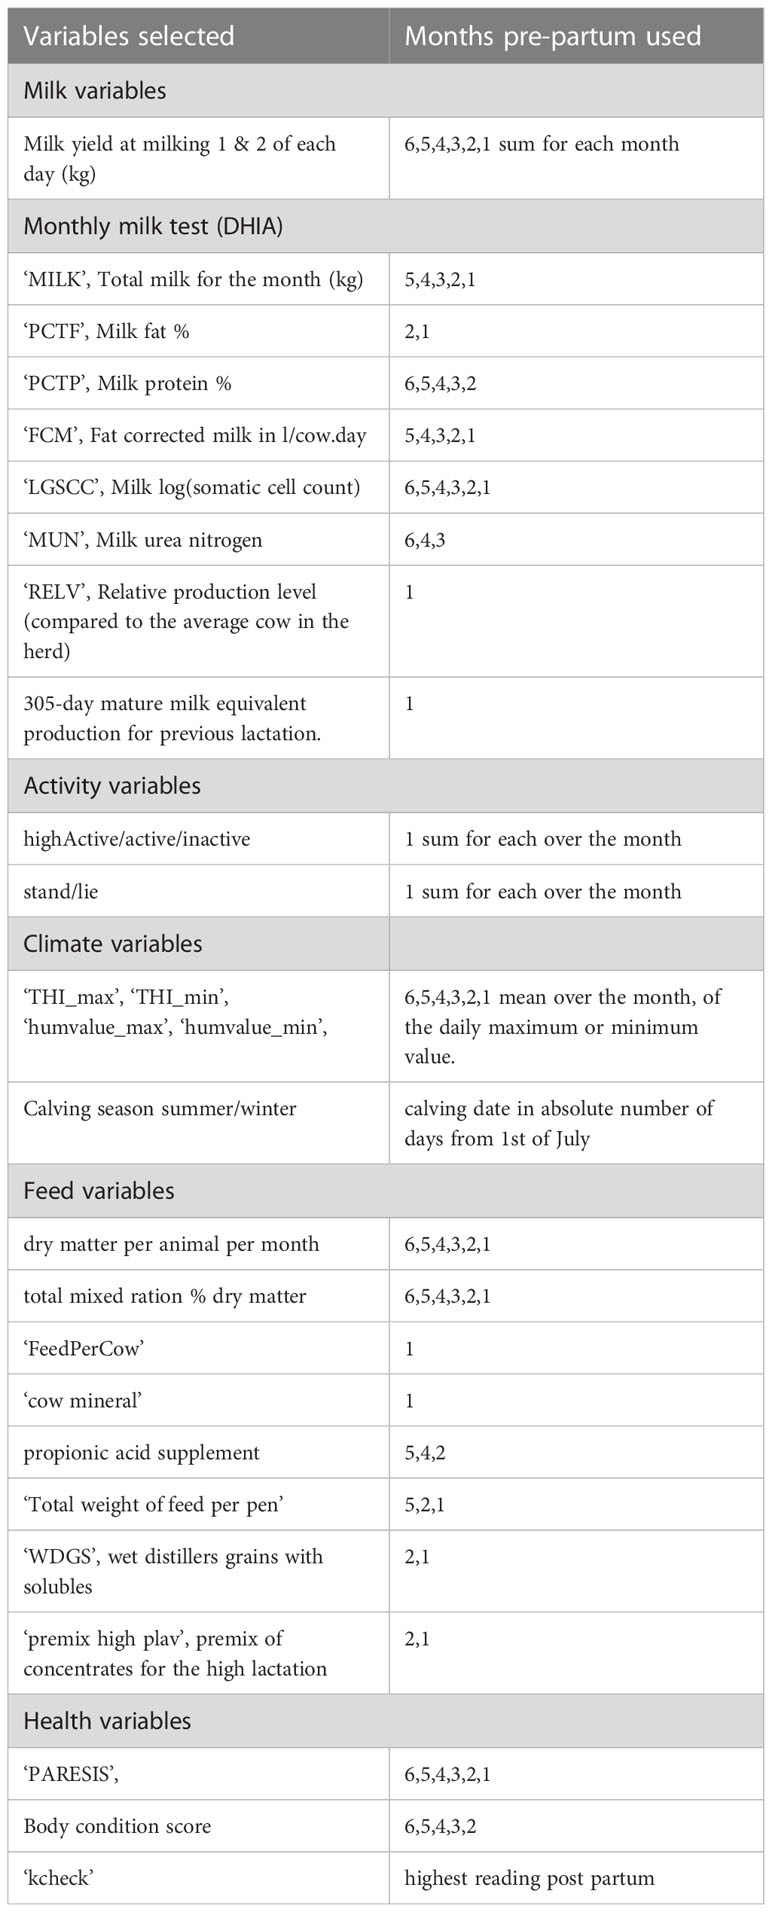
Table 1 Variables used in causal structure search and causal predictive model.
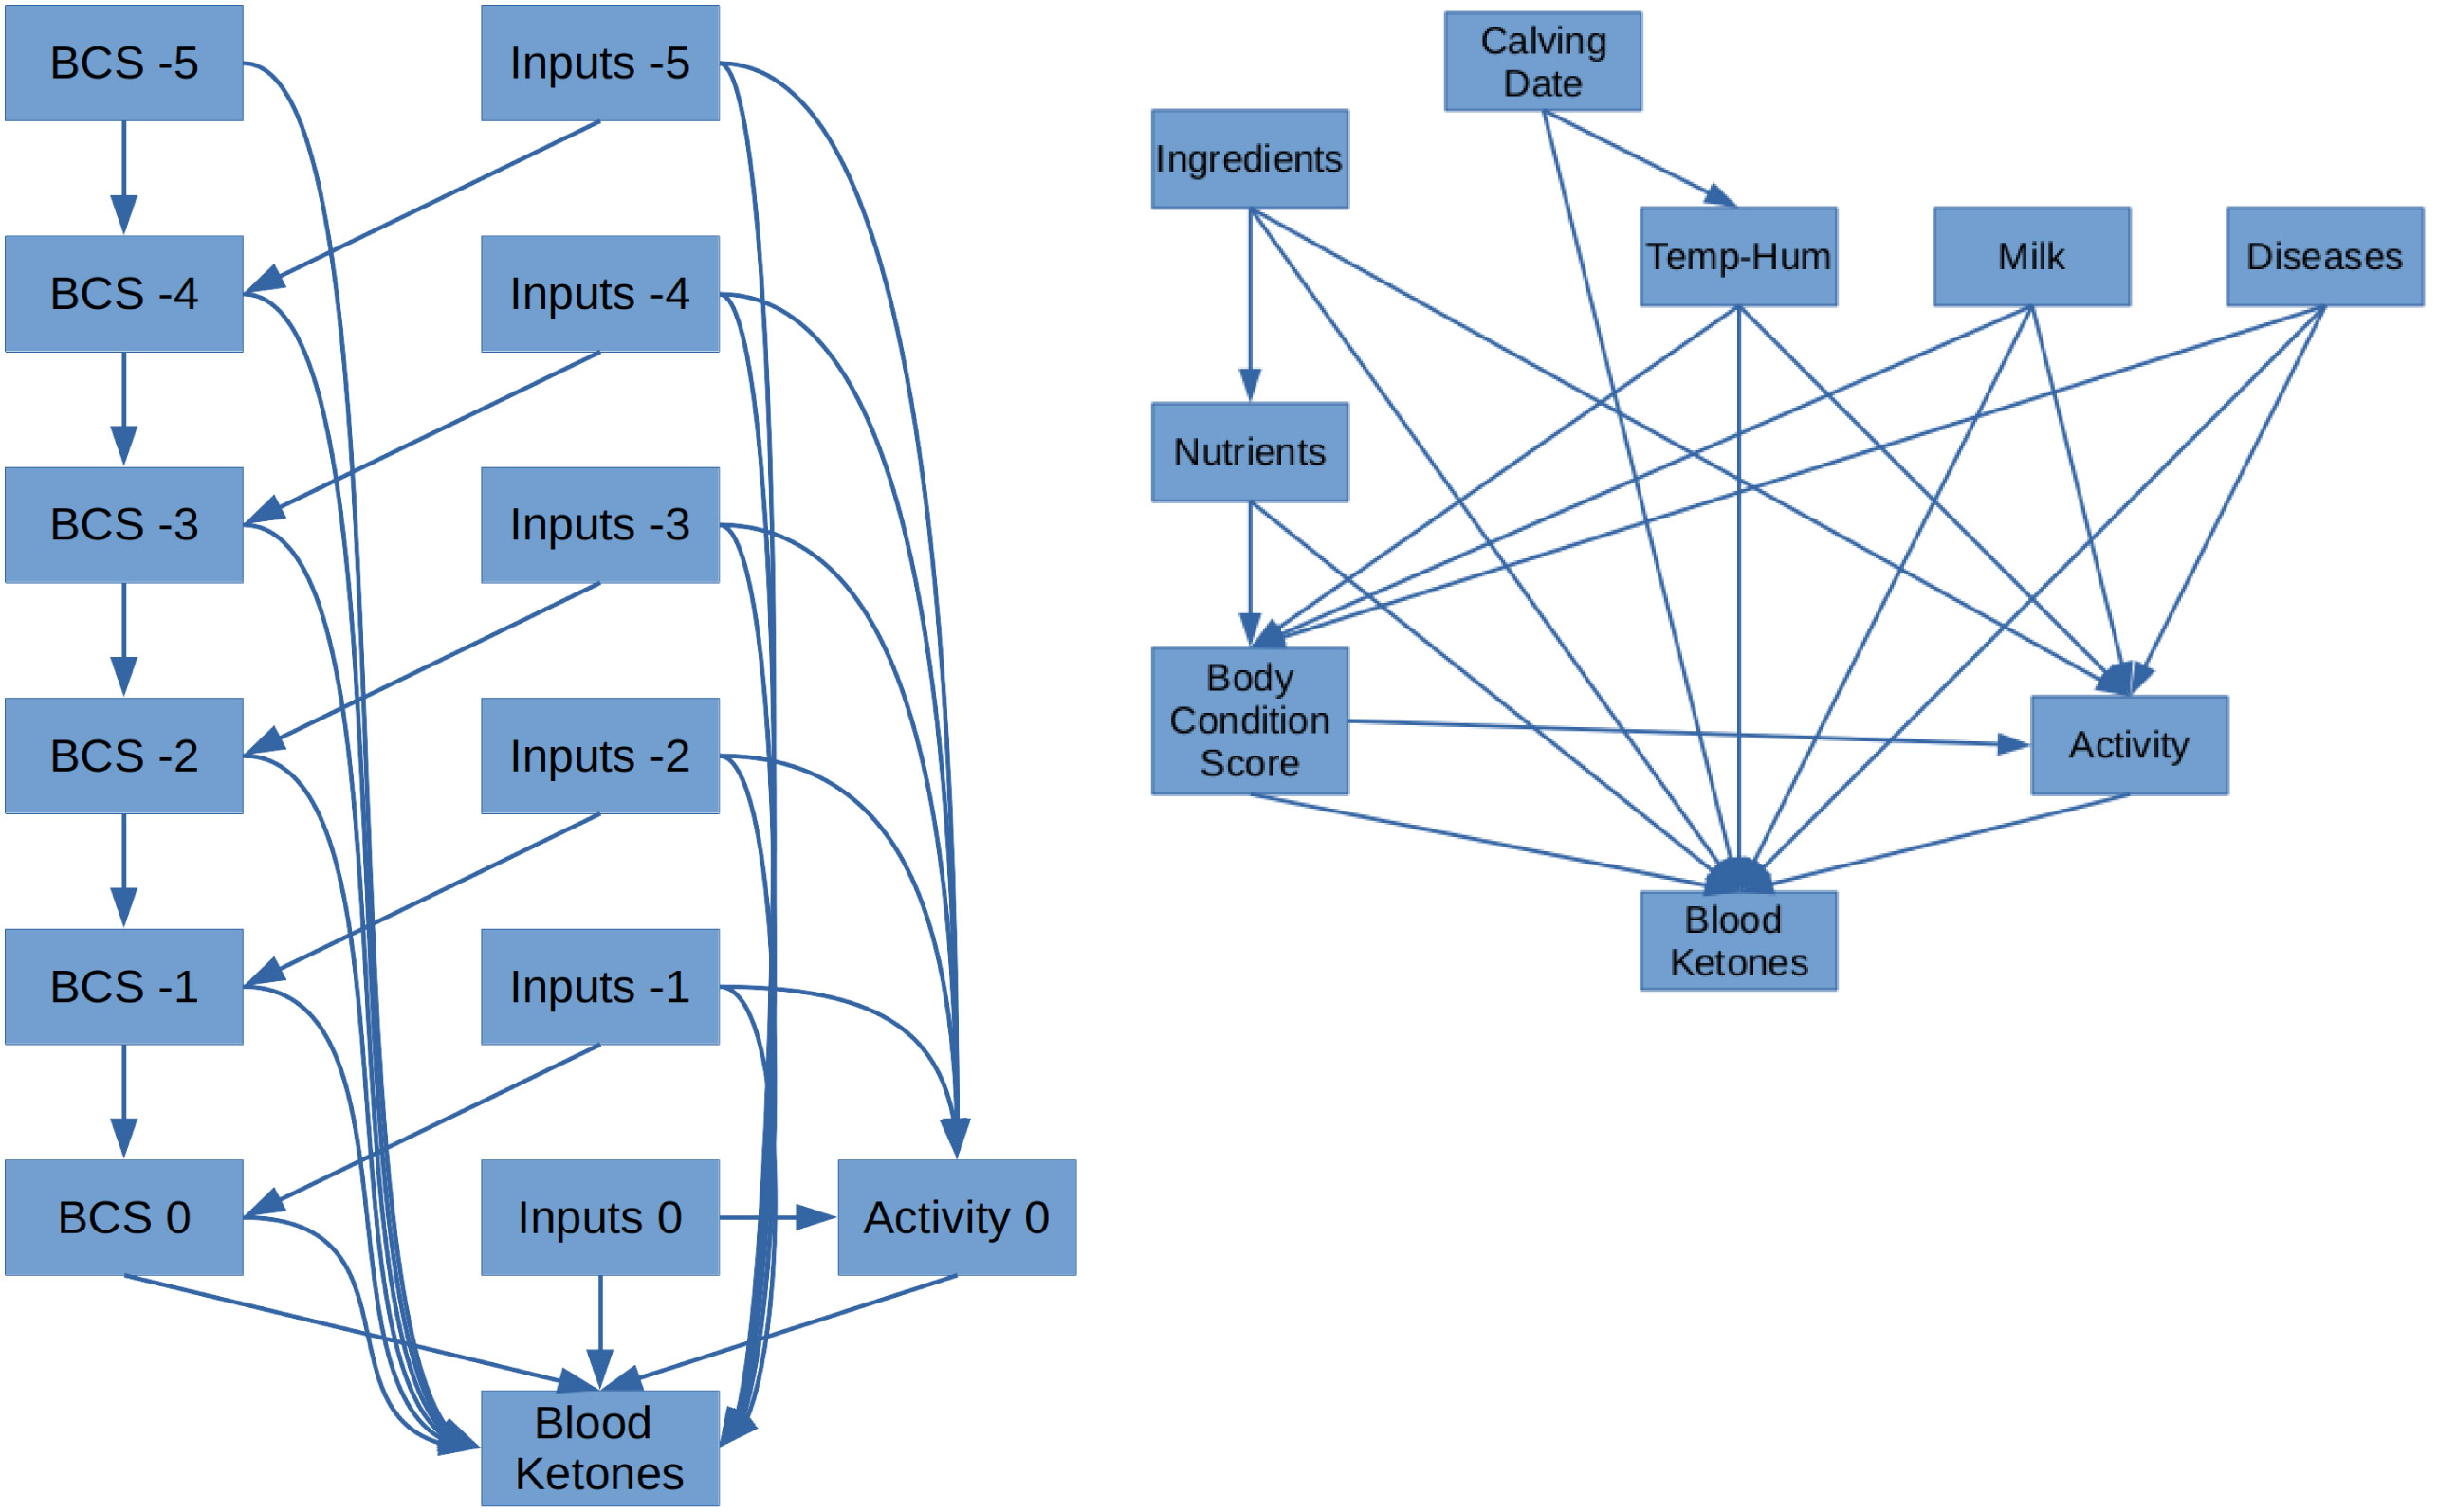
Figure 2 Summary prior knowledge graphs. These represent the initial set of causal edges from which causal structure search eliminated those not supported given the conditional independencies in the data. Right: Structure of causal relations between groups of variables. Left: Temporal order, (i) ‘Inputs’ of each month, act on ‘Body Condition Score’ of the next month, and (ii) all variables act directly on post-partum blood ketones. Cow Activity, measured by accelerometer, is only available for the month preceding partus.
2.4.2 Prediction of the ketosis risk from observational data
Linear regression models were fitted to the causal graphs produced by the PC algorithm. A logistic regression was then fitted on the training data, to the normalized predicted blood ketones vs cases with measured blood ketones over the subclinical ketosis threshold (1.2mmol/l). The linear models were then used to predict the expected blood ketones of each cow in the test data (implicitly the mean of the probability distribution of blood ketones for each cow). The logistic regression curves were then used to convert the expected blood ketones to predicted risk of ketosis for each cow (Figure 2). The cows were then grouped by quartiles of expected blood ketones, and the expected number of ketosis cases per quartile was computed and compared to the observed number of cases, (Table 2).
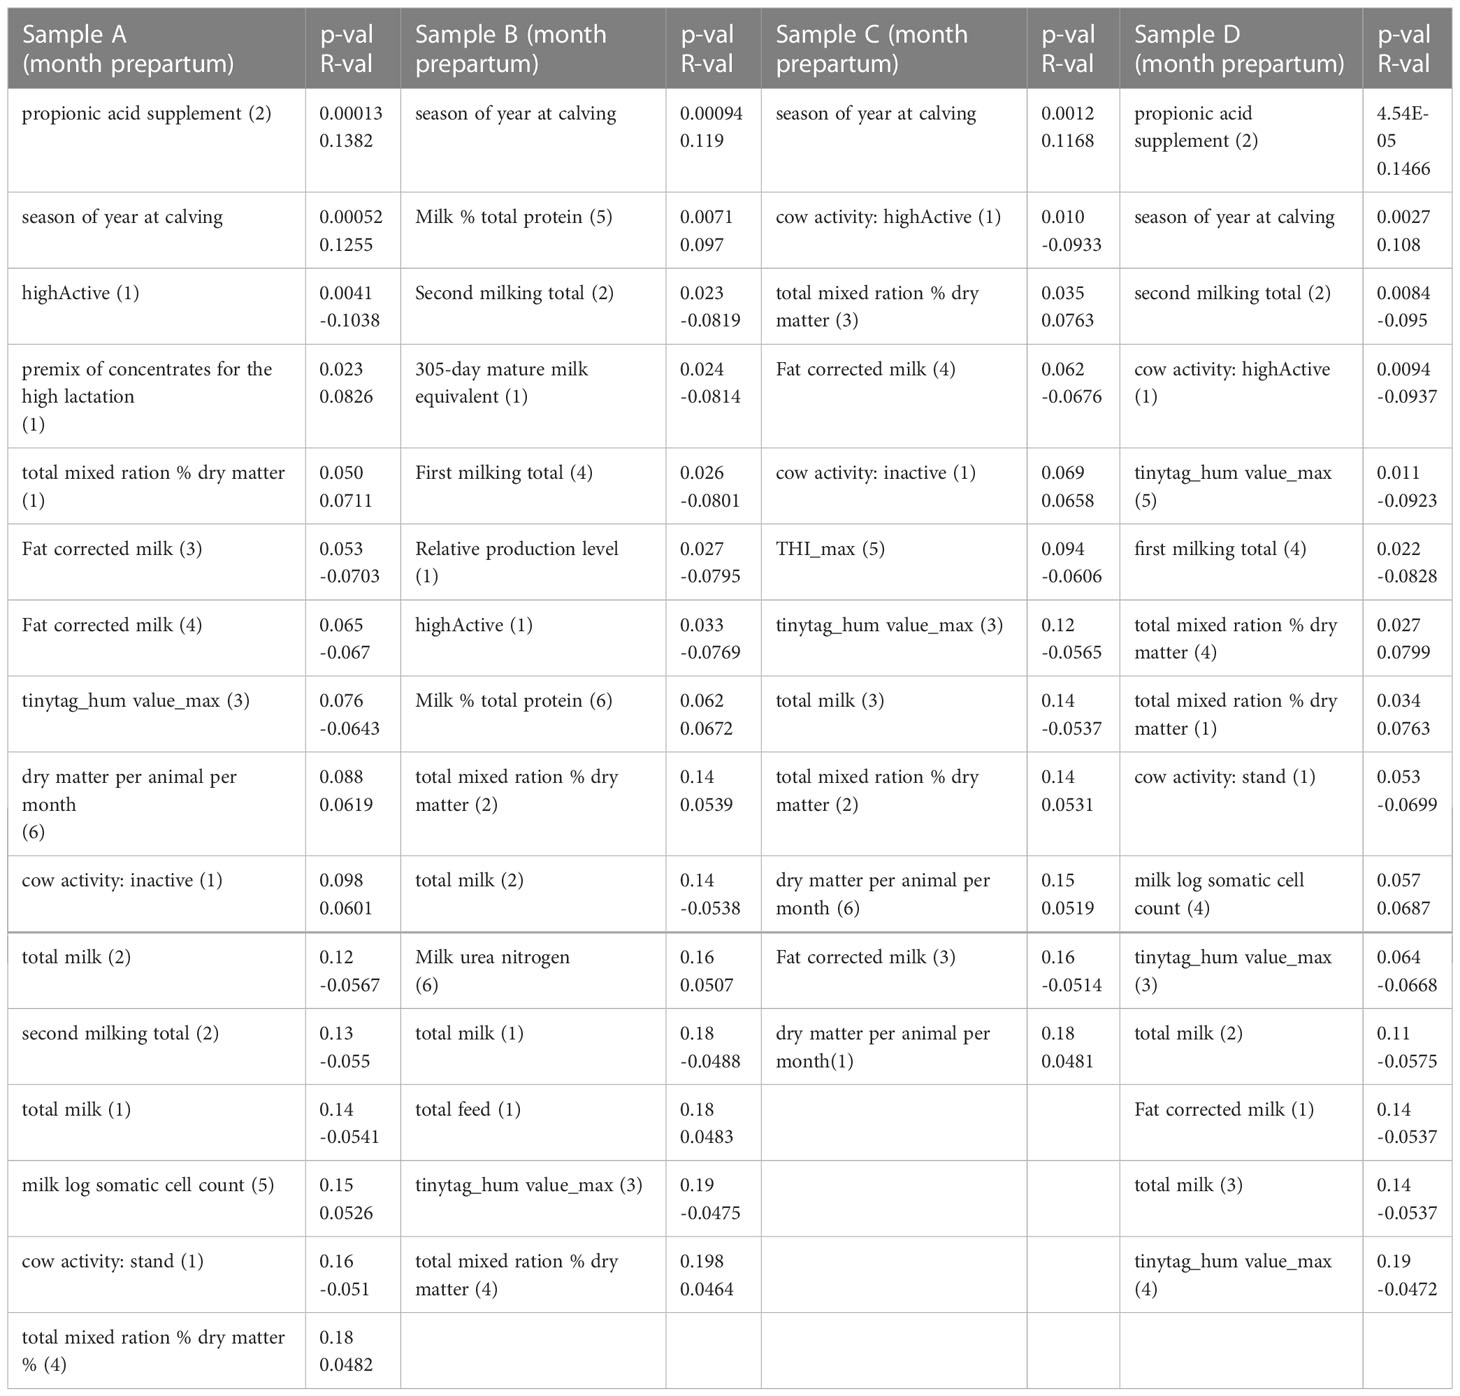
Table 2 Minimum conditional independence of links to measured blood ketones.
2.4.3 Prediction of the expected effect of interventions
The predictive model and logistic curve were then used to predict the expected reduction in incidence of ketosis for a 20% reduction in the proportion of dry matter in the TMR, relative to that fed in the archive data, over the 6 months prepartum, (Table 3). This input was chosen, because it affected links present in all four models. It is not necessarily a practical choice on a real farm.
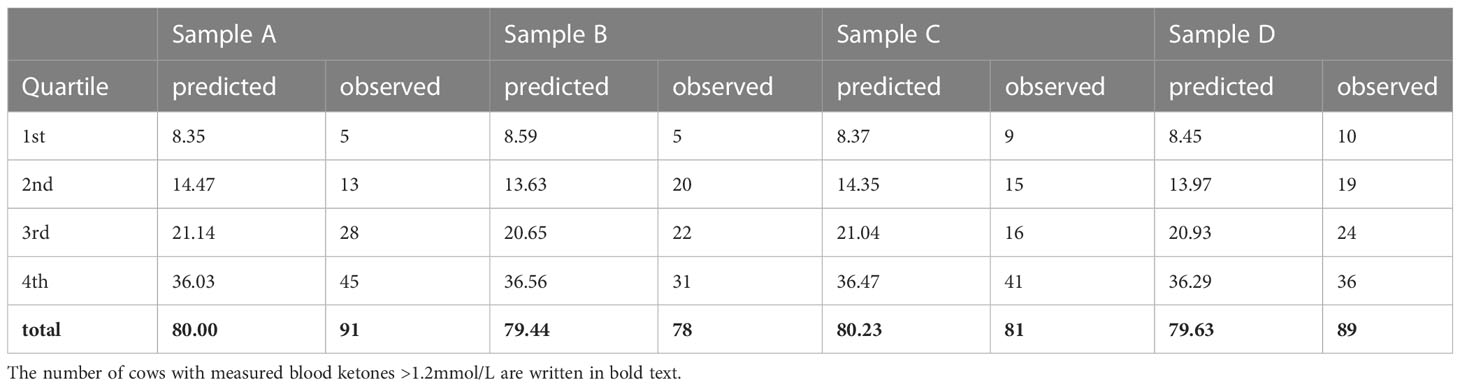
Table 3 Ketosis cases per quartile, predicted and observed.
Note, when predicting the effect of an intervention on a target variable (e.g. the rate of ketosis in the herd), it is essential to first predict the intermediate variables on the causal path(s) between the intervention and the target effect, (BCS and Activity, in our causal graph). Otherwise, if the intermediate variables are kept the same, this blocks the causal paths via those variables. This implies asking e.g. “What would the risk of ketosis be, for an animal whose Activity was directly controlled to maintain the value from the original data, despite changing the TMR ingredients?”.
3 Results
3.1 Causal graphs
PC causal structure search produced directed acyclic graphs for each sample (A,B,C,D) of training data, having 41, 50, 45, and 47 causal edges respectively, eliminating >90% of the 536 edges given in the prior knowledge. The PC algorithm retains or rejects edges in the graph (i.e. causal links between variables) on the basis of their minimum conditional independence. The retained edges acting on measured blood ketones are given in Table 2 below, with their p-values and Pearson R-values from the partial-linear-correlation conditional independence test. (See Supplementary Material for the full text of the edges of the graph.) The only causal edges which are common to all four models are from “season” (semester-6) and “highActive” (cow activity in last month prepartum) to “kcheck” (postpartum blood ketones).
3.2 Prediction of risk of ketosis
The distribution of predicted vs measured blood ketones (both normalized), over the four-way cross-validation, showed mean Pearson’s R(769) = 0.304, P-value = 2.08e-16, significant at p<0.01 (Table 3; Figure 3). The cow data was sorted into quartiles by predicted postpartum blood ketone value. The observed incidences of ketosis, by quartile of predicted value, are 3.14%, 6.25%, 6.7%, 15.1%, with a whole herd incidence of ketosis of 7.82%. The correlation of predicted to observed incidence of ketosis per-quartile, over the four-way cross-validation, showed Pearson’s R(14) = 0.936, P-value =9.48e-08, significant at p<0.01.
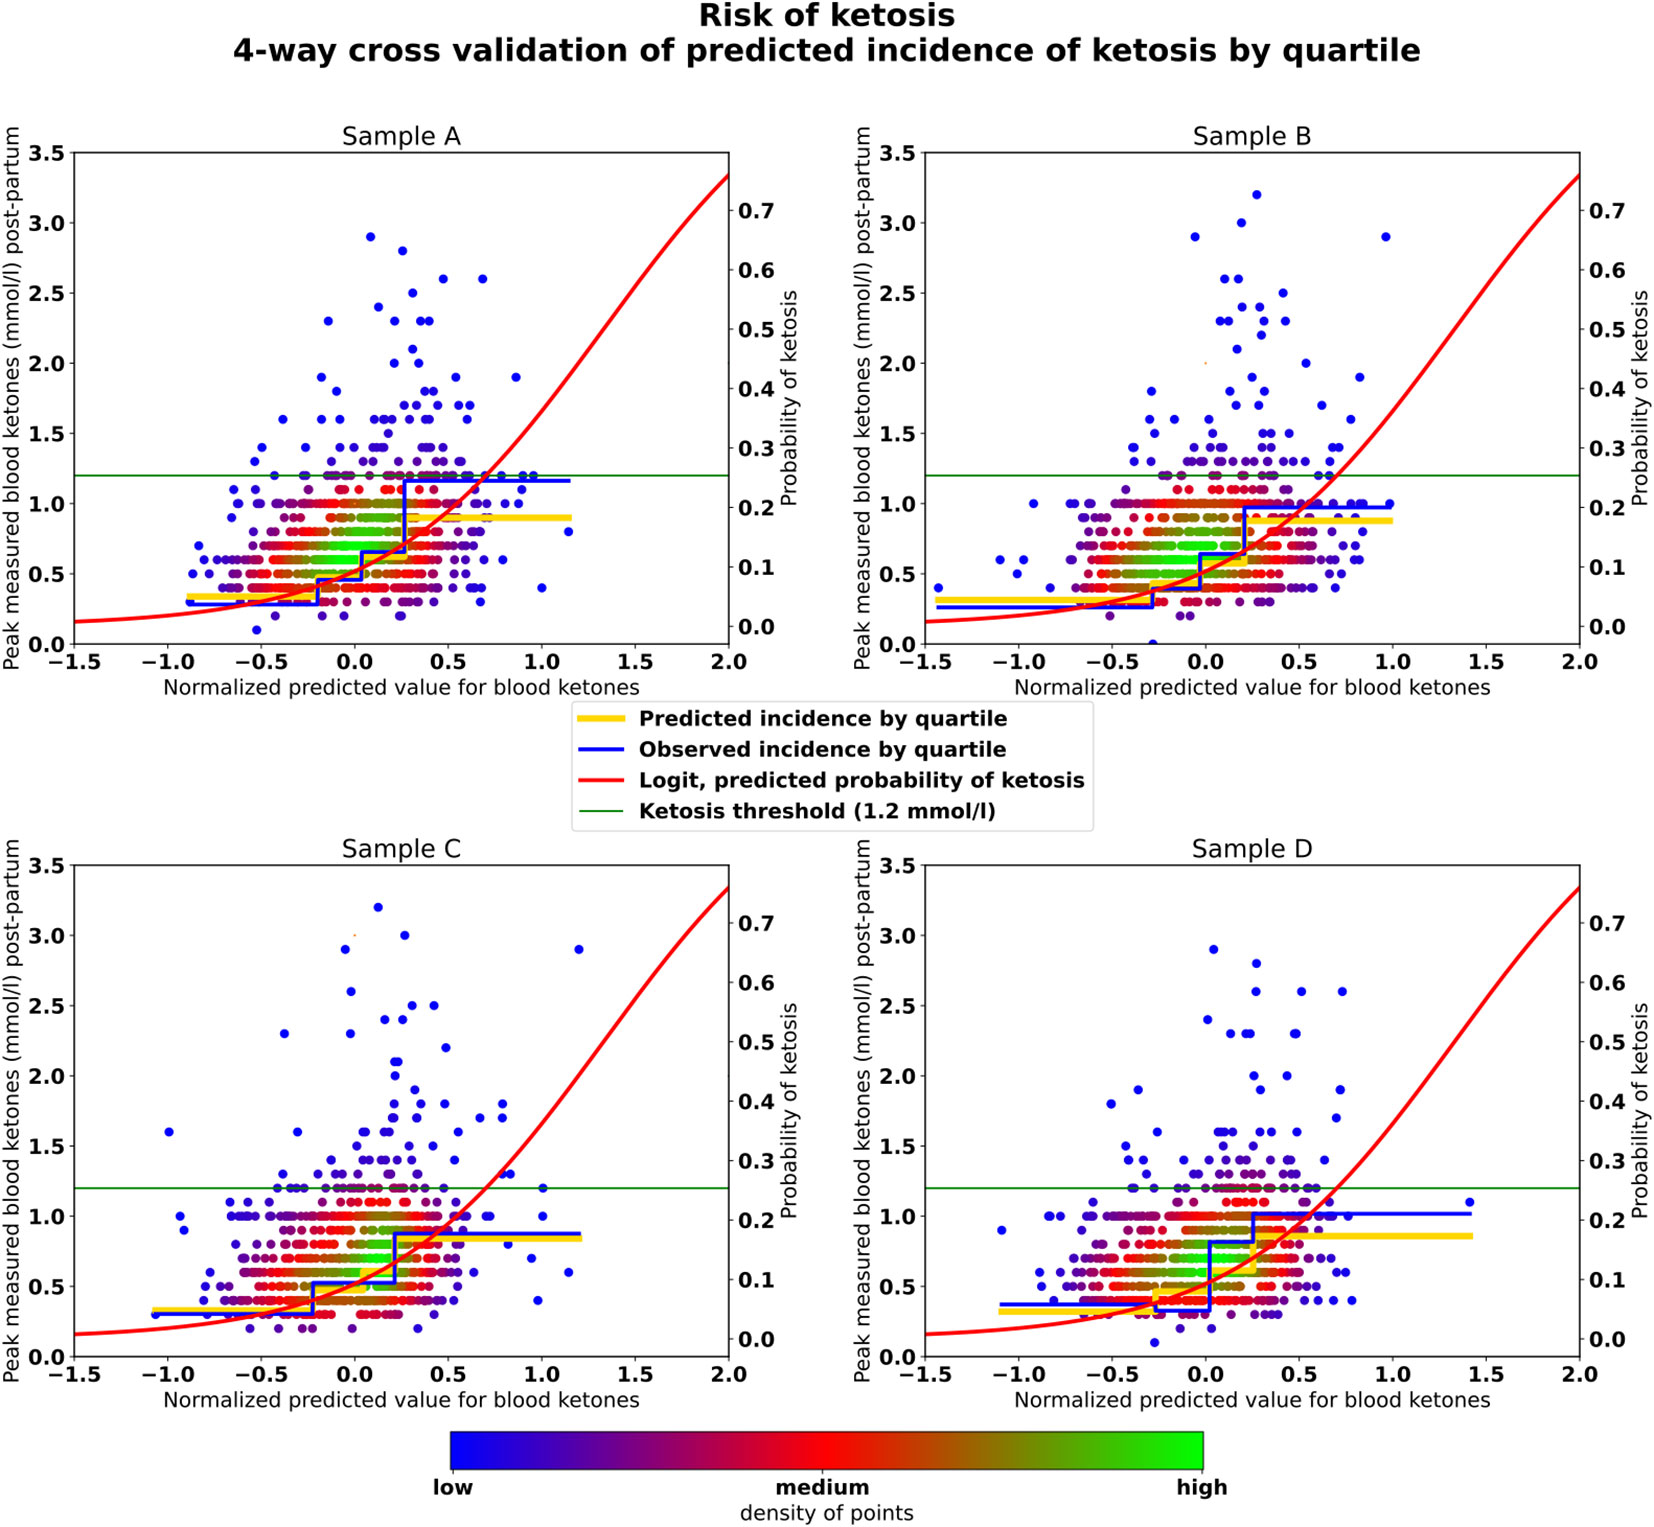
Figure 3 Results. Scatter plot of cases: (x-axis) normalized predicted pre-partum blood ketones, (y-axis) peak pre-partum ketones. (Point colour) density of cases. Curve (red) Logistic regression predicting risk of SCK, (green) ketosis threshold (>= 1.2mmol/l), (quartiles, gold) predicted mean % risk of SCK by quartile of predicted values, (quartiles, blue) observed mean % risk of SCK by quartile of predicted values.
3.3 Multi-collinearity of input variables in the dataset
Of the 96 variables in the prior knowledge graph all have moderate or high collinearity. 38 have moderate collinearity with Variance Inflation Factor (VIF) in the range 1.0 to 5.0, while the remaining 58 have high collinearity with VIF > 5.0. (See table in the Supplementary Material.)
3.4 Prediction of the expected effect of interventions
Table 4 shows the predicted effect on incidence of ketosis, for a 20% reduction in the proportion of dry matter in the TMR, relative to that fed in the archive data, over the 6 months prepartum. The predicted reductions in incidence of ketosis for the fourth quartile (highest risk group) were -4.96%, -7.4%, -11.21%, and -11.07% of animals in the herd, respectively for the four models.

Table 4 Predicted effect on incidence of ketosis, of 0.2x reduction of total mixed ration dry matter%, over 6 months pre-partum.
4 Discussion
4.1 Causal graphs
The variability of ‘which links were selected’, reflects multicollinearity (Section 3.3 and table in Supplementary Material), of the variables. This is expected, due to cows being grouped in pens and fed TMR according to their production stage. Consequently there is insufficient independence of the inputs to produce independence of their effects on blood ketones, or intermediate variables such as BCS and cow activity. This causes low confidence with regards to the existence of individual causal links (Table 2), and requires permissive settings of the parameters of the PC algorithm, to avoid wrongly excluding all the links. Additional concerns include (i) that the PC algorithm is not robust to unmeasured confounding variables (Glymour et al., 2019), (ii) it is likely that the true causal relations are non-linear, which may not be correctly detected by the linear-partial-correlation conditional independence test.
4.2 Linear regression model on the causal graph
The low confidence in the causal links is distinct from the partial gradient of the linear regression model fitted to the causal graph. The former concerns whether the link exists, the latter concerns what the effect of the link is, if it is present. In the normalized linear regression model, (see table in Supplementary Material) all except two of the coefficients of the links to blood ketones, are inside the range 0.17 to -0.15. The exception is one pair of variables (“305ME” and “RELV” in the last month prepartum) present only in the sample ‘B’ model, that appear to cancel each other out, being collinear with opposite coefficients, -2.80 and 2.73. The weakness of the regression coefficients reflects (i) the probabilistic nature of the risk of ketosis, with a minority of cows developing ketosis, for all combinations of inputs, and (ii) that ketosis is a deregulation disease with blood ketones rising exponentially in those cows that fail in ketone regulation. If non-linear effects are present as expected, then linear regression on the causal graph will fail to correctly represent them.
4.3 Prediction of ketosis risk
The difference in outcome for the quartiles of the predictive model is sufficient to be useful, e.g. indicating which animals require monitoring or preemptive intervention. It is the purpose of causal models to be able to predict which interventions would be effective. The high level of uncertainty remaining indicates that there are likely other factors not captured in this six month pre-partum data-set. It would be desirable to include the available short-term behavioral and environmental data for the days leading up to and following partus, as used in Sturm et al. (2020). Calf weight, dam weight and colostrum volume are additional factors reported in the literature (Vanholder et al., 2015). Expanding the causal graph to consider the protein, carbohydrate, roughage and propionate content of the ration, would allow inference of the composition of each ingredient, and prediction of TMR nutrients on all days, from those days where measurements are available. Including estimates of total protein and energy balance in the causal graph, would allow the deficit state to be predicted, which is understood to be the primary physiological cause of raised blood ketone concentration (Vanholder et al., 2015). This is possible with modern ration mixers that include instruments such as NIR spectrometers, which can measure these feed characteristics in real time.
4.4 Predicting optimal actions to reduce incidence of ketosis and optimize production.
The different predictions (Table 3) were due to the different causal structures estimated from the four data samples by the PC causal model search algorithm. This indicates that the true causal structure and causal functions have not been reliably identified. This might be improved by (i) choosing a causal structure search algorithm that is robust to unmeasured confounders, (ii) correctly models the nonlinearities expected in the data, (iii) including additional data on known factors such as peripartum behavior, calf weight and colostrum production. However these are likely to be of limited benefit if the collinearity of the data is not broken. This requires that there be sufficient independence in the inputs, especially feed and environment, that their individual effects on the system can be distinguished. This might be achieved by having (i) many years of data, (ii) data from many different farms, (iii) by varying the inputs for individual cows or small groups of cows. This last option is becoming a possibility given machinery for (i) individual cow feeding, such as dairy robots that include concentrate feeding after milking, (ii) small group feeding with mobile mixer wagons. These would make it possible for farm management software to automatically incorporate evaluations of feed ingredients into the routine management of precision dairy farms. Continuous evaluation and optimisation of other interventions such as cooling and ventilating to prevent heat stress, could likewise be integrated into farm automation.
4.5 Transferability of causal models to other farms
This study used data from a single farm. To create a model that is transferable to unknown farms would require data from at least several farms, including data on how the environment differed between the farms. When the data about the farm environment completely captures the variation between farms, then the effect of knowing the identity of the farm would decline to zero.
4.6 Further work
It is expected that there are unmeasured factors that may act as confounders. For these reasons it would be important to repeat the analysis with a search algorithm such as Fast Causal Inference (FCI) (Ch 6.7, Spirtes et al., 2001), that is robust to unmeasured confounders, and to select a conditional independence test that can detect simple non-linear relations such as second or third order polynomials, and multinomials allowing interaction between inputs. It is important to avoid unrestricted nonlinearity, because such testing requires exponentially more processing and data. It is also desirable to include higher frequency data (daily or hourly environment and cow activity) for the days immediately before and after parturition.
Testing of outcomes of predicted optimal management actions on archive data could be done by matched pairs. When an optimal search and modeling procedure has been found, extending the analysis to multiple farms will allow potentially commercially useful models to be developed. Once a credible model has been developed from archive data, then small scale on-farm testing could begin to prospectively verify the efficacy of the predicted optimal management actions.
5 Conclusions
Causal models fitted from observational data, can generate predictions of the expected effect of interventions. These predictions would be applicable in PLF to predict the optimal management of herds and individual cows to minimize the incidence of disease while optimizing production. Collinearity of inputs arises when all animals at the same stage of production are housed together and fed the same ration, this limits the possibility of distinguishing the effects of different inputs. The use of prior information about which causal links are plausible and which free parameters are required, is essential to restrict the causal structure search to a tractable scale, and limit the quantity of data required. The choices of (i) causal structure search algorithm, (ii) conditional independence test, and (iii) regression model, should match the expected characteristics of the problem with regards to (i) possible unmeasured confounders, (ii) nonlinear response to inputs, (iii) interactions between the inputs. Steps required to produce causal models usable in PLF would include (i) address the issues of collinearity and analysis above, such that cross-validation arrives at causal models that closely match each other, (ii) validate the models by experimentally verifying a sample of their predictions.
Data availability statement
The data analyzed in this study is subject to the following licenses/restrictions: The scripts, and both the raw data and the collated, cleaned data, are archived by VetMedUni, and accessible by request to the Clinical Unit for Herd Health Management in Ruminants and the PLF Hub. Requests to access these datasets should be directed toTWljaGFlbC5Jd2Vyc2VuQHZldG1lZHVuaS5hYy5hdCw= Priv.-Doz. Dr.med.vet. Michael Iwersen, Working Group on Precision Dairy Farming, Unit of Herd Health Management in Ruminants University Clinic for Ruminants, University of Veterinary Medicine, https://www.vetmeduni.ac.at/en/herd-health-management-in-ruminants.
Ethics statement
Animal sampling and data collection were approved by the Slovakian Regional Veterinary Food Administration and noted by the institutional ethics committee of the University of Veterinary Medicine Vienna, Austria (ETK-09/02/2016). Written informed consent was obtained from the owners for the participation of their animals in this study.
Author contributions
NH, MI, MO, and AH contributed to conception and design of the study. NH performed the statistical analysis and wrote the first draft of the manuscript. All authors contributed to the article and approved the submitted version.
Acknowledgments
This study was part of a research fellowship funded by Zoetis SA, Belgium.
Conflict of interest
Author AH was employed by company Zoetis.
The remaining authors declare that the research was conducted in the absence of any commercial or financial relationships that could be construed as a potential conflict of interest.
Publisher’s note
All claims expressed in this article are solely those of the authors and do not necessarily represent those of their affiliated organizations, or those of the publisher, the editors and the reviewers. Any product that may be evaluated in this article, or claim that may be made by its manufacturer, is not guaranteed or endorsed by the publisher.
Supplementary material
The Supplementary Material for this article can be found online at: https://www.frontiersin.org/articles/10.3389/fanim.2023.1180610/full#supplementary-material
References
Bello N. M., Ferreira V. C., Gianola D., Rosa G. J. (2018). Conceptual framework for investigating causal effects from observational data in livestock. J. Anim. Sci. 96 (1), 4045–4062. doi: 10.1093/jas/sky277
Berckmans D. (2017). General introduction to precision livestock farming. Anim. Front. 7 (1), 6–11. doi: 10.2527/af.2017.0102
Chitakasempornkul K., Meneget M. B., Rosa G. J., Lopes F. B., Jager A., Gonçalves M. A., et al. (2019). Investigating causal biological relationships between reproductive performance traits in high-performing gilts and sows. J. Anim. Sci. 97 (6), 2385–2401. doi: 10.1093/jas/skz115
Chitakasempornkul K., Rosa G. J. M., Jager A., Bello N. M. (2020). Hierarchical modeling of structural coefficients for heterogeneous networks with an application to animal production systems. J. Agricultural Biol. Environ. Stat 25 (4), 1–22. doi: 10.1007/s13253-020-00389-0
Duffield T. F., Lissemore K. D., McBride B. W., Leslie K. E. (2009). Impact of hyperketonemia in early lactation dairy cows on health and production. J. Dairy Sci. 92 (2), 571–580. doi: 10.3168/jds.2008-1507
Edmonson A. J., Lean I. J., Weaver L. D., Farver T., Webster G. (1989). A body condition scoring chart for Holstein dairy cows. J. Dairy Sci. 72 (1), 68–78. doi: 10.3168/jds.S0022-0302(89)79081-0
Glymour C., Zhang K., Spirtes P. (2019). Review of causal discovery methods based on graphical models. Front. Genet. 10. doi: 10.3389/fgene.2019.00524
Hockings N. C., Iwersen M., Hancock A., Oczak M. (2022). “Physically grounded causal modeling for PLF,” in Proceedings of the 10th European Conference of Precision Livestock Farming, EC-PLF 2022, Vienna, Austria. 457–466.
Iwersen M., Klein-Jöbstl D., Pichler M., Roland L., Fidlschuster B., Schwendenwein I., et al. (2013). Comparison of 2 electronic cowside tests to detect subclinical ketosis in dairy cows and the influence of the temperature and type of blood sample on the test results. J. Dairy Sci. 96 (12), 7719–7730. doi: 10.3168/jds.2013-7121
Kakimoto S., Mieno T., Tanaka T. S., Bullock D. S. (2022). Causal forest approach for site-specific input management via on-farm precision experimentation. Comput. Electron. Agric. 199, 107164. doi: 10.1016/j.compag.2022.107164
Kendall P. E., Webster J. R. (2009). Season and physiological status affects the circadian body temperature rhythm of dairy cows. Livestock Sci. 125 (2-3), 155–160. doi: 10.1016/j.livsci.2009.04.004
Lei M. A. C., Simões J. (2021). Invited review: ketosis diagnosis and monitoring in high-producing dairy cows. Dairy 2 (2), 303–325. doi: 10.3390/dairy2020025
Norton T., Chen C., Larsen M. L. V., Berckmans D. (2019). Precision livestock farming: building ‘digital representations’ to bring the animals closer to the farmer. Animal 13 (12), 3009–3017. doi: 10.1017/S175173111900199X
Pearl J. (2009). Causality: models, reasoning and inference. 2nd ed (Cambridge: Cambridge University Press). doi: 10.1017/CBO9780511803161
Pegolo S., Yu H., Morota G., Bisutti V., Rosa G. J., Bittante G., et al. (2021). Structural equation modeling for unraveling the multivariate genomic architecture of milk proteins in dairy cattle. J. Dairy Sci. 104 (5), 5705–5718. doi: 10.3168/jds.2020-18321
Peters J., Janzing D., Schölkopf B. (2017). Elements of causal inference: foundations and learning algorithms (Cambridge, Massachusetts, USA: The MIT Press), 288. Available at: https://mitp-content-server.mit.edu/books/content/sectbyfn?collid=books_pres_0&id=11283&fn=11283.pdf.
Polson D., Alonso C. (2022). “Assessment of the economic value of early intervention triggered by an audio-based technology (SoundTalks) following experimental seeder pig dual-challenge in a large research barn,” in Proceedings of the 10th European Conference of Precision Livestock Farming, EC-PLF 2022, Vienna, Austria. 537–555.
Rosa G. J. M., Valente B. D. (2013). Breeding and genetics symposium: inferring causal effects from observational data in livestock. J. Anim. Sci. 91 (2), 553–564. doi: 10.2527/jas.2012-5840
Runge J. (2018). Causal network reconstruction from time series: from theoretical assumptions to practical estimation. Chaos: Interdiscip. J. Nonlinear Sci. 28 (7), 075310. doi: 10.1063/1.5025050
Runge J. (2022). Available at: https://github.com/jakobrunge/tigramite.
Runge J., Nowack P., Kretschmer M., Flaxman S., Sejdinovic D. (2019). Detecting and quantifying causal associations in large nonlinear time series datasets. Sci. Adv. 5 (11), eaau4996. doi: 10.1126/sciadv.aau4996
Schodl K., Fuerst-Waltl B., Schwarzenbacher H., Steininger F., Suntinger M., Egger-Danner C. (2022). “Association of activity and time spent ruminating with subclinical and clinical ketosis in early lactation dairy cows,” in Proceedings of the 10th European Conference of Precision Livestock Farming, EC-PLF 2022, Vienna, Austria, Vol. pp. 357–364).
Slob N., Catal C., Kassahun A. (2021). Application of machine learning to improve dairy farm management: a systematic literature review. Prev. Vet. Med. 187, 105237. doi: 10.1016/j.prevetmed.2020.105237
Spirtes P., Glymour C. N., Scheines R., Heckerman D. (2001). Causation, prediction, and search (Cambridge, Massachusetts, USA: MIT press). Available at: https://mitpress.mit.edu/9780262527927/causation-prediction-and-search/.
Sturm V., Efrosinin D., Oehlschuster M., Gusterer E., Drillich M., Iwersen M. (2020). Combination of sensor data and health monitoring for early detection of subclinical ketosis in dairy cows. Sensors 20 (5), 1484. doi: 10.3390/s20051484
Süss D., Iwersen M., Schweinzer V., Gusterer E., Kanz P., Krieger S., et al. (2019). Supplementing rumen-protected methionine to lactating multiparous dairy cows did not improve reproductive performance. Reprod. Domest. Anim. 54 (9), 1265–1273. doi: 10.1111/rda.13509
Suthar V. S., Canelas-Raposo J., Deniz A., Heuwieser W. (2013). Prevalence of subclinical ketosis and relationships with postpartum diseases in European dairy cows. J. Dairy Sci. 96 (5), 2925–2938. doi: 10.3168/jds.2012-6035
Vanholder T., Papen J., Bemers R., Vertenten G., Berge A. C. B. (2015). Risk factors for subclinical and clinical ketosis and association with production parameters in dairy cows in the Netherlands. J. Dairy Sci. 98 (2), 880–888. doi: 10.3168/jds.2014-8362
Keywords: causal model search, precision dairy farming, ketosis, intervention, causal inference
Citation: Hockings N, Iwersen M, Hancock A and Oczak M (2023) Causal structure search and modeling of precision dairy farm data for automated prediction of ketosis risk, and the effect of potential interventions. Front. Anim. Sci. 4:1180610. doi: 10.3389/fanim.2023.1180610
Received: 06 March 2023; Accepted: 14 April 2023;
Published: 12 May 2023.
Edited by:
Arzu Peker, Ankara University, TürkiyeCopyright © 2023 Hockings, Iwersen, Hancock and Oczak. This is an open-access article distributed under the terms of the Creative Commons Attribution License (CC BY). The use, distribution or reproduction in other forums is permitted, provided the original author(s) and the copyright owner(s) are credited and that the original publication in this journal is cited, in accordance with accepted academic practice. No use, distribution or reproduction is permitted which does not comply with these terms.
*Correspondence: Nick Hockings, TmljaG9sYXMuSG9ja2luZ3NAdmV0bWVkdW5pLmFjLmF0