Abstract
In the Peruvian tropics, crossbreeding occurs between Bos taurus cattle, such as Brown Swiss (BS), Holstein (H), and Jersey (J), and Bos indicus cattle, such as Brahman (B) and Gyr (G). However, these cattle are exposed to high temperature humidity indices (THI). The aim was to evaluate variations in milk components, blood parameters of cows, and weight gain of calves in pasture-based production systems with mixed approaches along an altitudinal gradient. Six cows and six calves were evaluated at altitudes of 170, 503, 661, and 1110 m. Cattle experience higher heat stress in monoculture pasture areas; however, silvopastoral areas and altitudinal gradients mitigate this stress. The fat content in the milk of BSxJ cows showed significant differences (CI: 95%), with lower values; glucose and hemoglobin in their blood exhibited strong positive and negative correlations (p<0.05) with THI. At 661 m, the milk from GxH cows had higher values of fat, solids, density, protein, and salts, which were associated with better chemical properties of the pastures. Blood electrolytes Cl- and Na+ tended to be higher in BSxG cows, while Na+ levels were lower in GxH cows. However, red blood cells and hemoglobin were higher in GxH cows and lower in cows crossed with BS. In calves, the highest weight gains at lower altitudes were observed in BSxB crosses, while at higher altitudes, GxH crosses showed the greatest gains, likely associated with better production management.
1 Introduction
The production of cattle (B. taurus and B. indicus) in the Peruvian Amazon has experienced significant expansion, increasing from 5 million to more than 70 million head since the 1960s (Veiga et al., 2002). Initially, Criollo cattle were introduced during the Spanish conquest (Encina Ruiz et al., 2021). Later, breeds such as H and BS were incorporated, but they faced adaptation challenges due to heat stress in the tropical climate, resulting in low reproductive performance (García et al., 1990). Despite these challenges, cattle farming in the Peruvian Amazon has become a significant economic activity for small and medium-sized farmers (Loker, 1993; Murga et al., 2018).
Heat stress affects the welfare of cattle. Calves are born with lower birth weight, compromised immune function, and reduced growth rates (Tao et al., 2019; Dahl et al., 2016; Collier et al., 1982). In adulthood, fertility and milk production are affected (Monteiro et al., 2016). During lactation, heat stress not only reduces milk production and composition but also affects blood biochemical parameters. It has been shown to impact protein content and casein concentration in milk (Guo et al., 2018; Cowley et al., 2015), as well as blood metabolites, including amino acids, glucose, and lipids (Saeed et al., 2021; Yue et al., 2020). These negative effects cause reduced dry matter intake, metabolic disruptions, and reproductive impairment (Wang et al., 2020). Mitigation strategies include genetic improvements, environmental adjustments, and nutritional management (Wang et al., 2020; Baccouri et al., 2023).
Currently, cattle farmers in the Peruvian Amazon raise genetically improved cattle by crossing breeds such as BS, B, G, H, J, and F as they offer advantages over purebred animals. These crosses have demonstrated higher meat and milk yields and faster adaptation to various climatic zones (Galukande et al., 2013). In particular, HxG and HxB crosses offer better productivity and economic returns than pure H breeds (Vargas-Leitón et al., 2024), while HxBS crosses show greater reproductive efficiency and adaptability to heat stress (El-Tarabany et al., 2016).
The Peruvian Amazon lies along an altitudinal gradient ranging from 80 to 1,800 m above sea level. Along this gradient, farming systems vary in their climatic conditions, which influence tree and pasture biodiversity and, consequently, decisions regarding cattle breed selection based on altitude adaptation. Studies show that pasture biomass and yield follow a unimodal pattern along the altitudinal gradient, with optimal conditions at mid-altitudes (Yuan Jiang et al., 2004; Wang et al., 2012). Furthermore, the yield, quality, structure, and biodiversity of pastures vary along the altitudinal gradient, affecting cattle nutrition (Yuan Jiang et al., 2004; Samfira et al., 2010). Rumen bacteria are influenced by the altitudinal gradient, with significant differences between cattle from high and low altitudes (Wu et al., 2020; Yang et al., 2023). Similarly, the altitudinal gradient affects cattle’s physiological responses, including respiratory and pulse rates (Hermawansyah et al., 2021).
Livestock farms in the Peruvian Amazon follow a mixed approach, with areas under monoculture pasture and areas under silvopasture. Monoculture pasture areas lead to soil degradation, reduced crop yields, and increased phytosanitary problems (Belete and Yadete, 2023). Therefore, they should transition towards exclusively silvopastoral systems for greater sustainability. Silvopastoral systems promote biodiversity and soil conservation while providing shade, thereby reducing heat stress in livestock (Cubbage et al., 2012; Peri et al., 2016), as trees offer a more comfortable thermal environment by regulating microclimatic conditions (Da Silva Morenz et al., 2024; Goncherenko et al., 2024). In addition, they improve forage yield, nutritional quality, and animal productivity (Manriquez-Mendoza et al., 2011). These systems are promising for mitigating climate change and offer sustainable alternatives to conventional livestock farming (Montagnini et al., 2013; Peri et al., 2016).
It is essential to understand animal responses to heat stress on farms with a mixed approach, in order to manage the sustainability of livestock farms, taking into account factors such as genetics and animal welfare in relation to the altitudinal gradient in the Peruvian Amazon. This study hypothesizes that calf growth, milk components, and blood parameters of cows vary depending on cattle breed crosses, the chemical composition of pastures, and the THI along the altitudinal gradient. The objective was to evaluate variations in milk components, blood parameters of crossbred cows, and calf weight gain in mixed silvopastoral systems along the altitudinal gradient of the Peruvian Amazon.
2 Materials and methods
2.1 Location of the study area
The study was conducted from March 2023 to February 2024 in the Peruvian Amazon, across an altitudinal gradient ranging from 100 to 1,200 m. Within this gradient, 24 cattle farms were located across four districts. In the Loreto region, the district of Yurimaguas at 170 m, and in the San Martin region, the districts of Cuñumbuqui at 503 m, Zapatero at 661 m, and Calzada at 1,110 m. In each district, six cattle farms were geolocated using a Garmin 65S GPS (Figure 1).
Figure 1
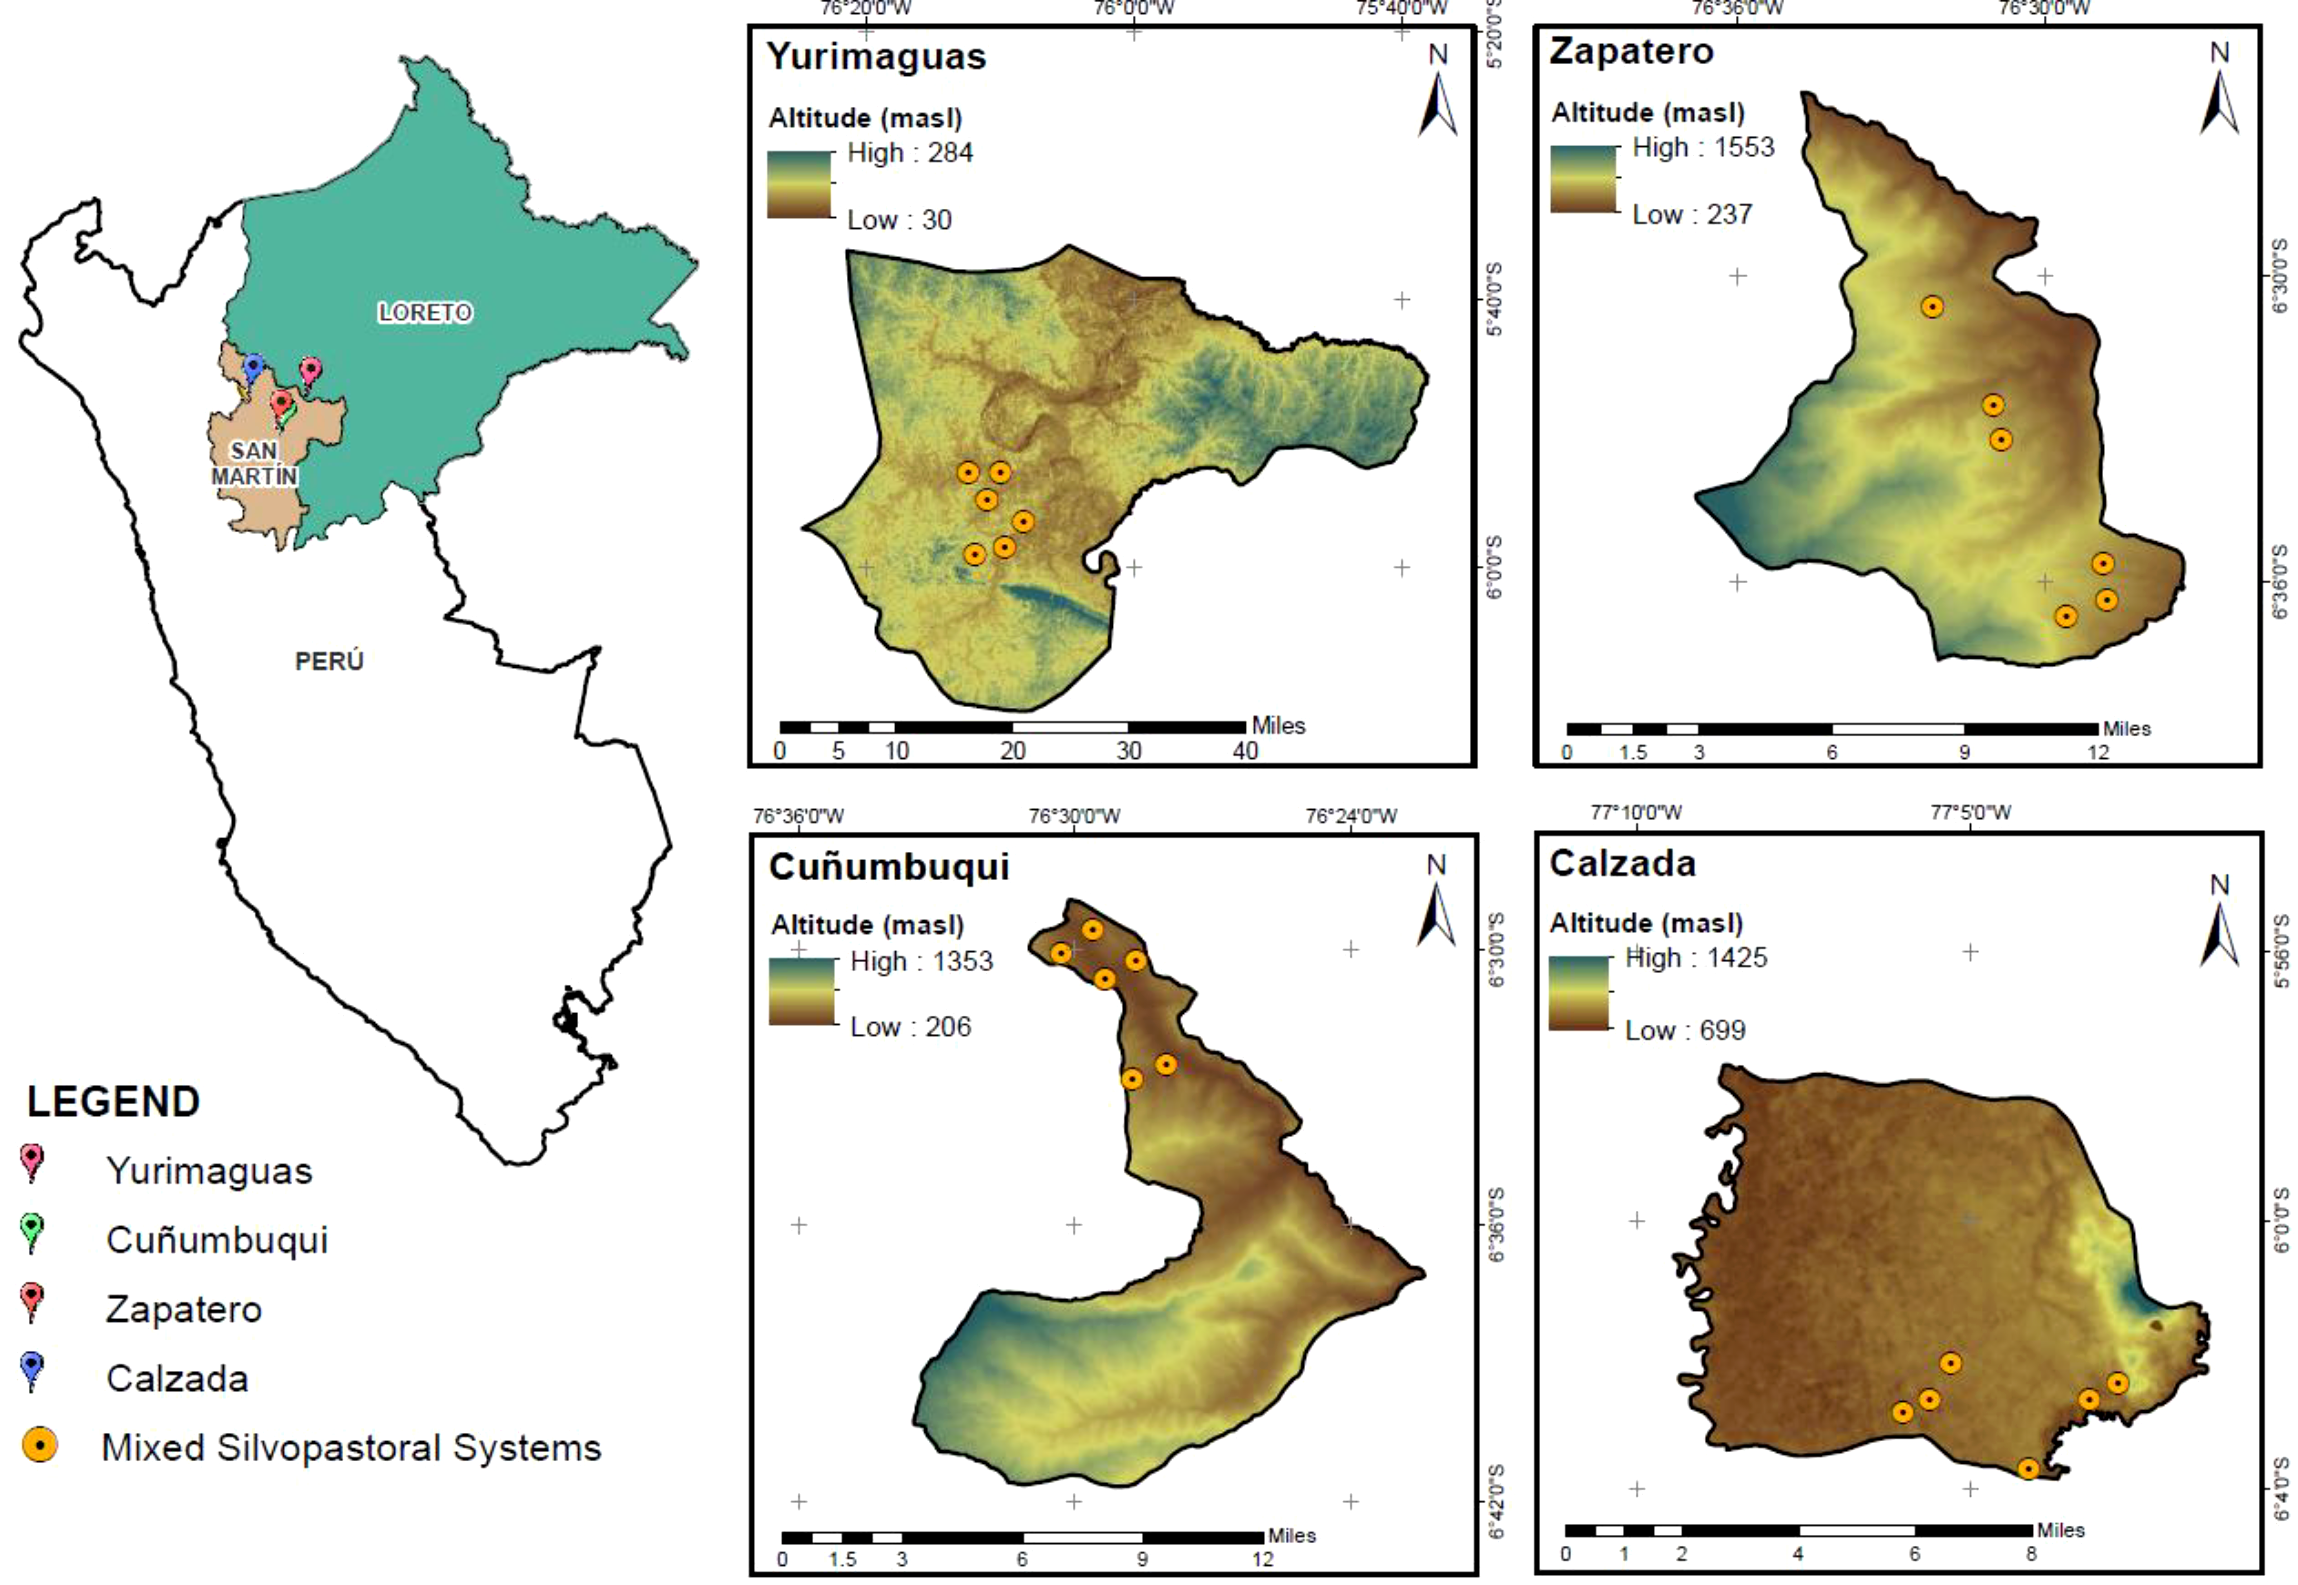
Map showing the location of experimental farms in the districts of Yurimaguas (170 m), Cuñumbuqui (503 m), Zapatero (661 m), and Calzada (1,110 m) in the Loreto and San Martin regions.
The climatic characteristics of the altitudinal gradient vary significantly between lower and higher altitudes. In Yurimaguas, between 1990 and 2019, the average monthly temperature in July drops to 25.5°C, while in September and October, it reaches 27°C. As for monthly precipitation, it decreases to 100 mm in August, while in May it reaches 280 mm (Murga-Orrillo et al., 2024). In contrast, in Calzada, the average monthly temperature in July decreases to 22°C, while in October, it reaches 23.5°C. Additionally, monthly precipitation in August is 70 mm, rising to 180 mm in February (SENAMHI-Servicio Nacional de Meteorología e Hidrología del Perú, 2024).
2.2 Temperature-humidity index
For the THI estimations between monoculture and silvopastoral areas of the farms, temperature and humidity data from 8 portable stations (HUNAN Rika, RK900-05, China) were used, with two stations located in each district (Table 1).
Table 1
| District | Φ (°) | λ (°) | φ (masl) | Condition |
|---|---|---|---|---|
| Yurimaguas | 5.905814 | 76.178019 | 170 | Silvopastoral |
| 5.974249 | 76.172438 | 157 | Monoculture | |
| Cuñumbuqui | 6.524987 | 76.515568 | 571 | Silvopastoral |
| 6.514662 | 76514662 | 572 | Monoculture | |
| Zapatero | 6.602583 | 76.487449 | 652 | Silvopastoral |
| 6.509388 | 76.538333 | 648 | Monoculture | |
| Calzada | 6.04472 | 77.053862 | 1112 | Silvopastoral |
| 6.041470 | 77.048273 | 1009 | Monoculture |
Latitude (Φ), longitude (λ), and altitude (φ) of the portable station locations.
For determining the THI for the 24 farms, daily temperature was estimated following Equation 1 proposed by Murga-Orrillo et al. (2023), using latitude (Φ), and altitude (φ) (Table 2). Additionally, the astronomical day length Equation 2, sunset angle Equation 3, and solar declination angle Equation 4 were used, based on the Julian days of the evaluation period. Relative humidity data were obtained from SENAMHI meteorological stations with influence in the study area: for Yurimaguas, from the San Ramon Agricultural Experimental Station (5.93°S, 76.1°W, at 184 m); for Cuñumbuqui and Zapatero, from the Tarapoto Station (6.47°S, 76.36°W, at 356 m); and for Calzada, from the Soritor Station (5.1°S, 77.1°W, at 870 m).
Table 2
| District | Φ | λ | φ | Cow | Milk | Calf | Herd | Ranch | Paddocks | ||
|---|---|---|---|---|---|---|---|---|---|---|---|
| ° | masl | Breed | Age | Calving | L/day | Sex-Breed | und | ha | |||
| Yurimaguas (170 m) |
5.94 | 76.14 | 155 | BSxH | 8 | 6 | 7 | M1-BSxGxH | 42 | 27 | 12 |
| 5.91 | 76.18 | 170 | BSxG1 | 9 | 7 | 0* | M2-BSxBxG | 47 | 25 | 7 | |
| 5.98 | 76.19 | 178 | BSxG2 | 7 | 3 | 5 | F1-BSxGxH | 66 | 25 | 6 | |
| 5.97 | 76.17 | 157 | BSxG3 | 12 | 5 | 5 | F2-BSxG | 31 | 20 | 5 | |
| 5.89 | 76.2 | 192 | GxH1 | 7 | 4 | 4 | M3-BSxGxH | 76 | 87 | 8 | |
| 5.89 | 76.19 | 169 | BSxB | 8 | 6 | 3 | F3-BSxB | 19 | 16 | 5 | |
| Cuñumbuqui (503m) |
6.53 | 76.52 | 373 | GxH2 | 7 | 3 | 10 | F1-GxH | 29 | 20 | 7 |
| 6.52 | 76.52 | 571 | BSxG4 | 7 | 3 | 10 | M1-BSxG | 35 | 23 | 5 | |
| 6.54 | 76.48 | 554 | GxH3 | 5 | 2 | 10 | M2-BSxGxH | 69 | 72 | 13 | |
| 6.51 | 76.51 | 466 | GxH4 | 8 | 4 | 10 | F2-GxH | 55 | 74 | 25 | |
| 6.52 | 76.5 | 466 | BSxJ1 | 5 | 2 | 8 | M3-BSxGxJ | 23 | 29 | 14 | |
| 6.55 | 76.49 | 483 | BSxJ2 | 5 | 2 | 8 | F3-BSxBxJ | 21 | 18 | 10 | |
| Zapatero (661 m) |
6.51 | 76.54 | 648 | GxH5 | 5 | 3 | 10 | F1-GxH | 62 | 90 | 17 |
| 6.55 | 76.51 | 724 | GxH6 | 4 | 2 | 10 | M1-GxH | 91 | 80 | 13 | |
| 6.55 | 76.52 | 651 | GxH7 | 5 | 3 | 8 | M2-GxH | 33 | 40 | 9 | |
| 6.61 | 76.49 | 637 | GxH8 | 4 | 2 | 9.5 | M3-GxH | 94 | 50 | 12 | |
| 6.61 | 76.49 | 637 | GxH9 | 5 | 3 | 8 | F2-GxH | 52 | 50 | 12 | |
| 6.6 | 76.49 | 652 | GxH10 | 5 | 3 | 8 | M4-GxH | 52 | 40 | 9 | |
| Calzada (1110 m) |
6.04 | 77.05 | 1112 | BSxG5 | 5 | 2 | 8 | M1-BSxG | 6 | 6 | 10 |
| 6.04 | 77.1 | 1035 | BSxG6 | 7 | 3 | 6 | M2-BSxG | 13 | 11 | 20 | |
| 6.05 | 77.1 | 1260 | BxH1 | 7 | 3 | 6 | F1-BxGxH | 11 | 11 | 12 | |
| 6.04 | 77.05 | 1009 | GxH11 | 8 | 4 | 8 | F2-GxH | 51 | 20 | 10 | |
| 6.04 | 77.09 | 1138 | GxH12 | 8 | 4 | 8 | F3-GxH | 42 | 50 | 20 | |
| 6.08 | 77.07 | 1104 | BxH2 | 7 | 3 | 6 | F4-BxFxH | 30 | 15 | 20 | |
Latitude (Φ), longitude (λ) and altitude (φ) of 24 cattle farms.
BS, Brown Swiss; B, Brahman; G, Gyr; H, Holstein; J, Jersey y; F, Fleckvieh. F1, female 1; F2, female 2; F3, female 3; F4, female 4; and M1, male 1; M2, male 2; M3, male 3.
*loose calf.
Where: DAT= daily average temperature (°C), φ = altitude (masl), Ω= astronomical length of day (h/day), H= hourly angle of sunrise or sunset (degrees), Φ= latitude (degrees), δ= sun declination angle (degrees), jd= Julian days.
The daily THI was calculated using the equation Equation 5 proposed by the National Research Council (US) (1971). Thermal stress was then classified according to Collier et al. (2011): THI<68, no stress; 68≥THI<72, mild stress; 72≥THI<78, moderate stress; 78≥THI<82, high stress; and THI>82, very high stress.
Where: THI - Temperature-Humidity Index, T - daily temperature (°C), RH - relative humidity (%).
2.3 Systems with a mixed approach
The 24 farms were identified as systems with a mixed approach, with areas managed under silvopasture and areas of monoculture with Brachiaria spp. On each farm, a paddock was selected where tree families and pasture species were recorded. In the silvopastoral areas, tree canopy cover was moderate (30%), allowing sufficient light for pasture growth.
2.4 Sample collection and chemical analysis of B. brizantha
Ten subsamples of grasses were collected from the diagonals of the total area of the evaluated paddock. Each subsample was taken from 1 m2, which were mixed to obtain a single sample of 200 g per field, obtaining 24 samples. These samples were placed in a hot air oven (KertLab, ODHG-9070A) at 60°C for 3 days, until a constant weight was obtained, from which, by differences in fresh and dry weight, the moisture content of the sample was determined. Then the dry samples were ground, where 20 g of pulverized grass were treated in the laboratory, where the protein was determined by the Kjeldahl (1883), the fat was extracted with petroleum ether, while the crude fiber was obtained by differences in weight of the digestion of sulfuric acid and sodium hydroxide, the ash was obtained by calcination between 550 to 600°C, according to the AOAC-Association of Oficial Analytical Chemists (1990). On the other hand, nitrogen free extract (NFE) was obtained by calculating the difference between 100% and the percentage sum of moisture, protein, lipids, fiber and ash.
2.5 Animals
On each of the 24 farms, one lactating cow and her calf were selected from the herd, based on healthy appearance and most visible phenotype. A total of 48 animals were evaluated, consisting of 24 cows and their calves — 12 female and 12 male calves. Both cows and calves were crossbreeds of Brown Swiss, Brahman, Gyr, Holstein, Jersey, and Fleckvieh breeds (Table 2). Herd rotation in the paddocks generally occurred on a monthly basis. The cattle were fed exclusively on pasture, except in Yurimaguas, where concentrate feed was used as a supplement for lactating cows. Milk sampling and calf weighing were carried out every 15 days, while blood sampling from cows was conducted monthly. All sampling was performed between 5:00 and 6:00 a.m. in the barn.
2.5.1 Evaluation of calf weights
The calves evaluated were aged between 1 and 5 months at the beginning of the evaluations. Weights were recorded before milking using a bovine tape with a ring (Inalmet), following the methodology of Alvarado-Bolovich et al. (2021).
2.5.2 Milk collection and chemical analysis
Prior to sample collection, the udder and teats were washed and dried. Milking was mostly manual and once a day. The samples were 500 ml obtained in the middle of milking, which were analyzed in the Milkotester LTD Eco-45920 equipment, where fat, solids, density, freezing point, protein, lactose, salts and pH were determined, with three readings of the same sample for data generation. Milk was classified according to lactation cycle, as early, peak, post-peak, mid, late and beginning of dry period, considering what was proposed by Ternman et al. (2019).
2.5.3 Blood sample collection and biochemical analysis
The samples were 10 ml of blood collected in two vacutainer tubes from the coccygeal vein by venipuncture, where one tube contained EDTA, according to Najarnezhad Mashhadi et al. (2009). Subsequently, they were transferred to the laboratory in cold chain in 5 L coolers at 5°C. In the laboratory, chemical analysis was performed to determine glucose, cholesterol, triglycerides, protein, urea, albumin and globulin by photometry in the Biolab analyzer, AS-160, following the methodology of Clariget et al. (2021). Also, blood electrolytes Na+, Cl- and K+ were determined using electrode potentiometry according to the methodology of Clariget et al. (2021). In addition, hematological tests were performed by high-speed refrigerated microcentrifugation with the CFGR-B16.5B/CFGR-17B analyzer (Infitek Co. Ltd., Shandong, China). Blood serum was kept at -20°C for counting red blood cells, hemoglobin, platelets, using Dymind equipment, DH36 with electrical impedance method, flow cytometry, spectrometry, following the methodology of Windberger et al. (2023).
2.6 Data analysis
The data on biochemical compounds in pastures did not show homogeneity of variance or a normal distribution; therefore, a median comparison analysis (p<0.05) was conducted using the Kruskal-Wallis test. In contrast, the data on calf weights showed homogeneity of variance and a normal distribution, so a regression analysis was performed (p<0.05). Principal Component Analysis (PCA) was carried out for the milk variables, grouping them by altitude, cow breed, lactation cycle, and heat stress. For the factors that showed the greatest clustering in the PCA, a boxplot analysis was conducted. On the other hand, the blood data presented homogeneity of variance and a normal distribution, so ANOVA and a means test (p<0.05) were performed using the Scott-Knott method. Also, we searched for crosses of cows whose milk components and blood parameters showed a significant association (p<0.05) with THI, using Pearson’s correlation analysis. The correlation coefficient (r) was classified as perfect (|r|= 1), very strong (0.8 ≤ |r| < 1), strong (0.6 ≤ |r| < 0.8), moderate (0.4 ≤ |r| < 0.6), weak (0.2 ≤ |r| < 0.4) and insignificant (|r| < 0.2) (Murga-Orrillo et al., 2024). These analyses were performed using the packages readr, FactoMineR, factoextra, ggplot2, tidyverse, ggpubr, car, grid, patchwork, gridExtra, RColorBrewer, ExpDes.pt, ggpubr, ggthemes, corrplot, seriation and the Rstudio starter packages (R Core Team. 2024).
3 Results<u>3.1 Systems with a mixed approach</u>The farm areas were established with 80% in monoculture pasture and 20% in silvopastoral systems. In the monoculture areas, more than 95% consisted of the genus Brachiaria, with Brachiaria brizantha dominating at 80%, followed by Brachiaria decumbens and Brachiaria humidicola at 10% each. Across all farms, the grasses recorded included Axonopus compressus, B. brizantha, B. decumbens, B. humidicola, Brachiaria mutica, Homolepis aturensis, Paspalum virgatum, Panicum maximum, Pennisetum purpureum, Pennisetum sp., and Tripsacum laxum, as well as legumes like Centrosema macrocarpum, Pueraria phaseoloides, and other forages like Tithonia diversifolia, with little variation across the altitudinal gradient. The tree families present included 82%, with the breakdown as follows: Apocynaceae (6%), Asteraceae (14%), Fabaceae (14%), Malvaceae (10%), Melastomataceae (6%), Rubiaceae (5%), Rutaceae (3%), Sapindaceae (4%), and Simaroubaceae (20%), with the greatest number of families found at 170 m.
Livestock production in the Peruvian Amazon is constantly exposed to high THI values, particularly on sunny days, which affects cattle behavior (Figure 2). Between 5 and 6 a.m., after milking, the cows leave the barn for the monoculture pasture areas, where they graze until 11 or 12 p.m. (Figure 2A). However, due to heat stress, the cows seek microclimatic comfort under the trees in the silvopastoral areas, staying there between 12 and 4 p.m., where THI values and solar radiation are lower (Figures 2B–D). In the silvopastoral areas, cows also graze but mainly rest and ruminate. Then, between 5 and 6 p.m., they return to the barn, repeating this cycle every day (Figure 2).
Figure 2
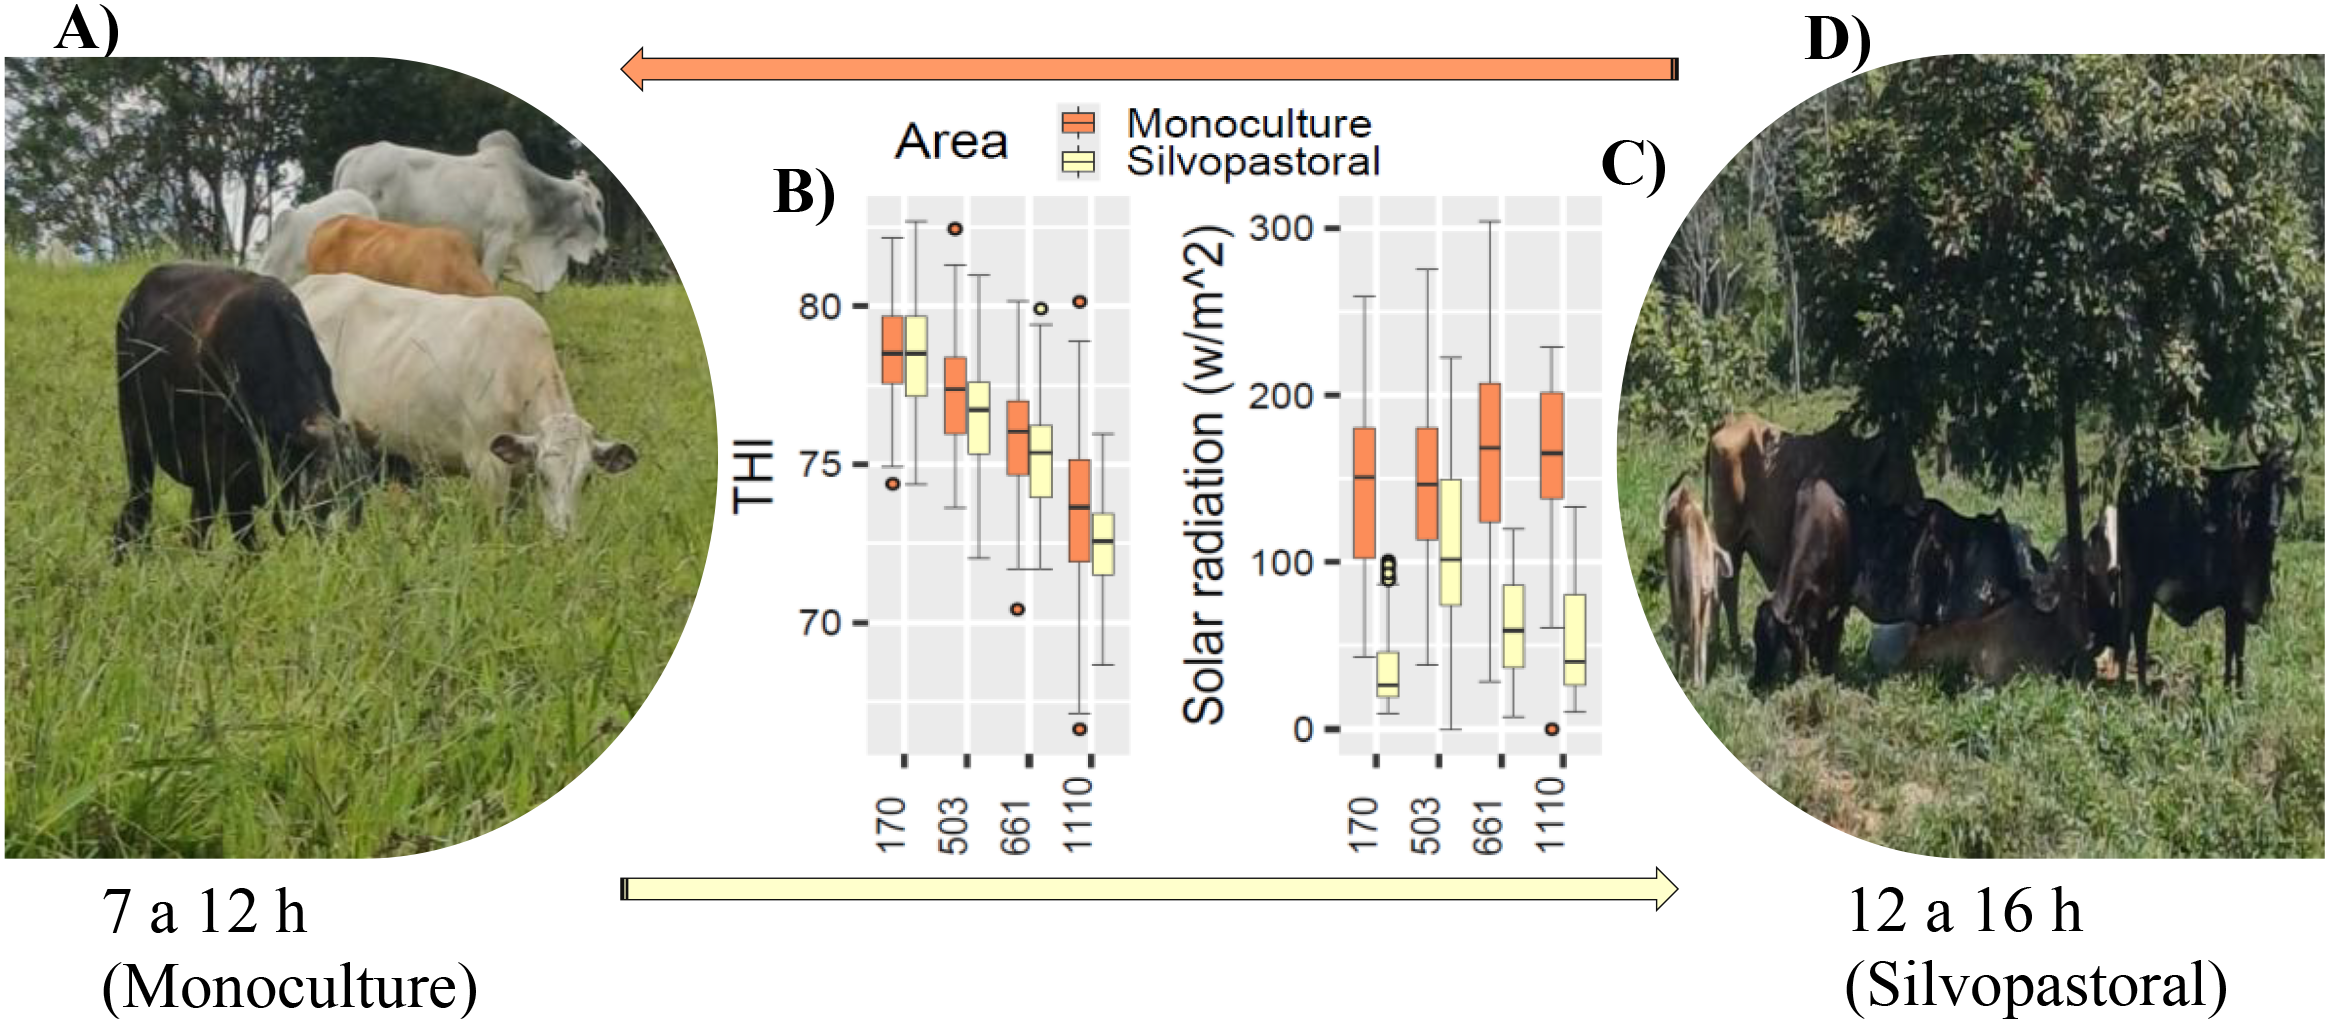
Cattle dynamics in mixed silvopastoral systems. (A) areas in monoculture, (B) temperature humidity index (THI), (C) solar radiation, (D) areas in silvopasture, at 170, 503, 661 and 1110 m altitude.
3.2 Chemical analysis of pastures
The chemical composition of B. brizantha is shown in Figure 3, where the medians were subjected to the Kruskal-Wallis test (p<0.05). In Figure 3A, the fat content of B. brizantha from 661 m showed a significant difference, with higher values compared to the fat content from 170 m and 1110 m. Regarding protein content (Figure 3B) and nitrogen-free extract (NFE) content (Figure 3E), the medians did not present significant differences when compared across altitudinal origins. The fiber content analysis (Figure 3C) of B. brizantha at 170 m showed significant differences, with higher values compared to 661 m and 1110 m. Meanwhile, the ash content in Figure 3D showed significant differences, with B. brizantha from 503 m, 661 m, and 1110 m presenting higher values compared to B. brizantha from 170 m. For moisture content (Figure 3F), all the medians showed significant differences from each other.
Figure 3
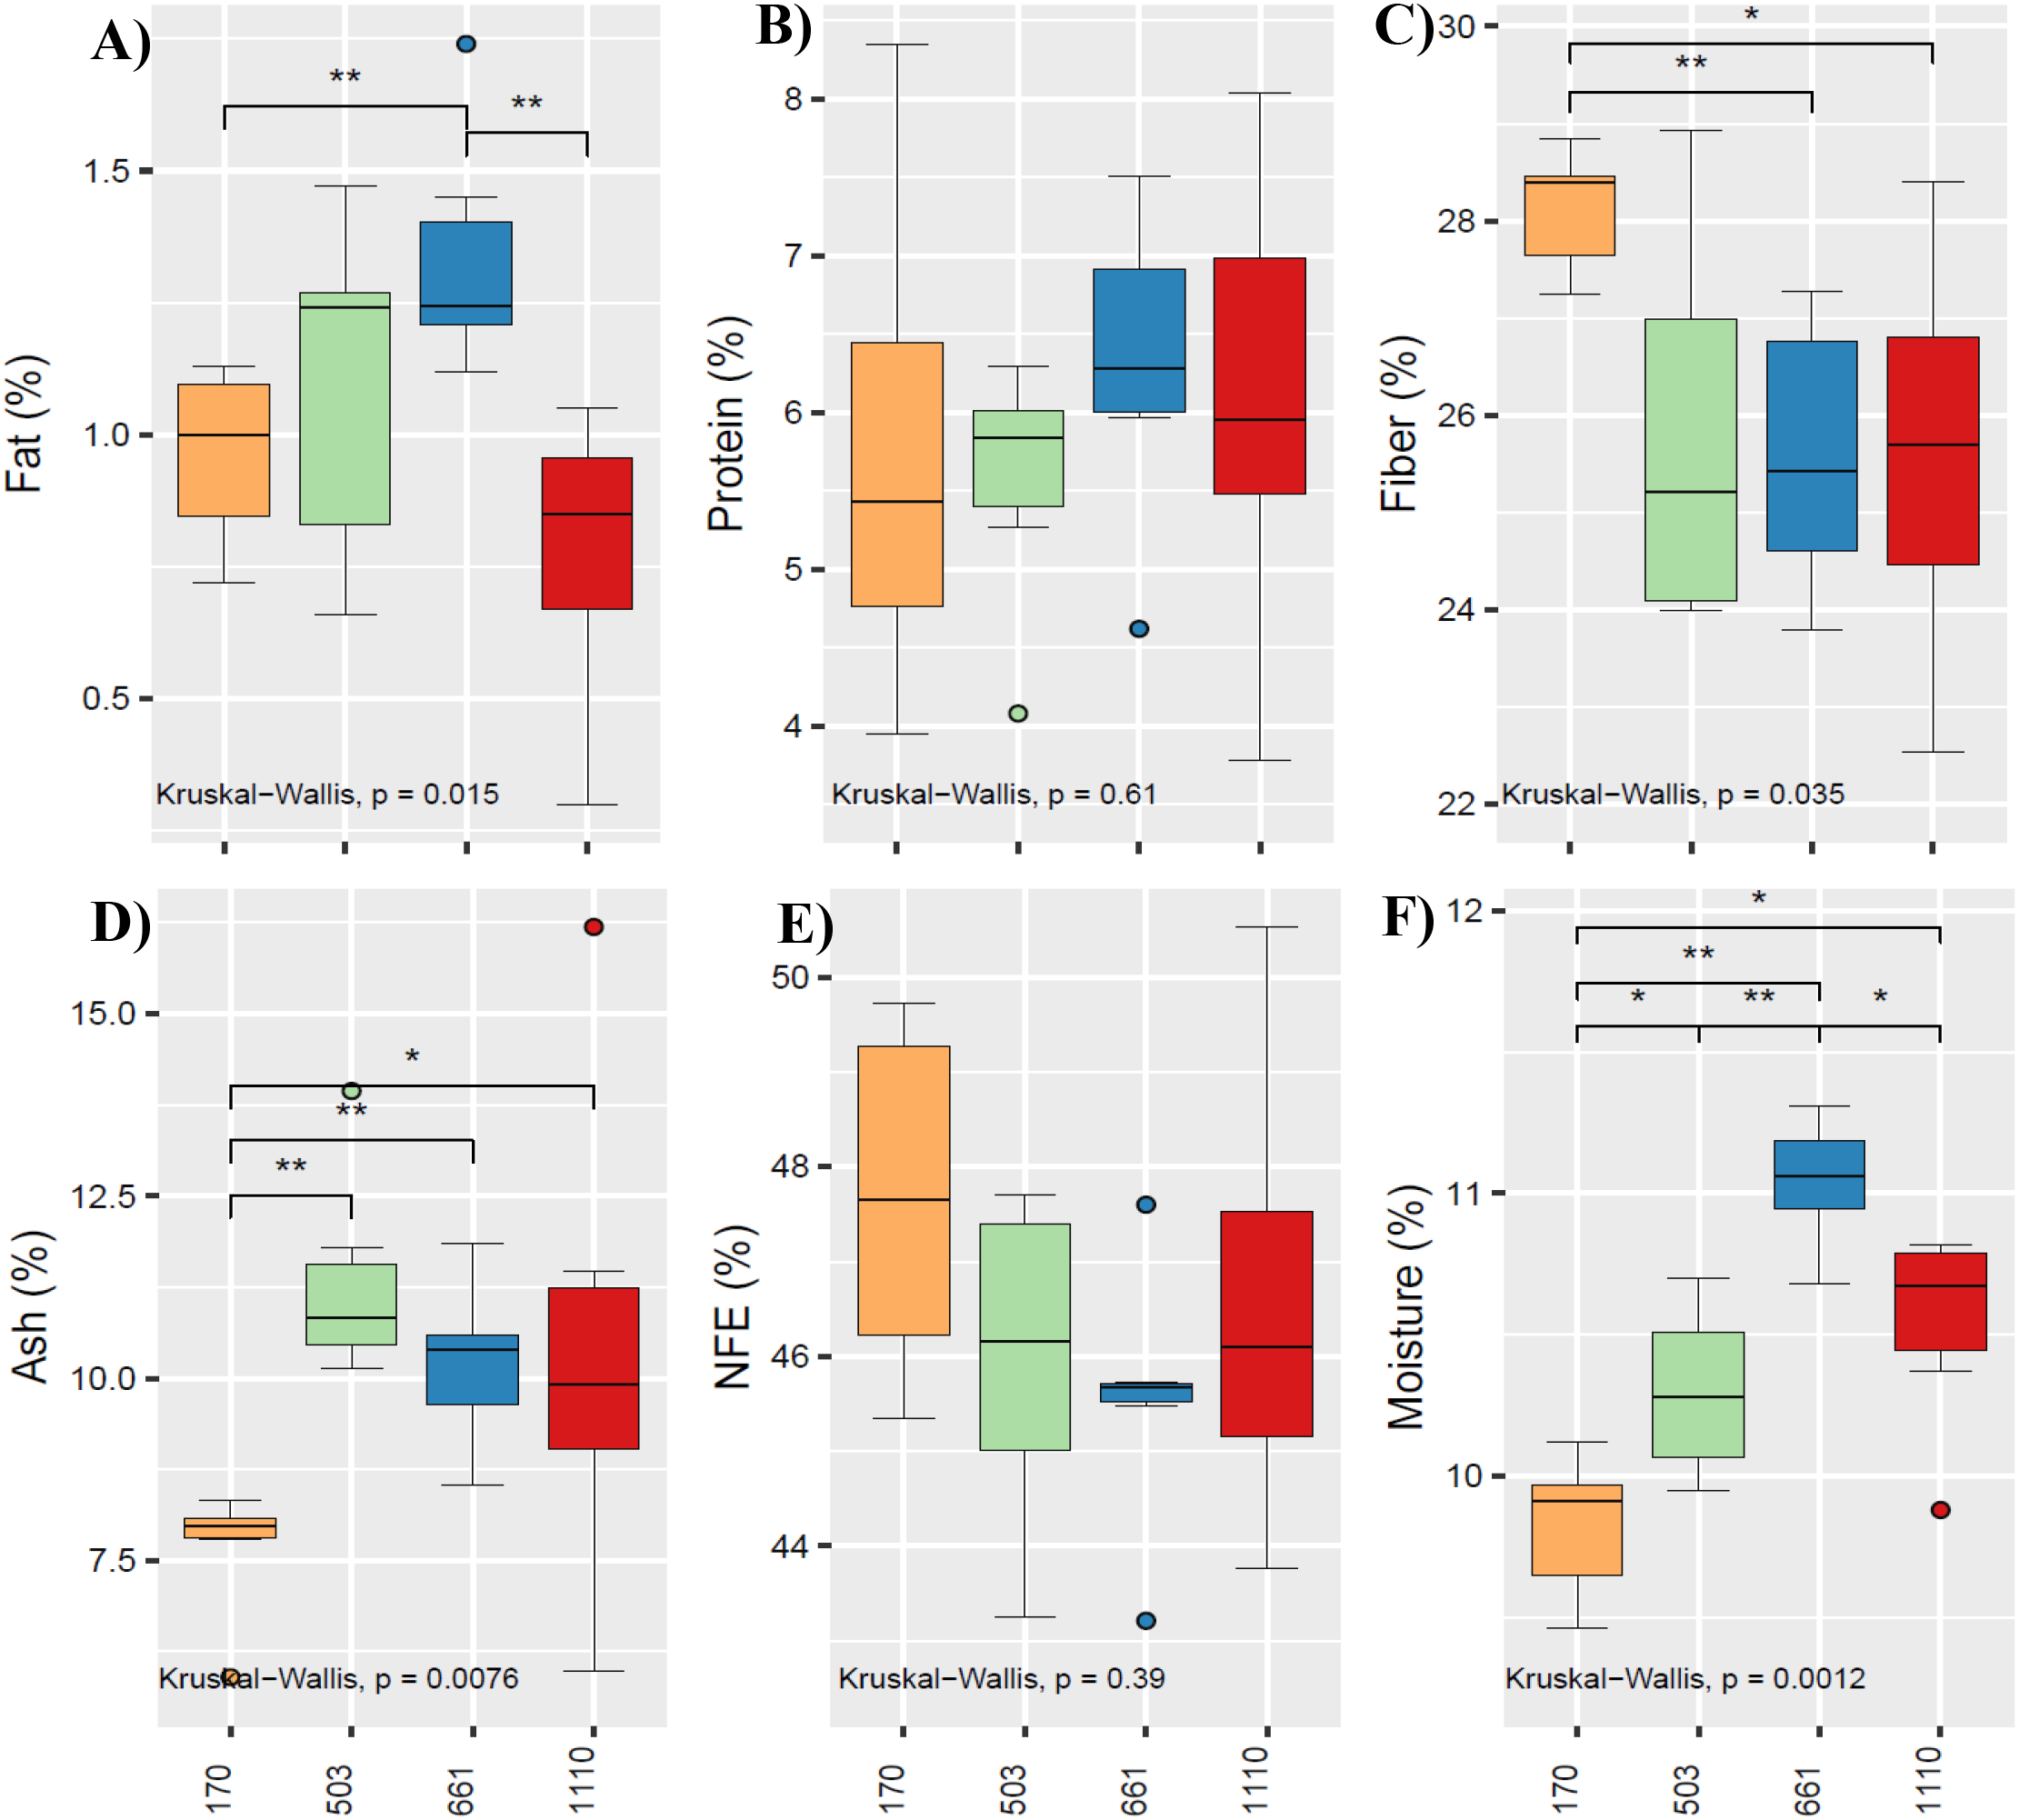
Medians of fat (A), protein (B), crude fiber (C), ash (D), NFE-nitrogen free extract (E) and moisture (F) of B. brizantha from 170, 503, 661 and 1110 m, subjected to Kruskal-Wallis test (p<0.05). *significant, **highly significant.
3.3 Calf weight
Figure 4 presents the regressions (p<0.05) for the weight of female (F1, F2, F3 and F4) and male (M1, M2 and M3) calves. The regressions were adjusted to linear models, with a very good fit (0.8 ≤ R²adj < 1) or good fit (0.6 ≤ R²adj < 0.8). These models were used to estimate accumulated weight gains over an eight-month period. At 170 m (Figure 4A), the females F1-BSxGxH, F2-BSxG, and F3-BSxB reached weights of 82.4, 115.0, and 284.0 kg, respectively, while the males M1-BSxGxH, M2-BSxBxG, and M3BSxGxH reached 114.8, 282.0, and 201.0 kg. Similarly, at 503 m (Figure 4B), the females F1-GxH, F2-GxH, and F3-BSxBxJ reached weights of 144.0, 120.8, and 250.0 kg, while the males M1-BSxG, M2-BSxGxH, and M3-BSxGxJ reached 157.0, 139.0, and 64.0 kg. At 661 m (Figure 4C), the females F1-GxH and F2-GxH weighed 96.8 and 123.0 kg, respectively, while the males M1-GxH, M2-GxH, M3-GxH, and M4-GxH reached 250.0, 151.0, 151.0, and 143.0 kg. Finally, at 1110 m (Figure 4D), the females F1-BxGxH, F2GxH, F3-GxH, and F4-BxFxH reached weights of 115.0, 179.0, 177.0, and 70.4 kg, while the males M1-BSxG and M2-BSxG reached 188.0 and 70.4 kg, respectively. These results indicate that at lower altitudes (170 and 503 m), cattle are raised for both meat and milk production, whereas at higher altitudes (661 and 1110 m), cattle are primarily raised for milk production.
Figure 4
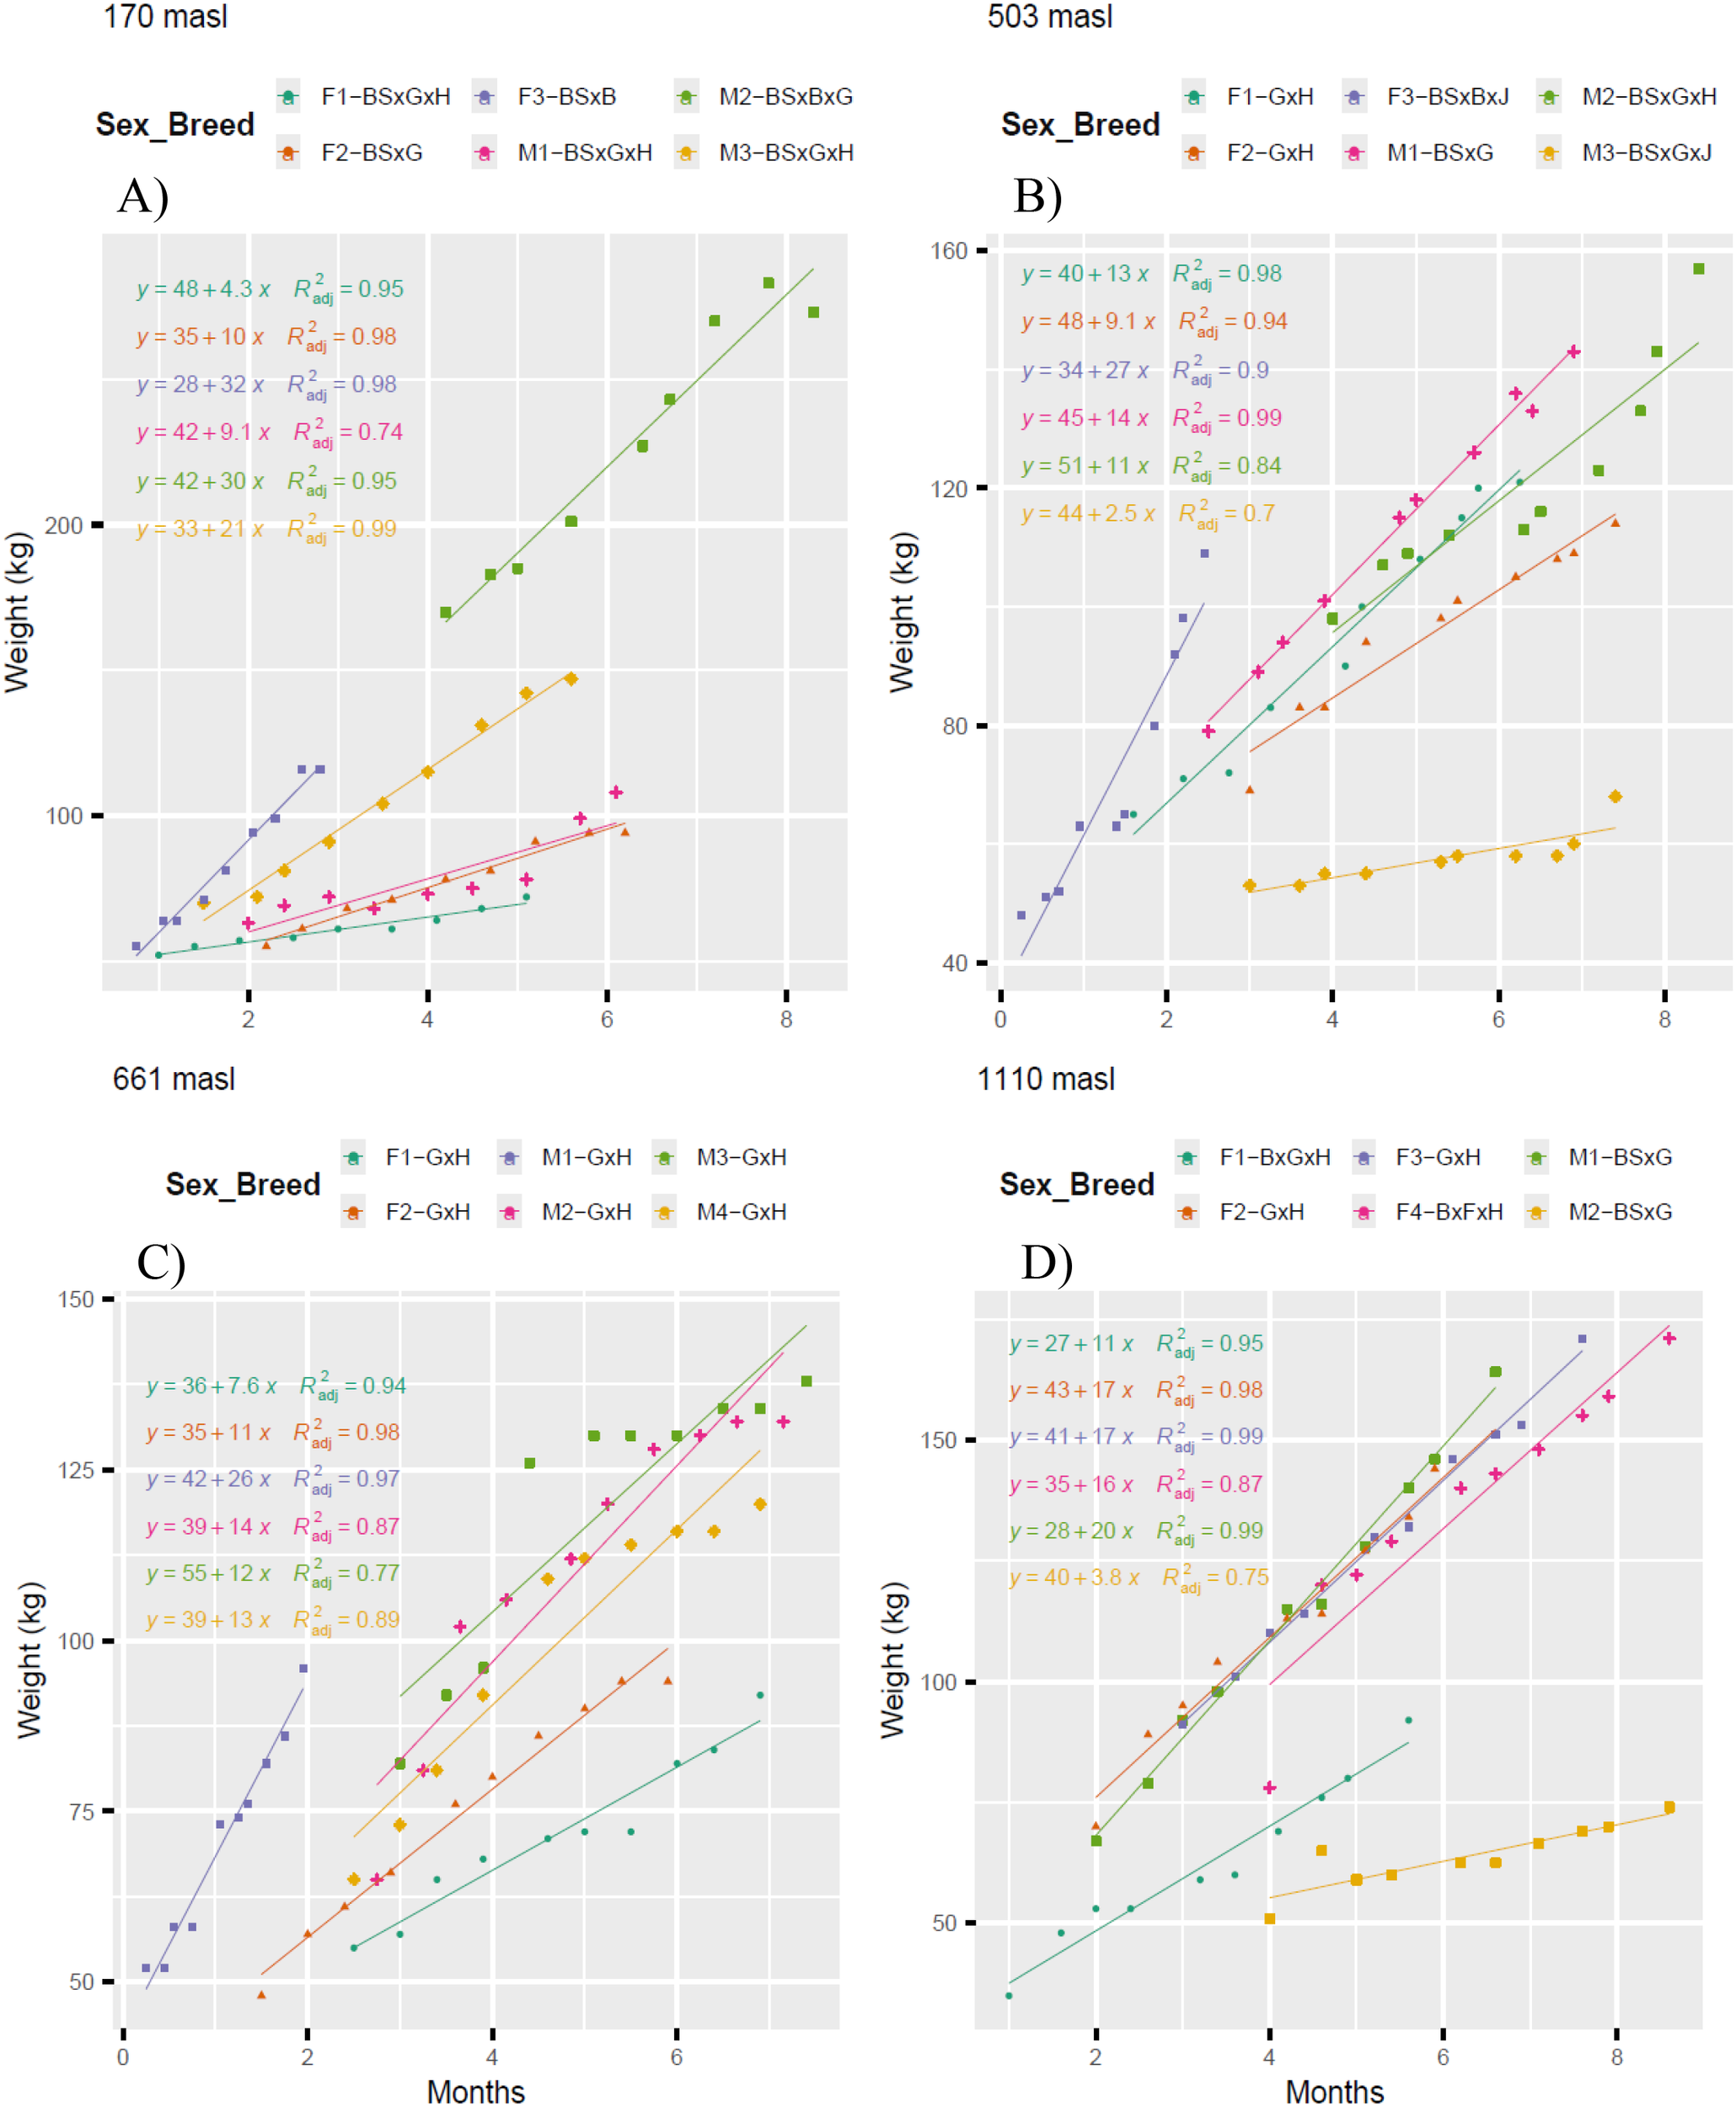
Linear regression models (p<0.05) of crossbred calf weights at altitudes 170 m (A); 503 m (B); 661 m (C); 1110 m (D). BS, Brown Swiss; B, Brahman; G, Gyr; H, Holstein; J, Jersey and F, Fleckvieh. F1, female 1; F2, female 2; F3, female 3; F4, female 4; and M1, male 1; M2, male 2; M3, male 3.
3.4 Milk components
Figure 5 presents the PCA of the milk components from cows of breeds BSxB, BSxG, BSxH, BxJ, BxH, and GxH, which explains 79.4% of the data variability (Dim1 and Dim2). In Figure 5A, Dim1 (65.9%) of the PCA groups data from BSxJ cows, associated with the freezing point vector, contrasting with the data from BSxB, BSxG, BSxH, BxH, and GxH cows, which do not show a clear relationship with the other vectors. Meanwhile, in Dim2 (13.5%), the PCA groups data from BSxH cows associated with the pH vector, distinguishing them from GxH cows, which group data associated with the fat vector. When grouped by altitude, in the same PCA, Dim1 (Figure 5B) shows that the data from 661 m are grouped with the fat, total solids, salts, and protein vectors, differentiating from 503 m, where the data are grouped with the freezing point vector. On the other hand, in Dim2, at 170 and 1110 m, the data are grouped with the pH vector, distinguishing from 661 m, where the data are grouped with the fat vector. Regarding heat stress and lactation cycles, the PCA did not present clear grouping patterns (Figures 5C, D).
Figure 5
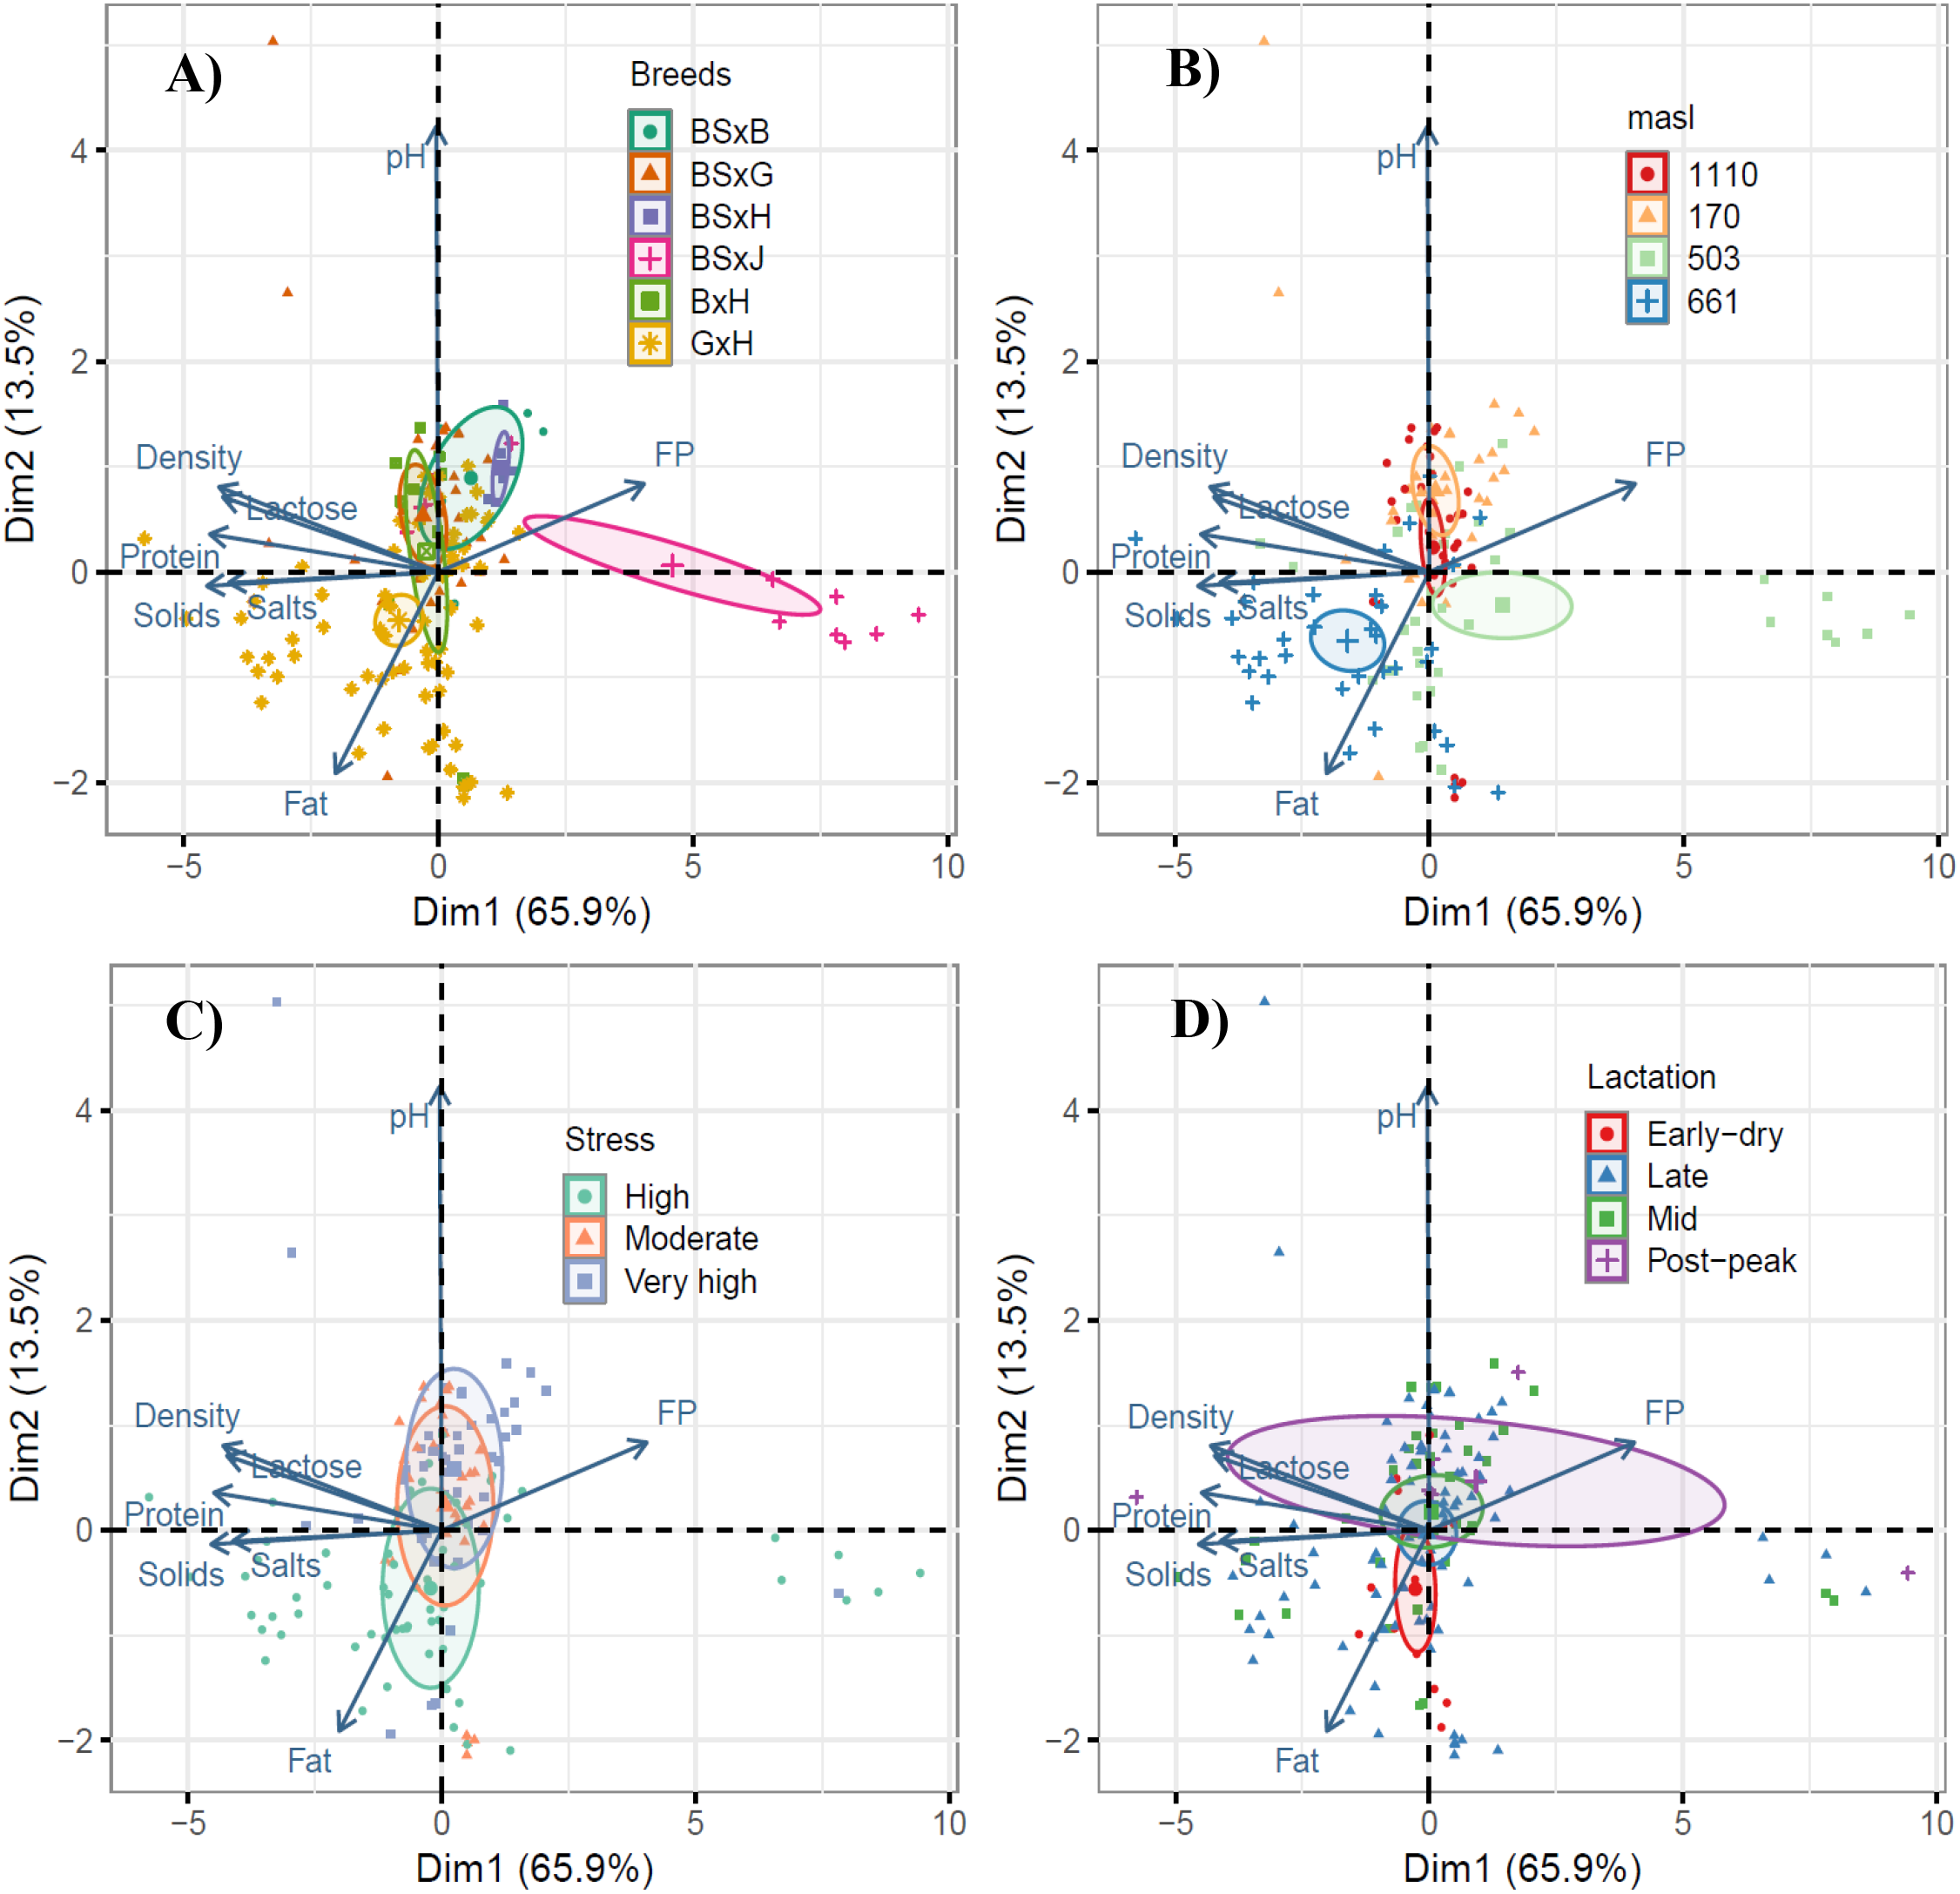
Principal component analysis (PCA) of milk composites; for factors BSxB; 706 BSxG; BSxH; BxJ; BxH and GxH cows (A); at 170; 503; 661 and 1110 m (B); 707 heat stress (C); lactation cycle (D). BS, Brown Swiss; B, Brahman; G, Gyr; H, Holstein and J, Jersey.
The median values of the milk components from the evaluated cows, based on crossbreed type, are presented in Table 3. Significant differences (CI: 95%) were determined for fat percentage, with lower values in BSxJ cows compared to BSxB, BSxG, BSxH, BxH, and GxH cows. BSxJ cows also showed lower values in total solids, protein, lactose, and salts, though the upper range of the confidence interval remained within the values observed in BSxB, BSxG, BSxH, BxH, and GxH cows.
Table 3
| Cow | Breed | Fat | Solid | Protein | Lactose | Salts | Density | FP | pH |
|---|---|---|---|---|---|---|---|---|---|
| % | g/cm | °C | |||||||
| 1 | BSxB | 3.05 | 8.65 | 3.15 | 4.7 | 0.7 | 1.03 | -0.55 | 6.85 |
| n=6 | (1.49; 3.66) | (7.44; 9.09) | (2.71;3.30) | (4.11;4.99) | (0.60; 0.70) | (1.02;1.03) | (-0.59; -0.50) | (6.60; 6.99) | |
| 6 | BSxG | 2.5 | 9 | 3.3 | 4.9 | 0.7 | 1.03 | -0.57 | 6.7 |
| n=34 | (0.50; 4.00) | (7.83; 10.71) | (2.83; 4.15) | (4.47; 6.17) | (0.60; 0.81) | (1.03; 1.04) | (-0.81; -0.52) | (6.37; 7.17) | |
| 1 | BSxH | 1.2 | 8.35 | 3 | 4.6 | 0.62 | 1.03 | -0.52 | 6.7 |
| n=6 | (0.91; 2.54) | (8.10; 8.40) | (2.90; 3.00) | (4.40; 4.60) | (0.60; 0.63) | (1.03; 1.03) | (-0.53; -0.51) | (6.61; 6.80) | |
| 2 | BSxJ | 0.9 | 3.55 | 1.3 | 1.95 | 0.53 | 1.02 | -0.2 | 6.5 |
| n=12 | (0.50; 1.17) | (2.11; 9.77) | (0.73; 3.47) | (1.40; 5.17) | (0.23; 0.72) | (1.01; 1.04) | (-0.59; -0.13) | (6.50; 6.67) | |
| 2 | BxH | 2 | 9.2 | 3.35 | 5 | 0.71 | 1.03 | -0.58 | 6.7 |
| n=10 | (0.85; 3.12) | (8.40; 9.60) | (3.10; 3.50) | (4.60; 5.20) | (0.68; 0.75) | (1.03; 1.03) | (-0.61; -0.56) | (6.10; 6.70) | |
| 12 | GxH | 2.7 | 9.1 | 3.2 | 4.8 | 0.71 | 1.03 | -0.58 | 6.5 |
| n=70 | (0.90; 4.00) | (8.17; 12.65) | (2.97; 4.28) | (4.40; 5.73) | (0.60; 0.84) | (1.03; 1.04) | (-1.11; -0.53) | (6.10; 6.70) | |
Medians and confidence intervals (CI:95%) of the milk components of cows.
BS, Brown Swiss; B, Brahman; G, Gyr; H, Holstein and J, Jersey.
The values in bold are averages, and the values in parentheses are the upper and lower limits at a 95% confidence level.
The milk components by individual cow and altitude are presented in Figure 6.
Figure 6
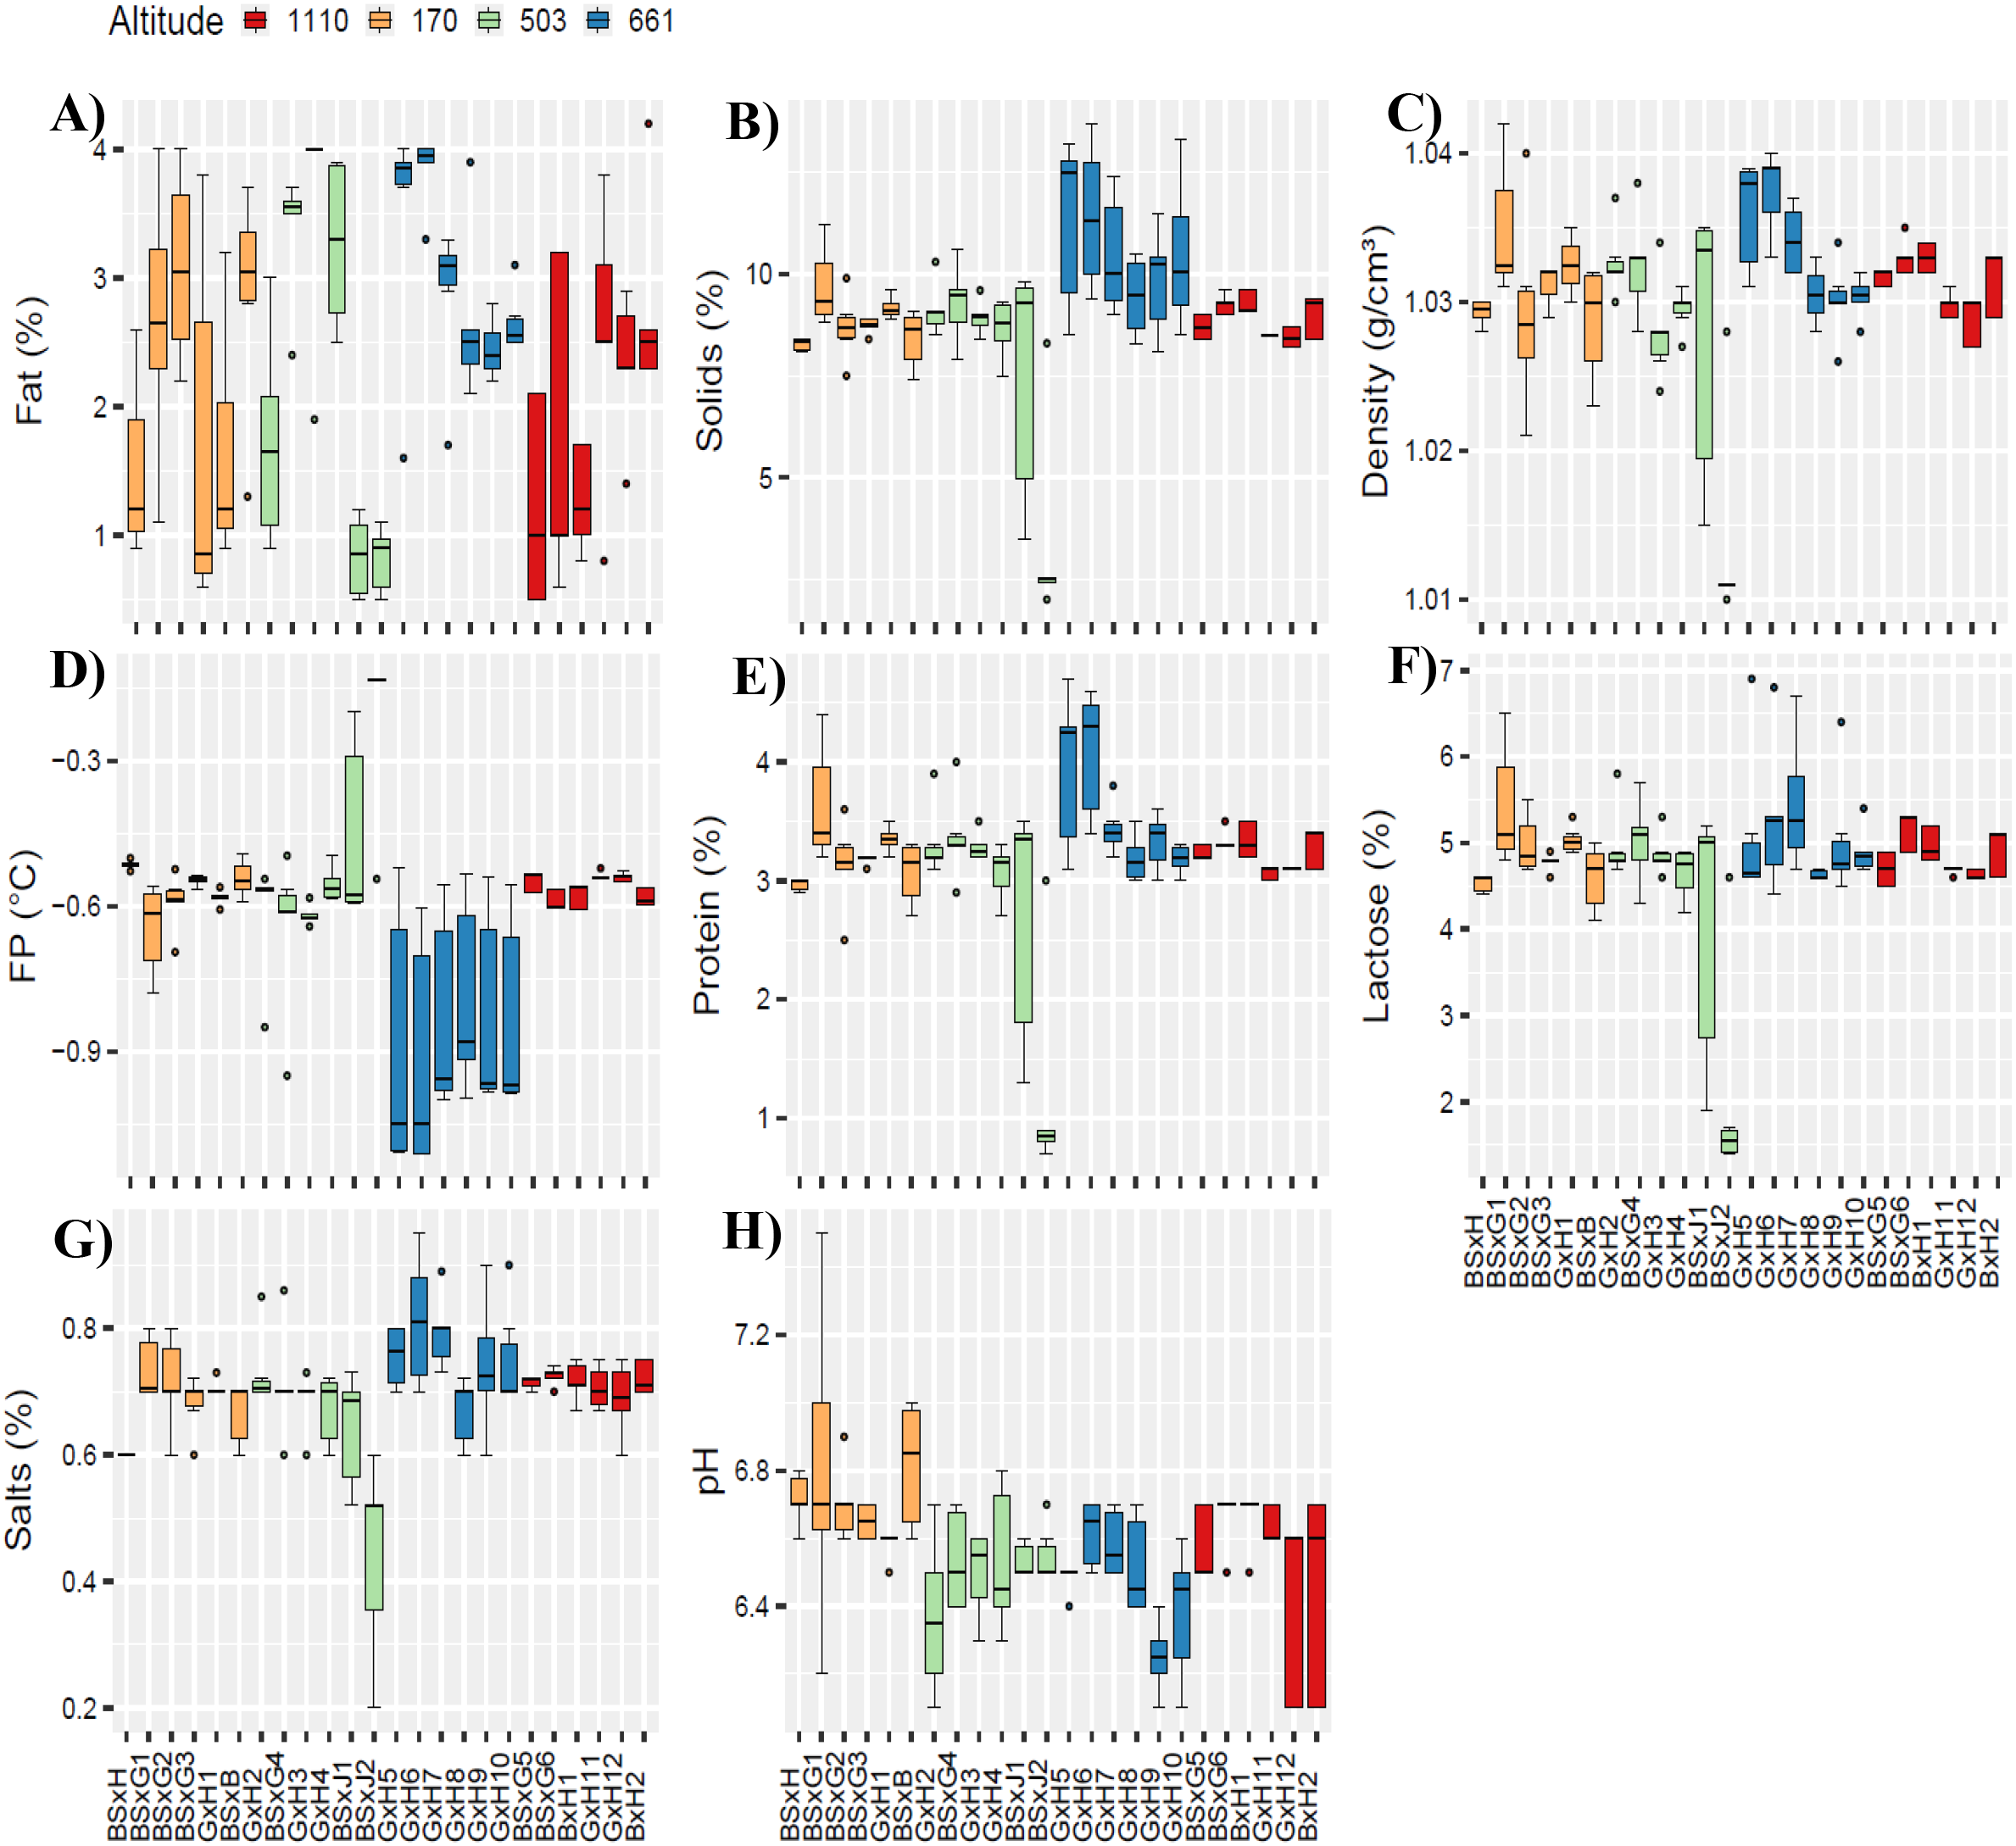
Milk components from BSxB; BSxG; BSxH; BxJ; BxH and GxH crossbred cows; located at 170; 503; 661 and 1110 m altitudes. Fat (A); solids (B); density (C); freezing point (D); protein (E); lactose (F); salts (G) and pH (H). BS, Brown Swiss; B, Brahman; G, Gyr; H, Holstein and J, Jersey.
The highest median fat percentages (Figure 6A) were recorded for cows BSxG4 (at 503 m), GxH5, and GxH6 (at 661 m), while the lowest medians were found in cows BSxG3 (at 170 m), BSxJ1, and BSxJ2 (at 503 m). Regarding total solids and density (Figures 6B, C), the highest medians were observed in cows GxH5 and GxH6 (at 661 m), with the lowest median in cow BSxJ2 (at 503 m). As for the freezing point (Figure 6D), the medians at 170, 503, and 1110 m were similar, close to -0.6°C. However, cows GxH5, GxH6, GxH7, GxH8, GxH9, and GxH10, at 661 m, had medians below -0.9°C. For protein and lactose percentages (Figures 6E, F), cows GxH5 and GxH6 (at 661 m) showed the highest medians, while the lowest median was recorded in cow BSxJ2 (at 503 m). Similarly, for salt percentages (Figure 6G), cows GxH5, GxH6, and GxH7 (at 661 m) had the highest medians, with the lowest median found in cow BSxJ2 (at 503 m). Finally, the pH (Figure 6H) showed slight acidity, with the highest median of pH 6.9 recorded in cow BSxB (at 170 m) and the lowest median of pH 6.3 in cow GxH9 (at 661 m).
3.5 Hematological parameters
The ANOVA for blood components showed statistical significance according to the F-test (p<0.05) in the electrolytes Cl- and Na+, in blood biochemical parameters such as cholesterol and urea, as well as in the hematological profile for hemoglobin, platelets, and red blood cells. Additionally, mean tests (p<0.05) were conducted using the Scott-Knott method (Table 4). For Cl- and Na+, significant differences with higher means were found in 5 BSxG cows out of 6 evaluated, while the lowest means for Na+ were in 10 GxH cows out of 12 evaluated. Similarly, red blood cells and hemoglobin showed significant differences, with higher means in 9 GxH cows out of 12 evaluated, and lower means in 8 BSx- cows out of 10 evaluated. On the other hand, cholesterol, urea, and platelets showed significant differences, but without a clear pattern based on cow crossbreeding across the altitudinal gradient.
Table 4
| masl | Breeds | Electrolytes | Blood biochemical parameters | Hematological profile | ||||||||||
|---|---|---|---|---|---|---|---|---|---|---|---|---|---|---|
| Cl- | K+ | Na+ | Glucose | Cholesterol | Triglyceride | Urea | Protein | Albumin | Globulin | R. blood | Hemoglobin | Platelet | ||
| mmol/L | mg/dl | gr/dl | mill/mm3 | gr/dl | mill/mm3 | |||||||||
| 170 | BSxH | 104.4 ± 1.5a | 5.0 ± 0.3 | 139.6 ± 1.9b | 60.4 ± 4.4 | 126.4 ± 6.8c | 28.0 ± 4.7 | 27.7 ± 3.3b | 7.2 ± 0.5 | 3.5 ± 0.5 | 3.6 ± 0.7 | 5368 ± 68.7b | 7.3 ± 0.2d | 492800 ± 15110a |
| BSxG1 | 103.7 ± 1.1a | 5.1 ± 0.3 | 140.6 ± 1.2a | 51.6 ± 2.6 | 132.6 ± 2.9c | 35.4 ± 4.0 | 21.8 ± 1.6b | 7.4 ± 0.5 | 3.2 ± 0.0 | 4.1 ± 0.5 | 5308 ± 139.6b | 8.9 ± 0.2c | 319400 ± 20547a | |
| BSxG2 | 103.3 ± 0.8a | 4.8 ± 0.2 | 141.0 ± 2.1a | 62.6 ± 2.5 | 168.2 ± 10.6b | 43.4 ± 8.3 | 20.9 ± 3.3b | 7.9 ± 0.2 | 3.7 ± 0.0 | 4.2 ± 0.2 | 6556 ± 241.5a | 11.0 ± 0.3a | 254400 ± 45555b | |
| BSxG3 | 103.4 ± 1.1a | 4.6 ± 0.1 | 142.8 ± 1.7a | 55.4 ± 6.0 | 174.8 ± 12.5b | 51.0 ± 3.7 | 37.1 ± 2.5a | 8.0 ± 0.5 | 3.4 ± 0.1 | 4.6 ± 0.4 | 6050 ± 286.5a | 9.3 ± 0.5b | 252400 ± 63468b | |
| GxH1 | 100.3 ± 1.1b | 4.8 ± 0.5 | 138.5 ± 1.5b | 63.8 ± 6.1 | 138.6 ± 10.5c | 38.2 ± 6.8 | 22.2 ± 1.9b | 7.8 ± 0.3 | 4.2 ± 0.3 | 3.6 ± 0.3 | 6396 ± 607.6a | 10.5 ± 0.6a | 300000 ± 32326b | |
| BSxB | 103.4 ± 2.1a | 5.1 ± 0.3 | 139.6 ± 1.2b | 56.2 ± 3.4 | 126.6 ± 7.1c | 35.8 ± 5.9 | 22.4 ± 3.6b | 7.9 ± 0.4 | 3.8 ± 0.1 | 4.2 ± 0.4 | 5733 ± 369.2b | 8.5 ± 0.3c | 339000 ± 84637a | |
| 503 | GxH2 | 101.8 ± 0.6b | 5.8 ± 0.4 | 142.6 ± 1.0a | 63.2 ± 4.6 | 206.8 ± 6.5a | 46.8 ± 6.3 | 36.0 ± 3.5a | 8.9 ± 0.4 | 3.7 ± 0.2 | 5.2 ± 0.4 | 6698 ± 552.6a | 9.8 ± 0.4b | 261600 ± 41329b |
| BSxG4 | 106.0 ± 1.8a | 5.6 ± 0.4 | 142.6 ± 1.5a | 52.8 ± 2.2 | 147.6 ± 6.3c | 41.6 ± 7.8 | 27.6 ± 1.2b | 7.9 ± 0.5 | 4.3 ± 0.3 | 3.7 ± 0.5 | 5250 ± 145.7b | 8.7 ± 0.2c | 259000 ± 16326b | |
| GxH3 | 102.9 ± 0.9a | 5.6 ± 0.6 | 139.3 ± 1.3b | 66.0 ± 3.1 | 227.0 ± 6.6a | 47.8 ± 7.6 | 35.0 ± 1.2a | 7.7 ± 0.3 | 3.5 ± 0.1 | 4.2 ± 0.3 | 6758 ± 121.2a | 9.7 ± 0.4b | 271200 ± 37299b | |
| GxH4 | 103.8 ± 1.7a | 5.0 ± 0.2 | 138.6 ± 1.6b | 60.0 ± 4.4 | 152.4 ± 6.7c | 37.6 ± 9.1 | 31.4 ± 2.1a | 8.4 ± 0.6 | 4.1 ± 0.4 | 4.2 ± 0.4 | 4933 ± 310.9b | 7.8 ± 0.3d | 237000 ± 38856b | |
| BSxJ1 | 100.6 ± 1.1b | 5.0 ± 0.3 | 138.0 ± 1.3b | 59.4 ± 6.2 | 116.6 ± 7.4c | 39.2 ± 4.4 | 28.7 ± 4.2b | 7.9 ± 0.5 | 3.6 ± 0.2 | 4.3 ± 0.5 | 5685 ± 508.7b | 8.1 ± 0.3c | 283250 ± 52933b | |
| BSxJ2 | 104.8 ± 0.8a | 4.9 ± 0.5 | 145.4 ± 1.6a | 60.0 ± 2.7 | 98.6 ± 3.5c | 37.6 ± 5.8 | 26.7 ± 1.3b | 8.6 ± 0.3 | 3.8 ± 0.1 | 4.7 ± 0.3 | 5416 ± 288.9b | 8.2 ± 0.3c | 189600 ± 72344b | |
| 661 | GxH5 | 97.8 ± 1.15b | 4.6 ± 0.4 | 137.0 ± 2.7b | 62.8 ± 4.5 | 159.4 ± 7.6c | 36.0 ± 5.3 | 21.4 ± 0.8b | 8.6 ± 0.4 | 3.9 ± 0.4 | 4.7 ± 0.4 | 6222 ± 300.9a | 9.9 ± 0.4b | 298800 ± 24998b |
| GxH6 | 102.8 ± 1.1a | 5.4 ± 0.2 | 138.2 ± 1.7b | 68.0 ± 2.7 | 160.4 ± 17.3c | 41.0 ± 9.5 | 18.0 ± 2.8b | 8.2 ± 0.3 | 3.7 ± 0.1 | 4.5 ± 0.3 | 6360 ± 124.4a | 9.4 ± 0.4b | 234200 ± 25159b | |
| GxH7 | 99.0 ± 1.2b | 5.4 ± 0.3 | 140.0 ± 0.5b | 57.8 ± 7.2 | 142.8 ± 15.4c | 30.0 ± 6.4 | 21.9 ± 4.3b | 8.1 ± 0.4 | 3.7 ± 0.2 | 4.4 ± 0.5 | 6113 ± 252.1a | 10.7 ± 0.3a | 267500 ± 24903b | |
| GxH8 | 100.6 ± 1.7b | 4.8 ± 0.2 | 141.2 ± 2.0a | 57.8 ± 6.7 | 124.0 ± 20.9c | 36.6 ± 10.6 | 26.5 ± 1.3b | 7.4 ± 0.3 | 4.0 ± 0.5 | 3.5 ± 0.3 | 6038 ± 120.8a | 10.3 ± 0.2a | 221000 ± 57302b | |
| GxH9 | 103.0 ± 1.3a | 5.1 ± 0.2 | 138.0 ± 1.4b | 60.0 ± 4.7 | 141.2 ± 30.5c | 35.8 ± 6.3 | 18.5 ± 3.2b | 8.8 ± 0.7 | 3.6 ± 0.3 | 5.2 ± 0.7 | 5550 ± 285.0b | 9.4 ± 0.2b | 370800 ± 41114a | |
| GxH10 | 99.0 ± 0.7b | 4.9 ± 0.2 | 137.6 ± 0.9b | 72.6 ± 5.3 | 209.0 ± 9.8a | 33.8 ± 2.5 | 26.3 ± 2.1b | 7.9 ± 0.6 | 3.6 ± 0.1 | 4.3 ± 0.6 | 6512 ± 436.6a | 10.1 ± 0.7a | 162600 ± 24937b | |
| 1110 | BSxG5 | 99.2 ± 0.7b | 5.2 ± 0.1 | 135.6 ± 2.1b | 66.4 ± 4.6 | 172.8 ± 22.1b | 46.6 ± 3.9 | 25.1 ± 3.1b | 7.7 ± 0.4 | 3.6 ± 0.1 | 4.0 ± 0.4 | 5184 ± 445.7b | 7.0 ± 0.4d | 366000 ± 38666a |
| BSxG6 | 104.2 ± 1.5a | 6.3 ± 0.3 | 139.0 ± 1.9b | 61.6 ± 6.5 | 125.8 ± 11.0c | 43.8 ± 8.3 | 25.8 ± 5.7b | 8.4 ± 0.4 | 3.9 ± 0.2 | 4.5 ± 0.3 | 5456 ± 465.3b | 10.1 ± 0.3a | 250400 ± 40165b | |
| BxH1 | 104.6 ± 0.7a | 5.3 ± 0.3 | 138.6 ± 1.1b | 57.8 ± 5.9 | 135.6 ± 8.4c | 38.6 ± 6.6 | 33.1 ± 2.2a | 7.9 ± 0.6 | 3.5 ± 0.2 | 4.4 ± 0.6 | 4796 ± 588.5b | 8.7 ± 0.6c | 325800 ± 14034a | |
| GxH11 | 104.2 ± 1.2a | 5.4 ± 0.5 | 139.8 ± 1.5b | 53.6 ± 3.5 | 223.8 ± 6.0a | 30.8 ± 2.9 | 23.3 ± 2.0b | 8.1 ± 0.4 | 3.7 ± 0.2 | 4.3 ± 0.5 | 5310 ± 242.5b | 9.5 ± 0.4b | 407800 ± 15263a | |
| GxH12 | 104.5 ± 1.3a | 5.3 ± 0.4 | 141.6 ± 1.3a | 58.6 ± 7.1 | 160.8 ± 17.5c | 39.8 ± 6.6 | 27.8 ± 3.8b | 8.3 ± 0.5 | 3.9 ± 0.3 | 4.4 ± 0.3 | 6010 ± 289.7a | 10.5 ± 0.3a | 327250 ± 67209a | |
| BxH2 | 106.3 ± 1.0a | 5.3 ± 0.3 | 140.0 ± 1.6b | 60.6 ± 5.4 | 186.2 ± 6.6b | 39.8 ± 4.3 | 18.9 ± 2.9b | 7.2 ± 0.3 | 3.7 ± 0.2 | 3.5 ± 0.3 | 5862 ± 618.8a | 9.5 ± 0.4b | 386000 ± 12288a | |
Means (n=5) and standard error of blood variables from 24 cows in mixed-approach systems distributed along an altitudinal gradient.
BS, Brown Swiss; B, Brahman; G, Gyr; H, Holstein and J, Jersey. Means followed by the same letter in the columns do not differ significantly from each other by the ScottKnott test (p<0.05).
3.6 THI, milk components and blood parameters
Figure 7 presents Pearson correlation matrices (p<0.05) showing the association between milk components, blood parameters, and THI. In the case of BxH cows, a strong positive correlation (r=0.72) was observed between fat content and THI (Figure 7A). Regarding blood parameters, the blood glucose of BSxJ cows showed a strong positive correlation (r=0.65) with THI, while hemoglobin presented a strong negative correlation (r=-0.72) with this index (Figure 7B). Additionally, in GxH cows, blood glucose showed a weak positive correlation (r=0.34), globulin displayed a weak negative correlation (r=0.31), and triglycerides exhibited a moderate positive correlation (r=0.44) with THI (Figure 7C).
Figure 7
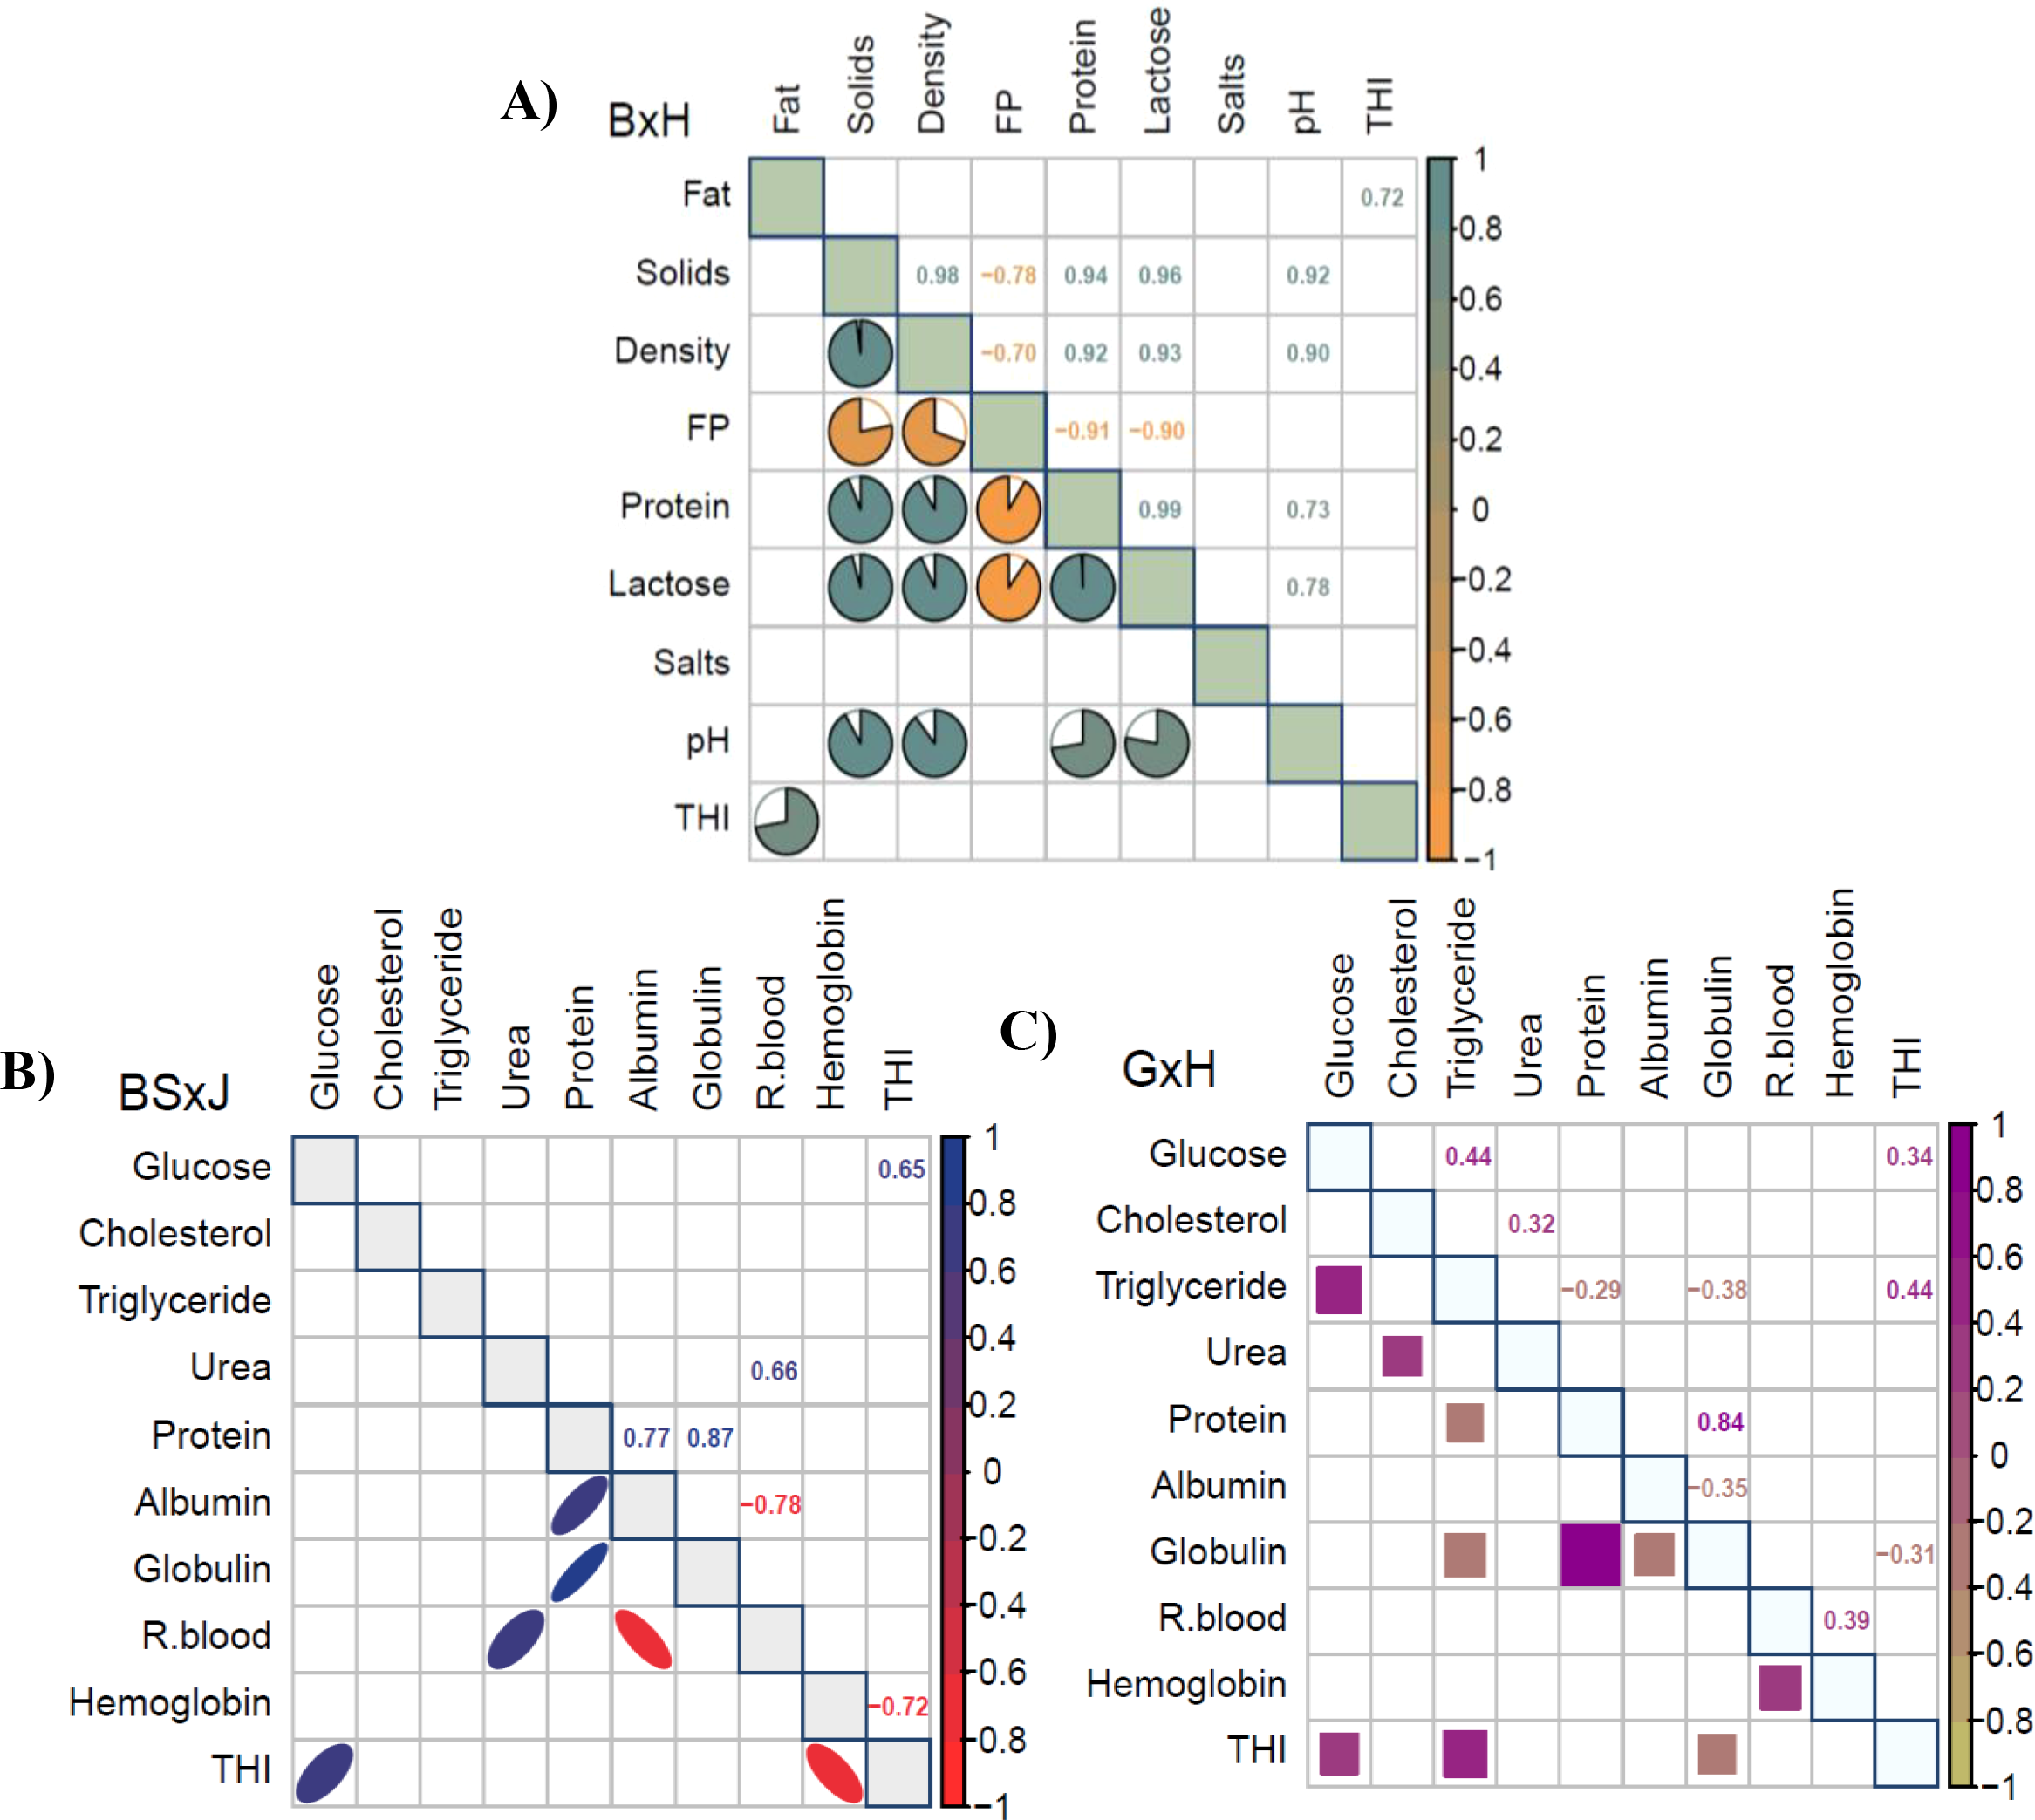
Pearson correlation matrices (p<0.05) of cow milk components BxH (A); cow blood parameters BSxJ (B) and GxH (C). B, Brahman; H, Holstein; BS, Brown Swiss; G, Gyr; and J, Jersey.
4 Discussion
4.1 THI in mixed-approach systems and altitudinal gradient
Livestock production in the altitudinal gradient of the Peruvian Amazon is constantly subjected to heat stress, ranging from very high stress at 170 m (THI>82) to moderate stress at 1110 m (72≥THI<78) (Figure 2B). Furthermore, in mixed-approach systems, heat stress is more intense in monoculture pasture areas than in silvopastoral areas (Figure 2B). That is, heat stress decreases with increasing altitude and in silvopastoral areas; resulting in BSxG cows predominating at lower altitudes and GxH breeds at higher altitudes (Table 2; Figures 2C, D). This reflects smallholder farmers’ preferences for these crossbreeds, considering their adaptability to the altitudinal gradient and their better performance in meat and milk production, which generates higher economic income. Various studies have shown that silvopasture in tropical climates reduces heat stress in livestock by modifying the microclimate and providing shade (Pezzopane et al., 2019; Vieira et al., 2021; Carvalho et al., 2020). Cattle recommended for tropical climates are Bos indicus x Bos taurus crosses (GxH and GxJ) due to their better performance (Habimana et al., 2023). Crossbreeding is a genetic improvement strategy that helps livestock adapt to specific environmental conditions (McManus et al., 2011), such as those in the altitudinal gradient of the Peruvian Amazon.
4.2 Calf weight
The higher weight gains in calves may be due to breed, milk quality, and management. The greatest weight gains occurred at 170 m (Figure 4A), where the female F3-BSxB gained 32 kg/month and the male M2-BSxBxG gained 30 kg/month. At 503 m (Figure 4B), the female F3-BSxBxJ gained 27 kg/month. At 661 m (Figure 4C), the male M1-GxH achieved 26 kg/month. At 1110 m (Figure 4D), the females F2-GxH and F3GxH gained 17 kg/month, and the male M1-BSxG gained 22 kg/month. At altitudes of 170 and 503 m, the higher weight gains are associated with BSxBx- crosses, as these calves had lower birth weights but generally developed while staying with the cow. Meanwhile, at 661 and 1110 m, the crosses were dairy breeds, and the higher weight gains were due to better management, such as increased assistance to cows and greater milk availability for calves. Crossbreeds with B are lighter at birth but heavier at weaning compared to other crosses (Kennedy and Chirchir, 1971). Environmental factors, type of feed, and breed significantly affected calf growth characteristics (Isik et al., 2009).
4.3 Milk components
Milk production varies as a function of breed crossbreeding (Figure 5A), altitudinal gradient (Figure 5B), pasture chemical composition (Figure 3) and grazing management.
Milk components presented similar values for BSxB, BSxG, BSxH, BxH and GxH crossbreeds; however, with lower contents of solids, density, protein, lactose and salts for BSxJ cows in the PCA (Figure 5A), with significant differences in lower fat content (CI:95%) (Table 3), likewise, this trend is corroborated in the boxplots (Figure 6), also the BSxJ cow presented significant differences (p<0. 05) with lower hemoglobin values compared to the other crossbred cows (Table 4). Possibly, the lower contents of solids, density, protein, lactose and salts in the milk of BSxJ cows were due to heat stress, since hemoglobin presented a strong negative correlation (r=-0.72) with THI (Figure 7B). Low hemoglobin levels in dairy cows can affect milk composition, reducing lactose production and altering immunological components (Treacher et al., 1976; França et al., 2013).
Analyzing milk components from altitudinal origin, at 661 m, presented higher fat, solids, density, protein, and salts contents, but with lower values of milk freezing point in the PCA (Figure 5B). In boxplot analysis, these outstanding values correspond mostly to milk from GxH cows (Figures 6A–G). It is likely that these higher contents of milk components are due to pasture quality, since 12 GxH crossbred cows were evaluated throughout the gradient, however, only those from the 661 m altitude stood out. Since, at 661 m, the pasture presented significant difference (p<0.05) with higher median fat, protein and moisture content (Figures 3A, B, F). Murga-Orrillo et al. (2025), in a complementary study to this one, determined that soils at 661 m exhibited higher fertility. This condition has allowed for improved pasture quality and, consequently, better milk quality, resulting in direct benefits for small producers and consumers. Pasture quality affects milk composition (Kuhnen et al., 2021).
The PCA of milk components of crossbred cows in general, did not show clustering as a function of heat stress (Figures 5C), however, in the case of milk from BxH cows, a strong positive correlation (r=0.72) was observed between fat content and THI (Figure 7A). These results allow inferring that milk components of BSxB, BSxG, BSxH, BxJ and GxH cows show similar behavior to heat stress; however, milk fat of BxH cows is possibly increased by heat stress. Heat stress alters milk fat composition, decreasing short- and medium-chain fatty acids, increasing long-chain fatty acids (Liu et al., 2017). Genetic factors influence susceptibility to heat stress, with high-producing cows being more vulnerable (Sigdel et al., 2019).
Milk components showed little clustering as a function of lactation cycle (Figure 5D). This is likely due to the fact that the evaluations were performed after peak milk production, and the cows were multiparous (Table 2). These conditions mean that milk components tend to be more stable. Protein and lactose concentrations show more stability after peak milk production (Rook and Campling, 1965). Multiparous cows generally produce higher fat and protein content, while lactose tends to be higher in primiparous cows (Nogara et al., 2024).
4.4 Hematological parameters
Hematological parameters show significant differences (p<0.05) from one breed to another (Table 4). Electrolytes Cl- and Na+ tend to be higher in BSxG cows, and Na+ is lower in GxH cows. However, red blood cells and hemoglobin tend to be higher in GxH cows, and lower in BSx- cows. Studies have found differences in blood components between H, BS, J, B and other crossbreds (Yang et al., 2022). These variations are influenced by factors such as age, temperature-season, breed, physiological stage and management systems (Onasanya et al., 2015). Blood profiles can reflect the health status, adaptability and productive performance of cattle (Yang et al., 2022).
4.5 THI and blood parameters
Elevated levels of THI and solar radiation (Figure 2) produce thermal stress in Peruvian Amazon cattle. Cows and calves evaluated showed fatigue, panting, higher water consumption, lower feed consumption, in monoculture areas, seeking environmental comfort under trees in silvopastoral areas (Figure 2D). Heat-stressed cattle exhibit several thermoregulatory behaviors, including reduced feed intake, increased water consumption, and seeking cooler areas (Herbut et al., 2018; Lee et al., 2021).
Variation in blood parameters can be indicators of heat stress in dairy cows from high THI (Figures 7B, C). Glucose presented strong positive correlation (r=0.65) and hemoglobin strong negative correlation (r=-0.72) with THI in BSxJ cows (Figure 7B).
While in GxH cows triglycerides exhibited a moderate positive correlation (r=0.44) with THI (Figure 7C). Elevated glucose levels have been found in heat stressed cows (Cuiyu et al., 2019); however, they have also determined that high THI can cause a decrease in blood glucose levels (Alves et al., 2014). Blood hemoglobin concentrations tend to decrease with heat stress (Chrast et al., 2023; Berian et al., 2019), although triglycerides show mixed responses, increasing in follicular fluid (Alves et al., 2014).
5 Conclusions
Livestock production in mixed-approach systems is subjected to heat stress (72 < THI ≤ 82) and high solar radiation in monoculture pasture areas; however, silvopastoral areas and the altitudinal gradient mitigate this stress. Cow crossbreds have different responses to heat stress, as in BSxJ blood, glucose and hemoglobin presented strong positive and negative correlations with THI; similarly, in BxH milk, fat presented a strong positive correlation with THI. Milk components varied according to cow crossbreeding and altitudinal origin, finding significant differences (CI:95%) with lower fat content for the BSxJ cow associated with low hemoglobin content and heat stress. Also, at 661 m, the milk presented higher values of fat, solids, density, protein, and salts but with lower values in the freezing point for GxH cows associated with pasture quality. Hematological parameters such as electrolytes Cl- and Na+ tend to be higher in BSxG cows, and Na+ is lower in GxH cows. However, red blood cells and hemoglobin tend to be higher in GxH cows, and lower in BSx- cows. In calves, at lower altitudes, the highest weight gains were for beef-producing BSxB crosses, and at higher altitudes, they were for milk-producing GxH crosses, which were associated with better production management.
Statements
Data availability statement
The original contributions presented in the study are included in the article/supplementary material. Further inquiries can be directed to the corresponding author.
Ethics statement
The animal studies were approved by Elías Alberto Torres Armas (UNTRM), Segundo Roberto Guevara Aranda (UNTRM), Segundo Víctor Olivares Muñoz (UNTRM). The studies were conducted in accordance with the local legislation and institutional requirements. Written informed consent was obtained from the owners for the participation of their animals in this study.
Author contributions
HM-O: Conceptualization, Data curation, Formal Analysis, Funding acquisition, Investigation, Methodology, Project administration, Resources, Supervision, Validation, Visualization, Writing – original draft, Writing – review & editing. LA: Funding acquisition, Investigation, Methodology, Writing – original draft. MM: Methodology, Resources, Validation, Visualization, Writing – original draft. JC: Methodology, Project administration, Supervision, Writing – original draft. MR: Data curation, Investigation, Methodology, Visualization, Writing – original draft. AG: Investigation, Methodology, Project administration, Resources, Writing – original draft. NM: Software, Validation, Visualization, Writing – review & editing.
Funding
The author(s) declare financial support was received for the research and/or publication of this article. The authors would like to thank the “Consejo Nacional de Ciencia, Tecnología e Innovación Tecnológica” (CONCYTEC), through the “Programa Nacional de Investigación Científica y Estudios Avanzados” (PROCIENCIA), under Contract No. PE501079503-2022, for funding equipment, sample collection and analysis, and providing incentives for researchers.
Acknowledgments
We would like to thank the livestock farmers from Yurimaguas (Loreto region), Cuñumbuque, Zapatero, and Calzada (San Martín region) for making their cattle available for this research. We also thank the field technicians and the technical and financial managers of the project.
Conflict of interest
The authors declare that the research was conducted in the absence of any commercial or financial relationships that could be construed as a potential conflict of interest.
Generative AI statement
The author(s) declare that no Generative AI was used in the creation of this manuscript.
Publisher’s note
All claims expressed in this article are solely those of the authors and do not necessarily represent those of their affiliated organizations, or those of the publisher, the editors and the reviewers. Any product that may be evaluated in this article, or claim that may be made by its manufacturer, is not guaranteed or endorsed by the publisher.
References
1
Alvarado-Bolovich V. Medrano J. Haro J. Castro-Montoya J. Dickhoefer U. Gómez C. (2021). Enteric methane emissions from lactating dairy cows grazing cultivated and native pastures in the high Andes of Peru. Livestock Sci.243, 104385. doi: 10.1016/j.livsci.2020.104385
2
Alves B. G. Alves K. A. Martins M. C. Braga L. S. Silva T. H. Alves B. G. et al . (2014). Metabolic profile of serum and follicular fluid from postpartum dairy cows during summer and winter. Reproduction Fertility Dev.26, 866–874. doi: 10.1071/RD13102
3
AOAC-Association of Oficial Analytical Chemists (1990). Official Methods of Analysis of Association ofthe Official Analytical Chemists. 14th edn. Ed. HorwitzW. (Washington. DC, Association of Official Analytical Chemists, Inc.).
4
Baccouri W. Mikó E. Komlósi I. (2023). Heat stress of cattle from embryonic phase until culling. Acta Agraria Debreceniensis1), 11–22. doi: 10.34101/actaagrar/1/12086
5
Belete T. Yadete E. (2023). Effect of mono cropping on soil health and fertility management for sustainable agriculture practices: A review. J. Plant Sci.11, 192–197. doi: 10.11648/j.jps.20231106.13
6
Berian S. Gupta S. K. Sharma S. Ganai I. Dua S. Sharma N. (2019). Effect of heat stress on physiological and hemato-biochemical profile of cross bred dairy cattle. J. Anim. Res.9, 95–101. doi: 10.30954/2277-940x.01.2019.13
7
Carvalho R. P. D. Heid D. M. Davide L. M. Piletti L. M. D. S. Jesus F. L. D. Viegas A. L. (2020). Microclimate and thermal comfort indices in silvopastoral systems under different planting directions and seasons. Rev. Bras. Engenharia Agrícola e Ambiental24, 266–273. doi: 10.1590/1807-1929/agriambi.v24n4p266-273
8
Chrást V. Langová L. Novotná I. Zemanová M. Vrtková I. Urban T. et al (2023). Effect of temperature-humidity index on physiological and haematological indicators in dairy cows. J. Cent. Eur. Agric.24, 802–808. doi: 10.5513/JCEA01/24.4.3960
9
Clariget J. Banchero G. Luzardo S. Fernández E. Pérez E. La Manna A. et al . (2021). Effect of pre-slaughter fasting duration on physiology, carcass and meat quality in beef cattle finished on pastures or feedlot. Res. Veterinary Sci.136, 158–165. doi: 10.1016/j.rvsc.2021.02.018
10
Collier R. J. Doelger S. G. Head H. H. Thatcher W. W. Wilcox C. J. (1982). Effects of heat stress during pregnancy on maternal hormone concentrations, calf birth weight and postpartum milk yield of Holstein cows. J. Anim. Sci.54, 309–319. doi: 10.2527/JAS1982.542309X
11
Collier R. J. Zimbelman R. B. Rhoads R. P. Rhoads M. L. Baumgard L. H. (2011). A re-evaluation of the impact of temperature humidity index (THI) and black globe humidity index (BGHI) on milk production in high producing dairy cows. Western Dairy Manage. Conf. Reno NV. U.S.A., 113–125.
12
Cowley F. C. Barber D. G. Houlihan A. V. Poppi D. P. (2015). Immediate and residual effects of heat stress and restricted intake on milk protein and casein composition and energy metabolism. J. Dairy Sci.98, 2356–2368. doi: 10.3168/jds.2014-8442
13
Cubbage F. Balmelli G. Bussoni A. Noellemeyer E. Pachas A. N. Fassola H. et al . (2012). Comparing silvopastoral systems and prospects in eight regions of the world. Agroforestry Syst.86, 303–314. doi: 10.1007/s10457-012-9482-z
14
Cuiyu Z. Chang Z. Jiang Z. Cheng X. You Z. H. (2019). The relationship between insulin resistance and type II ketosis in dairy cows. Acta Scientiae Veterinariae47, 1–8. doi: 10.22456/1679-9216.93425
15
Dahl G. E. Tao S. Monteiro A. P. A. (2016). Effects of late-gestation heat stress on immunity and performance of calves. J. Dairy Sci.99, 3193–3198. doi: 10.3168/jds.2015-9990
16
Da Silva Morenz A. B. de Carvalho C. A. B. Carnevalli R. A. Morenz D. A. de Barros I. Lulu J. et al . (2024). Dairy cows on integrated livestockforestry system in the tropics. Agroforest Syst.98, 1079–1090. doi: 10.1007/s10457-023-00883-7
17
El-Tarabany M. S. Roushdy E. M. El-Tarabany A. A. (2016). Production and health performance of Holstein, Brown Swiss and their crosses under subtropical environmental conditions. Anim. Production Sci.57, 1137–1143. doi: 10.1071/AN15809
18
Encina Ruiz R. Saucedo-Uriarte J. A. Portocarrero-Villegas S. M. Quispe-Ccasa H. A. Cayo-Colca I. S. (2021). Zoometric characterization of creole cows from the Southern Amazon region of Peru. Diversity13, 510. doi: 10.3390/d13110510
19
França E. L. Silva V. A. Volpato R. M. J. Silva P. A. Brune M. F. S. S. HonorioFrança A. C. (2013). Maternal anemia induces changes in immunological and nutritional components of breast milk. J. Maternal-Fetal Neonatal Med.26, 1223–1227. doi: 10.1017/S2078633612000471
20
Galukande E. Mulindwa H. Wurzinger M. Roschinsky R. Mwai A. O. Sölkner J. (2013). Cross-breeding cattle for milk production in the tropics: achievements, challenges and opportunities. Anim. Genet. Resour.52, 111–125. doi: 10.1017/S2078633612000471
21
García M. Huanca W. Echevarria L. (1990). Reproductive performance of purebred and crossbred Zebu cattle under artificial insemination in the Amazon tropics. Anim. Sci.50, 41–49. doi: 10.1007/s10457-024-01081-9
22
Guo J. Gao S. Quan S. Zhang Y. Bu D. Wang J. (2018). Blood amino acids profile responding to heat stress in dairy cows. Asian-Australasian J. Anim. Sci.31, 47. doi: 10.5713/ajas.16.0428
23
Habimana V. Nguluma A. S. Nziku Z. C. Ekine-Dzivenu C. C. Morota G. Mrode R. et al . (2023). Heat stress effects on milk yield traits and metabolites and mitigation strategies for dairy cattle breeds reared in tropical and sub-tropical countries. Front. Veterinary Sci.10. doi: 10.3389/fvets.2023.1121499
24
Herbut P. Angrecka S. Walczak J. (2018). Environmental parameters to assessing of heat stress in dairy cattle-A review. Int. J. biometeorology62, 2089–2097. doi: 10.1007/s00484-018-1629-9
25
Hermawansyah H. Syamsuryadi B. Mutmainna I. (2021). Physiological response and production ability of beef cattle raised based on different altitudes in sinjai regency. Jurnal Ternak12, 494031. doi: 10.30736/jt.v12i2.116
26
Isik H. B. Topcu Y. Guler O. (2009). Determination of the factors affecting live weight gain using factor analysis and stepwise regression model. J. Appl. Anim. Res.35, 161–164. doi: 10.1080/09712119.2009.9707008
27
Kennedy J. F. Chirchir G. I. K. (1971). A study of the growth rate of F2 and F3 Africander cross, Brahman cross and British cross cattle from birth to 18 months in a tropical environment. Aust. J. Exp. Agric.11, 593–598. doi: 10.1071/EA9710593
28
Kjeldahl J. (1883). A new method for the determination of nitrogen in organic substances. Z. für Analytische Chemie22, 366–83.
29
Kuhnen S. de Mello D. F. M. Honorato L. A. Piccinin I. N. Martins J. Bernardes P. A. et al . (2021). Identification and antimicrobial susceptibility of milk pathogen isolated from dairy production systems. Prev. Vet. Med.194, 105451. doi: 10.1016/j.prevetmed.2021.105451
30
Lee D. H. Jang D. H. Kwon K. S. Ha T. Kim J. B. Lee J. Y. et al . (2021). Analysis of behavioral changes in broilers in a heat stressed environment. J. Korea Academia-Industrial cooperation Society.22, 292–298. doi: 10.5762/kais.2021.22.12.292
31
Liu Z. Ezernieks V. Wang J. Arachchillage N. W. Garner J. B. Wales W. J. et al . (2017). Heat stress in dairy cattle alters lipid composition of milk. Sci. Rep.7, 961. doi: 10.1038/s41598-017-01120-9
32
Loker W. (1993). The human ecology of cattle raising in the Peruvian Amazon: The view from the farm. Hum. Organ.52, 14–24. doi: 10.17730/HUMO.52.1.Y331HJ3125381P44
33
Manriquez-Mendoza L. Y. López-Ortiz S. Olguín-Palacios C. Ponciano P. Á. DíazRivera P. López-Tecpoyotl Z. G. (2011). Productivity of a silvopastoral system under intensive mixed species grazing by cattle and sheep. Trop. Subtropical Agroecosystems13, 573–84. Available at https://www.redalyc.org/articulo.oa?id=93920942037.
34
McManus C. Louvandini H. Carneiro H. C. Lima P. R. M. Neto J. B. (2011). Production indices for dual purpose cattle in central Brazil. Rev. Bras. Zootecnia40, 1576–1586. doi: 10.1590/S1516-35982011000700025
35
Montagnini F. Ibrahim M. Murgueitio E. (2013). Silvopastoral systems and climate change mitigation in Latin America. Bois Forêts Des. Tropiques316, 3–16. doi: 10.19182/bft2013.316.a20528
36
Monteiro A. P. A. Tao S. Thompson I. M. T. Dahl G. E. (2016). In utero heat stress decreases calf survival and performance through the first lactation. J. Dairy Sci.99, 8443–8450. doi: 10.3168/jds.2016-11072
37
Murga L. Vásquez H. Bardales J. (2018). Caracterización de los sistemas de producción de ganado bovino en las cuencas ganaderas de Ventilla, Florida y Leyvaregión Amazonas. Rev. Científica UNTRM: Cienc. Naturales e Ingeniería1, 28–37. doi: 10.25127/UCNI.V1I3.423
38
Murga-Orrillo H. Amasifuén B. P. López L. A. A. Inuma M. C. AbantoRodríguez C. (2024). Cedrelinga catenaeformis (Tornillo) in natural and agroforestry systems: Dendrometry, soil and macrofauna. Trees Forests People16, 100577. doi: 10.1016/j.tfp.2024.100577
39
Murga-Orrillo H. López L. A. A. Mathios-Flores M. A. Coral J. C. García M. R. Saavedra-Ramírez J. et al . (2025). Physiological and Chemical Response of Urochloa brizantha to Edaphic and Microclimatic Variations Along an Altitudinal Gradient in the Amazon. Agronomy15, 1870. doi: 10.3390/agronomy15081870
40
Murga-Orrillo H. Lobo F. D. A. Santos Silva Amorim R. Fernandes Silva Dionisio L. Nuñez Bustamante E. Chu-Koo F. W. et al . (2023). Increased production of tara (Caesalpinia spinosa) by edaphoclimatic variation in the altitudinal gradient of the Peruvian Andes. Agronomy13, 646. doi: 10.3390/agronomy13030646
41
Najarnezhad Mashhadi V. Mishmast Z. Mohri M. Seifi H. A. (2009). Variation of serum calcium, phosphorus and magnesium concentrations due to venipuncture site in Holstein dairy cows. Comp. Clin. Pathol.18, 149–152. doi: 10.1007/s00580-008-0760-0
42
National Research Council (US) (1971). A Guide to Environmental Research on Animals (Washington, DC, The National Academies Press).
43
Nogara K. F. Busanello M. Horst J. A. Zopollatto M. (2024). Influence of production level, number, and stage of lactation on milk quality in compost barn systems. Anais da Academia Bras. Ciências96, e20221063. doi: 10.1590/0001-3765202420221063
44
Onasanya G. O. Oke F. O. Sanni T. M. Muhammad A. I. (2015). Parameters influencing haematological, serum and bio-chemical references in livestock animals under different management systems. Open J. Veterinary Med.5, 181. doi: 10.4236/OJVM.2015.58025
45
Peri P. L. Hansen N. E. Bahamonde H. A. Lencinas M. V. von Müller A. R. Ormaechea S. et al . (2016). Silvopastoral Systems Under Native Forest in Patagonia Argentina. In PeriP.DubeF.VarellaA.(eds) Silvopastoral systems under native forest in Patagonia Argentina. Silvopastoral Syst. South. South America. Advances in Agroforestry, Springer, Cham.11, 117–168. doi: 10.1007/978-3-319-24109-8_6
46
Pezzopane J. R. M. Nicodemo M. L. F. Bosi C. Garcia A. R. Lulu J. (2019). Animal thermal comfort indexes in silvopastoral systems with different tree arrangements. J. Thermal Biol.79, 103–111. doi: 10.1016/j.jtherbio.2018.12.015
47
R Core Team (2024). A Language and Environment for Statistical Computing, version 4.1.0. R Foundation for Statistical Computing, Vienna, Austria. Available online: https://www.r-project.org/ (accessed on July 20, 2024).
48
Rook J. A. F. Campling R. C. (1965). Effect of stage and number of lactation on the yield and composition of cow's milk. J. Dairy Res.32, 45–55. doi: 10.1017/S0022029900018367
49
Saeed O. A. Jaber B. T. Mohammed M. T. A. Sani U. M. Ziara K. S. Saad H. M. (2021). Impacts of heat stress on blood metabolic in different periods of lactation and pregnancy in Holstein cows. In IOP Conference Series. Earth Environ. Sci.779, 12013. doi: 10.1088/1755-1315/779/1/012013
50
Samfira I. Moisuc A. Sărăţeanu V. Bostan C. Haş C. E. (2010). The influence of the altitude gradient on grasslands features. Res. J. Agric. Sci.42, 531–535.
51
SENAMHI-Servicio Nacional de Meteorología e Hidrología del Perú (2024). Available online at: https://www.senamhi.gob.pe/?&p=estaciones (Accessed July 22, 2024).
52
Sigdel A. Abdollahi-Arpanahi R. Aguilar I. Peñagaricano F. et al . (2019). Whole genome mapping reveals novel genes and pathways involved in milk production under heat stress in US Holstein cows. Front. Genet.10, 928. doi: 10.3389/fgene.2019.00928
53
Tao S. Dahl G. E. Laporta J. Bernard J. K. Orellana Rivas R. M. Marins T. N. (2019). Physiology symposium: Effects of heat stress during late gestation on the dam and its calf. J. Anim. Sci.97, 2245–2257. doi: 10.1093/jas/skz061
54
Ternman E. Nilsson E. Nielsen P. P. Pastell M. Hänninen L. Agenäs S. (2019). Rapid eye movement sleep time in dairy cows changes during the lactation cycle. J. Dairy Sci.102, 5458–5465. doi: 10.3168/jds.2018-15950
55
Treacher R. J. Little W. Collis K. A. Stark A. J. (1976). The influence of dietary protein intake on milk production and blood composition of high-yielding dairy cows. J. Dairy Res.43, 357–369. doi: 10.1017/S0022029900015946
56
Vargas-Leitón B. Romero-Zúñiga J. J. Rojas J. Galina C. S. Martínez J. F. (2024). Lifetime milk production of Holstein cattle in the humid tropics compared to Holstein-Gyr and Holstein-Brahman crosses. Reprod. Domest. Anim.59, e14582. doi: 10.1111/rda.14582
57
Veiga J. B. Tourrand J. F. Poccard-Chapuis R. Piketty M. G. (2002). Cattle ranching in the Amazon rainforest. Anim. Production24, 253–256.
58
Vieira F. M. C. Pilatti J. A. Czekoski Z. M. W. Fonsêca V. F. Herbut P. Angrecka S. et al . (2021). Effect of the silvopastoral system on the thermal comfort of lambs in a subtropical climate: A preliminary study. Agriculture11, 790. doi: 10.3390/agriculture11080790
59
Wang J. Li J. Wang F. Xiao J. Wang Y. Yang H. et al . (2020). Heat stress on calves and heifers: a review. J. Anim. Sci. Biotechnol.11, 1–8. doi: 10.1186/s40104-020-00485-8
60
Wang Z. Luo T. Li R. Tang Y. Du M. (2012). Causes for the unimodal pattern of biomass and productivity in alpine grasslands along a large altitudinal gradient in semi-arid regions. J. Vegetation Sci.24, 189–201. doi: 10.1111/J.1654-1103.2012.01442.X
61
Windberger U. Sparer A. Huber J. (2023). Cow blood–A superior storage option in forensics? Heliyon9, e14296. doi: 10.1016/j.heliyon.2023.e14296
62
Wu D. Vinitchaikul P. Deng M. Zhang G. Sun L. Gou X. et al . (2020). Host and altitude factors affect rumen bacteria in cattle. Braz. J. Microbiol.51, 1573–1583. doi: 10.1007/s42770-020-00380-4
63
Yang Y. Yang S. Tang J. Ren G. Shen J. Huang B. et al . (2022). Comparisons of hematological and biochemical profiles in Brahman and Yunling cattle. Animals12, 1813. doi: 10.3390/ani12141813
64
Yang S. Zheng J. He S. Yuan Z. Wang R. Wu D. (2023). Exploring the elevation dynamics of rumen bacterial communities in Barn feeding cattle from 900 to 3,600 meters by full-length 16S sequencing. Front. Veterinary Sci.10. doi: 10.3389/fvets.2023.1169573
65
Yuan Jiang S. K. D. Liu Q. R. Huang X. X. (2004). Effect of altitudinal gradient on yield and quality of sub-alpine meadow on the Xiaowutai Mountain in northern China. Can. J. Plant Sci.84, 529–531. doi: 10.4141/P03-001
66
Yue S. Ding S. Zhou J. Yang C. Hu X. Zhao X. et al . (2020). Metabolomics approach explore diagnostic biomarkers and metabolic changes in heat-stressed dairy cows. Animals10, 1741. doi: 10.3390/ANI10101741
Summary
Keywords
temperature, tropical climate, milk, hematological parameters, Amazon
Citation
Murga-Orrillo H, Arévalo López LA, Mathios Flores MA, Cáceres Coral J, García MR, Guerra Teixeira AA and Valderrama NLM (2025) Silvopasture and altitudinal gradient reduce heat stress in livestock production in the Peruvian tropics. Front. Anim. Sci. 6:1521790. doi: 10.3389/fanim.2025.1521790
Received
02 November 2024
Accepted
16 June 2025
Published
26 August 2025
Volume
6 - 2025
Edited by
Edward Narayan, Southern Cross University, Australia
Reviewed by
Musadiq Idris, Islamia University of Bahawalpur, Pakistan
Oyegunle Emmanuel Oke, Federal University of Agriculture, Nigeria
Updates
Copyright
© 2025 Murga-Orrillo, Arévalo López, Mathios Flores, Cáceres Coral, García, Guerra Teixeira and Valderrama.
This is an open-access article distributed under the terms of the Creative Commons Attribution License (CC BY). The use, distribution or reproduction in other forums is permitted, provided the original author(s) and the copyright owner(s) are credited and that the original publication in this journal is cited, in accordance with accepted academic practice. No use, distribution or reproduction is permitted which does not comply with these terms.
*Correspondence: Hipolito Murga-Orrillo, hmurga@unaaa.edu.pe
Disclaimer
All claims expressed in this article are solely those of the authors and do not necessarily represent those of their affiliated organizations, or those of the publisher, the editors and the reviewers. Any product that may be evaluated in this article or claim that may be made by its manufacturer is not guaranteed or endorsed by the publisher.