- 1Shanghai Academy of Agricultural Sciences, Institute of Animal Husbandry and Veterinary Medicine, Shanghai, China
- 2Anhui Academy of Agricultural Sciences, Institute of Animal Husbandry and Veterinary Medicine, Hefei, China
Objective: This study aimed to elucidate the molecular and microbial mechanisms underlying feather coverage in laying hens, with implications for understanding epithelial homeostasis and potential translational applications in tissue regeneration. By integrating multi-omics approaches, we sought to identify key genetic and microbial determinants of feather morphology and their synergistic effects on host physiology.
Methods: A retrospective analysis was conducted on 400 laying hens classified into high (H) and low (L) feather coverage groups using a standardized 4-point scoring system. Transcriptomic profiling of cecal tissue was performed via RNA sequencing, while gut microbiota composition was analyzed using 16S rRNA amplicon sequencing. Differential gene expression and pathway enrichment were assessed using DESeq2 and clusterProfiler. Microbial community structure was evaluated through LEfSe analysis, and interplay between host transcripts and microbiota was examined via coinertia analysis.
Results: Key findings revealed distinct microbial signatures in the L group, characterized by elevated Bacteroidetes (P < 0.01) and reduced Firmicutes (P < 0.01) abundance compared with the H group. Transcriptomic analysis identified dysregulation of pathways involved in epithelial remodeling (Wnt/β-catenin, TGF-β) and structural integrity (BMP and keratin family genes). Integration of multi-omics data demonstrated significant correlations between microbial composition and host gene expression (P < 0.05), highlighting the synergistic regulation of feather morphogenesis via microbial-metabolite crosstalk.
Conclusions: This study elucidates the intricate interplay between host genetics and gut microbiota in regulating feather coverage, providing insights into epithelial biology and potential therapeutic targets for tissue homeostasis disorders. The findings underscore the importance of microbiome modulation in optimizing physiological traits relevant to avian health and agricultural productivity.
1 Introduction
Feather coverage is a crucial physiological indicator for assessing the health and productivity of laying hens, with a pivotal role in egg production and poultry management (Leinonen et al., 2012). Among the factors influencing hen health, environmental temperature is particularly significant (Kim et al., 2020). Furthermore, the relationship between feather coverage and environmental conditions is important in terms of understanding physiological responses to temperature fluctuations (Herremans et al., 1989). However, current research in layer breeding has not sufficiently addressed the role of feather coverage in managing avian diseases or optimizing production efficiency. Specifically, reduced feather coverage under cold conditions has been shown to increase feed intake, potentially leading to feed conversion inefficiencies and indirectly impacting overall productivity. Moreover, the association between reduced feather coverage and pecking behavior, a common avian behavior, has not been thoroughly explored. Given the interplay between environmental factors and avian behavior, further studies are necessary to elucidate the mechanisms underlying these relationships, providing valuable insights into hen health management and dietary optimization, ultimately enhancing the sustainability and profitability of egg production systems.
Feathers serve essential physiological functions, particularly in low-temperature environments, where they act as effective insulators, helping laying hens maintain stable body temperatures and reduce heat loss. When temperatures drop below 13°C, heat dissipation in featherless regions increases significantly, particularly through radiation and convection. For each additional point in feather score, feed intake increases by ~7–9% (Hughes, 1980). Given the dual roles of feathers in thermoregulation and production efficiency, we hypothesize that an appropriate balance of feather coverage is crucial for the optimal performance of laying hens. Conversely, in high-temperature environments, excessive feather coverage can impede skin heat dissipation, adversely affecting laying hens. Hens with partial feather loss exhibit better laying rates compared with those with full feather coverage, particularly at 18–26°C (Cheng et al., 1991; Tullett et al., 1980). Within this optimal temperature range, moderate feather loss can enhance production performance. For instance, Ross breed laying hens with 6%, 11%, and 17% feather removal from the neck and chest regions at 18–24°C demonstrated significantly higher average daily egg production and laying rates compared with fully feathered controls (Tullett et al., 1980). Feather coverage is closely linked to feed consumption, given that reduced coverage in high-temperature environments can lead to increased heat dissipation and higher feed intake (van Krimpen et al., 2014). Furthermore, primary causes of decreased feather coverage include feather pecking and molting (Shi et al., 2019), which are influenced by factors such as seasonal changes, physiological states, and disease. These factors can alter the appearance of laying hens, accelerate heat loss, and necessitate increased feed intake to compensate for energy deficits, thereby raising production costs and reducing economic efficiency. Therefore, investigating feather coverage in laying hens is of significant importance.
The gut microbiota has a crucial role in the physiology of laying hens (Wu et al., 2024), mediating interactions between protein metabolism and host immune responses. It participates in the digestion, absorption, metabolism, and transformation of dietary proteins in the gastrointestinal tract, with its metabolites influencing various physiological functions related to host health and disease. Dysregulation of the gut microbiome is associated with a range of diseases, including not only intestinal disorders but also extra-intestinal conditions, such as metabolic and neurological diseases. Given the importance of feather coverage in the production performance of laying hens and the crucial role of the gut microbiota in their physiology, studying the relationship between these factors holds substantial theoretical and practical value. Thus, this study used multi-omics analysis to explore the factors influencing feather coverage in laying hens and the interplay between the microbial community and gene expression, thereby providing a scientific basis for improving the production performance and health of laying hens.
2 Materials and methods
2.1 Establishment of high- and low-feather cover groups of laying hens
Feather coverage was scored using a 4-point method founded on the 6-zone 4-point scoring system proposed by Kjaer et al. (2005). A total score of ≤10–12 indicated severe damage to the overall body feathers (classified as low feather coverage), whereas good feather cover was indicated by a score of ≥3 for a single body part and a total score ≥18–20 (classified as high feather coverage). This study utilized 400 day-old Xinyang black-feathered laying hens, provided by the Anhui Academy of Agricultural Sciences. These hens were housed in fully enclosed cages, fed the same diet, and subjected to identical feeding management practices, including epidemic prevention measures. Notably, no feather pecking behavior was observed. Their feather coverage was evaluated using the feather score system, and their production performance was calculated. The high-feather cover group (H) and the low-feather cover group (L) each comprised 200 hens. The groups exhibited no significant difference in production performance, but did demonstrate a difference in feather cover, indicating that they were suitable for studying the feather growth mechanism of laying hens. Using a stratified random sampling method based on feather scores, 12 chickens were randomly selected from each group for cervical vertebrae dislocation. Group L comprised XYH25M, XYH26M, XYH31M, XYH32M, XYH36M, XYH37M, and XYH39M, whereas Group H comprised XYH18M, XYH24M, XYH28M, XYH29M, and XYH30M. Subsequently, cecal, cecal content, skin, and blood samples were collected, and slaughter traits (feather coverage, body weight, abdominal fat weight, semi-eviscerated weight, spleen weight, gizzard weight, oviduct weight, shank length, and duodenum length) were determined.
2.2 Sample collection
A rapid, precise neck - stretching maneuver was executed to induce instantaneous euthanasia in accordance with the approved ethical protocols of Shanghai Academy of Agricultural Sciences. The protocols involved a pre - determined, carefully - calibrated force and motion application to ensure a swift and painless death. These procedures were designed and regularly reviewed by an institutional animal care and use committee (IACUC) to meet national and international animal welfare standards. Post - euthanasia, each hen was placed in a supine position. The surgical site was sterilized and a sterile scalpel was used to incise the skin and muscle along the abdominal midline, starting at the xiphoid process, exposing the abdominal cavity.
2.2.1 Collection of cecal contents
Sterile tweezers were used to gently clamp one end of the cecum and the unclamped end was placed into a sterile centrifuge tube. A sterile pipette was utilized to inject 5 mL of sterile saline into the cecum, flushing out the cecal contents, which were collected in the centrifuge tube for analyses.
2.2.2 Collection of cecal tissue
The surface of the cecum was flushed with saline to remove surface contaminants, such as feces and blood. Care was taken to avoid overflushing, which could damage the tissue. Subsequently, the cecum was held with sterile tweezers and a sterile surgical blade was used to scrape the cecal mucosal tissue into a sterile centrifuge tube for examination.
2.3 Transcriptome data acquisition and analysis
Three samples of cecal tissue were randomly selected from Group L (XYH31M, XYH32M, and XYH37M) and Group H (XYH24M, XYH29M, and XYH30M) for transcriptome sequencing. Raw data collection was completed by Personalbio Company (Shanghai, China).
2.3.1 RNA extraction and quality inspection
Total RNA was extracted from the selected samples using the Solarbio RNAiso Plus Kit following the manufacturer’s instructions. The quality and quantity of the extracted RNA were assessed using a spectrophotometer and agarose gel electrophoresis. Only RNA samples with high integrity (RNA integrity number, RIN ≥ 7) and sufficient concentration were used for subsequent library construction.
2.3.2 Library construction and quality inspection
The mRNA containing a polyA tail was enriched by Oligo(dT) magnetic beads and broken into ~300-bp fragments by ion interruption. With RNA as a template, six-base random primers and reverse transcriptase were used to synthesize first-strand cDNA, which was then utilized as the template to synthesize second-strand cDNA. After library construction, PCR amplification was used to enrich the library fragments, and the library was then selected according to fragment size (450 bp). The library was inspected using an Agilent 2100 Bioanalyzer, and its total concentration and effective concentration were determined. Based on the effective concentration of the library and the amount of data required, libraries containing different Index sequences were mixed together and the resulting hybrid library was uniformly diluted to 2 nM; a single-strand library was formed by alkali denaturation.
2.3.3 Computer sequencing on the Illumina platform
After RNA extraction, purification, and library construction, the library was paired-end (PE) sequenced using Next-Generation Sequencing (NGS) based on the Illumina sequencing platform.
2.3.4 Data preprocessing
The image files obtained after the samples were sequenced were converted by the sequencing platform to generate raw FASTQ data. Data filtering with Cutadapt software was set to at least a 10-bp overlap (AGATCGGAAG), allowing a 20% base error rate. FastQC software was used to evaluate the quality of the original sequencing data, including the distribution of sequencing quality value, GC content, and sequence length distribution. The data quality was visualized to determine any low-quality areas or outliers.
2.3.5 Comparison with the reference genome
Tophat2 software (http://ccb.jhu.edu/software/hisat2/index.shtml) was used to compare the raw sequencing data with the reference chicken genome (Gallus gallus. GRCg6a, NCBI). The distribution of reads on the genome was compared statistically, and the localization regions were divided into the coding region (CDS), intron, intergenic region, and 5’ and 3’-untranslated regions (UTR).
2.3.6 Gene expression level
The level of gene expression was analyzed using the fragments per kilobase of exon per million mapped reads (FPKM) homogenization method (Equation 1)
2.3.7 Differential gene screening
Raw gene expression counts were normalized using the DESeq2 R package (v1.36.0) to account for library size variations and sequencing depth. Low-expression genes (mean counts < 10 across all samples) were filtered to reduce noise. Differentially expressed genes (DEGs) were identified using the DESeq2 workflow. Briefly, a negative binomial generalized linear model (GLM) was applied to raw counts, incorporating sample grouping information. For validation, the edgeR package (v3.38.4) was employed with a quasi-likelihood F-test approach to handle biological variability. Genes were classified as DEGs if they met |log2 fold change (log2FC)| > 1 and adjusted p-value (FDR) < 0.01, with the Benjamini-Hochberg FDR correction method used for multiple testing correction. These thresholds ensured robust identification of biologically relevant changes while controlling false positives. DEG lists were further refined by removing genes with inconsistent expression trends across replicates or ambiguous functional annotations. Final candidate DEGs were visualized using volcano plotsand heatmaps.
2.3.8 Differential gene enrichment analysis
Differentially expressed genes were identified using the FindMarkers function in the Seurat R package (v4.0.0) with default parameters. Genes with an absolute log2 fold change (|log2FC|) > 1 and adjusted p-value (Benjamini-Hochberg correction) < 0.01 were considered statistically significant. GO enrichment analysis was performed using the clusterProfiler R package (v4.0.0). Enriched terms were identified via hypergeometric testing, with significance thresholds set at p < 0.05 and a false discovery rate (FDR) q-value < 0.2. Terms were categorized into biological processes (BP), molecular functions (MF), and cellular components (CC). KEGG pathway enrichment was conducted using the enrichKEGG function in clusterProfiler. Pathways with p < 0.05 and gene counts ≥ 5 were retained for visualization.
2.4 Spectrum analysis of microbial community diversity
2.4.1 Original double-ended sequencing
The Illumina platform was used for paired-end sequencing of community DNA fragments using the raw sequencing data stored in FASTQ format.
2.4.2 Sequence denoising or clustering
DADA2 and Vsearch were used for sequence denoising or clustering. DADA2 (Callahan et al., 2016) involves primer removal, quality filtering, denoise removal, splicing, and chimera removal, and results in amplicon sequence variants (ASVs), or feature sequences (corresponding to operational taxonomic unit (OTU) sequences). However, because DADA2 has not yet been adapted to all amplicon types, OTU clustering-based Vsearch (Rognes et al., 2016) was also used in this study.
2.4.3 Functional gene correction using RDP FrameBot
RDP FrameBot (https://github.com/rdpstaff/Framebot) was used to correct for frameshift, insertion and deletion errors. The filter threshold of amino acid length was set to 50, and the de novo mode was enabled. The resulting corrected nucleic acid sequence was used for subsequently analysis, once the nontarget fragments had been removed.
2.4.4 Sequence length distribution
The length distribution of the high-quality ASV feature sequences and OTU representative sequences were counted and analyzed to determine whether these were comparable to those of the target fragment, and whether there were abnormal length sequences. This analysis included singleton sequences.
2.4.5 Microbiota taxonomy
QIIME2 (2019.4) software was used to compare the ASV and OUT sequences obtained with reference sequence databases as follows: (i) Greengenes (http://greengenes.secondgenome.com/; DeSantis et al., 2006) and Silva (www.arb-silva.de; Quast et al., 2013) for the 16S rRNA genes of bacteria or archaea; (ii) BLASTn (https://blast.ncbi.nlm.nih.gov/Blast.cgi) and Silva for 18S ribosomal RNA genes in eukaryotic microorganisms; (iii) UNITE (https://unite.ut.ee/; Kõljalg et al., 2013) for ITS sequences of fungi; and (iv) BLAST for functional gene selection localization.
The Classify-sklearn algorithm of QIIME2 was used in conjunction with Greengenes and Silva (https://github.com/QIIME2/q2-feature-classifier; Bokulich et al., 2018). The algorithm uses default parameters in QIIME2 for species annotation using a pre-trained Naive Bayes classifier for the feature sequence of each ASVs or the representative sequence of each OTU. The BROCC algorithm was used for the nt or nr databases (https://github.com/kylebittinger/q2-brocc#the-brocc-algorithm). BLASTn or BLASTx were used to compare the sequences with nucleic acid or protein sequences in the nt or nr databases.
2.4.6 Phylogenetic tree construction
QIIME 2 (using the qiime phylogeny align-to-tree-mafft-fasttree command (Katoh et al., 2002)) and FastTree (Price et al., 2009) were used to build a phylogenetic tree using the microbiota sequences determined in section 1.4.5.
2.4.7 Standardizing ASV/OTU tables via rarefaction
A sparse (rarefaction) method was used to obtain the number of sequences from the ASV/OTU abundance tables to reach the uniform depth required to predict the ASVs or OTUs that can be observed at the sequencing depth used, and the relative growth of microbial diversity (Kemp and Aller, 2004; Ugarelli et al., 2024), which is also known as the extraction of the level. The software used was QIIME2 (2019.4), using the qiime feature-table rarefy function, set as the lowest sample sequence of 95%.
2.4.8 Species diversity indices
The species diversity of the microbiota samples from the hens in the different feather coverage groups was assessed using alpha diversity (reflecting the richness, diversity, and evenness of species in locally uniform habitats, also known as intrahabitat diversity (Martínez-Roldán et al., 2024) and beta diversity (Puzachenko and Markova, 2014) based on the following metrics: (i) Chao1 and Observed species indices (species richness); (ii) Shannon and Simpson indices (community species diversity); (iii) Faith’s PD index (evolution-based diversity); (v) Pielou’s evenness index (species evenness); and (vi) Good’s coverage index (species coverage). The analysis software used was QIIME2 (2019.4). For grouped samples (i.e., where the number of samples in each group ≥3), the Kruskal-Wallis rank sum test and Dunn’s test were used as post hoc tests to verify the significance of differences (Kruskal-Wallis test was equivalent to the Wilcoxon test for both groups of samples).
2.4.9 Linear discriminant analysis effect size analysis
Linear discriminant analysis (LDA) effect size (LEfSe) analysis, which combines nonparametric Kruskal-Wallis and Wilcoxon rank sum tests with LDA effect sizes, was used to determine the species data most likely to explain the differences between the different feather coverage groups. In the analysis, the collected data were preprocessed and standardized and the Kruskal-Wallis test was used for multi-group difference analysis to determine whether there were significant differences between the groups. When the overall difference was significant, pairwise comparison between groups was performed. For species that showed significant multi-group differences, different comparison strategies were used to identify the species to be tested. The Wilcoxon test was utilized to test the significance of differences between groups, with the test strategy aligned with the comparison strategy. LDA analysis was performed on the identified differential species to be tested, and the LDA score of each feature was calculated based on an LDA threshold of > 3.0. Only species passing the threshold were considered as biomarkers. The results were displayed as a histogram of the LDA value distribution of significantly different species and the taxonomic branch diagram of species.
2.5 Combined transcriptome and microbiome analysis
2.5.1 CIA co-inertia analysis
The diversity composition spectrum and transcriptomic data at the genus level were sorted by principal component analysis (PCA) and then CIA analysis was performed using the R software package “ade4.”
2.5.2 Correlative heat map analysis
Mothur software was used to calculate the Spearman’s rank correlation coefficient between transcriptomic data and microbiota abundance of the two feather-coverage groups. R software was used to draw heat maps based on the results of the correlation coefficient matrix (where -1 < rho <0 indicated the two were negatively correlated; 0 < rho < 1 indicated the two were positively correlated, and rho = 0 indicated no correlation between the two), and correlation verification result using *_p.values_dm.txt (where the P value is the correlation test value of the two; the lower the P value, the higher the accuracy of the verification results).
3 Results
3.1 Comparison of phenotypic data of laying hens with high and low feather coverage
The feather score of Group H was significantly higher than that of Group L (P < 0.05), indicating that group H had superior feather coverage (Figure 1). Although the mean values of body weight, abdominal fat weight, semi-eviscerated weight, spleen weight, oviduct weight, shank length, and duodenum length were higher in Group H than those in Group L, the differences were not statistically significant (Figure 1). Similarly, mean values of heart weight, liver weight, muscle and gizzard weight, and oviduct length were lower in Group H than in Group L, the differences were also not statistically significant (Figure 1). The lengths of the jejunum, ileum, and cecumwere similar between Group H and Group L (Figure 1).
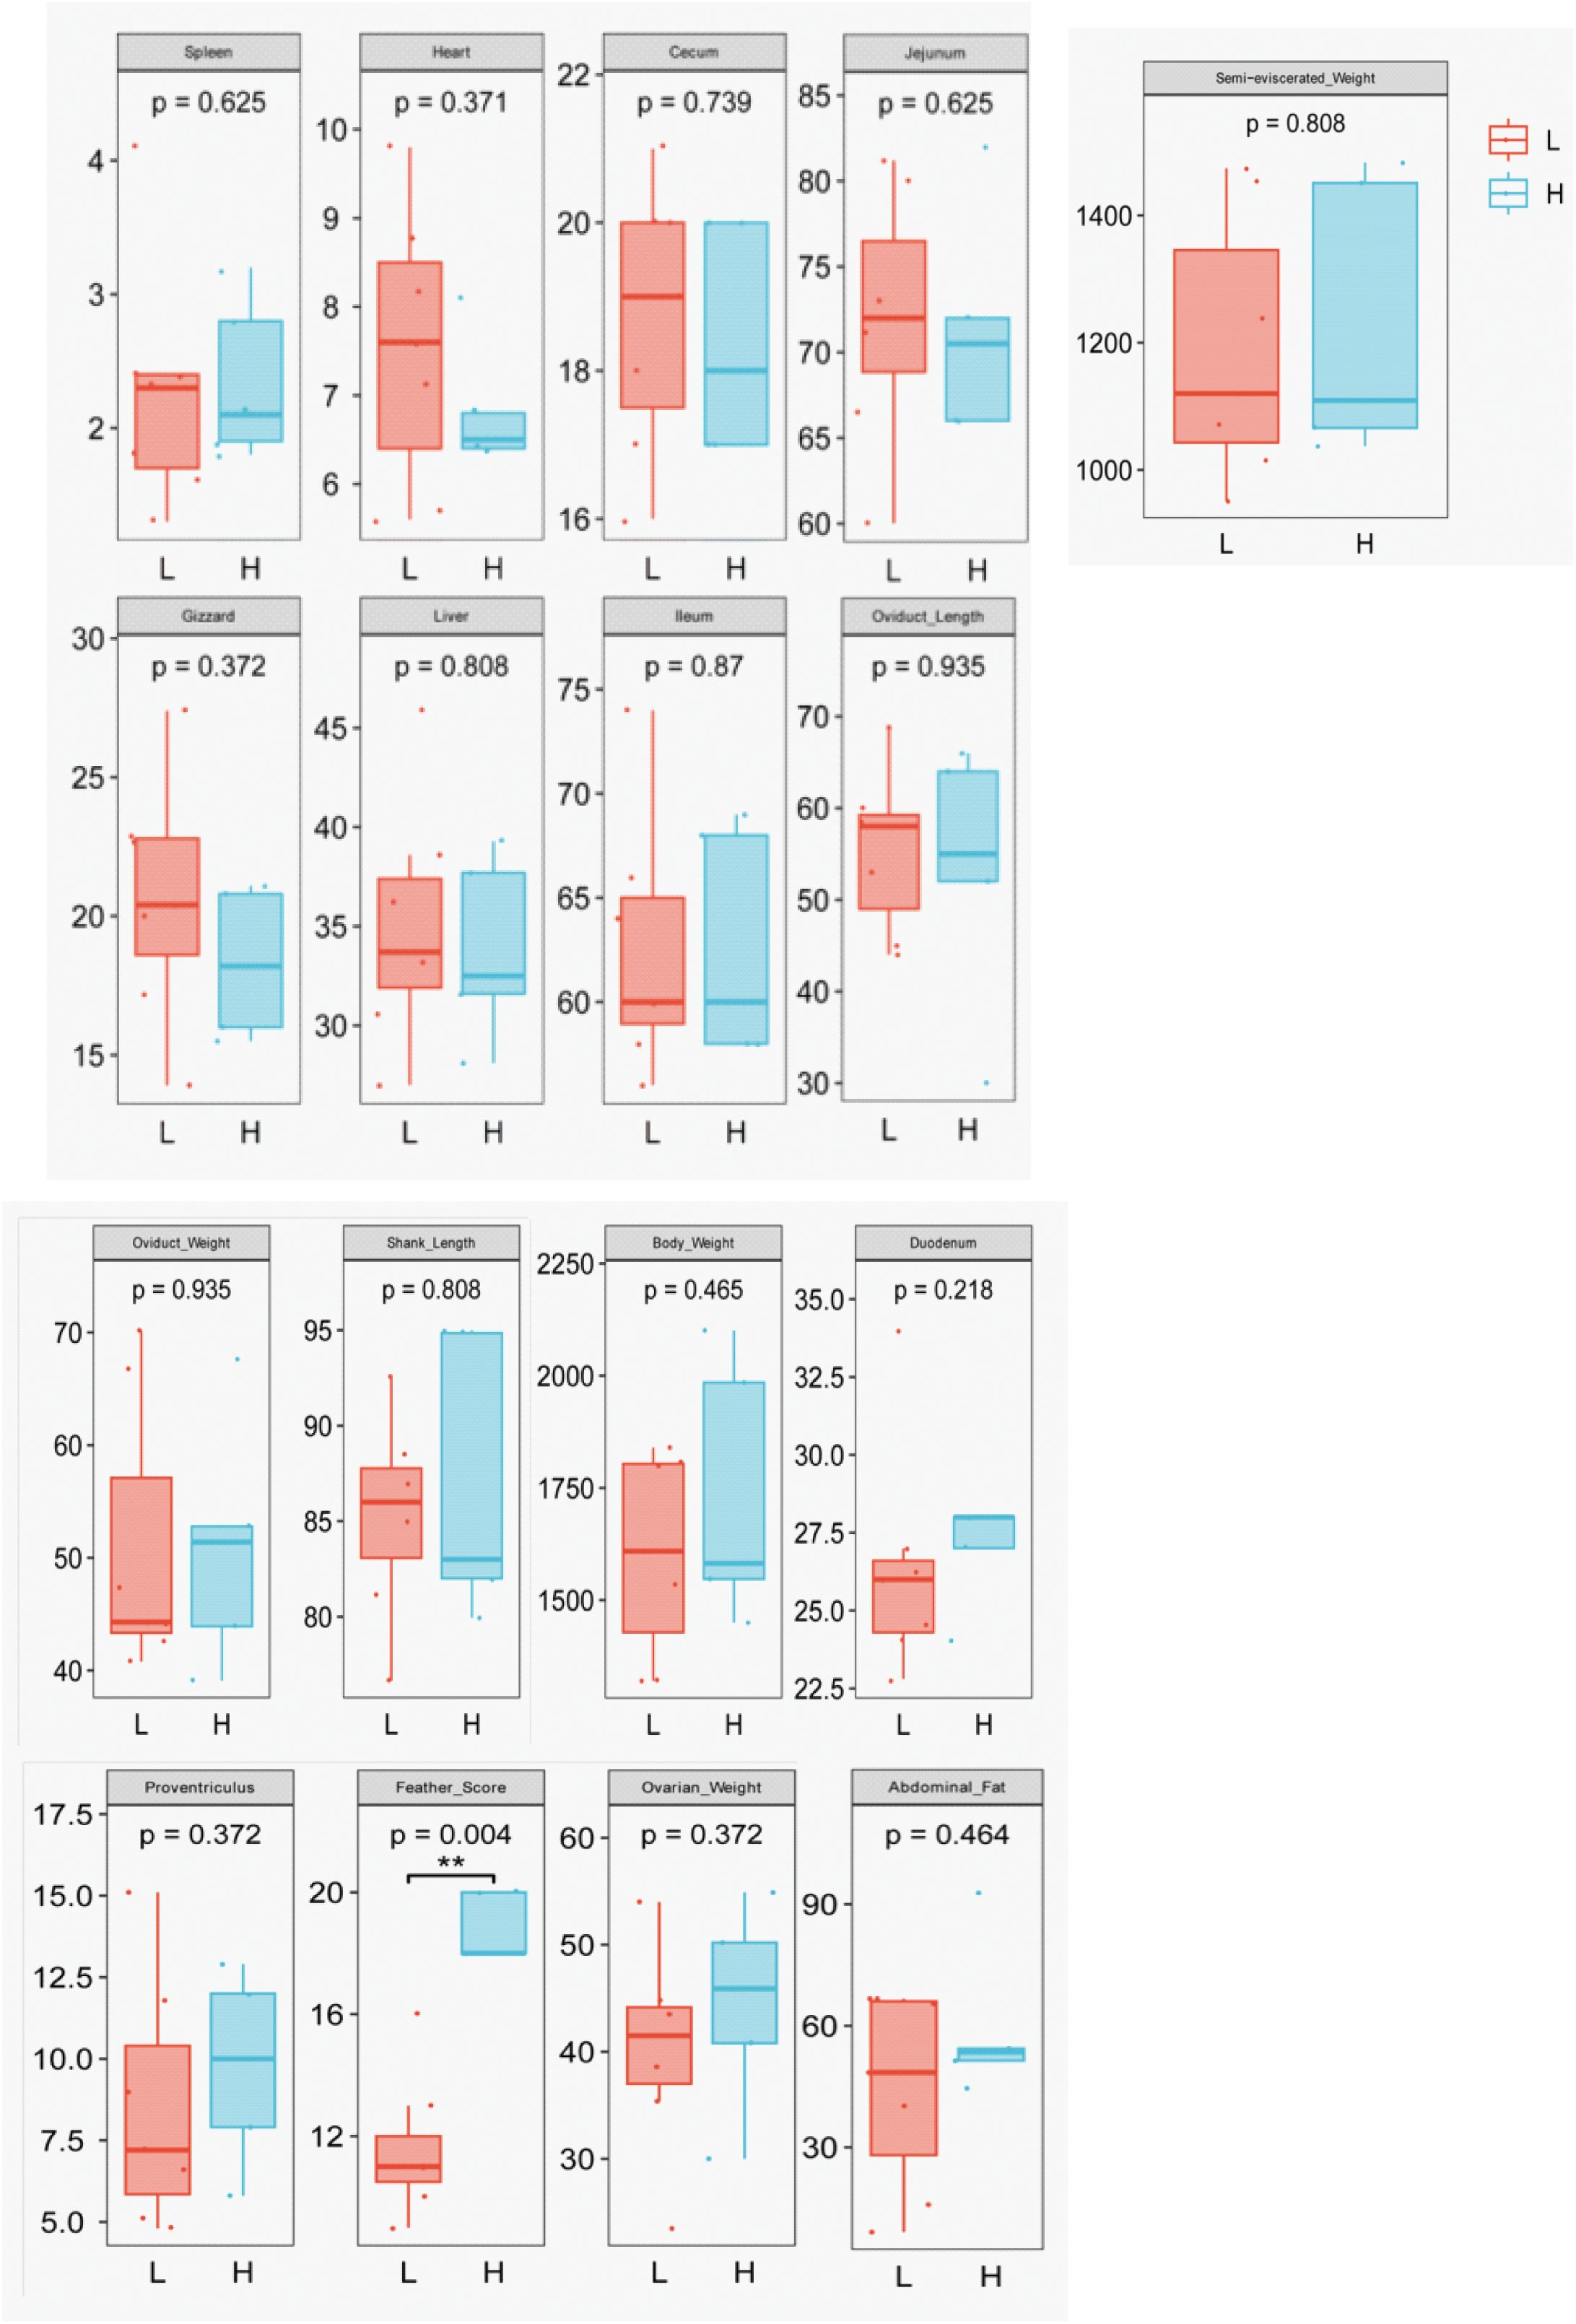
Figure 1. Phenotypic data of laying hens with different feather coverage. L, low feather coverage; H, high feather coverage. Individual data points indicate the measured values of each individual sample. Box and whisker plots represent means ± standard deviation. Asterisks are used for significance indication. **P < 0.01 means extremely significant difference, and *P < 0.05 indicates a significant difference. The same below.
3.2 The 16S amplicon sequence denoising
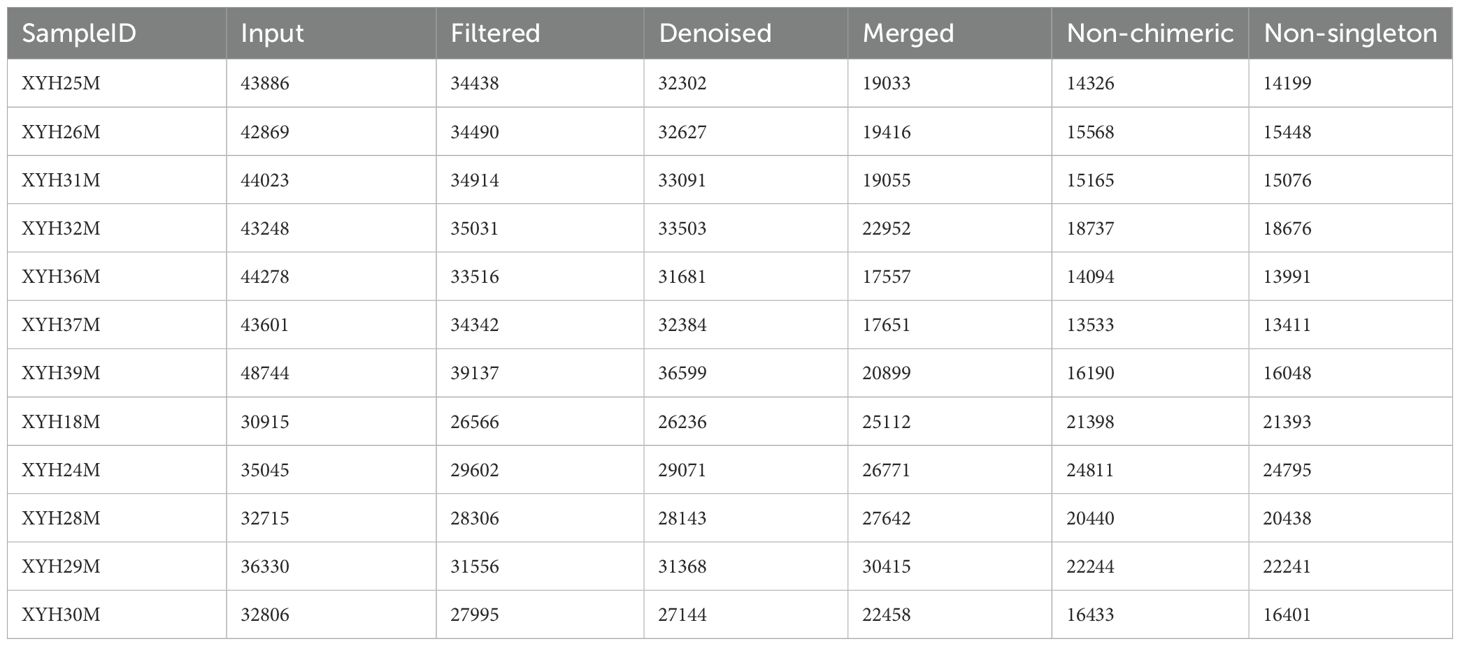
The initial input data for different samples ranged from 30,915 to 48,744 reads. After quality filtering, the data volume of all samples decreased. The original input data volume of 478,460 reads was reduced by ~21.80% to 374,149 reads following the filtered and denoised steps (Table 1). Given the similarity in microbial community structure and sequencing quality at both ends of the fragments across samples, along with the sequence diversity within each sample, the combined data volume was substantially decreased.
3.3 Alpha diversity index of groups L and H
The Alpha diversity metrics of Chao1, Faith_pd, Shannon, Simpson, Pielou_e, and Observed_species were significantly higher in Group L than in Group H (P < 0.01) (Figure 2).
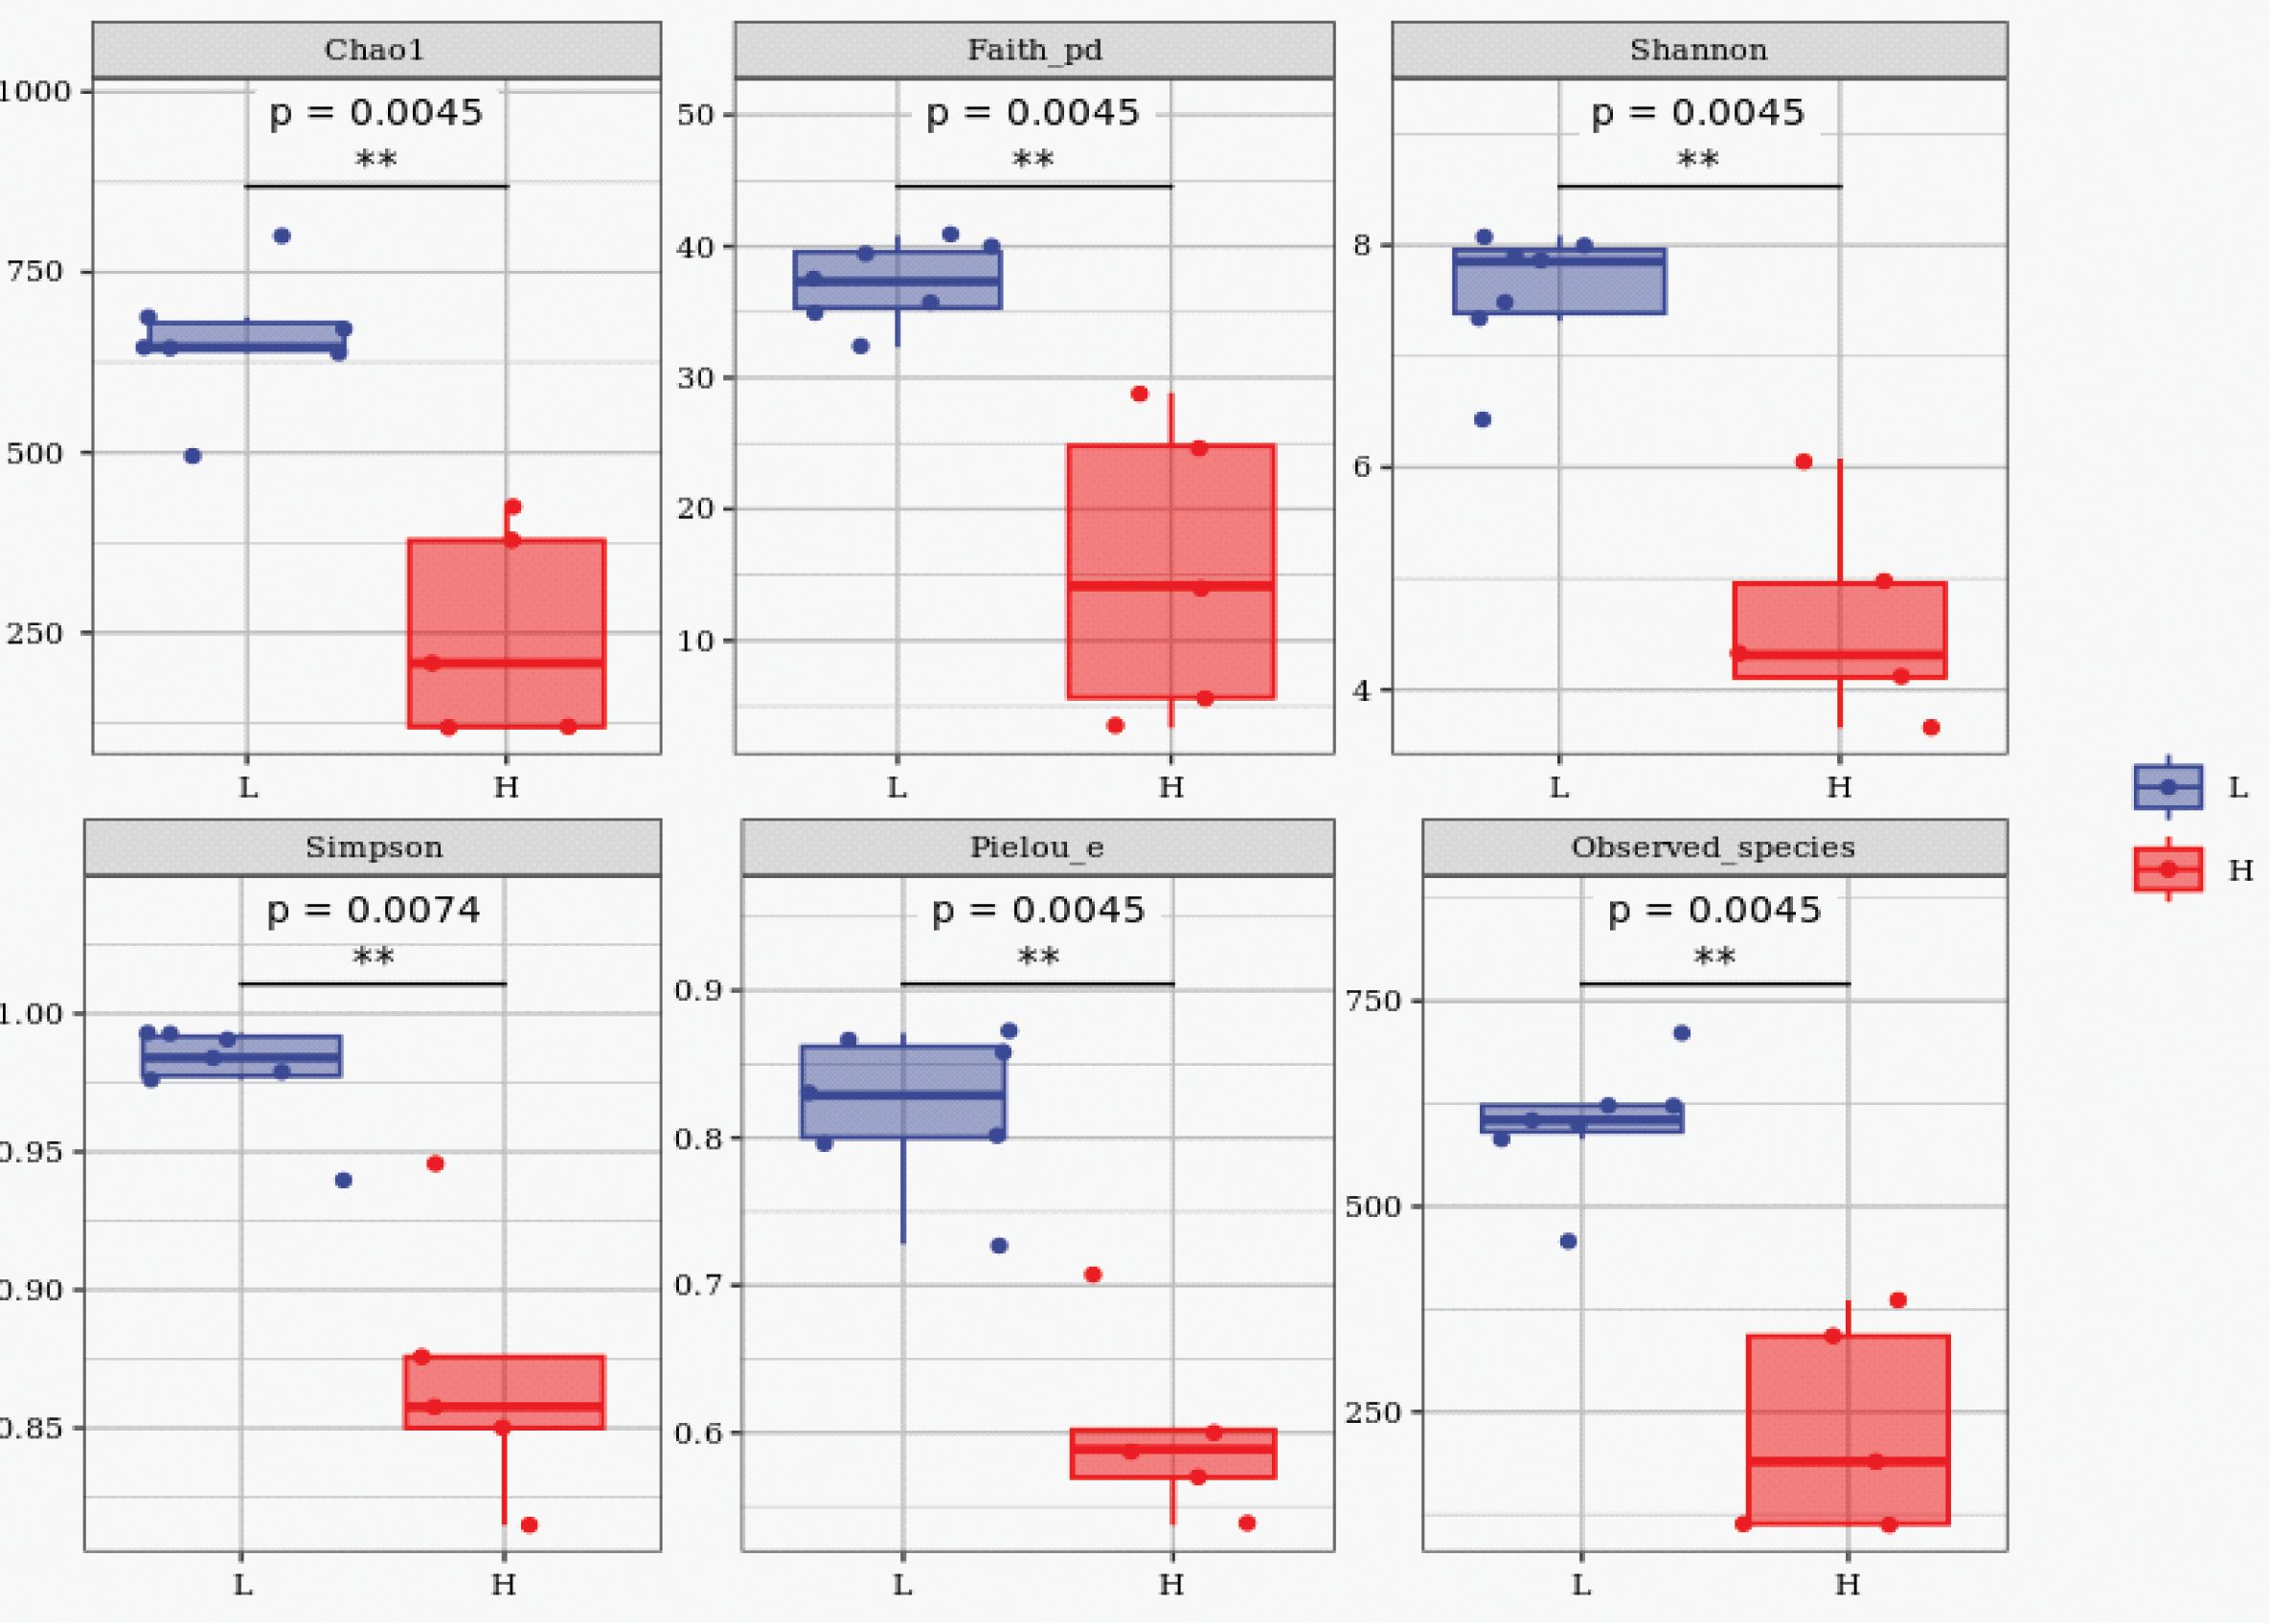
Figure 2. Alpha diversity metrics of laying hens with different feather coverage. L, low feather coverage; H, high feather coverage. Chao1 and Observed_species indices represent species richness; Faith_pd index represents phylogenetic diversity; Shannon and Simpson indices represented diversity. Pielou_e index indicates uniformity.
3.4 Analysis of taxonomic composition
The microbiota samples from Groups L and H were classified at the phylum level (Figure 3). The top 10 microorganisms in terms of abundance, ranked from highest to lowest, were Firmicutes, Bacteroidetes, Proteobacteria, Spirochaetes, Fusobacteria, Deferribacteres, WPS-2, Synergistetes, Actinobacteria, and Elusimicrobia. Among these, Firmicutes and Bacteroidetes were the dominant phyla.
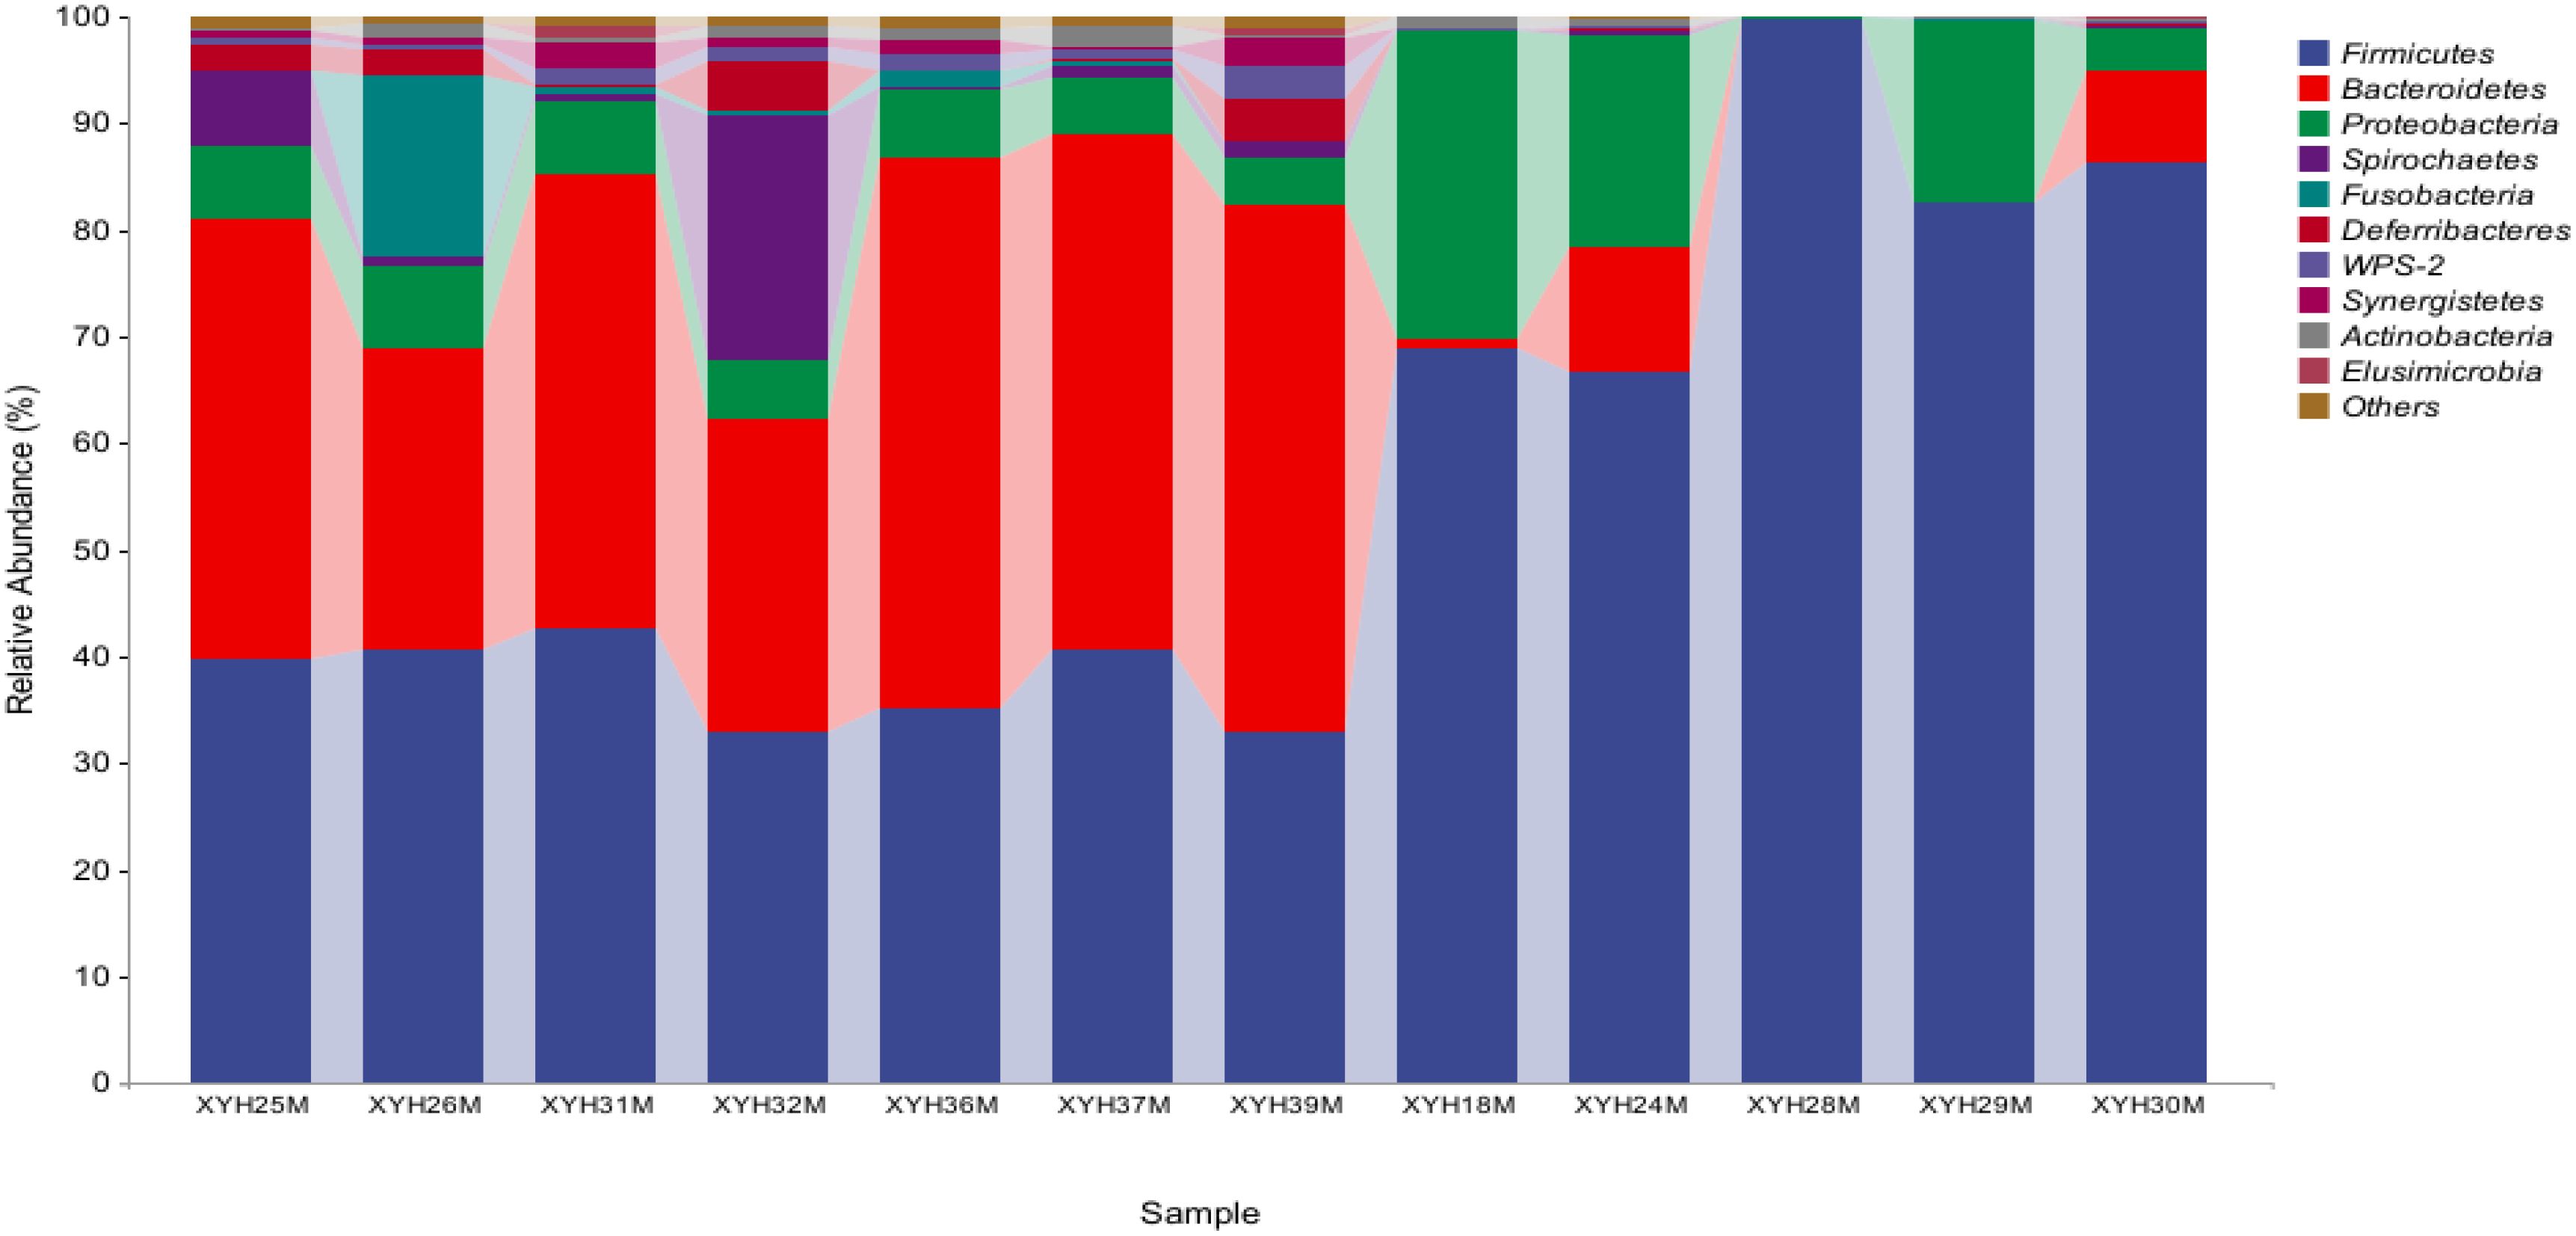
Figure 3. The top 10 most abundant microbial flora from microbiota samples from laying hens in with low versus high feather coverage.
3.5 Comparative analysis of the abundance of Firmicutes, Bacteroidetes, and Proteobacteria in groups L and H
The abundance of Firmicutes in Group L was significantly lower than that in Group H (P < 0.01) (Figure 4A). Conversely, the abundance of Bacteroidetes in Group L was significantly higher than that in group H (P < 0.01) (Figure 4A). In contrast, the abundances of Proteobacteria in Group L and Group H were not significantly different (Figure 4A).
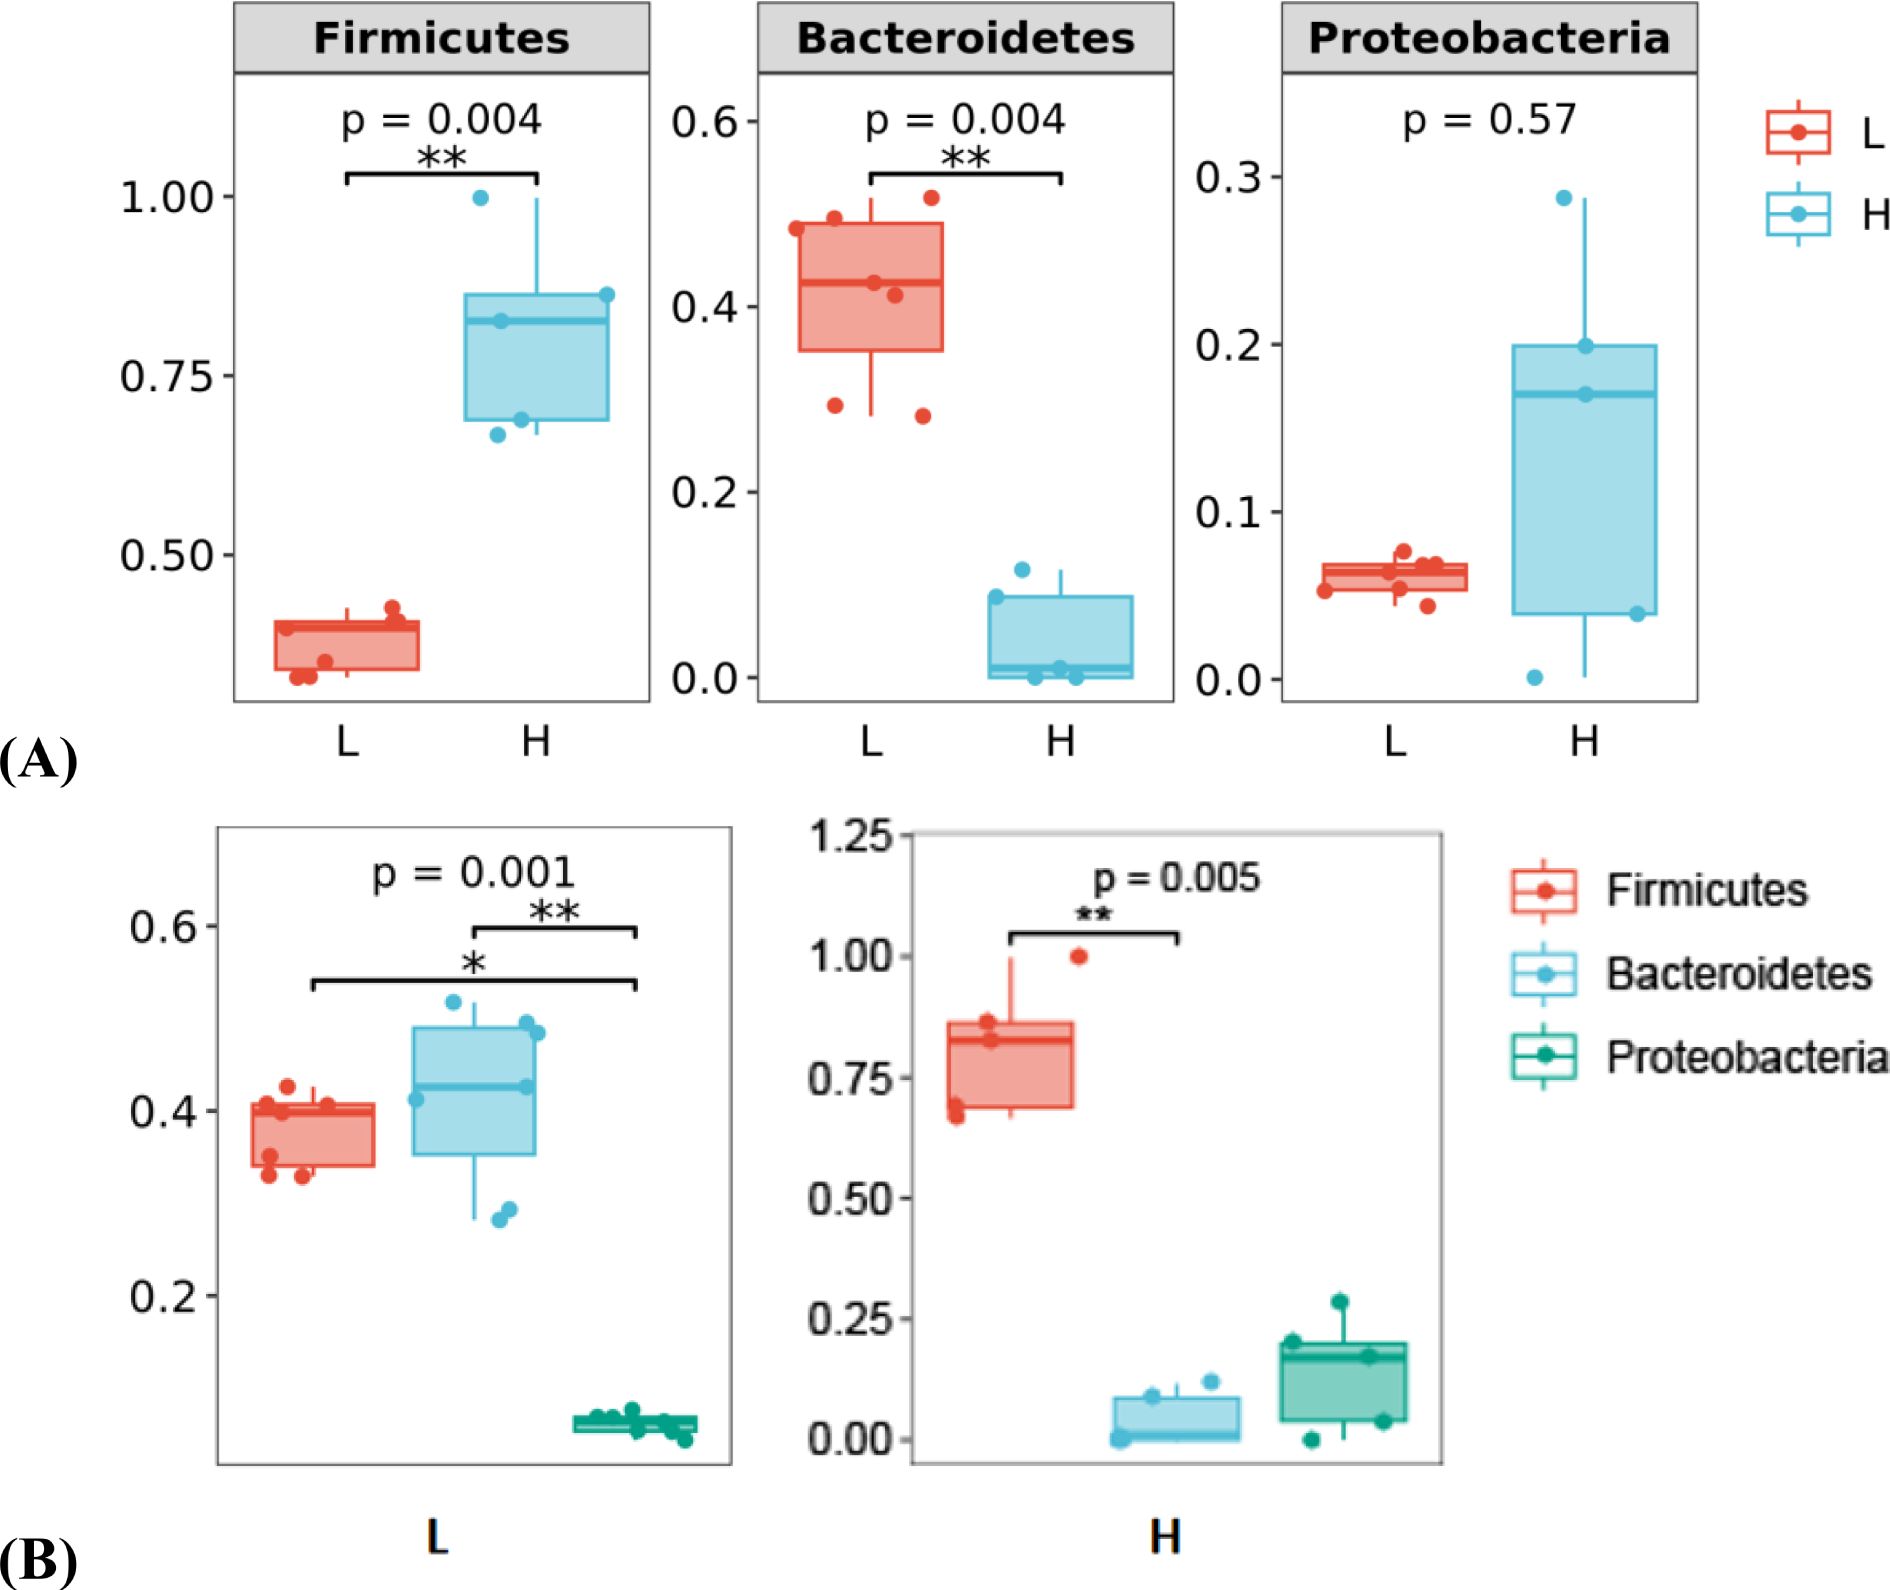
Figure 4. Comparative analysis of the abundance of Firmicutes, Bacteroidetes, and Proteobacteria in laying hens with different feather coverage. (A) Abundance of the same flora in Groups L and H. (B) Abundance of different flora in Groups L and H. L, low feather coverage; H, high feather coverage.
In Group L, the abundances of Firmicutes and Bacteroidetes were relatively similar, but both were significantly higher than that of Proteobacteria (P < 0.05) (Figure 4B). In contrast, in Group H, the abundance of Firmicutes was significantly higher than those of Bacteroidetes and Proteobacteria (P < 0.01) (Figure 4B).
3.6 LEfSe analysis
Two microbial groups with both statistically significant and biologically relevant differences were clearly identified (Figure 5). The first group belonged to the Firmicutes, and included c-Bacilli (Bacillus), o_Lactobacillales, f_Lactobacillaceae, g_Lactobacillus, f_Streptococcaceae, f_Peptostreptococcaceae, and g_Veillonella. The second group comprised c_Actinobacteria, with members including o_Actinomycetales, o_Bifidobacteriales, f_Corynebacteriaceae, f_Bifidobacteriaceae, g_Corynebacterium, and g_Aeriscardovia.
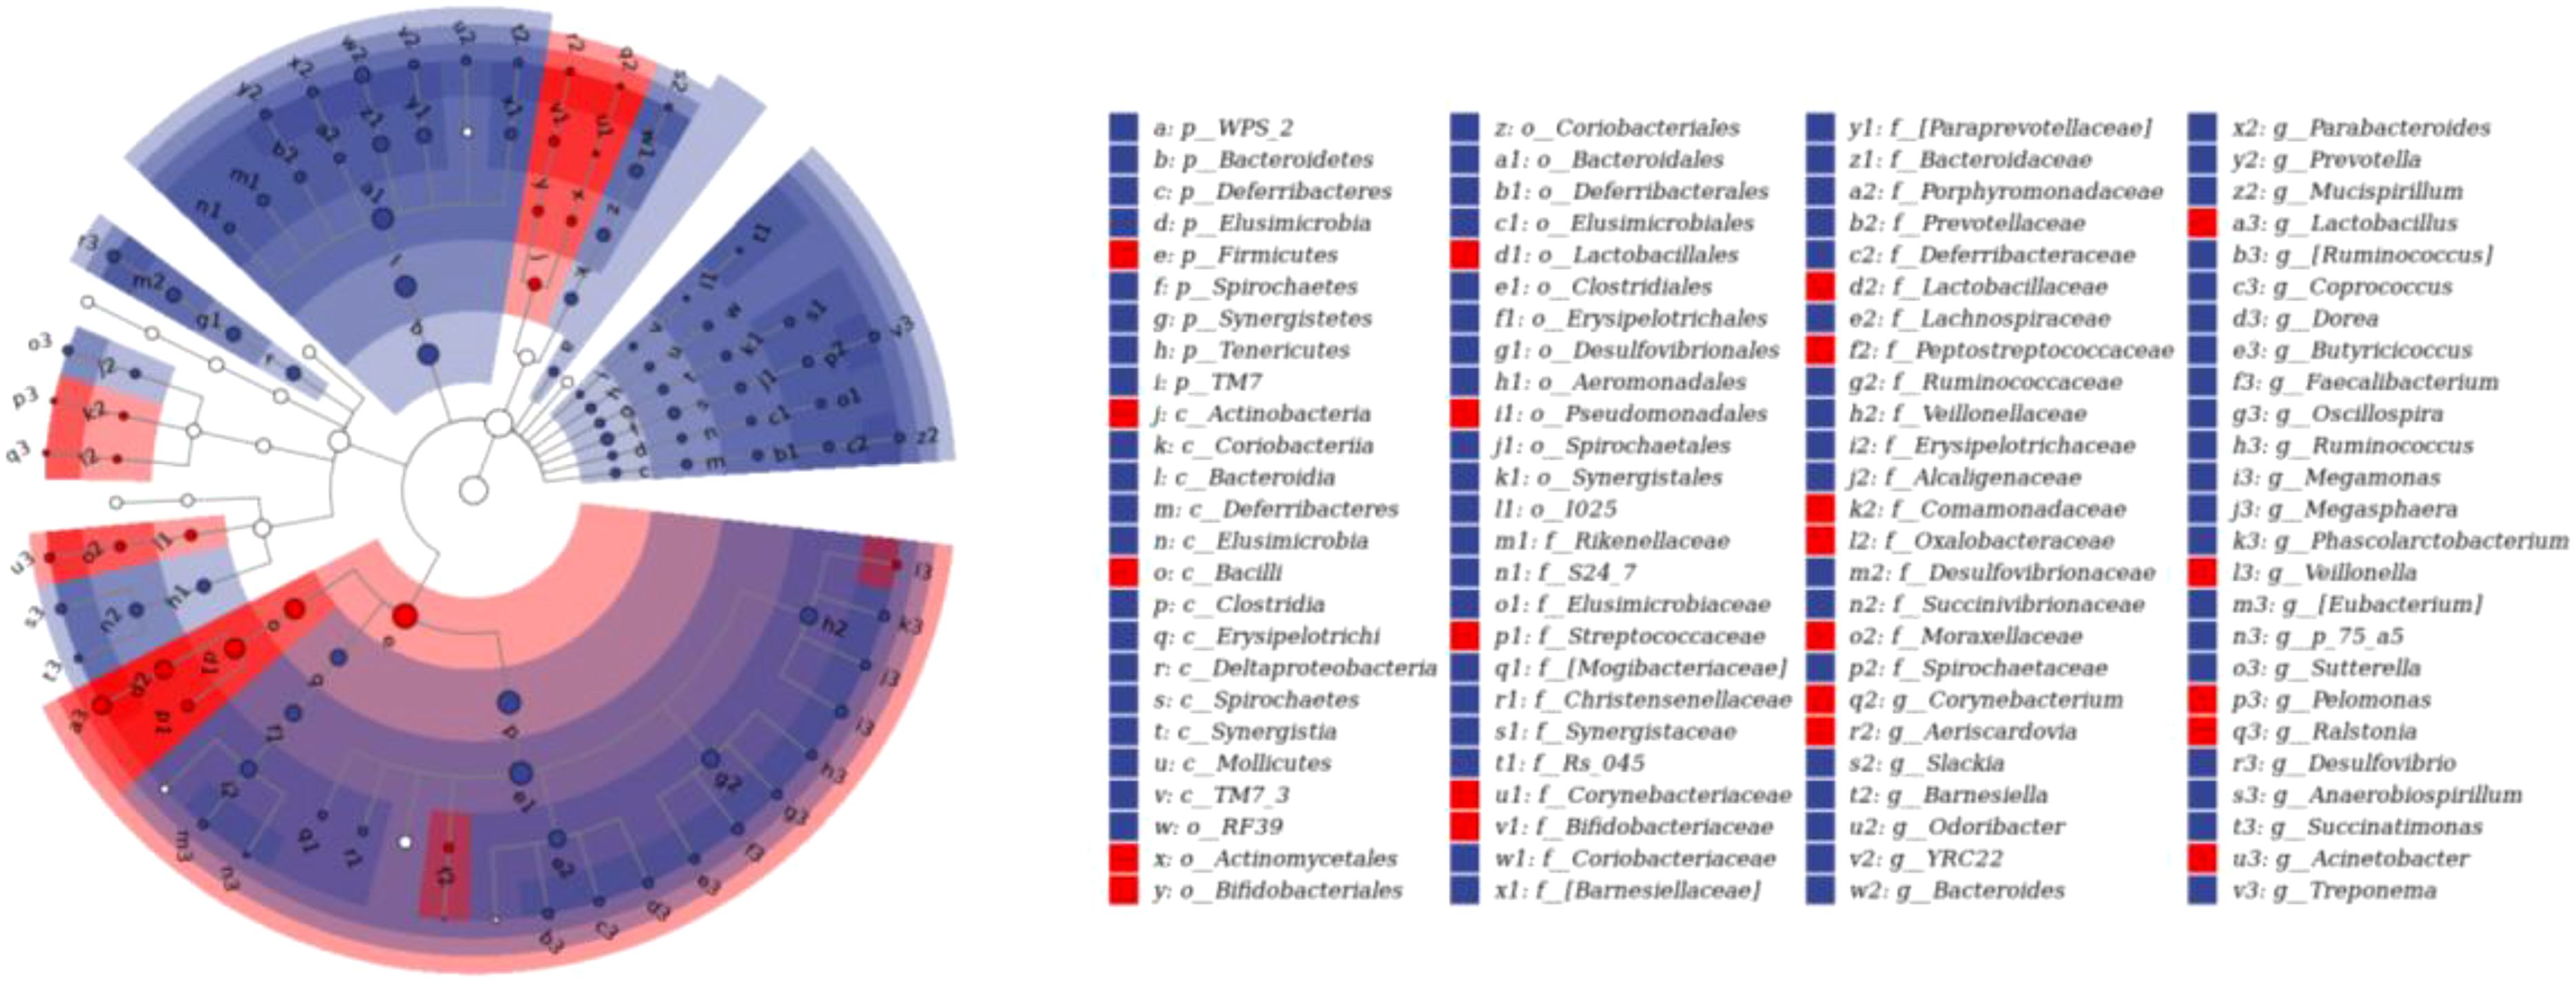
Figure 5. LEfSe analysis results. Histogram of LDA value distribution of significantly different species and taxonomic branch diagram of species between high - and low - feather coverage groups in laying hens. Biomarkers were identified based on significant differences in microbial taxa, with the LDA score calculated for each feature. Only species passing the set threshold were considered as biomarkers. The histogram shows the LDA values of these significant species, and the taxonomic branch diagram displays the taxonomic relationships among them.
3.7 Cluster analysis of groups L and H
Principal component analysis (PCA) analysis demonstrated that samples from groups L and H exhibited clustering behavior (Figure 6A). Notably, the differences among samples within Group L were smaller compared with those within Group H, indicating a relatively more homogeneous microbial community structure within Group L. The top 20 differentiated microorganisms at the genus level were Lactobacillus, Butyricicoccus, (Ruminococcus), Dorea, Prevotella, Megamonas, Megasphaera, Phascolarctobacterium, Sutterella, Faecalibacterium, Bacteroides, Desulfovibrio, Ruminococcus, Parabacteroides, and Oscillospira (Figure 6B).
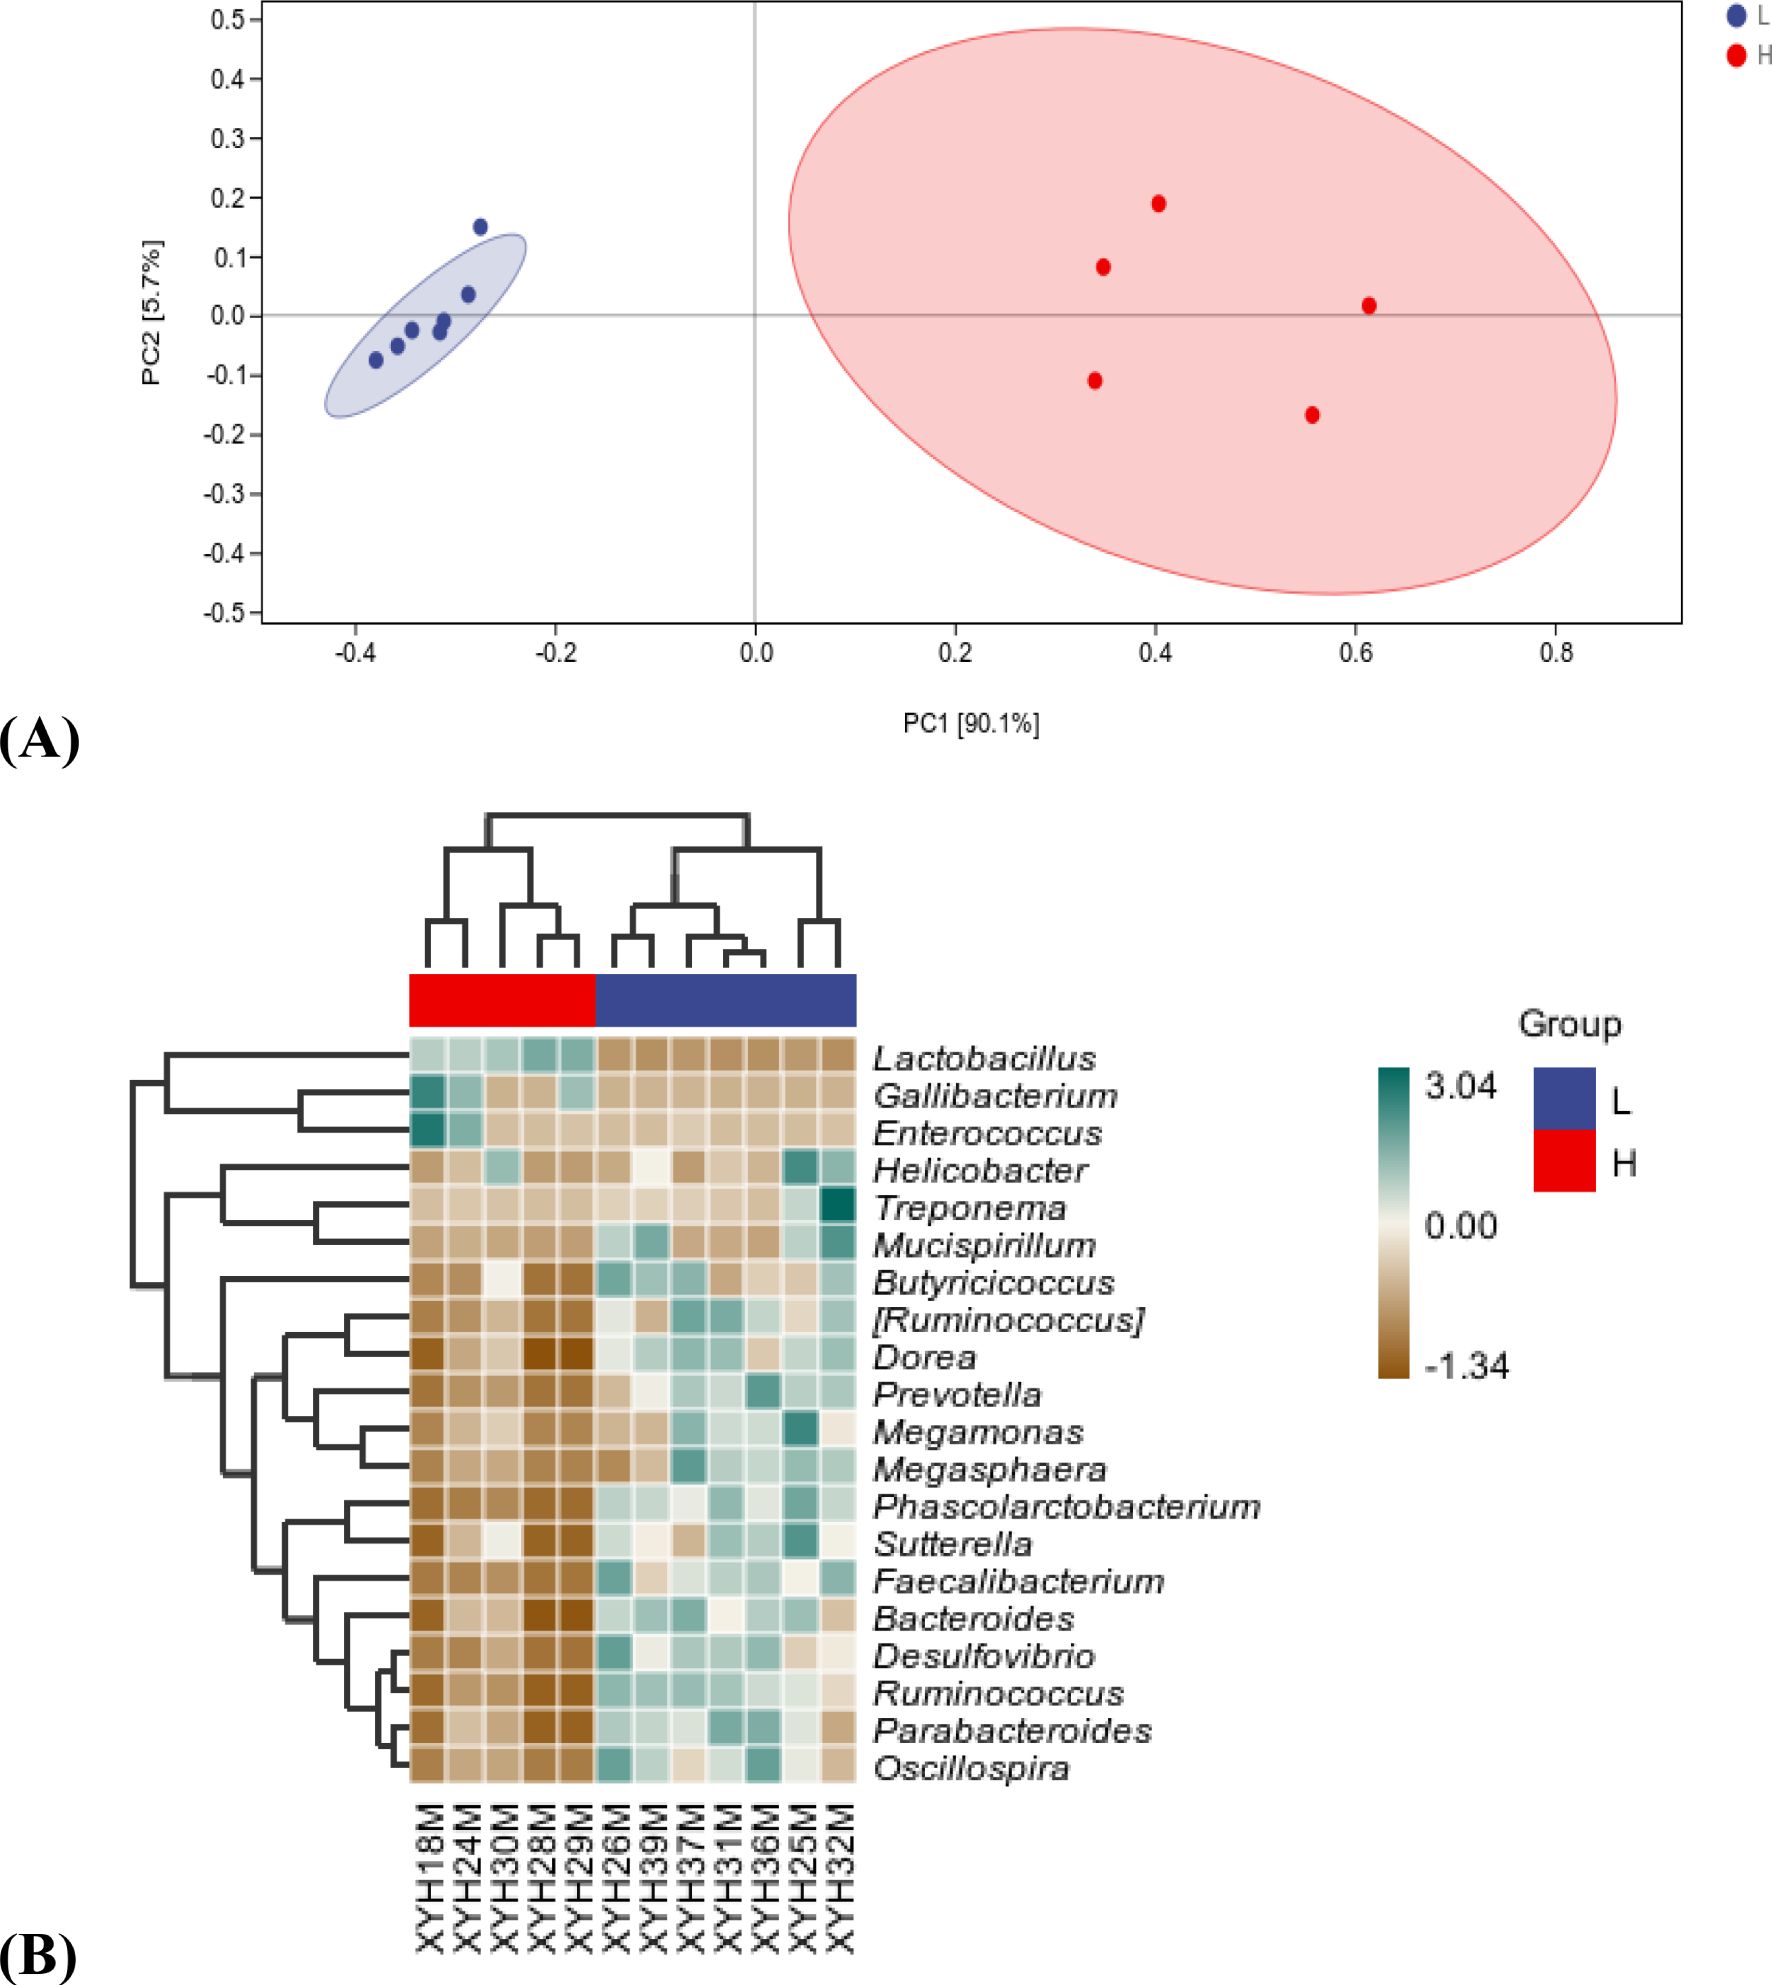
Figure 6. Microbiotal species differences between laying hens with different feather coverage. (A) PCA analysis. (B) Species composition heat map. L, low feather coverage; H, high feather coverage.
3.8 Differential microbial metabolic pathways
Significant differences were observed in the microbial metabolic pathways between Group L and Group H (Figure 7). Pathways with P < 0.05 that were upregulated and related to microbial physiological function and adaptability, included: Spliceosome, Bacterial chemotaxis, Flagellar assembly, and Peroxisome. The spliceosome pathway is crucial in RNA processing post - gene transcription. Abnormal RNA splicing may affect the expression of genes related to epidermal cell differentiation, which is closely related to feather growth. Dysfunction in this pathway can result in abnormal splicing of gene transcripts related to feather growth, thereby impacting protein expression and function. Pathways involved in nutrient metabolism were Porphyrin and chlorophyll metabolism, Phenylalanine, tyrosine and tryptophan biosynthesis, Phenylalanine metabolism, and Glyoxylate and dicarboxylate metabolism. Pathways associated with immune regulation and microbe-host interaction resistance were Epithelial cell signaling in Helicobacter pylori infection and beta-Lactam. In addition, Glycosaminoglycan degradation and Biosynthesis of ansamycins were also upregulated, as were Histidine metabolism and Biotin metabolism.
Typical metabolic pathways that were significantly downregulated included Aminoacyl-tRNA biosynthesis, Ribosome biogenesis in eukaryotes, Mismatch repair, Nucleotide excision repair, and Base excision repair. In terms of energy metabolism, the downregulated pathways included Pentose phosphate pathway, Fatty acid biosynthesis, Fructose and mannose metabolism, Galactose metabolism, and Glycolysis/Gluconeogenesis. For lipid metabolism, the affected pathways were Amino sugar and nucleotide sugar metabolism, Glycerolipid metabolism, and Glycerophospholipid metabolism. Pathways involved in amino acid metabolism were Tyrosine metabolism, Lysine biosynthesis, and Pyrimidine metabolism. Pathways associated with secondary metabolism and detoxification were Propanoate metabolism, Toluene degradation, Benzoate degradation, and Caprolactam degradation. Finally, Vibrio cholerae pathogenic cycle and Toxoplasmosis were also pathways that were downregulated.
3.9 Sequencing results
Sequencing resulted in a total of 314,497,254 original reads (Table 2). After quality control procedures, 292,829,086 clean reads were obtained. In total, 47,326,680,000 raw bases were obtained, which decreased to 43,924,362,900 bp after quality control. The percentage of bases with a base recognition accuracy >99.9% was >91.48%, and the proportion of clean reads obtained after quality control was >92.82%. These results indicated the high quality of the data.
3.10 Comparison with reference genome
The total mapping rate (Total_Mapped) for each sample was >90% (Table 3), indicating that most of the sequencing sequences could be successfully mapped to the reference genome. Such a result supported the high quality of the sequencing data and also implied that the selection of the reference genome was appropriate, thus providing a reliable data basis for subsequent analysis.
The proportion of Multiple_Mapped sequences was relatively low (2–3%), indicating that only a small fraction of the sequences aligned to multiple locations within the reference genome. In contrast, the proportion of Uniquely_Mapped sequences (Uniquely_Mapped) exceeded 97%, suggesting that most sequences were uniquely aligned to a single location in the reference genome.
3.11 Comparison of regional distribution statistics
The Map_Events for each sample were relatively large, indicating that numerous comparison attempts were made between the sequencing data and the reference genomes (Table 4). In each sample, a high percentage of reads, ranging from 79% to 85%, were mapped to gene regions, revealing that most of the sequencing sequences were precisely located on known genes.
Furthermore, 15–21% of Reads were mapped to intergene regions, whereas among the Reads mapped to gene regions, 87–90% were mapped to exon regions.
3.12 Differential gene statistics
DESeq2 software was used for differential gene expression (DEG) analysis. The screening thresholds for defining a unigene as a DEG were set as P <0.05 and |log2 (fold change)| ≥1.
In the L_vs_H group, 733 genes were upregulated, whereas 1,022 genes were downregulated (Figure 8).
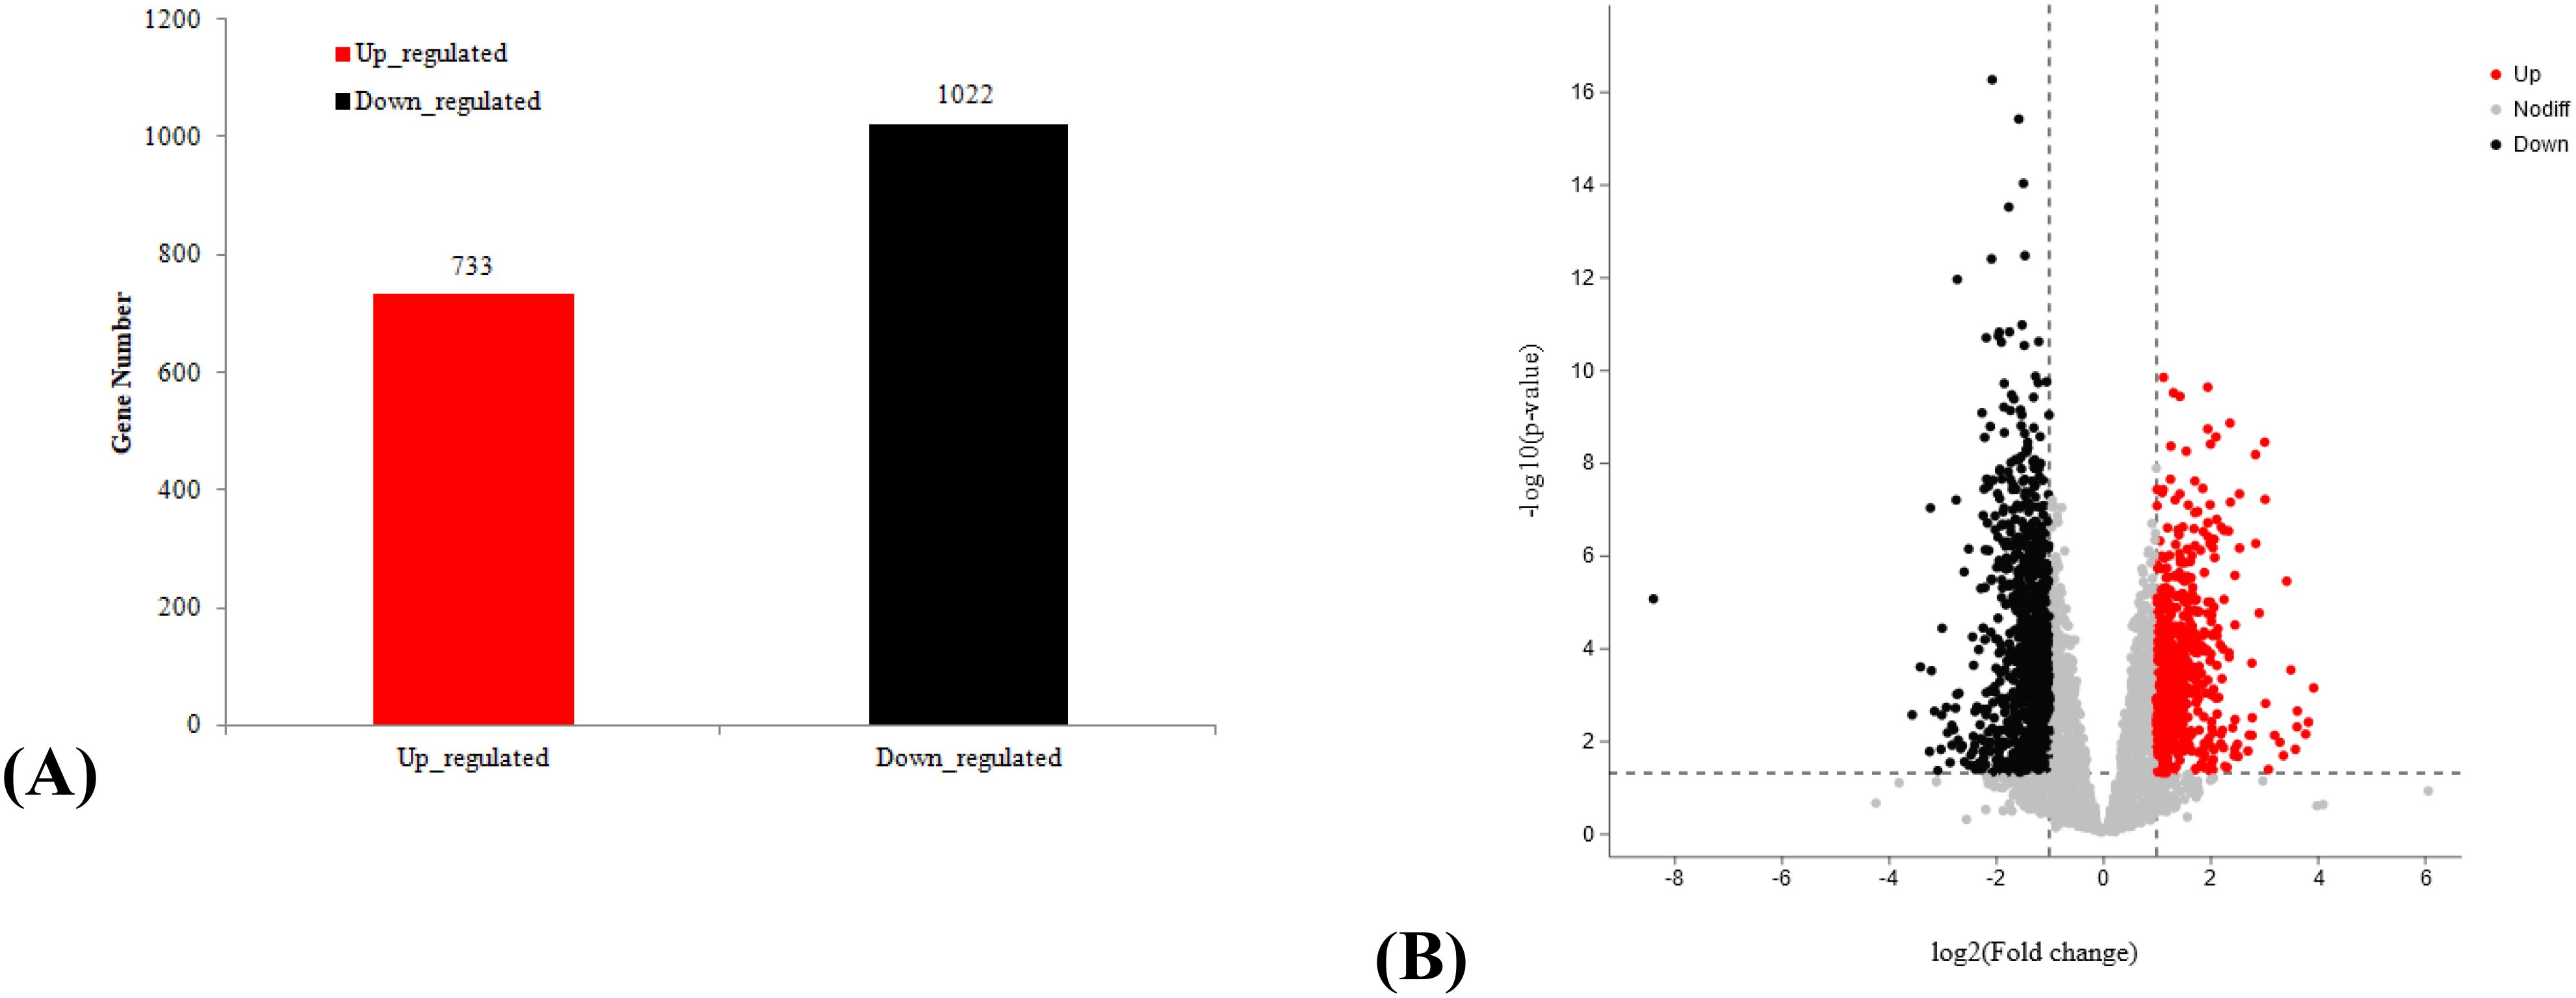
Figure 8. Differential gene analysis. Number of genes (A) downregulated and (B) upregulated in low-feather coverage versus high-feather coverage laying hens.
3.13 Enrichment analysis
The top five categories of the GO enrichment analysis with the lowest P values are presented in Figure 9A. The BP-enriched terms were ion transport, cation transport, anatomical structure morphogenesis, system process, and multicellular organismal process. For the CC category, the enriched terms were integral component of membrane, intrinsic component of membrane, cell periphery, plasma membrane, and membrane part. In the MF category, the enriched terms included transporter activity, transmembrane transporter activity, ion-gated channel activity, gated channel activity, and metal ion transmembrane transporter activity.
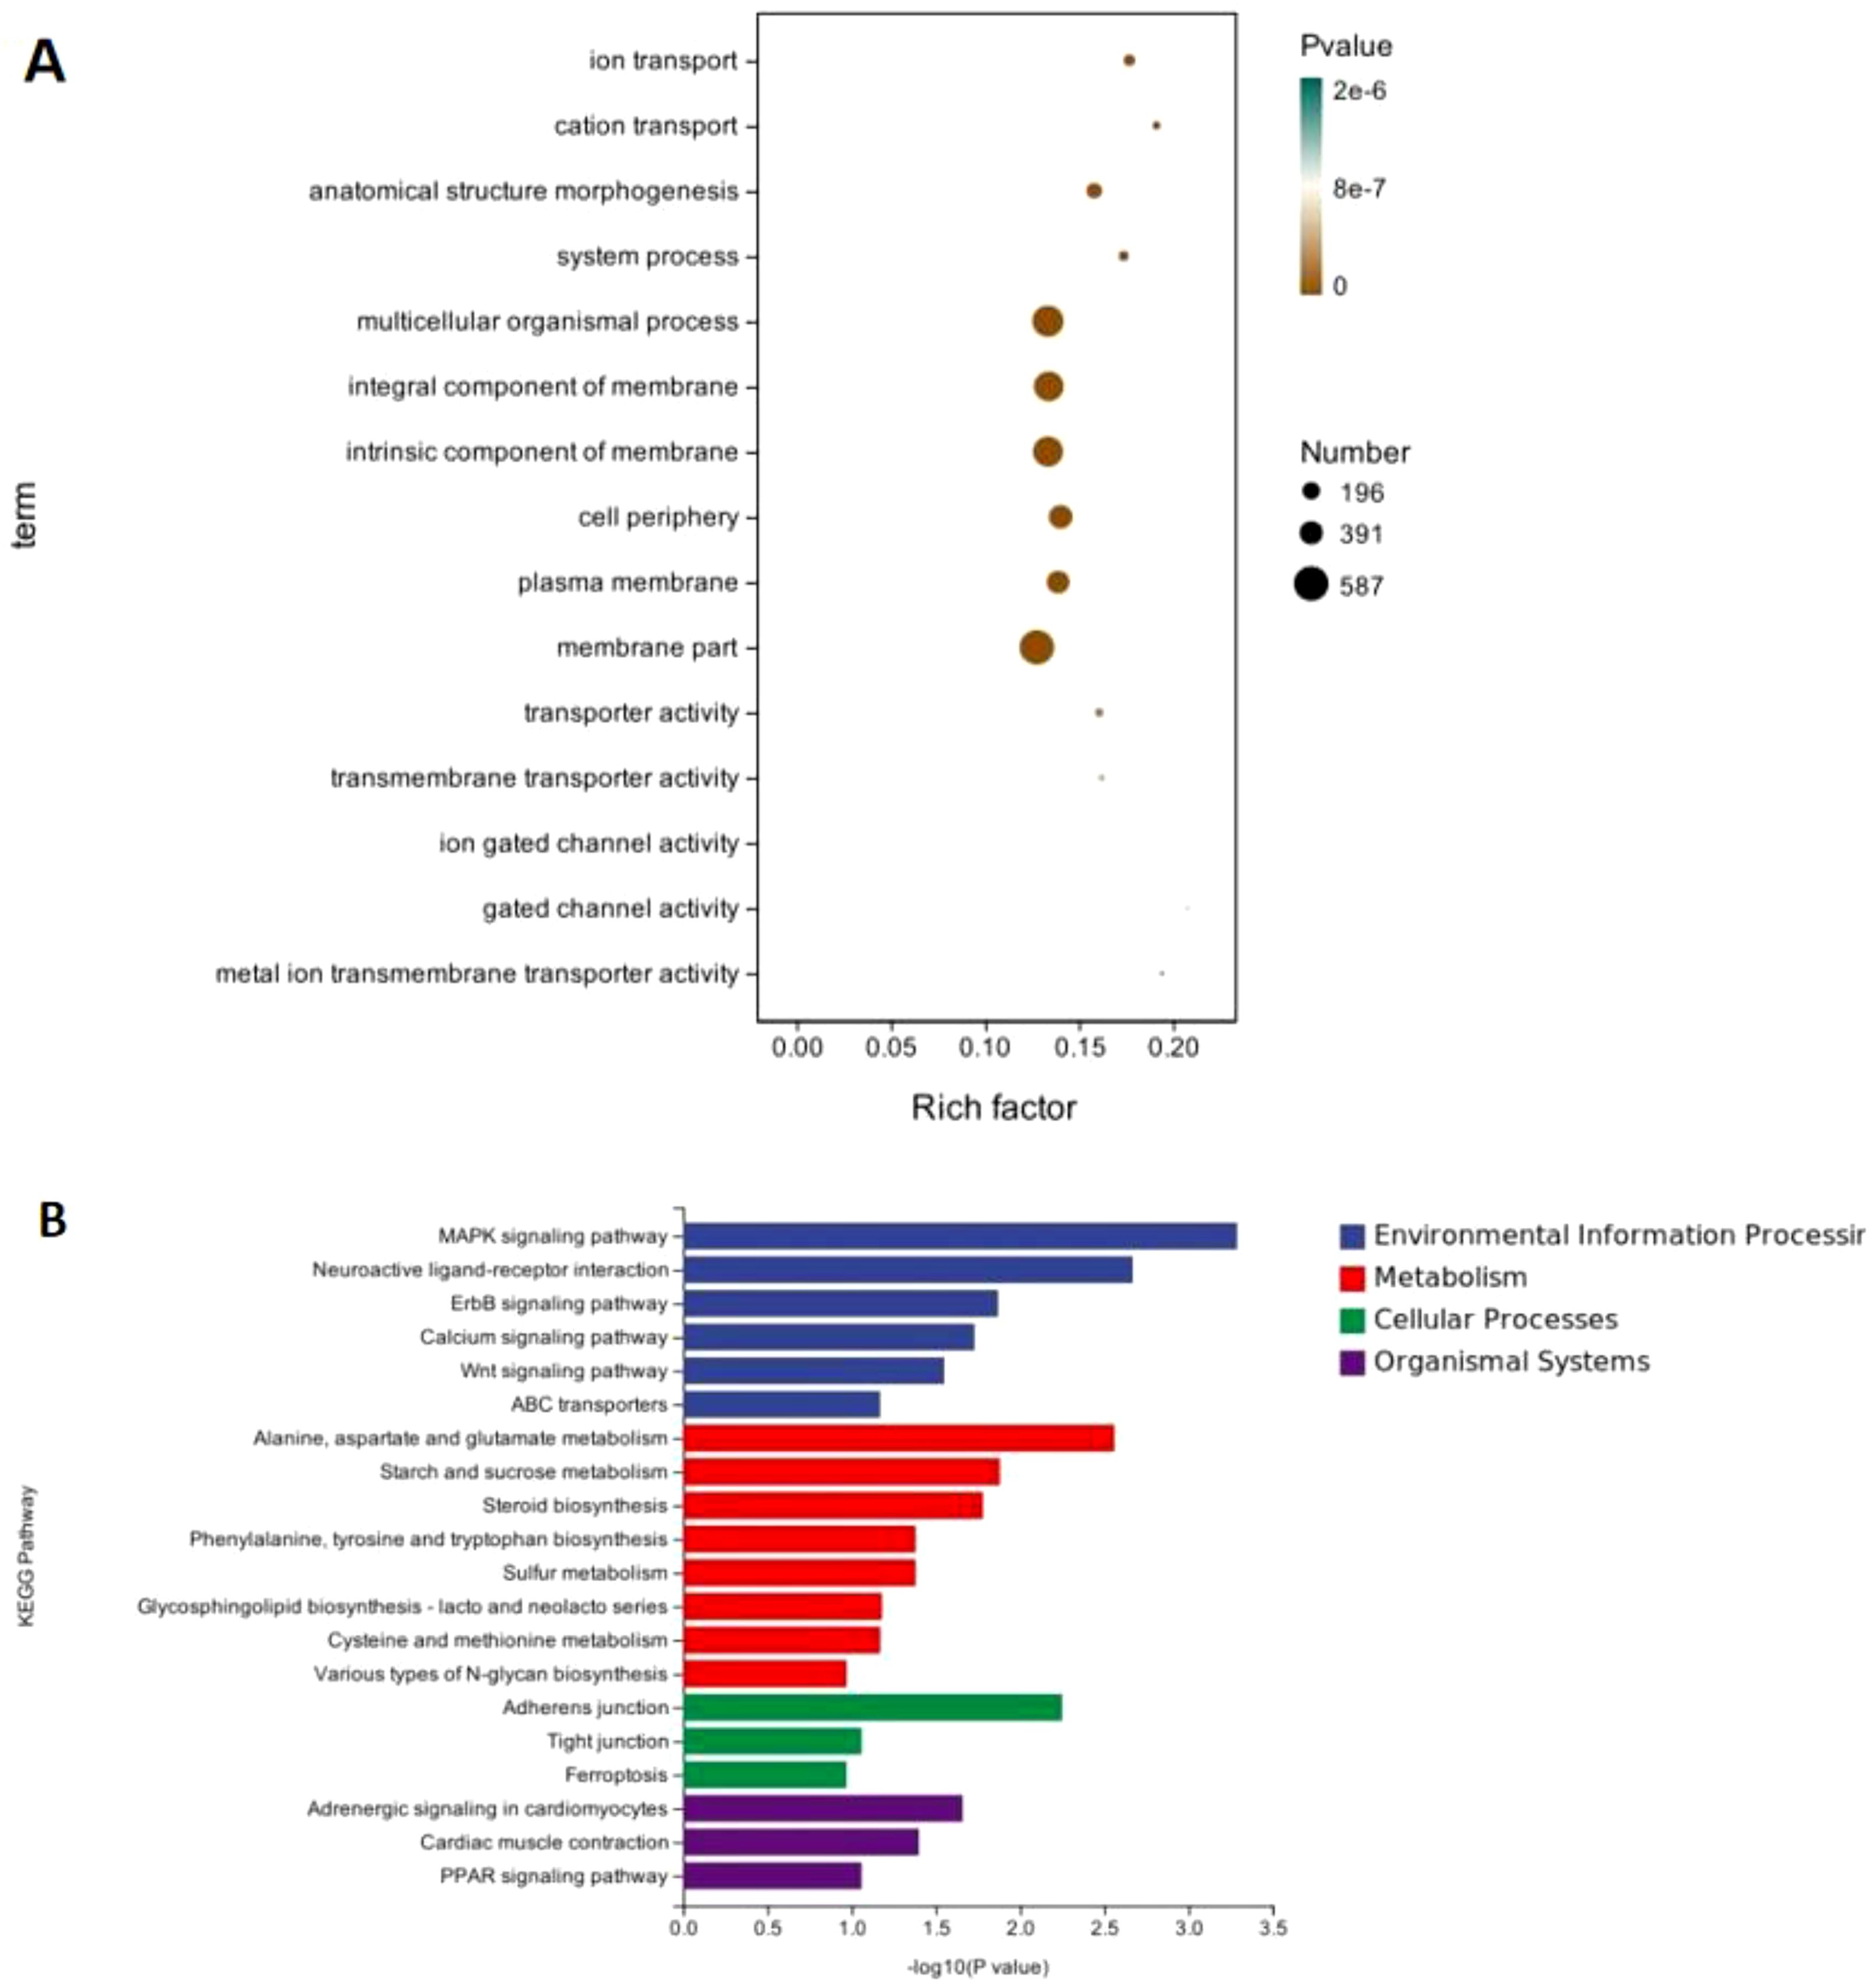
Figure 9. Differential gene enrichment analysis between low- and high-feather coverage laying hens. (A) Top five categories revealed by Gene Ontology (GO) enrichment analysis. (B) Top 20 pathways with the highest KEGG enrichment values.
Figure 9B shows the top 20 pathways with the highest KEGG enrichment P values, spanning multiple categories. In the Environmental information processing category, the MAPK signaling pathway was prominent, as were Neuroactive ligand-receptor interaction, ErbB signaling pathway, Calcium signaling pathway, and Wnt signaling pathway. In the Metabolism category, enriched pathways included Alanine, aspartate and glutamate metabolism, Starch and sucrose metabolism, Steroid biosynthesis, Phenylalanine, tyrosine and tryptophan biosynthesis, Sulfur metabolism, Glycosphingolipid biosynthesis-lacto and neolacto series, Cysteine and methionine metabolism, and various types of N-glycan biosynthesis. In the Cellular processes category, Adherens junction and Tight junction were enriched, while, in the Organismal systems category, Adrenergic signaling in cardiomyocytes, Cardiac muscle contraction, and the PPAR signaling pathway were included.
3.14 Analysis of related pathways and proteins
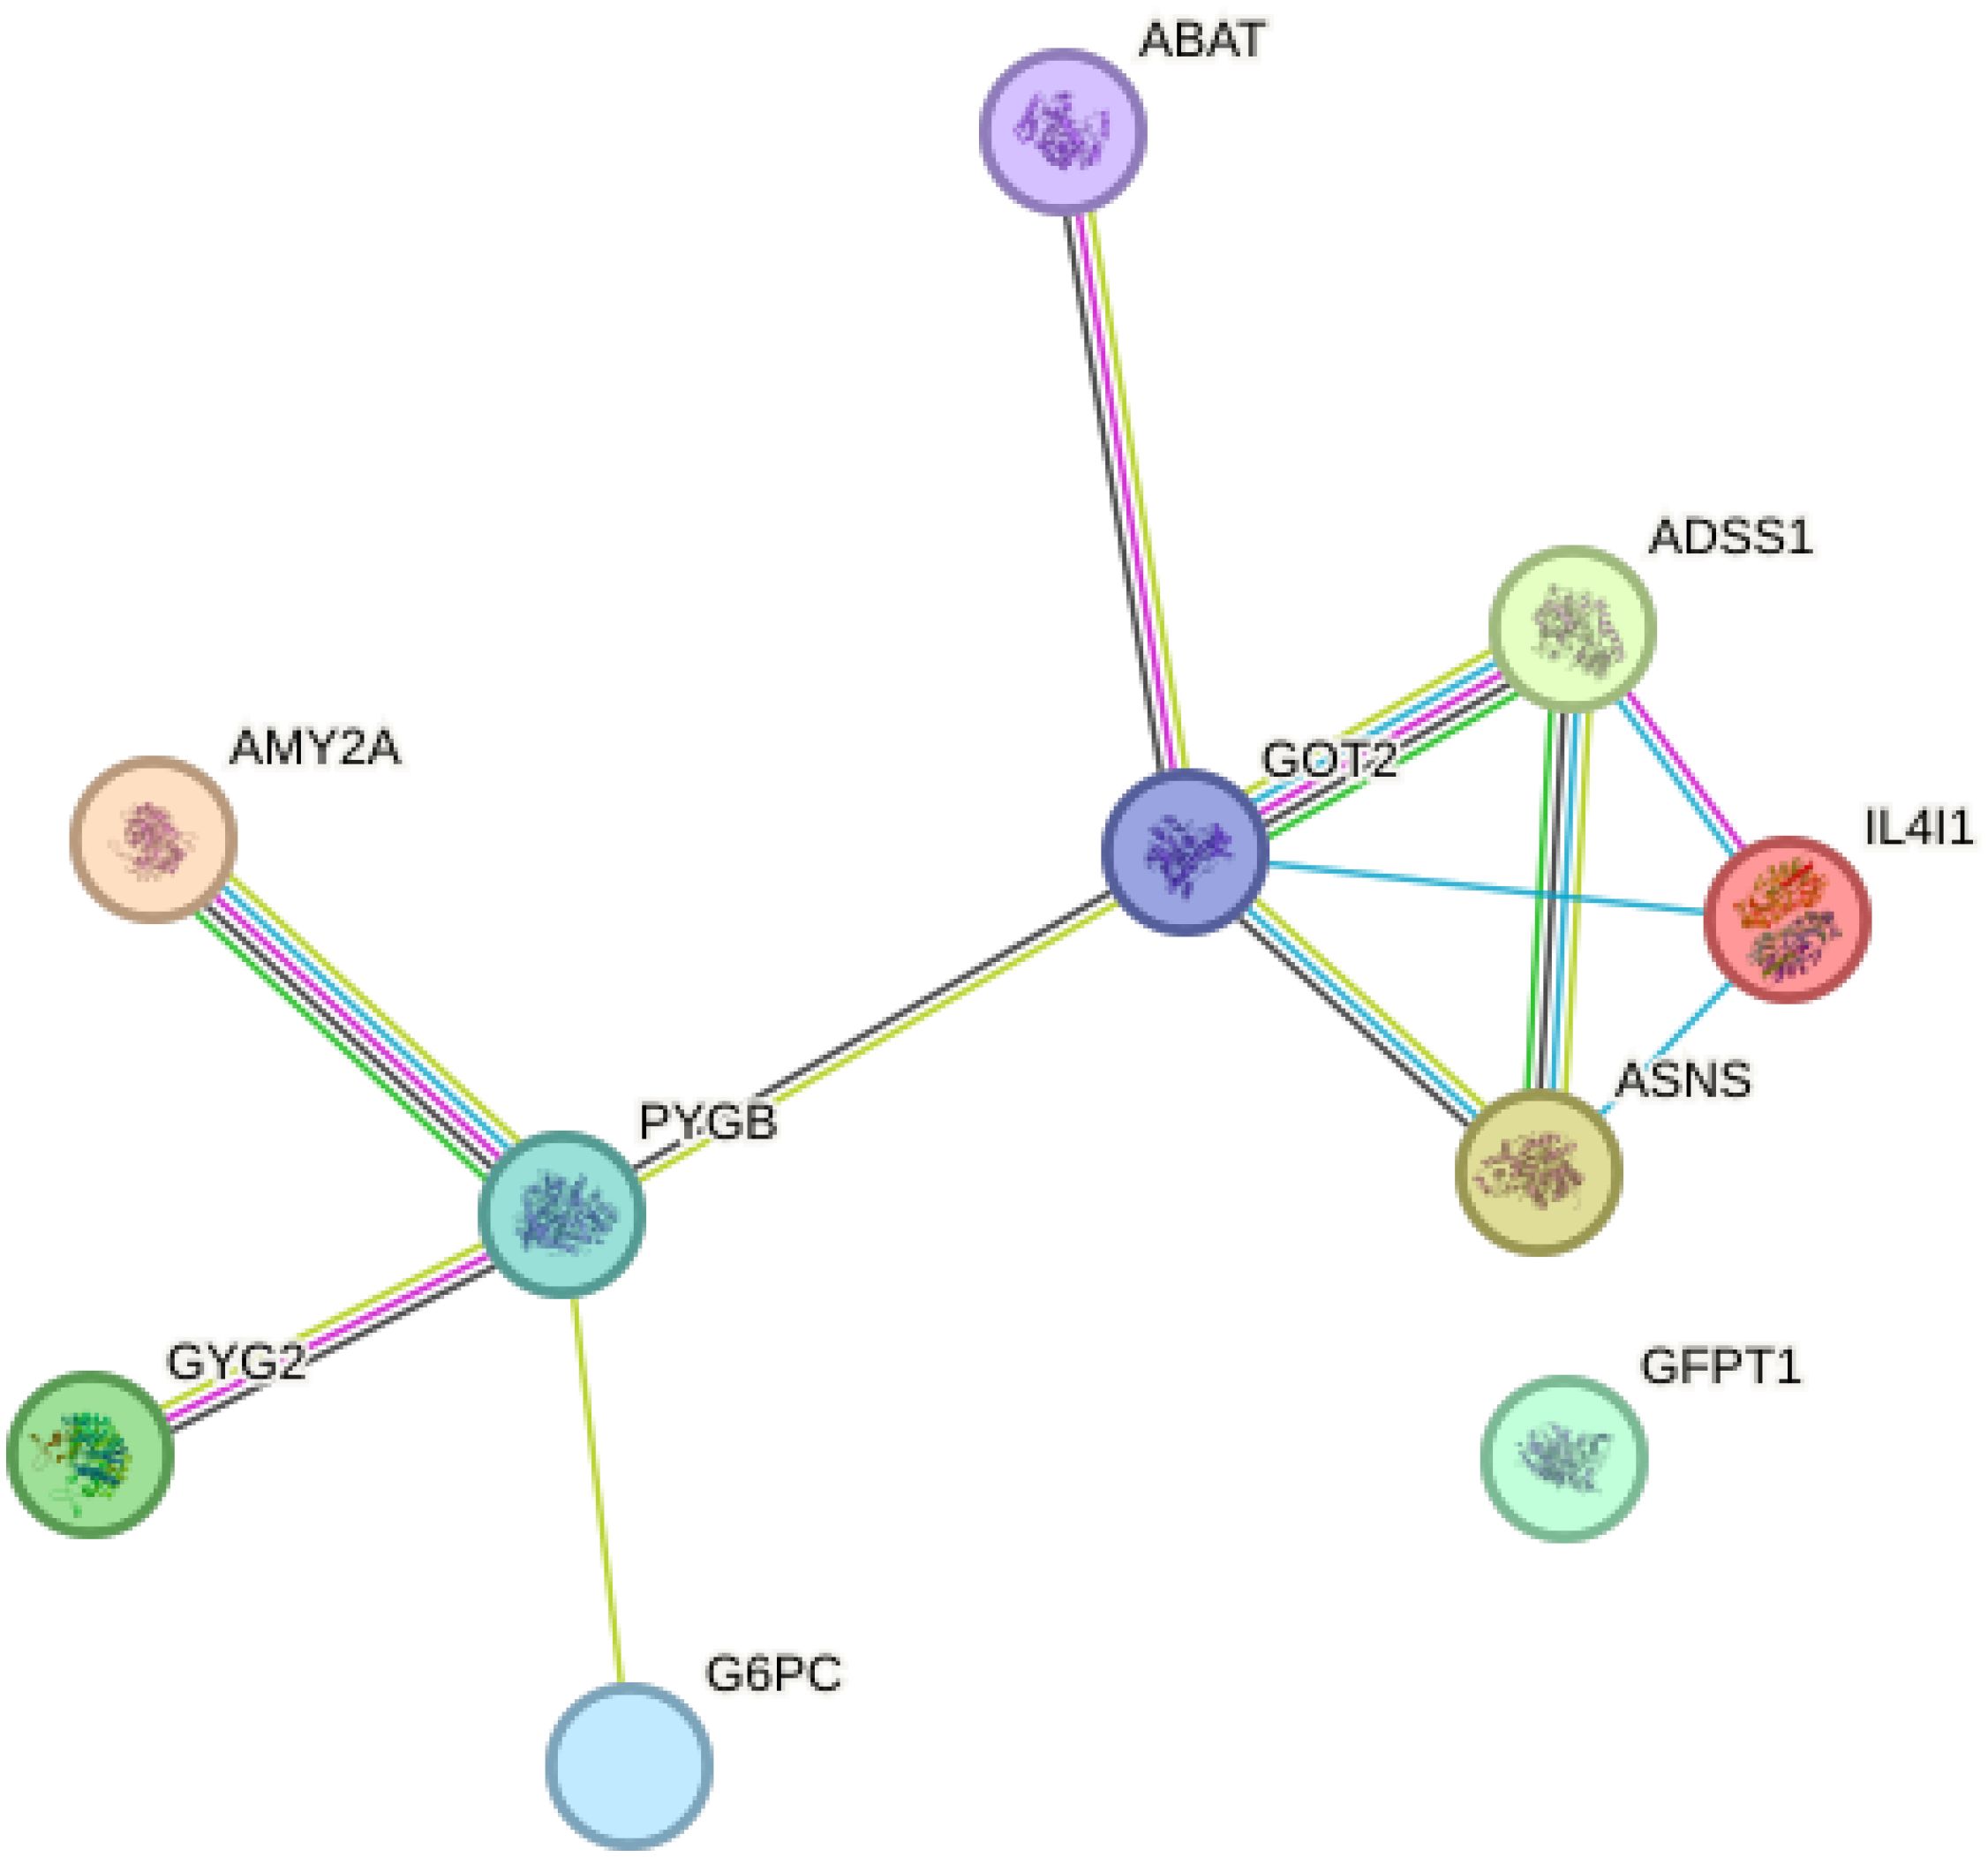
Proteins, such as AMY2A, GOT2, ASNS, GYG2, GFPT1, and G6FC, may constitute a metabolic functional module (Figure 10). This module likely participates in the digestion, absorption, and metabolism of nutrients within the cecal tissue of laying hens. to energy supply and cell metabolism. In addition, IL411 could form immune functional modules either independently or in combination with other proteins. It has a role in immune regulation and might be associated with the regulation of inflammatory responses, immune cell activation, and immune responses in the cecum.
3.15 CIA co-inertia
In the CIA co-inertia analysis, the RV coefficient, which gauges the strength of the association between the microbiome and transcriptomics, reached 0.8103694, implying a robust association between the microbiome and transcriptomic data. Specifically, there was a tendency for covariance between the composition of the microbial community (microbiome data) and the level of gene transcription (transcriptomic data), suggesting an interaction between the microbial community and host gene transcription. The combination of the high RV value and the significant P value from this analysis (P = 0.04) provided compelling evidence for the interaction between the microbiome and transcriptomics.
3.16 Heat map results
Numerous genes were found to correlate positively or negatively with bacterial genera from the cecal microbiota of laying hens with different feather coverage (Figure 11). For example, genes strongly correlated with Lactobacillus included CETP, NOG, RAD21L1, HAAO, INHBC, and APOLD1. For Bacteroides, the most relevant genes were MAPK10, EPYC, and HIST1H46, whereas that strongly correlated with Erysipelotrichaceae_Clostridium was RASAL1, and those with Ruminococcus were MAPK10, EPYC, and HIST1H46.
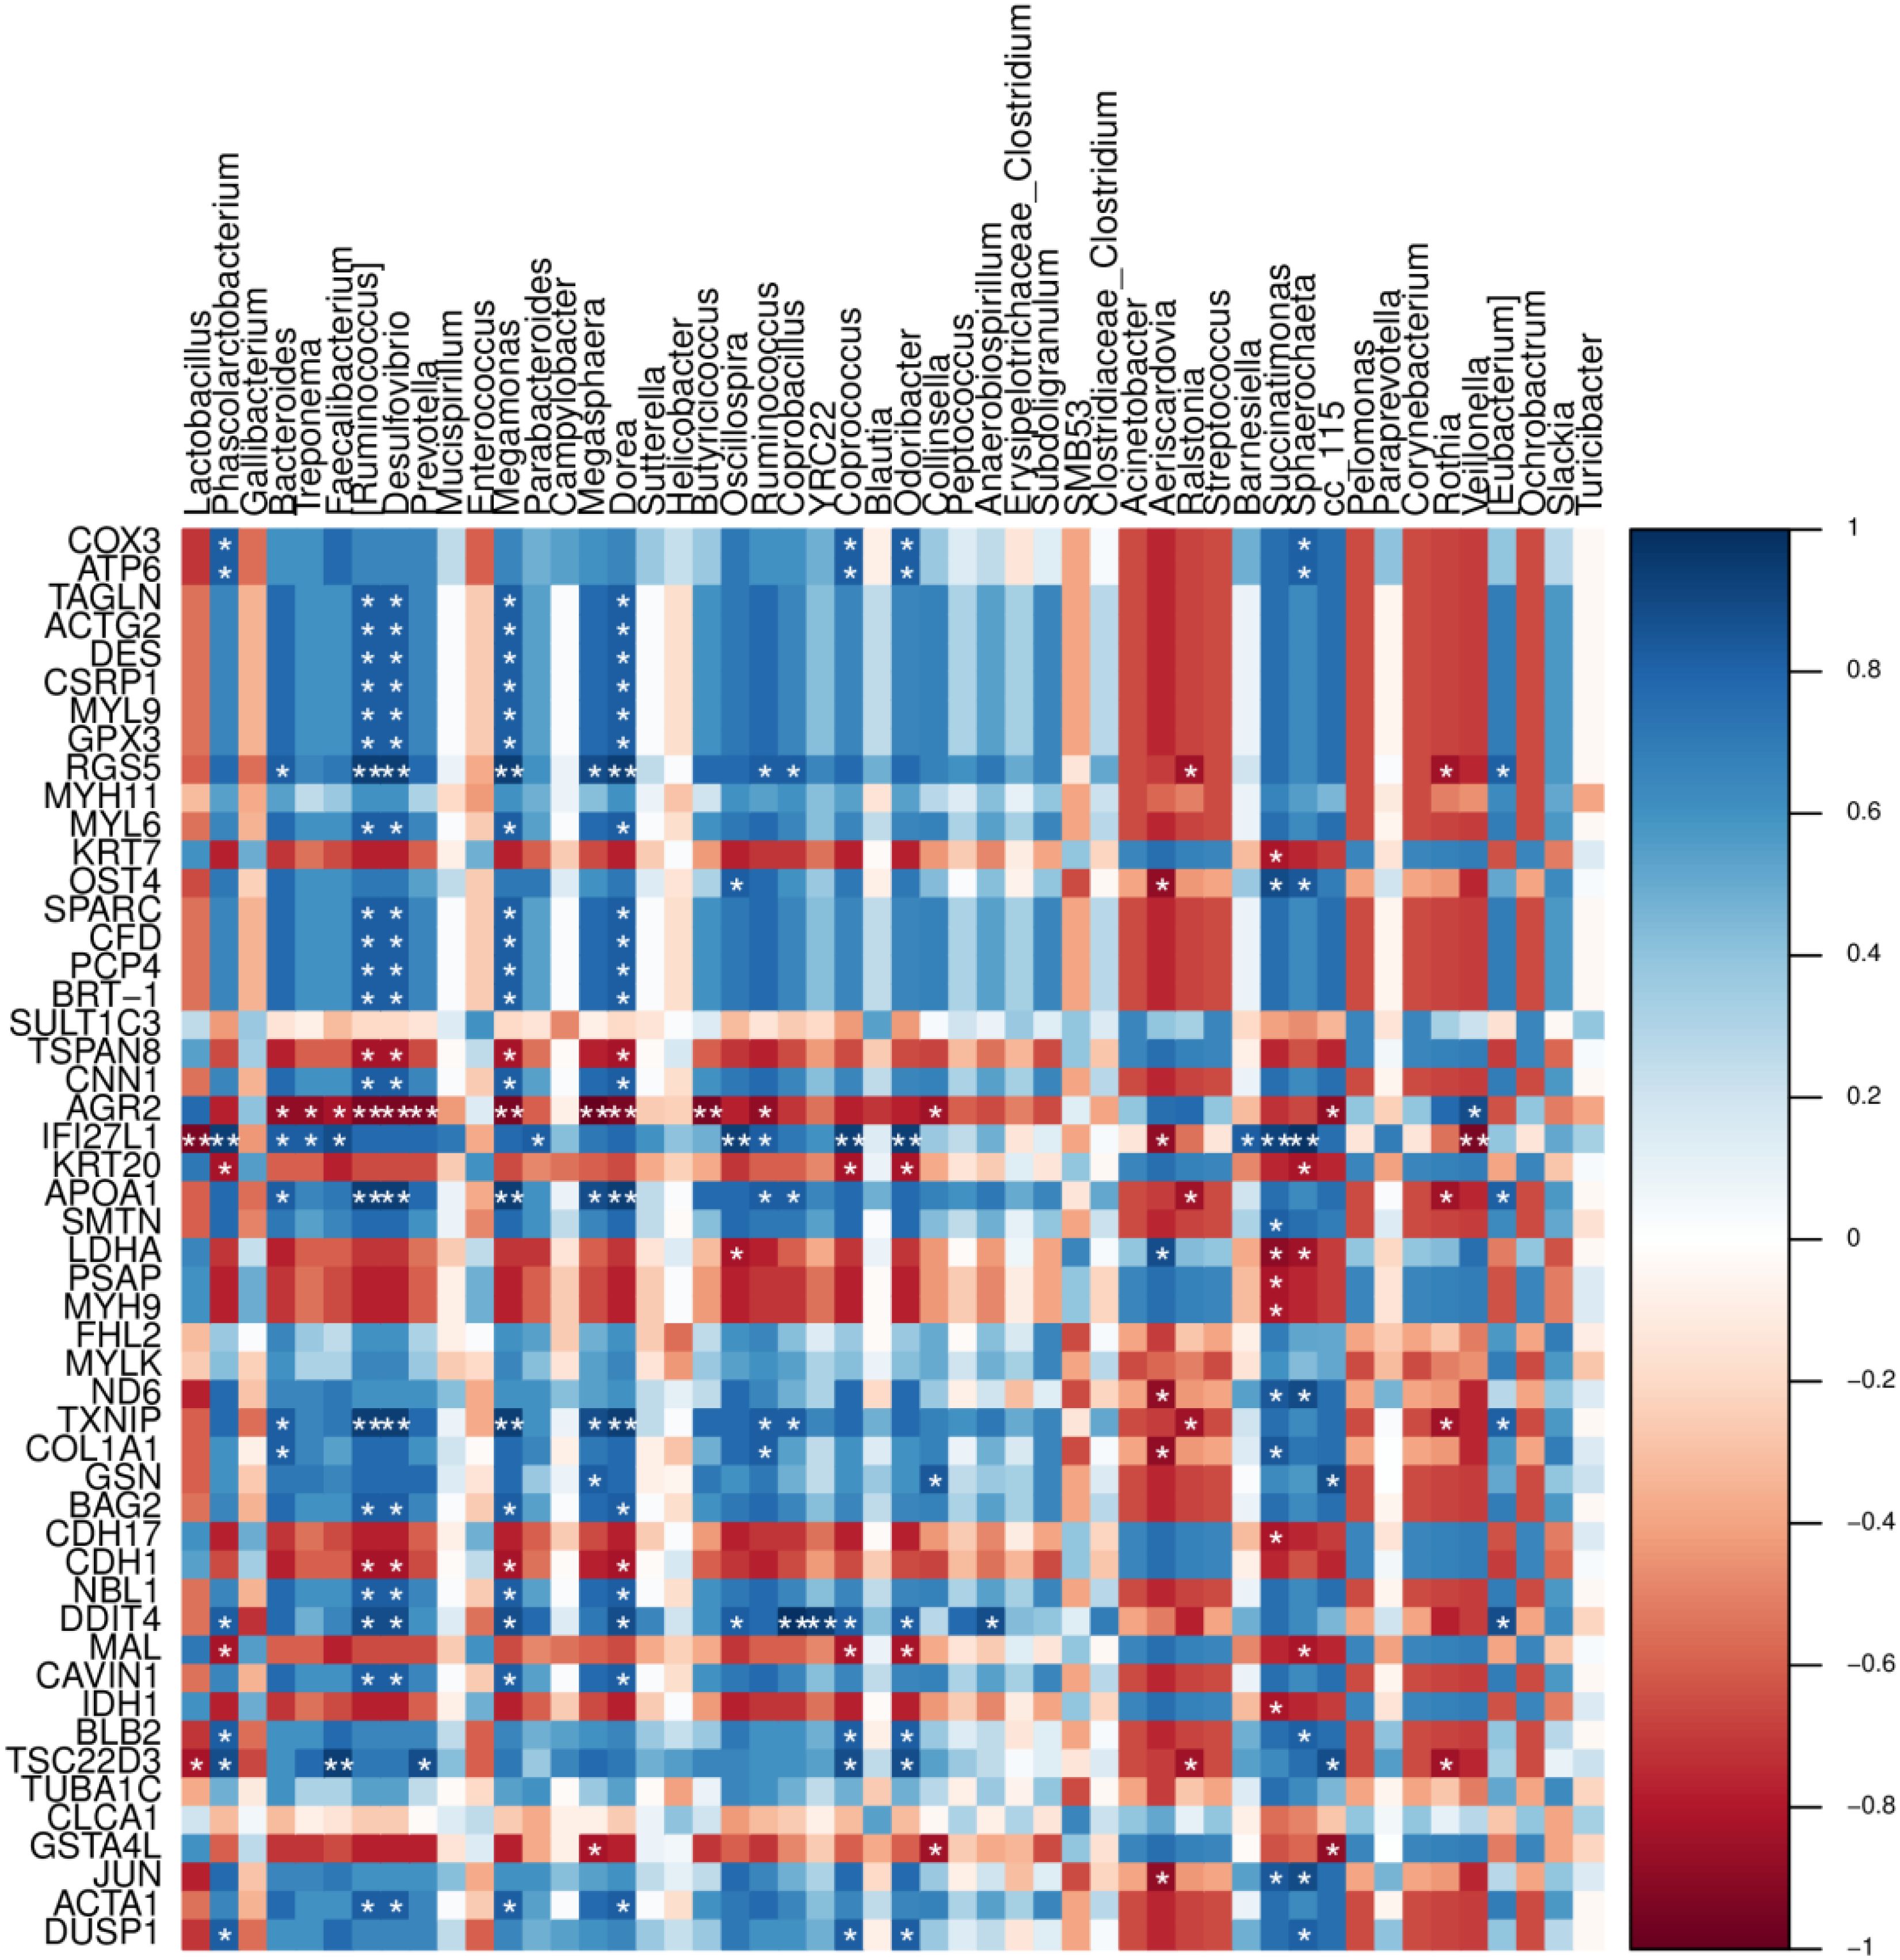
Figure 11. Heat map of the correlation between bacterial species and metabolome test results. Blue, positive correlation; red, negative correlation. The depth of color indicates the strength of correlation. *Identifies “species metabolite” with significant association (P <0.05).
3.17 Correlation network analysis
The number of lines connecting node genes was calculated to determine the genes or microorganisms directly linked to each node gene (Figure 12). For example, KRT6A had 1,291 directly linked genes or microorganisms, including Lactobacillus-like microorganisms and genes potentially involved in cell signaling or metabolic regulation. In contrast, ASCL3 had 984 directly-linked genes or microorganisms, associated with microorganisms (e.g., those involved in intestinal immune regulation) and other genes (e.g., those related to cell differentiation and tissue development). Lactobacillus had 1,297 directly-linked genes or microorganisms, connected to numerous genes, including keratin genes, metabolism-related genes, and signaling genes. Bacteroides had 1,297 directly-linked genes or microorganisms, connected to various types of gene, including those involved in intestinal barrier function, immune regulation, and nutritional metabolism. Ruminococcus had 1,347 directly-related genes or microorganisms, linked to genes involved in fiber degradation, energy metabolism, and potentially hormone-level-affecting genes.
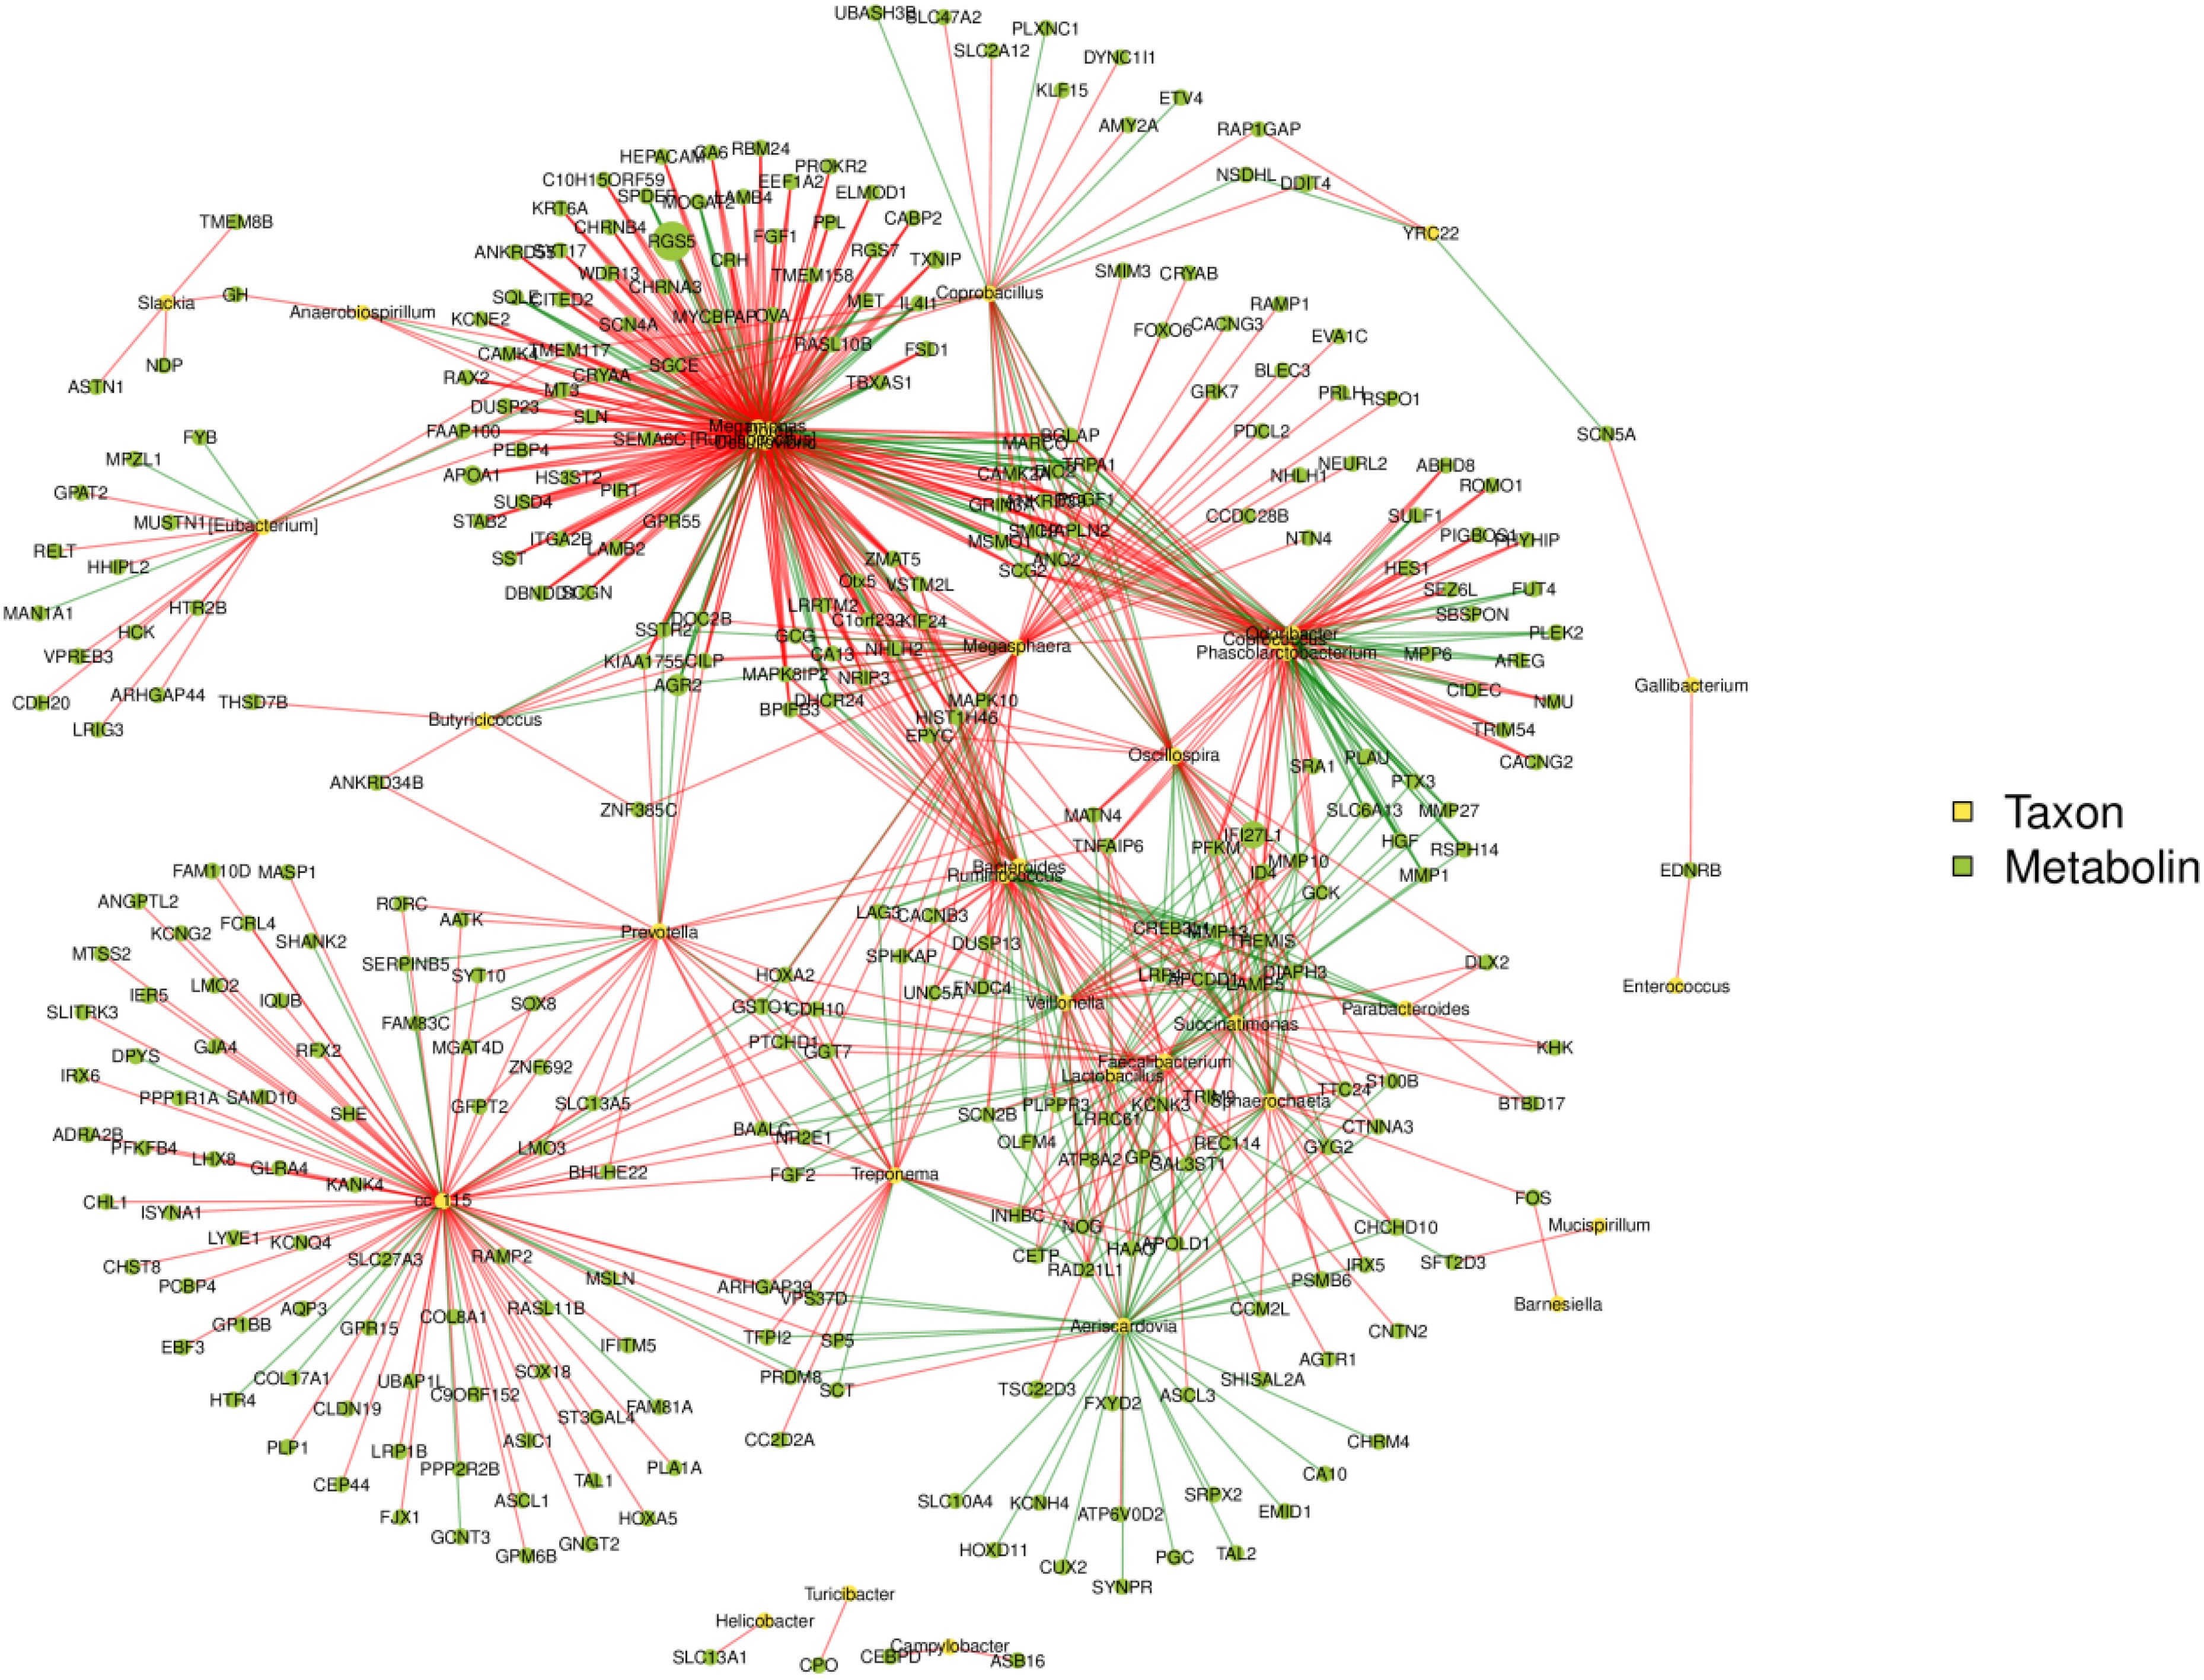
Figure 12. Association network diagram between taxa and genes. Red lines indicate a positive correlation and green lines indicate a negative correlation between the nodes. The more connections through a node, the more microflora information is associated with it. The larger the node, the higher the value of the species abundance/detection index represented by that node.
4 Discussion
4.1 Relationship between phenotypic differences and feather coverage in laying hens with high and low feather coverage
The only significant phenotypic difference identified between laying hens with high and low feather coverage was that Group H had a significantly higher feather score compared with Group L. This demonstrated that the feather condition in group H was superior and, thus, validating the grouping approach used in the study.
There were slight differences in some of the other phenotypic characters examined, such as slightly higher body weight, abdominal fat, tibia length, and follicle number in Group H compared with Group L. However, these differences were not significant, suggesting that feather coverage as determined in the current study has minimal impact on these features or that other factors were involved in their regulation. Further studies are required to investigate the longer term effect of differences in feather coverage on the phenotypes of laying hens.
4.2 Association between microbial community diversity and feather coverage
In terms of microbial community diversity, the alpha diversity metrics of Group L (Chao1, Faith_pd, Shannon, Simpson, Pielou_e, and Observed_species) were significantly higher than those of Group H (P <0.05). This indicated that the cecal microbial community in Group L exhibited greater diversity, richness, phylogenetic diversity, and evenness. Such differences could have significant implications for feather coverage in laying hens. The increased microbial diversity in group L likely provided a broader range of metabolic functions and ecological services, potentially supporting enhanced physiological adaptability and health in these hens.
At the phylum level, the dominant microbial taxa in the cecum were Bacteroidetes, Firmicutes, and Proteobacteria, findings that aligned with previous research that demonstrated that the intestinal microbiota of chickens predominantly comprises Firmicutes and Bacteroidetes (Wei et al., 2013), a composition also commonly observed in other avian species (Wang et al., 2016). Notably, the combined abundance of Firmicutes and Bacteroidetes in Group L exceeded 60%, with relatively balanced proportions between the two phyla. In contrast, the abundance of Firmicutes in Group H surpassed 70%, suggesting a less diverse microbial community. This observation is consistent with the findings of Videnska et al. (2014), who reported that Bacteroidetes constituted >50% of the cecal microbiome in laying hens older than 26 weeks. However, the latter results differed slightly from the current study, likely because of the natural decline in feather coverage with age and the use of average feather coverage values for specific age groups in their analysis. We hypothesize that Firmicutes has a particularly significant role in influencing feather coverage in laying hens, given that this phylum enhances nutrient absorption and utilization, bolsters immune function, maintains intestinal health, and improves overall production performance (Simon et al., 2016). In addition, enzymes such as keratinase, which could reach feather follicles via the circulation or other physiological pathways, are produced and regulated by microbial activity, contributing to feather keratin synthesis and metabolic processes (Yahaya et al., 2022).
Furthermore, Group H exhibited higher body weight, abdominal fat weight, semi-eviscerated weight, spleen weight, glandular stomach weight, and ovarian weight compared with Group L. Although these differences were not significant, they could also be attributed to the higher abundance of Firmicutes in Group H, which likely supports more efficient nutrient metabolism and energy storage. These findings underscored the potential role of the gut microbiota in modulating physiological traits related to feather coverage and overall hen health.
4.3 Potential relationship between key microbial groups and feather coverage
LEfSe analysis indicated that specific groups within Firmicutes and Actinobacteria could serve as markers for feather coverage. Bacilli are crucial for maintaining intestinal health and can influence nutrient metabolism and absorption by regulating the intestinal microecological balance (Forte et al., 2016; Nishiyama et al., 2021). Through their positive modulation of the immune system, Bacillus spp. aid normal feather growth and appearance, while reducing issues, such as feather damage and shedding caused by disease.
Regulation of the intestinal microbiome by Lactobacillales can change the absorption efficiency or metabolic environment of tryptophan. This, in turn, affects the role of tryptophan in neurotransmitter synthesis and immune regulation, ultimately influencing the feather pecking behavior and health of laying hens (Mindus et al., 2021).
Actinobacteria, Bifidobacteria, and Bacillaceae have been reported to enhance animal feed utilization by producing extracellular enzymes, such as amylase and protease (Li et al., 2018; Ma et al., 2018). Actinobacteria can also decompose undigested feed components by secreting endogenous enzymes (cellulase, chitinase, xylanase, and pectinase). These enzymes can partially hydrolyze low-digestible components in poultry diets and mitigate their anti-nutritional effects by reducing the viscosity of intestinal chyme, thus improving nutrient digestion and absorption. Actinobacteria is regarded as a key group in regulating the function of the gut microbiome because of its production of bacteriocins (Ma et al., 2018) and its capacity to convert feed into fermentable microbial biomass (Oladokun et al., 2021; Elshaghabee et al., 2017; Franz et al., 2011).
4.4 Correlation between differential microbial metabolic pathways and feather growth
The spliceosome pathway is crucial in RNA processing post-gene transcription (Mindus et al., 2021). Dysfunction in this pathway can result in abnormal splicing of gene transcripts related to feather growth, thereby impacting protein expression and function.
Bacterial chemotaxis pathways enable microbes to detect and move toward favorable environments (Karmakar, 2021), while flagellar assembly pathways endow microorganisms with motility (Chilcott and Hughes, 2000). These allow for better microbial distribution in the gut and more efficient nutrient uptake.
During summer, laying hens with thick feathers are prone to accumulating a large amount of reactive oxygen species (ROS). Excessive ROS can damage the cell membrane structure and intracellular biological macromolecules (such as proteins and DNA). The antioxidant enzymes in the peroxisome pathway can eliminate excess ROS (Pei et al., 2023), protecting feather cells from oxidative damage, ensuring normal cell metabolism, and promoting feather growth and development.
The porphyrin and chlorophyll metabolism pathway, amino acid biosynthesis and metabolism pathways, and glyoxylate and dicarboxylate metabolism pathways are associated with nutrient metabolism, while heme is involved in the electron transport chain during cell respiration. Feather cell growth, proliferation, and keratin synthesis all have high energy demands. The porphyrin and chlorophyll metabolism pathway affects the synthesis or metabolic regulation of substances such as heme by microorganisms (Bonkovsky et al., 2013). In Group L, upregulation of this pathway may enhance cell respiration efficiency and ATP production, which, apart from maintaining feather cell growth and function, could be utilized to improve the production performance of laying hens.
For laying hens with low feather coverage, phenylalanine, tyrosine, and tryptophan biosynthesis, along with alterations in the phenylalanine metabolic pathway, are vital for feather growth. These amino acids are fundamental for protein synthesis and because feathers mainly comprise keratin, an adequate and balanced amino acid supply is essential. Microbial regulation of these amino acid metabolic pathways can alter the availability of amino acids in laying hens, thus affecting feather keratin synthesis and growth quality. Phenylalanine is a precursor for thyroid hormone synthesis (Elkin et al., 1980), which has a significant regulatory role in feather growth and development (Liu et al., 2021). Abnormal thyroid hormone levels can impact feather cell proliferation and differentiation. Tryptophan is a precursor for the neurotransmitter serotonin (Mindus et al., 2021), involved in regulating animal behavior and physiological processes, and could indirectly affect the pecking behavior of laying hens and, consequently, feather coverage. Tyrosine is involved in melanin synthesis (Li et al., 2023), and melanin influences feather color and structural stability.
The glyoxylate and dicarboxylate metabolism pathway affects the energy and material metabolism balance in laying hens with low feather coverage, providing essential metabolic intermediates and energy for feather growth. These intermediates may also participate in the tricarboxylic acid cycle (Akram, 2014) to supply energy to cells. An insufficient supply can disrupt feather cell energy metabolism and growth. Simultaneously, changes in this pathway might also affect the synthesis of other biomolecules, such as fatty acids and amino acids, which are crucial for maintaining feather cell structure and function.
Immune regulation and microbial-host interaction-related pathways significantly impact the feather growth of laying hens with low feather coverage. Changes in epithelial signaling pathways during Helicobacter pylori infection affect intestinal barrier function and the immune response (Kumar et al., 2023), indirectly influencing feather growth. Abnormal pathways can cause nutrient malabsorption, chronic inflammation, or immunosuppression, and damage the hair follicle structure. The upregulation of the β-lactam resistance pathway reflects the adaptive response of the microbial community (Ruelens and de Visser, 2021), and its changes affect the composition and function of the microbial community. A decrease in beneficial bacteria and an increase in harmful bacteria will interfere with the physiological functions of laying hens and inhibit feather growth. Changes in the glycosaminoglycan degradation pathway affect intestinal mucosal integrity and function, leading to barrier damage, pathogen invasion, inflammatory responses, and adverse effects on hair follicles (Paneque et al., 2023), ultimately affecting feather growth. Histamine impacts angiogenesis (Qin et al., 2013), and its imbalance leads to insufficient nutrient and oxygen supply to hair follicles. Its metabolic intermediates are related to antioxidant functions (Kuder et al., 2021), and abnormal feather cells are prone to oxidative damage, affecting feather appearance and texture. The histidine and biotin metabolic pathways interact to influence gene expression and interact with microbial community metabolic pathways, being influenced by feather coverage and vice versa.
When rearing hens, nutrition and the microbial community can be regulated to maintain balance and promote feather growth. However, the causal relationship between these pathways and feather coverage requires further investigation. Microbial transplantation and gene editing could be used to clarify the underlying mechanisms.
4.5 Relationship between gene expression difference and feather coverage
In terms of biological processes, the enrichment of ion transport and cation transport highlights the significance of maintaining ion balance both inside and outside the cell during feather growth. Changes in the expression of genes associated with ion transport can impact cellular physiological states, such as osmotic pressure and potential (Doohan and Rasmussen, 1993; Evans and Somero, 2008). In turn, this influences the growth, differentiation, and structural maintenance of feather cells.
In terms of cell composition, the enrichment of intrinsic components of the cell membrane indicates that membrane-related genes are crucial for feather growth. These genes are involved in cellular signaling, material exchange, and interactions with the external environment (Doohan and Rasmussen, 1993; Green and Llambi, 2015). Variations in the expression of receptor protein genes on the cell membrane can affect the ability of the cell to receive and respond to growth signals (Li et al., 2023), thereby influencing feather growth.
In terms of molecular function, the enrichment of transporter activity and transmembrane transporter activity further underscores the importance of nutrient and signal molecule transport in feather growth. Aberrant expression of related genes could result in insufficient nutrient supply or abnormal signal transduction (Rives et al., 2017). For instance, downregulated expression of amino acid transporter genes can limit the supply of amino acids essential for feather growth, thus affecting keratin synthesis.
KEGG enrichment analysis revealed the enrichment of pathways such as MAPK signaling, ErbB signaling, Calcium signaling, and Wnt signaling. These pathways have a vital role in regulating feather growth because they are involved in processes including cell proliferation, differentiation, and apoptosis. Any abnormalities in these pathways can disrupt the normal development of feather cells. For example, the MAPK signaling pathway is important in the cell stress response and growth regulation (Sun et al., 2015). Abnormal gene expression in this pathway during feather growth can lead to improper regulation of cell proliferation and differentiation, ultimately affecting feather coverage.
Metabolic pathways, such as alanine, aspartate, and glutamate metabolism, starch and sucrose metabolism, and steroid biosynthesis also impact feather growth. They influence the metabolic processing of nutrients, providing the energy and material basis for feather growth, while the starch and sucrose metabolic pathways affect carbohydrate utilization (Zhou et al., 2023). Changes in the expression of related genes can impact energy supply, thereby affecting the growth rate and quality of feathers.
Furthermore, cell connection-related pathways, such as adherens and tight junctions, are also significant. Abnormalities in these pathways can affect cell-cell interactions and tissue integrity (Otani and Furuse, 2020; Troyanovsky, 2023). Abnormal gene expression can damage the skin barrier function, disrupt the microenvironment for feather growth, and indirectly influence feather coverage.
4.6 Potential regulatory mechanisms revealed by multi-omics association analysis
Through CIA co-inertia and association heat-map analyses, a strong association was detected between microbiome and transcriptomic data (RV = 0.8103694, P<0.04), indicating an interaction between microbial communities and host gene transcription. In the correlation heat map, significant correlations were identified between multiple microbial genera and genes associated with feather covering.
A strong correlation existed between Lactobacillus and genes such as CETP, NOG, and RAD21L1. This suggests that Lactobacillus influenced the physiological processes of laying hens by regulating the expression of these genes, thereby affecting feather cover. CETP is implicated in lipid metabolism (Nicholls and Nelson, 2022), NOG plays a part in bone development (Dixon et al., 2001), and RAD21L1 is associated with cell division and chromosome stability (Gutiérrez-Caballero et al., 2011). The association of Lactobacillus with these genes suggested at a role in regulating nutrient metabolism, bone development, and cell proliferation in laying hens, all of which are closely linked to feather growth. Bacteroides are associated with MAPK10, EPYC, and HIST1H46. MAPK10 could be involved in regulating the cell-signaling processes related to feather growth (Shoichet et al., 2006) and the correlation between Bacteroides and MAPK10 suggested a potential role in regulating feather-growth signaling pathways.
5 Conclusion
This study elucidates the multidimensional regulatory mechanisms of feather coverage in laying hens, demonstrating that host genetic regulation and gut microbiota interactions jointly govern feather development through nutrient absorption efficiency, keratin metabolic pathways, and neurobehavioral modulation networks. The dominance of Firmicutes in high-feather-coverage groups correlates with enhanced keratin precursor absorption via short-chain fatty acid synthesis, whereas Bacteroidetes enrichment in low-coverage groups aligns with compensatory amino acid metabolism. Synergistic activation of MAPK/Wnt signaling pathways maintains follicular cell proliferation homeostasis while mediating stress-induced feather loss. Three limitations warrant consideration. First, as this is a cross-sectional study, it has limitations in causal inference. Future longitudinal studies are needed to establish more conclusive causal relationship. Second, the 400-hen cohort, though statistically robust, lacks representation of heterogeneity across farming systems. Third, the temporal dynamics of microbe-host interplay require validation through fecal microbiota transplantation experiments to establish causality. Future investigations should prioritize: 1) Deciphering microbiota colonization patterns during critical feather-development phases and their epigenetic coupling mechanisms; 2) Developing machine learning models to predict feather quality using microbial functional biomarkers; 3) Quantifying dose-response thresholds of phenylalanine/tryptophan metabolism in modulating pecking behaviors.
Data availability statement
The data presented in the study related to BioProject are deposited in the NCBI BioProject repository, accession number PRJNA1275857.
Ethics statement
The animal studies were approved by Animal Ethics Committee of Shanghai Academy of Agricultural Sciences. The studies were conducted in accordance with the local legislation and institutional requirements. Written informed consent was obtained from the owners for the participation of their animals in this study.
Author contributions
XL: Data curation, Software, Writing – original draft, Writing – review & editing. XS: Data curation, Supervision, Visualization, Writing – review & editing. XW: Conceptualization, Investigation, Writing – review & editing. YY: Data curation, Formal analysis, Writing – original draft. WL: Methodology, Validation, Writing – review & editing. KZ: Project administration, Visualization, Writing – original draft. DH: Funding acquisition, Resources, Writing – review & editing. CY: Funding acquisition, Resources, Writing – review & editing. HY: Data curation, Resources, Writing – review & editing. JY: Data curation, Funding acquisition, Writing – review & editing.
Funding
The author(s) declare that financial support was received for the research and/or publication of this article. This research was funded by the China Agriculture Research System (CARS-40-K03), the National Key Research and Development Program of China (2022YFD1300100), and the SAAS Program for Excellent Research Team (2022-021).
Conflict of interest
The authors declare that the research was conducted in the absence of any commercial or financial relationships that could be construed as a potential conflict of interest.
Generative AI statement
The author(s) declare that no Generative AI was used in the creation of this manuscript.
Publisher’s note
All claims expressed in this article are solely those of the authors and do not necessarily represent those of their affiliated organizations, or those of the publisher, the editors and the reviewers. Any product that may be evaluated in this article, or claim that may be made by its manufacturer, is not guaranteed or endorsed by the publisher.
Supplementary material
The Supplementary Material for this article can be found online at: https://www.frontiersin.org/articles/10.3389/fanim.2025.1597218/full#supplementary-material
References
Akram M. (2014). Citric acid cycle and role of its intermediates in metabolism. Cell Biochem. Biophys. 68, 475–478. doi: 10.1007/s12013-013-9750-1
Bokulich N. A., Dillon M. R., Zhang Y., Rideout J. R., Bolyen E., Li H., et al. (2018). q2-longitudinal: longitudinal and paired-sample analyses of microbiome data. mSystems. 3 (6), e00219-18. doi: 10.1128/mSystems.00219-18
Bonkovsky H. L., Guo J. T., Hou W., Li T., Narang T., and Thapar M. (2013). Porphyrin and heme metabolism and the porphyrias. Compr. Physiol. 3, 365–401. doi: 10.1002/cphy.c120006
Callahan B. J., McMurdie P. J., Rosen M. J., Han A. W., Johnson A. J., and Holmes S. P. (2016). DADA2: High-resolution sample inference from Illumina amplicon data. Nat. Methods 13, 581–583. doi: 10.1038/nmeth.3869
Cheng T. K., Peguri A., Hamre M. L., and Coon C. N. (1991). Effect of rearing regimens on pullet growth and subsequent laying performance. Poult Sci. 70, 907–916. doi: 10.3382/ps.0700907
Chilcott G. S. and Hughes K. T. (2000). Coupling of flagellar gene expression to flagellar assembly in Salmonella enterica serovar typhimurium and Escherichia coli. Microbiol. Mol. Biol. Rev. 64, 694–708. doi: 10.1128/mmbr.64.4.694-708.2000
DeSantis T. Z., Hugenholtz P., Larsen N., Rojas M., Brodie E. L., Keller K., et al. (2006). Greengenes, a chimera-checked 16S rRNA gene database and workbench compatible with ARB. Appl. Environ. Microbiol. 72, 5069–5072. doi: 10.1128/aem.03006-05
Dixon M. E., Armstrong P., Stevens D. B., and Bamshad M. (2001). Identical mutations in NOG can cause either tarsal/carpal coalition syndrome or proximal symphalangism. Genet. Med. 3, 349–353. doi: 10.1097/00125817-200109000-00004
Doohan M. M. and Rasmussen H. H. (1993). Myocardial cation transport. J. Hypertens. 11, 683–691. doi: 10.1097/00004872-199307000-00001
Elkin R. G., Featherston W. R., and Rogler J. C. (1980). Effects of dietary phenylalanine and tyrosine on circulating thyroid hormone levels and growth in the chick. J. Nutr. 110, 130–138. doi: 10.1093/jn/110.1.130
Elshaghabee F. M. F., Rokana N., Gulhane R. D., Sharma C., and Panwar H. (2017). Bacillus as potential probiotics: status, concerns, and future perspectives. Front. Microbiol. 8. doi: 10.3389/fmicb.2017.01490
Evans T. G. and Somero G. N. (2008). A microarray-based transcriptomic time-course of hyper- and hypo-osmotic stress signaling events in the euryhaline fish Gillichthys mirabilis: osmosensors to effectors. J. Exp. Biol. 211, 3636–3649. doi: 10.1242/jeb.022160
Forte C., Moscati L., Acuti G., Mugnai C., Franciosini M. P., Costarelli S., et al. (2016). Effects of dietary Lactobacillus acidophilus and Bacillus subtilis on laying performance, egg quality, blood biochemistry and immune response of organic laying hens. J. Anim. Physiol. Anim. Nutr. (Berl) 100, 977–987. doi: 10.1111/jpn.12408
Franz C. M., Huch M., Abriouel H., Holzapfel W., and Gálvez A. (2011). Enterococci as probiotics and their implications in food safety. Int. J. Food Microbiol. 151, 125–140. doi: 10.1016/j.ijfoodmicro.2011.08.014
Green D. R. and Llambi F. (2015). Cell death signaling. Cold Spring Harb. Perspect. Biol. 7 (12), a006080. doi: 10.1101/cshperspect.a006080
Gutiérrez-Caballero C., Herrán Y., Sánchez-Martín M., Suja J. A., Barbero J. L., Llano E., et al. (2011). Identification and molecular characterization of the mammalian α-kleisin RAD21L. Cell Cycle 10, 1477–1487. doi: 10.4161/cc.10.9.15515
Herremans M., Decuypere E., and Siau O. (1989). Effects of feather wear and temperature on prediction of food intake and residual food consumption. Br. Poult Sci. 30, 15–22. doi: 10.1080/00071668908417121
Hughes B. O. (1980). Feather damage in hens caged individually. Br. Poult Sci. 21, 149–154. doi: 10.1080/00071668008416652
Karmakar R. (2021). State of the art of bacterial chemotaxis. J. Basic Microbiol. 61, 366–379. doi: 10.1002/jobm.202000661
Katoh K., Misawa K., Kuma K., and Miyata T. (2002). MAFFT: a novel method for rapid multiple sequence alignment based on fast Fourier transform. Nucleic Acids Res. 30, 3059–3066. doi: 10.1093/nar/gkf436
Kemp P. F. and Aller J. Y. (2004). Bacterial diversity in aquatic and other environments: what 16S rDNA libraries can tell us. FEMS Microbiol. Ecol. 47, 161–177. doi: 10.1016/s0168-6496(03)00257-5
Kim D. H., Lee Y. K., Kim S. H., and Lee K. W. (2020). The impact of temperature and humidity on the performance and physiology of laying hens. Anim. (Basel) 11 (1), 56. doi: 10.3390/ani11010056
Kjaer J., Maria G. A., and Cepero R. (2005). Applied scoring of integument and health in laying hens. Anim. Sci. Pap. Rep. 23 (Suppl 1).
Kõljalg U., Nilsson R. H., Abarenkov K., Tedersoo L., Taylor A. F., Bahram M., et al. (2013). Towards a unified paradigm for sequence-based identification of fungi. Mol. Ecol. 22, 5271–5277. doi: 10.1111/mec.12481
Kuder K. J., Kotańska M., Szczepańska K., Mika K., Reiner-Link D., Stark H., et al. (2021). Discovery of potential, dual-active histamine H(3) receptor ligands with combined antioxidant properties. Molecules 26 (8), 2300. doi: 10.3390/molecules26082300
Kumar S., Ahmad M. F., Nath P., Roy R., Bhattacharjee R., Shama E., et al. (2023). Controlling intestinal infections and digestive disorders using probiotics. J. Med. Food 26, 705–720. doi: 10.1089/jmf.2023.0062
Leinonen I., Williams A. G., Wiseman J., Guy J., and Kyriazakis I. (2012). Predicting the environmental impacts of chicken systems in the United Kingdom through a life cycle assessment: egg production systems. Poult Sci. 91, 26–40. doi: 10.3382/ps.2011-01635
Li I. C., Wu S. Y., Liou J. F., Liu H. H., Chen J. H., and Chen C. C. (2018). Effects of Deinococcus spp. supplement on egg quality traits in laying hens. Poult Sci. 97, 319–327. doi: 10.3382/ps/pex281
Li Z., Xu C., Yu H., Kong L., Liu S., and Li Q. (2023). Effects of dietary cystine and tyrosine supplementation on melanin synthesis in the pacific oyster (Crassostrea gigas). Mar. Biotechnol. (NY) 25, 537–547. doi: 10.1007/s10126-023-10223-6
Liu Z. L., Xue J. J., Huang X. F., Chen Y., Wang Q. G., Zhang S., et al. (2021). Effect of stocking density on growth performance, feather quality, serum hormone, and intestinal development of geese from 1 to 14 days of age. Poult Sci. 100, 101417. doi: 10.1016/j.psj.2021.101417
Ma Y., Wang W., Zhang H., Wang J., Zhang W., Gao J., et al. (2018). Supplemental Bacillus subtilis DSM 32315 manipulates intestinal structure and microbial composition in broiler chickens. Sci. Rep. 8, 15358. doi: 10.1038/s41598-018-33762-8
Martínez-Roldán H., Pérez-Crespo M. J., and Lara C. (2024). Unraveling habitat-driven shifts in alpha, beta, and gamma diversity of hummingbirds and their floral resource. PeerJ 12, e17713. doi: 10.7717/peerj.17713
Mindus C., van Staaveren N., Fuchs D., Gostner J. M., Kjaer J. B., Kunze W., et al. (2021). L. rhamnosus improves the immune response and tryptophan catabolism in laying hen pullets. Sci. Rep. 11, 19538. doi: 10.1038/s41598-021-98459-x
Nicholls S. J. and Nelson A. J. (2022). CETP inhibitors: should we continue to pursue this pathway? Curr. Atheroscler Rep. 24, 915–923. doi: 10.1007/s11883-022-01070-2
Nishiyama T., Nakagawa K., Imabayashi T., Iwatani S., Yamamoto N., and Tsushima N. (2021). Probiotic Bacillus subtilis C-3102 Improves Eggshell Quality after Forced Molting in Aged Laying Hens. J. Poult Sci. 58, 230–237. doi: 10.2141/jpsa.0200081
Oladokun S., Koehler A., MacIsaac J., Ibeagha-Awemu E. M., and Adewole D. I. (2021). Bacillus subtilis delivery route: effect on growth performance, intestinal morphology, cecal short-chain fatty acid concentration, and cecal microbiota in broiler chickens. Poult Sci. 100, 100809. doi: 10.1016/j.psj.2020.10.063
Otani T. and Furuse M. (2020). Tight junction structure and function revisited. Trends Cell Biol. 30, 805–817. doi: 10.1016/j.tcb.2020.08.004
Paneque A., Fortus H., Zheng J., Werlen G., and Jacinto E. (2023). The hexosamine biosynthesis pathway: regulation and function. Genes (Basel) 14 (4), 933. doi: 10.3390/genes14040933
Pei X. D., Li F., Gao T. T., Su L. Y., Yu F. T., Shi P., et al. (2023). Utilization of feather keratin waste to antioxidant and migration-enhancer peptides by Bacillus licheniformis 8-4. J. Appl. Microbiol. 134 (2), lxad005. doi: 10.1093/jambio/lxad005
Price M. N., Dehal P. S., and Arkin A. P. (2009). FastTree: computing large minimum evolution trees with profiles instead of a distance matrix. Mol. Biol. Evol. 26, 1641–1650. doi: 10.1093/molbev/msp077
Puzachenko A. Y. and Markova A. K. (2014). Mammal diversity during the Pleistocene-Holocene transition in Eastern Europe. Integr. Zool 9, 461–470. doi: 10.1111/1749-4877.12059
Qin L., Zhao D., Xu J., Ren X., Terwilliger E. F., Parangi S., et al. (2013). The vascular permeabilizing factors histamine and serotonin induce angiogenesis through TR3/Nur77 and subsequently truncate it through thrombospondin-1. Blood 121, 2154–2164. doi: 10.1182/blood-2012-07-443903
Quast C., Pruesse E., Yilmaz P., Gerken J., Schweer T., Yarza P., et al. (2013). The SILVA ribosomal RNA gene database project: improved data processing and web-based tools. Nucleic Acids Res. 41, D590–D596. doi: 10.1093/nar/gks1219
Rives M. L., Javitch J. A., and Wickenden A. D. (2017). Potentiating SLC transporter activity: Emerging drug discovery opportunities. Biochem. Pharmacol. 135, 1–11. doi: 10.1016/j.bcp.2017.02.010
Rognes T., Flouri T., Nichols B., Quince C., and Mahé F. (2016). VSEARCH: a versatile open source tool for metagenomics. PeerJ 4, e2584. doi: 10.7717/peerj.2584
Ruelens P. and de Visser J. (2021). Choice of β-lactam resistance pathway depends critically on initial antibiotic concentration. Antimicrob. Agents Chemother. 65, e0047121. doi: 10.1128/aac.00471-21
Shi H., Li B., Tong Q., and Zheng W. (2019). Effects of different claw-shortening devices on claw condition, fear, stress, and feather coverage of layer breeders. Poult Sci. 98, 3103–3113. doi: 10.3382/ps/pez083
Shoichet S. A., Duprez L., Hagens O., Waetzig V., Menzel C., Herdegen T., et al. (2006). Truncation of the CNS-expressed JNK3 in a patient with a severe developmental epileptic encephalopathy. Hum. Genet. 118, 559–567. doi: 10.1007/s00439-005-0084-y
Simon K., Verwoolde M. B., Zhang J., Smidt H., de Vries Reilingh G., Kemp B., et al. (2016). Long-term effects of early life microbiota disturbance on adaptive immunity in laying hens. Poult Sci. 95, 1543–1554. doi: 10.3382/ps/pew088
Sun Y., Liu W. Z., Liu T., Feng X., Yang N., and Zhou H. F. (2015). Signaling pathway of MAPK/ERK in cell proliferation, differentiation, migration, senescence and apoptosis. J. Recept Signal Transduct Res. 35, 600–604. doi: 10.3109/10799893.2015.1030412
Troyanovsky S. M. (2023). Adherens junction: the ensemble of specialized cadherin clusters. Trends Cell Biol. 33, 374–387. doi: 10.1016/j.tcb.2022.08.007
Tullett S. G., MacLeod M. G., and Jewitt T. R. (1980). The effects of partial defeathering on energy metabolism in the laying fowl. Br. Poult Sci. 21, 241–245. doi: 10.1080/00071668008416662
Ugarelli K., Campbell J. E., Rhoades O. K., Munson C. J., Altieri A. H., Douglass J. G., et al. (2024). Microbiomes of Thalassia testudinum throughout the Atlantic Ocean, Caribbean Sea, and Gulf of Mexico are influenced by site and region while maintaining a core microbiome. Front. Microbiol. 15. doi: 10.3389/fmicb.2024.1357797
van Krimpen M. M., Binnendijk G. P., van den Anker I., Heetkamp M. J., Kwakkel R. P., and van den Brand H. (2014). Effects of ambient temperature, feather cover, and housing system on energy partitioning and performance in laying hens. J. Anim. Sci. 92, 5019–5031. doi: 10.2527/jas.2014-7627
Videnska P., Sedlar K., Lukac M., Faldynova M., Gerzova L., Cejkova D., et al. (2014). Succession and replacement of bacterial populations in the caecum of egg laying hens over their whole life. PloS One 9, e115142. doi: 10.1371/journal.pone.0115142
Wang W., Cao J., Yang F., Wang X., Zheng S., Sharshov K., et al. (2016). High-throughput sequencing reveals the core gut microbiome of Bar-headed goose (Anser indicus) in different wintering areas in Tibet. Microbiologyopen 5, 287–295. doi: 10.1002/mbo3.327
Wei S., Morrison M., and Yu Z. (2013). Bacterial census of poultry intestinal microbiome. Poult Sci. 92, 671–683. doi: 10.3382/ps.2012-02822
Wu L., Hu Z., Lv Y., Ge C., Luo X., Zhan S., et al. (2024). Hericium erinaceus polysaccharides ameliorate nonalcoholic fatty liver disease via gut microbiota and tryptophan metabolism regulation in an aged laying hen model. Int. J. Biol. Macromol 273, 132735. doi: 10.1016/j.ijbiomac.2024.132735
Yahaya R. S. R., Phang L. Y., Normi Y. M., Abdullah J. O., Ahmad S. A., and Sabri S. (2022). Feather-degrading bacillus cereus HD1: genomic analysis and its optimization for keratinase production and feather degradation. Curr. Microbiol. 79, 166. doi: 10.1007/s00284-022-02861-1
Keywords: laying hens, feather coverage, multi-omics, gut microbiota, transcriptomics
Citation: Li X, Shen X, Wang X, Yan Y, Liu W, Zhan K, He D, Yang C, Yan H and Yao J (2025) Multi-omics exploration of the factors influencing feather coverage in laying hens. Front. Anim. Sci. 6:1597218. doi: 10.3389/fanim.2025.1597218
Received: 20 March 2025; Accepted: 29 May 2025;
Published: 25 June 2025.
Edited by:
Chryssa Bekiari, Aristotle University of Thessaloniki, GreeceReviewed by:
Hongbin Pan, Yunnan Agricultural University, ChinaAmitav Bhattacharyya, U.P. Pandit Deen Dayal Upadhyaya Veterinary University, India
Copyright © 2025 Li, Shen, Wang, Yan, Liu, Zhan, He, Yang, Yan and Yao. This is an open-access article distributed under the terms of the Creative Commons Attribution License (CC BY). The use, distribution or reproduction in other forums is permitted, provided the original author(s) and the copyright owner(s) are credited and that the original publication in this journal is cited, in accordance with accepted academic practice. No use, distribution or reproduction is permitted which does not comply with these terms.
*Correspondence: Huaxiang Yan, eWFuc2FmZXR5QHFxLmNvbQ==; Junfeng Yao, eWFvYmlzb25AMTYzLmNvbQ==
†These authors have contributed equally to this work and share first authorship
 Xin Li
 Xiaohui Shen1†
 Kai Zhan
 Daqian He
 Huaxiang Yan