 Alexandra J. McCarty
 Jan R. McDowell
 Kimberly S. Reece
 Richard A. Snyder
 Karen Hudson1
- 1Virginia Institute of Marine Science, College of William & Mary, Gloucester Point, VA, United States
- 2Virginia Institute of Marine Science Eastern Shore Laboratory, College of William & Mary, Wachapreague, VA, United States
Introduction: The northern quahog (hard clam, Mercenaria mercenaria) aquaculture industry on the Eastern Shore of Virginia produces the top seafood item by value in the Commonwealth of Virginia and is the largest hard clam aquaculture industry in the United States. This work resulted from industry interest in using molecular tools to assess and manage the genetic health of their proprietary broodstock lines.
Methods: To demonstrate the application of molecular methods, scientists and extension specialists genotyped hard clam samples from three commercial companies in Virginia, compared the results with previous work documenting the genetic structure of wild populations along the East Coast of North America, and compiled a toolbox of genetic tests appropriate for industry use.
Results: Principal component analysis, pairwise FST values, and Discriminant Analysis of Principal Components (DAPC) indicated that each group of cultured hard clam samples were significantly different from the wild populations and from each other. However, observed and expected heterozygosity, inbreeding values, and relatedness were similar between the wild populations and cultured stocks. These results have encouraged industry to monitor the genetic features of their broodstock to prevent the loss of genetic diversity and unintentional inbreeding.
Discussion: This project was successful in providing information on the genetic health (diversity and inbreeding) of Virginia hard clam cultured stocks, communicating the utility of genetic tools available for assessing and managing broodstock lines, and providing the hard clam industry with pathways to access additional genetic information in support of industry resilience.
1 Introduction
Broodstock management and hatchery spawning require careful attention to ensure the long-term sustainability of clam fisheries. Hatchery spawning tends to include fewer animals than are expected to contribute to a wild spawning event, which can lead to decreases in genetic diversity compared to wild populations (e.g. Doublet et al., 2019; Hargrove et al., 2015; Hornick and Plough, 2019; Luo et al., 2022; Venney et al., 2021). Selection pressures experienced during hatchery production and commercial field grow out operations can also affect the underlying genetics (i.e. domestication selection, Christie et al., 2012; Frankham, 2008; Howe et al., 2024). Decreased genetic diversity can reduce the adaptive potential of a population, compromising the ability to respond to environmental changes, habitat shifts, and disease outbreaks (e.g. Frankham, 1996; Hoffmann and Sgrò, 2011; Reed and Frankham, 2003; Houston et al., 2020; Fjalestad et al., 2003). Hatchery selection can also result in unintentionally high levels of inbreeding and a subsequent reduction in fitness (i.e. inbreeding depression), which can manifest as reductions in growth, survival, and fecundity (e.g. Evans et al., 2004; Ibarra et al., 1995; Wada and Komaru, 1994; Deng et al., 2005; Zheng et al., 2012). The negative impacts of long-term unintentional inbreeding on spawning success, survival, and economically important traits (such as growth) could have a devasting impact on a company’s success and potentially collapse an entire industry if seed production depends on only a few hatcheries.
The negative consequences of hatchery practices can bleed into wild populations with accidental interbreeding (Ryman-Laikre effects, Ryman and Laikre, 1991; Ryman et al., 1995). Accidental interbreeding can introduce traits that are unfavorable for wild populations (e.g. traits favoring hatchery survival, fast growth; Christie et al., 2012; Frankham, 2008; Howe et al., 2024), cause reductions in local environmental adaptation (e.g. Waal et al., 2013), and reduce overall fitness (Araki et al., 2007, 2008). While selection inevitably decreases genetic diversity and increases levels of inbreeding, it is vital to ensure hatcheries are using the best practices for the sustained success of both commercial operations and wild populations.
Coastal Virginia is home to the largest northern quahog (hard clam, Mercenaria mercenaria) aquaculture industry in the United States. Due to the high salinity requirement of hard clams (Castagna and Chanley, 1973), the Virginia hard clam aquaculture industry is confined to the Eastern Shore of Virginia (ESVA) and the lower Chesapeake Bay, with almost all production (99.9%) occurring on the ESVA. The Virginia hard clam industry has developed considerable expertise in commercial-scale production, and several large private hatcheries supply seed to the majority of growers on the ESVA. For decades, industry hatcheries have relied on broodstock development strategies based on assumptions about genetic diversity and observations of field performance in different locales. While this approach has been successful, commercial hatchery leaders have requested support to ensure sustainability and resilience, especially considering the potential dangers from climate and disease-related threats. Practitioners have voiced concerns about genetic unknowns and have asked how genetic data could provide the information necessary to more accurately manage the genetic health of their proprietary broodstocks.
Hard clam aquaculture in Virginia preceded the growth of the oyster culture industry in the mid-Atlantic region based on pioneering work at the Virginia Institute of Marine Science (VIMS) Eastern Shore Laboratory (Castagna and Kraeuter, 1981; Castagna et al., 1970). Unlike the oyster aquaculture industry that developed with support from the breeding program and genetic expertise at the Aquaculture Genetics & Breeding Technology Center at VIMS, the hard clam industry developed independently, with companies establishing proprietary broodstock lines, intellectual property, and specialized growing procedures and techniques. Today, the major hard clam companies in Virginia produce seed from these proprietary lines. Previous efforts to incorporate industry broodstock into research studies (e.g. Gallivan and Allen, 2000) have been hindered by concerns about researchers’ ability to maintain confidentiality. While general awareness of genetic tools for broodstock management exists, the perceived difficulty of implementing genetic assessments has largely prevented their use in this private sector. Recent work at VIMS characterized the geographic genetic structure of hard clams along the East Coast of North America from Canada to South Carolina, USA (Ropp et al., 2023). These efforts gave the hard clam industry a look at the genetic variation among hard clam populations in the mid-Atlantic region, further stimulating interest in the technology and providing a context for comparing the genetic composition of aquaculture lines to wild populations.
With both a genetic baseline established for wild populations and advances in genetic analysis tools, scientific and extension personnel at VIMS sought to facilitate industry access to genetic assessments useful for broodstock management. The approach was two-fold: 1) to analyze genetic diversity and inbreeding metrics of industry-produced hard clam broodstocks, and 2) to educate industry on the utility of genetic assessments and how to incorporate these tests into operations. Population structure and diversity metrics were analyzed using hard clam genotype data from three independent commercial hard clam companies in Virginia and 14 wild populations from the East Coast of the United States (previously reported in Ropp et al., 2023). Research findings were presented to industry as a formal report during an in-person workshop. This project showed industry how genetic questions can be addressed and the potential utility of various genetic tools available to them.
2 Materials and methods
2.1 Sample collection and DNA extraction
Littleneck hard clams (7/8–1 inch width across hinge) were collected from three retail stores in Virginia (samples labeled cultured Virginia A, B, C) and shellfish tags were checked to ensure the product was sourced from three separate commercial companies. Mantle tissue was sampled lethally from all 71 hard clams (N = 23–24 per retail outlet) and stored in 95% ethanol at -20°C until DNA extraction. Genomic DNA was isolated from mantle tissue using the NucleoSpin Tissue Mini kit for DNA from cells and tissues (Macherey-Nagel Inc., Allentown, PA) with the optional RNAse A step. Extracted DNA was assessed for quality using agarose gel electrophoresis and for quantity and purity using a NanoDrop Spectrophotometer (NanoDrop Technologies Inc., Wilmington, DE).
2.2 Genotyping and molecular marker filtering
For each sample, 30 µL of 100 ng/µL extracted genomic DNA was sent to Diversity Arrays Technology (DArT Pty Ltd, Canberra, Australia) for high-density, high-throughput genotyping-by-sequencing (GBS) using the DArTseq method. DArT sequencing of the commercial hard clams was completed and the resulting Illumina data was combined with the DArT Illumina sequence data previously obtained from 14 wild populations along the East Coast of the United States (Ropp et al., 2023): Middle Bay, ME (MB); Harbor Cove; MA (HC); Cape Cod, MA (CC); Orient Bay, NY (OB); Raritan Bay, NY (RB); Great Bay, NJ (GB); Atlantic City, NJ (AC); Assateague, MD (AT); Wachapreague, VA (WP); Pocomoke Sound (PS); Mobjack Bay (MJ); James River, VA (JR); Bogue Sound, NC (BS); and North Inlet, SC (NI). Acronyms for the wild sample collection location are used when referring to each wild sample group moving forward.
Single nucleotide polymorphisms (SNPs) were called from the combined Illumina sequence data for the 3 commercial stocks and 14 wild populations from a total of 491 hard clam samples. The raw SNP file from Diversity Arrays Technology (DArT Pty Ltd, Canberra, Australia) was filtered to ensure only high quality and high confidence markers were used for genomic analyses (Ropp, 2020; Ropp et al., 2023). Filtering was conducted using dartR (version 2.7.2; Gruber et al., 2018; Mijangos et al., 2022) and radiator (Hardy Weinberg filter, version 1.2.8; Gosselin, 2020) packages in R (R Core Team, 2024). Markers with poor (<5) or high (>75) coverage were removed, along with markers with less than 99% reproducibility. Monomorphic loci, indicating no variation, were removed from the dataset. Markers with a call rate <95% (i.e., >5% missing data) and individuals with a call rate <90% (i.e., >10% missing data) were removed. Redundant data was then addressed by filtering out secondary SNPs and markers with a Hamming distance <20%. Markers with a minor allele frequency <0.1% were removed. Finally, markers that did not conform to Hardy-Weinberg expectations in at least 4 populations using a p-value of 0.01 were removed from the dataset to further ensure that markers used for downstream analyses did not contain genotyping errors or data inconsistencies. R code for filtering is available (see Data Availability).
2.3 Genetic analyses
Genetic analyses were performed using the SNPs remaining after filtering to assess population genetic parameters within and between groups. Genetic diversity and population structure were evaluated using three exploratory and statistical methods. A principal component analysis (PCA) was conducted with the adegenet package in R (version 2.1.10; Jombart, 2008; Jombart and Ahmed, 2011) using 17 PCA axes to visually explore genetic variation both within and among the 17 hard clam sample groups (14 wild populations and 3 commercial stocks). Unbiased F-statistics (FST; Weir and Cockerham, 1984) were estimated in GenoDive (version 3.06, Meirmans, 2020) to infer population structure, and the significance of each pairwise comparison was assessed using 10,000 iterations of the data. Lastly, a discriminate analysis of principal components (DAPC) (Jombart et al., 2010) was performed in adegenet to assess individual-based population structure. The function find.clusters was run to determine the optimal number of PCAs and clusters for grouping the genetic data based on the lowest BIC value. The function xvalDapc was run to determine an optimal number of PCAs to include in the DAPC with 2 discriminant functions (Jombart and Collins, 2015).
Inbreeding was assessed for each sample group by estimating expected heterozygosity (He), observed heterozygosity (Ho) and the level of inbreeding (GIS) in GenoDive (version 3.06, Meirmans, 2020) based on Nei’s genetic distance (Nei, 1987). Average relatedness between individuals in a sample group was estimated using the gl.grm function in dartR (version 2.7.2, Gruber et al., 2018; Mijangos et al., 2022). Significant differences in mean relatedness between the 17 hard clam sample groups were assessed using a Kruskal-Wallis test (Kruskal and Wallis, 1952).
2.4 Communicating results to industry
To address the second objective of this project, we engaged industry representatives during the planning, implementation, and reporting phases. Before genetic samples were collected and analyzed, extension specialists met with industry members to introduce the project and assess which questions or needs were most important to their companies. Based on industry feedback, we obtained commercial samples to explicitly address their concerns by demonstrating the application of genetic tools. Commercial samples were masked during all phases of the project to demonstrate that confidentiality can be maintained. To guide industry members, an infographic was created to outline available genetic tools and describe how these tools can be used within a breeding program.
After sample processing was complete, results from the genetic analyses were summarized in a comprehensive report that paired figures with detailed descriptions of how to interpret the results of each genetic analysis (see Data Availability). A draft of the report and genetic tools table were distributed to industry members so they could familiarize themselves with the concepts and results and respond with questions. An in-person workshop with industry members was subsequently held to present the report and table, have an open discussion on the project results, and discuss how the industry might access the genetic tools. The report and table were structured in a similar manner and the workshop stepped through both resources (the report and table) in a sequential manner to ensure consistency when introducing, explaining, and demonstrating each genetic tool and its applications.
3 Results
3.1 Genotyping and molecular marker filtering
A total of 52,397 single nucleotide polymorphisms (SNPs) from 491 hard clam samples and 17 sample groups were identified from the DArTseq dataset. The final filtered dataset contained 2,435 SNPs and 479 hard clam samples (Table 1). Filtering for markers with <5% missing data removed the greatest number of markers (Table 1). Two wild Wachapreague and 10 cultured Virginia hard clam samples were removed when filtering for individual call rate because they were missing data for >10% of loci.
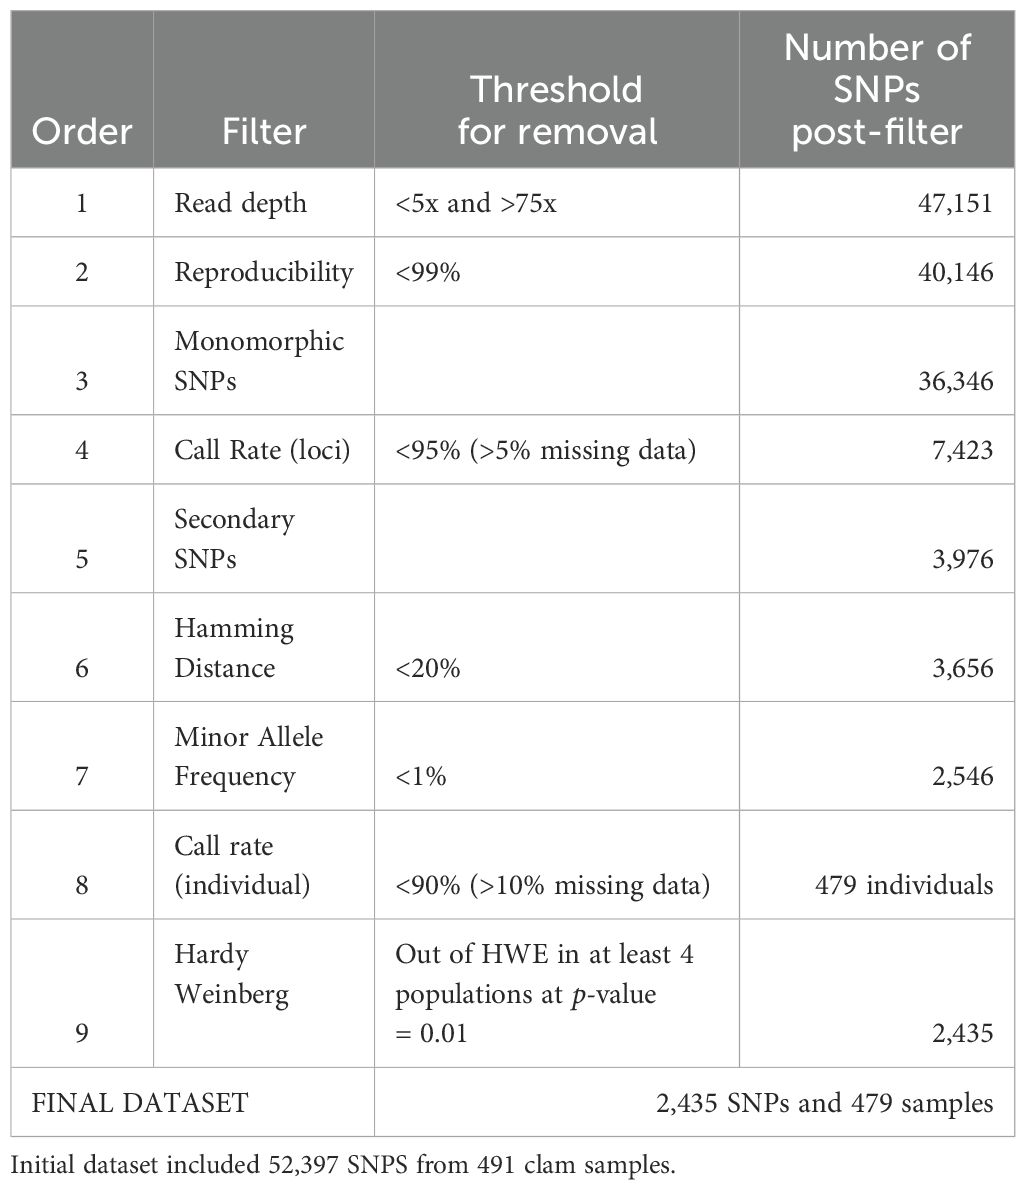
Table 1. Filters applied to the Diversity Array Technology SNP dataset, including the threshold for removal and the number of SNPs or individuals remaining post-filter.
3.2 Genetic diversity and population structure
The FST values depict genetic differentiation between the 14 wild and three cultured commercial stocks. Diversity among wild populations and cultured stocks range from 0 between MJ and JR to 3.5% between MB and cultured Virginia group B (Table 2, upper matrix), and most pairwise comparisons are statistically significantly different (Table 2, lower matrix, p-value < 0.05). Cultured VA hard clam group B is most differentiated from the wild populations (2.4 – 3.5% in comparison with OB and MB, respectively) and is significantly different from every wild population and stock. Within cultured groups, Cultured VA hard clam group B samples are most closely related to cultured Virginia group A samples (0.7%) and most distant from cultured VA group C samples (1.9%). Cultured Virginia groups A and C are intermediate (1.2%). Within the wild populations, the Maine sample group (MB) is most differentiated from the Carolina sample groups (NI 2.2% and BS 2.5%).
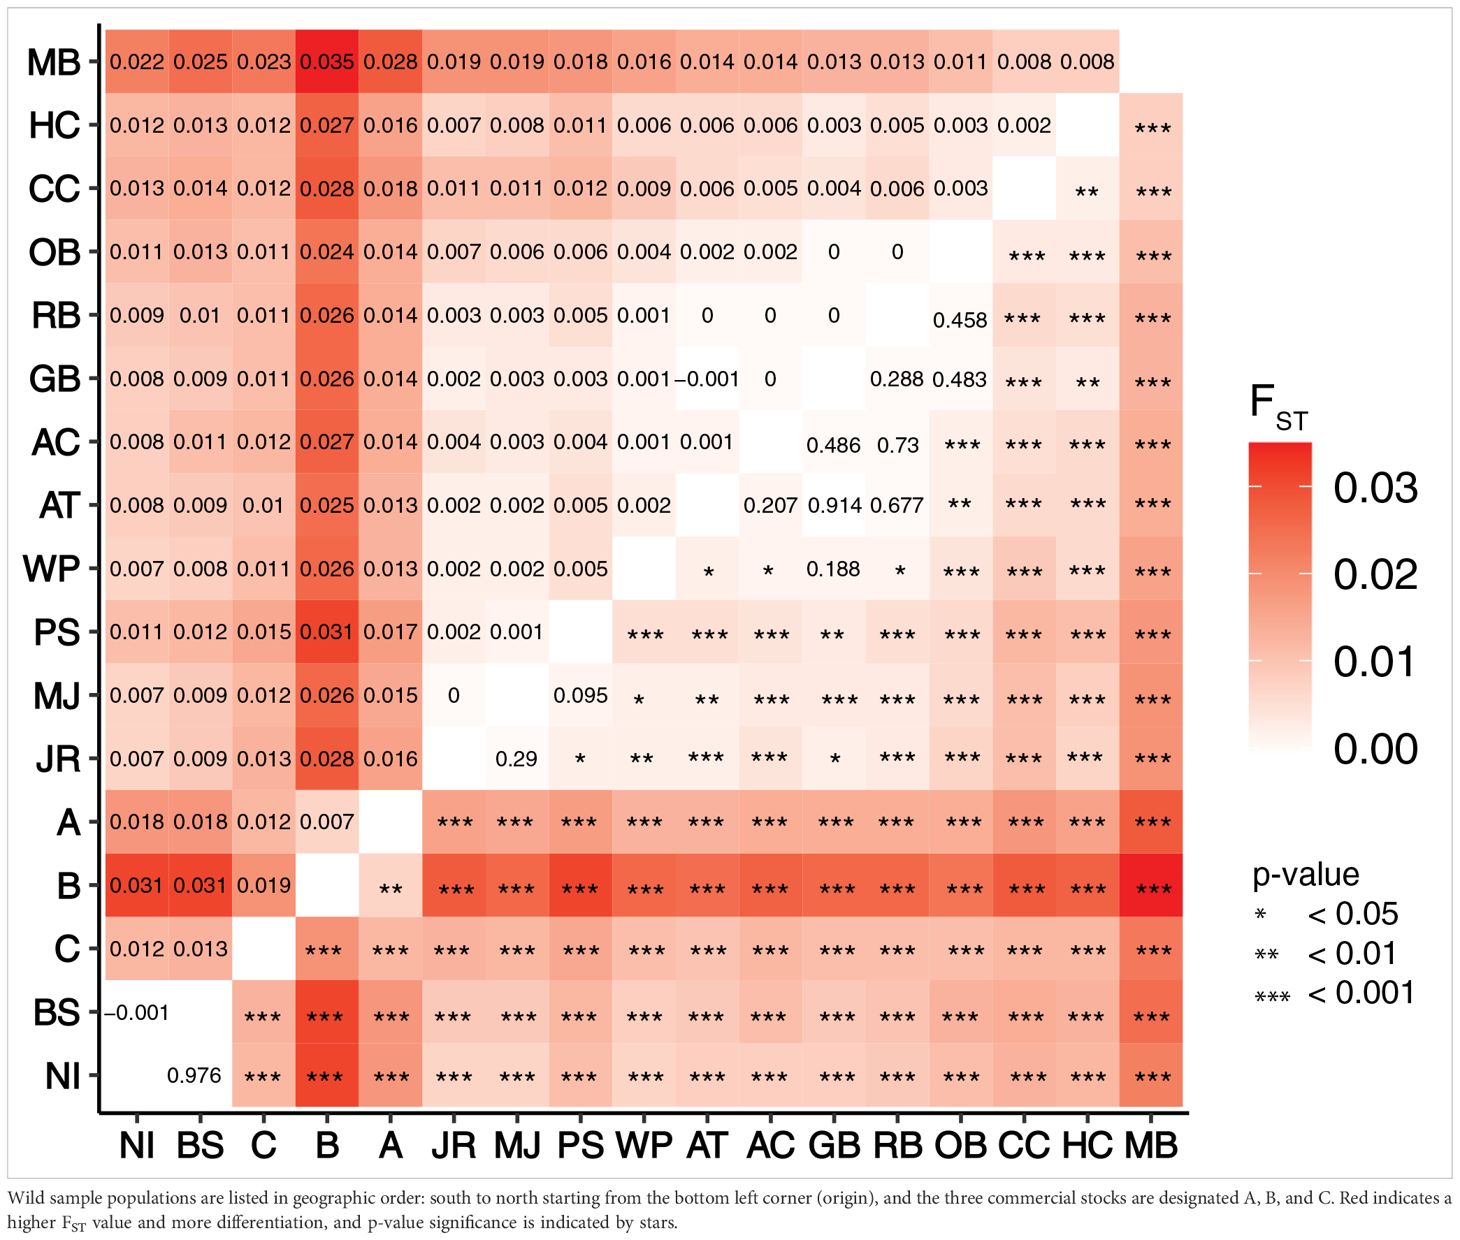
Table 2. Pairwise FST values indicating the difference between each hard clam wild population and cultured stock (upper half of matrix) and the significance value (p-value, lower half of matrix) generated by 10,000 iterations of the data.
Observed heterozygosity (Ho), expected heterozygosity (He), and inbreeding values (GIS) were 0.170 – 0.186, 0.212 – 0.221, and 0.154 – 0.222 for the wild clusters, respectively (Table 3). For the three Virginia cultured stocks, genetic diversity statistics were Ho = 0.172 – 0.173, He = 0.211 – 0.215, and GIS = 0.18 – 0.202 (Table 3). Mean relatedness (r) ranged from 0.0278 – 0.0810 and 0 – 0.0423 for the cultured stocks and wild populations, respectively (Table 3). There was no statistically significant difference in relatedness between groups (Table 3, mean coefficient of relatedness (r) column, Kruskal-Walis, p > 0.05). These results suggest that genetic heterozygosity and inbreeding are not being significantly altered by selective breeding practices within the hatcheries from which these animals originated.
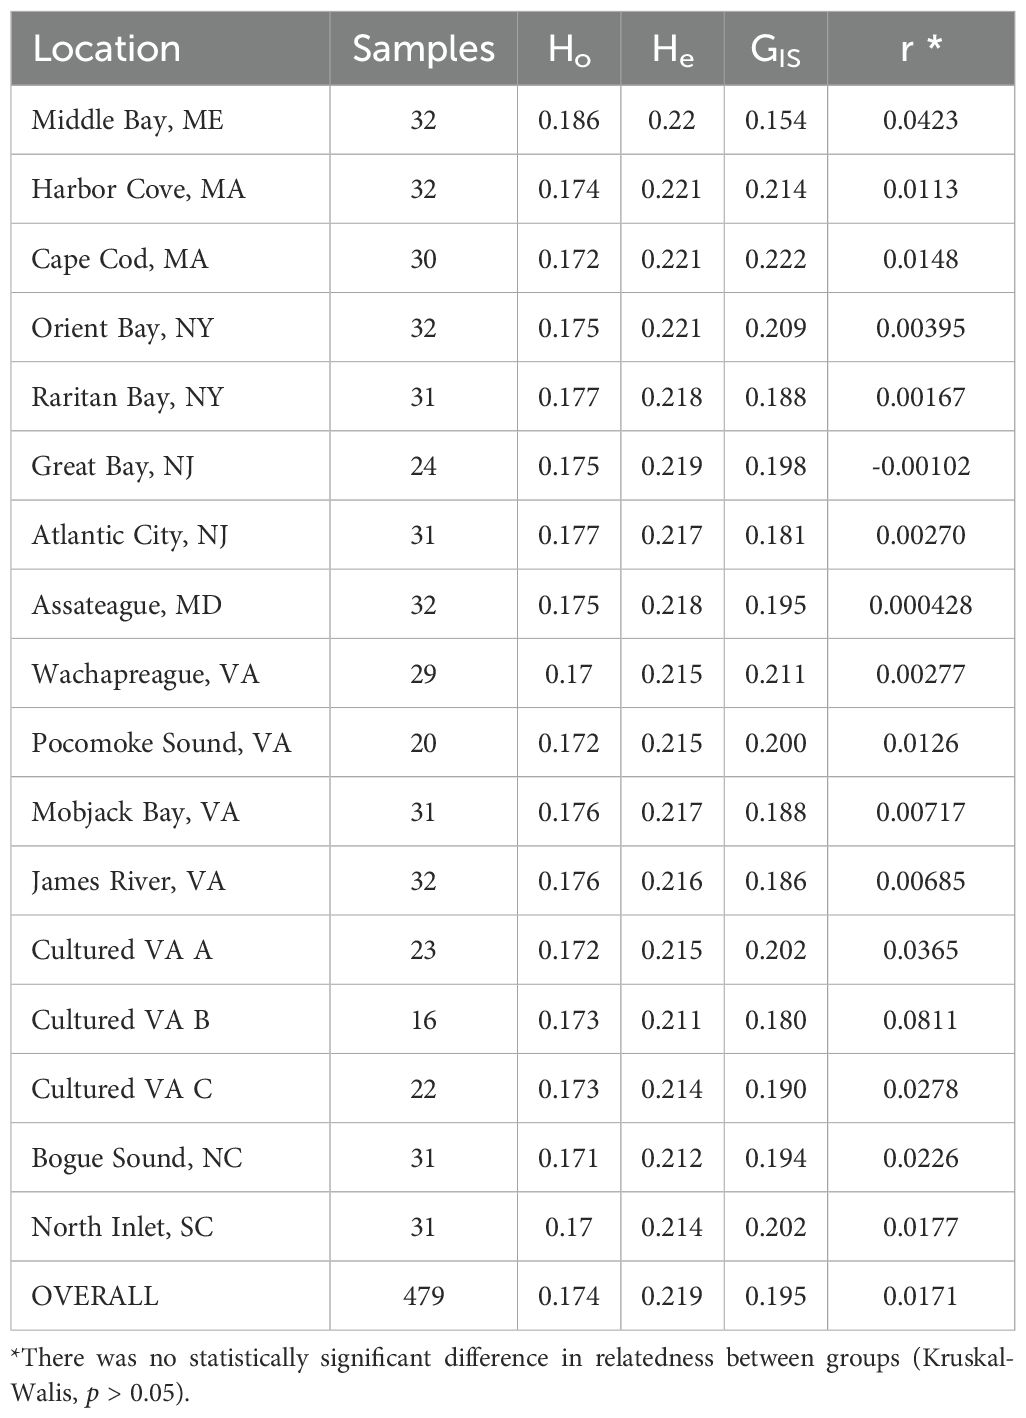
Table 3. Genetic diversity statistics by sampling location organized geographically (North to South): observed heterozygosity (Ho), expected heterozygosity (He), inbreeding (GIS), and mean coefficient of relatedness (r).
The principal component analysis (PCA) illustrates population genetic differences between samples from the 14 wild populations and three cultured stocks. The population structure depicted in the PCA results (Figure 1) is consistent with the diversity metrics (FST values, Table 2). Within each population and stock, hard clams were more closely related to each other than to clams from different populations or stocks, resulting in distinct clusters (colored-coded and grouped with circles, Figure 1). The wild hard clam samples cluster in a north-to-south gradient starting with the northern most New England samples (furthest left, blue), then New York and New Jersey (blue to gold), Maryland (yellow), Virginia (orange), and lastly the southernmost North Carolina and South Carolina samples (red and burgundy, respectively). The cultured Virginia hard clams (green) cluster separately from the natural wild samples, suggesting accrued differences from hatchery-based selection for production. The first two principal components account for only a small percentage of the overall variation—0.80% and 0.76% for principal component 1 and 2, respectively (Figure 1)—yet they effectively distinguish samples based on population or stock origin.
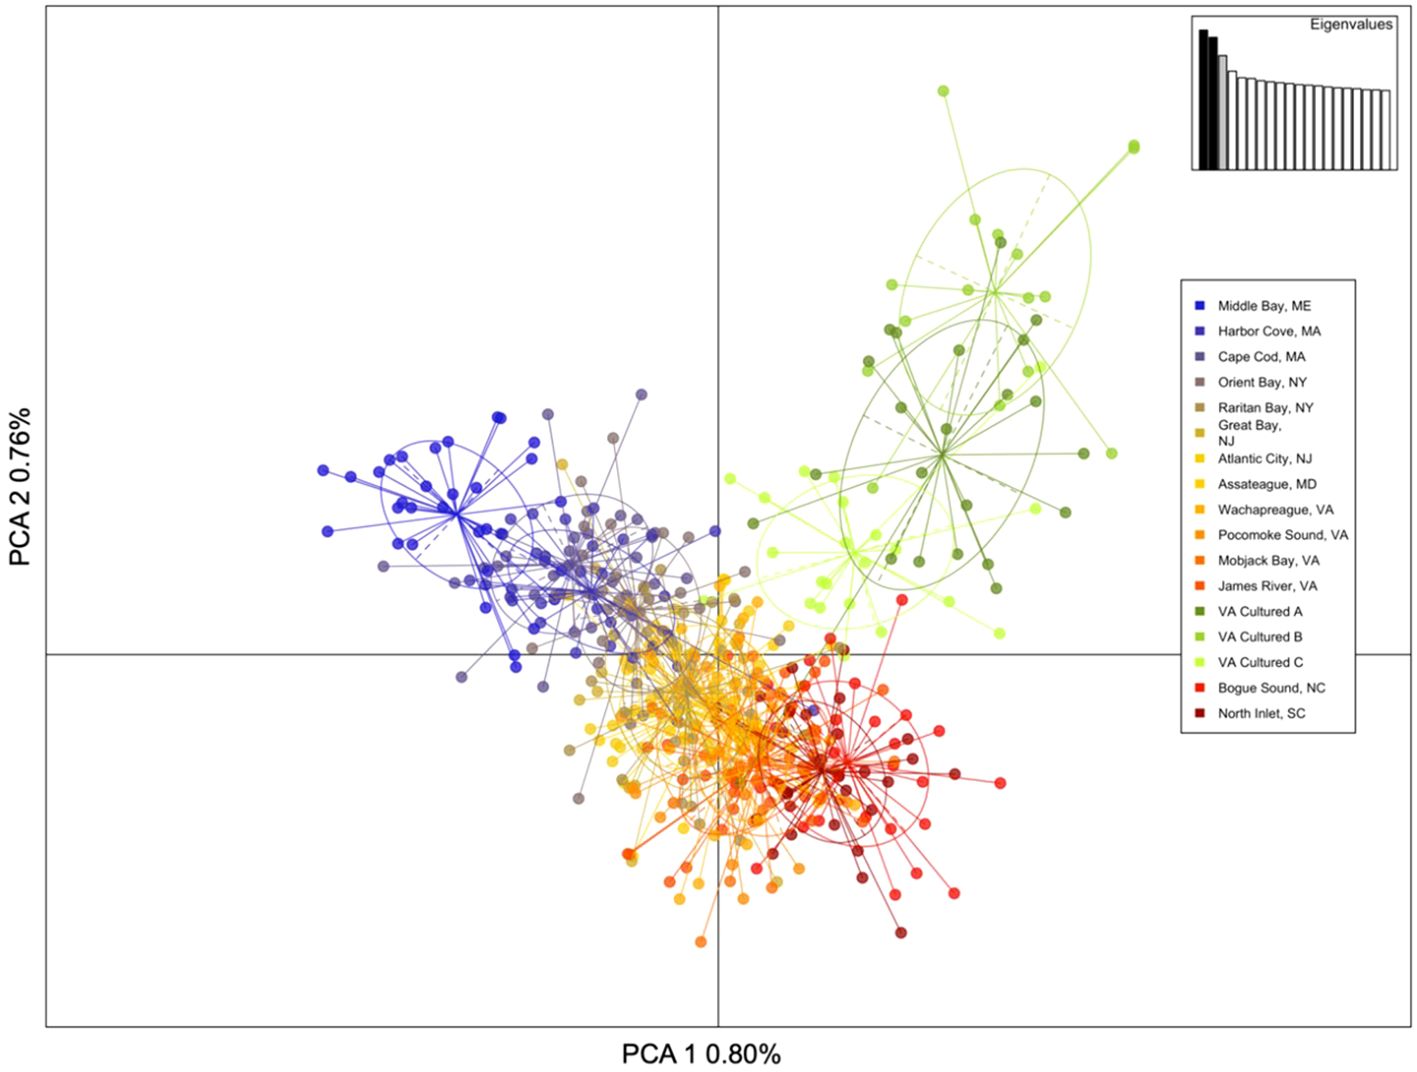
Figure 1. Principle component analysis (PCA) of PCA 1 versus PCA 2 for 14 wild sample populations and three cultured Virginia hard clam stocks explaining 1.56% of the total variance in the genetic data. Individual clam samples (dots) are color-coded and grouped (colored circle) based on their wild population or cultured stock.
The DAPC analysis of samples from the 14 wild populations and the three cultured Virginia stocks supports and better defines the PCA results (Figure 2). The analysis shows that the samples comprise three larger-scale clusters. Cluster 1 (blue) includes wild samples from Maine to Massachusetts (MB, HC, CC); cluster 2 (orange) includes wild samples from New York to South Carolina (OB, RB, GB, AC, AT, WP, PS, MJ, JR, BS, NI); and cluster 3 (green) includes the three cultured Virginia stocks (A, B, C). Cultured Virginia group C includes samples with genetic backgrounds that indicate shared ancestry with clusters 2 and 3. Grouping the samples into 4 clusters was also highly likely and resulted in the Carolina wild populations (BS and NI) forming a distinct cluster (Supplementary Figure 1).
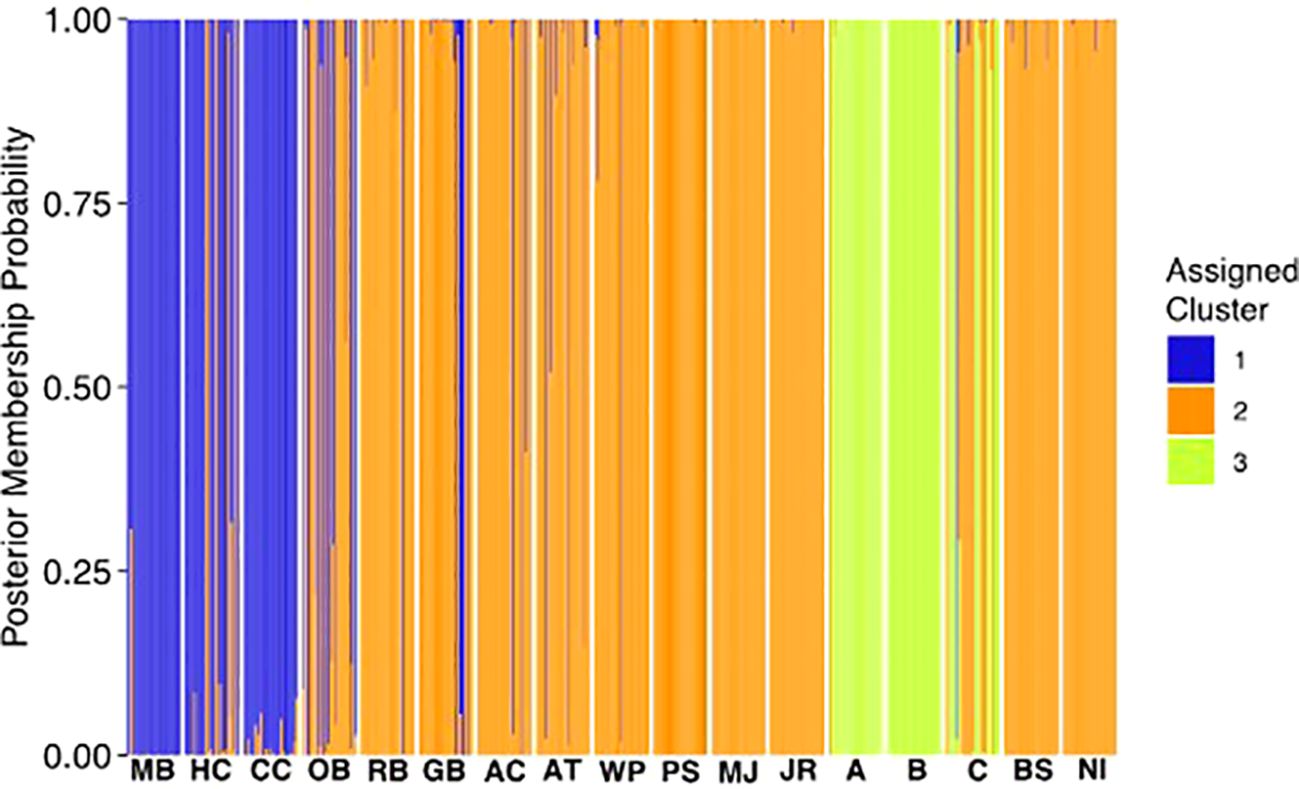
Figure 2. DAPC of the 14 hard clam wild populations and three cultured Virginia stocks. Samples are listed on the x-axis in order from north to south (left to right) and the three clusters are represented by different colors (blue, orange, and green).
3.3 Communicating results to industry
This project was successful in demonstrating the applicability of various genetic metrics to the hard clam industry. All industry members had the opportunity to share concerns and interests in a pre-project meeting, and attention was given to each of these topics in the final materials. Confidentiality of commercial hard clam origin, which is important to gain trust from the companies, was maintained throughout the entire project, successfully demonstrating the ability to handle proprietary material discreetly. The genetic tools infographic distributed to industry described different genetic applications for breeding in order of increasing cost and complexity (columns from left to right, Figure 3). For each genetic application, the table outlines the samples required, the data generated, the genetic/genomic analyses involved, and the technical expertise required in a menu format. The next two rows describe the ease of interpretation relative to one another (easier – medium – harder – hardest) and how the data can be used internally within a program/business. The last row provides the genetic/genomic metrics to measure and monitor. During the workshop, industry members referenced information in the table when asking questions regarding inbreeding, one of their top concerns.
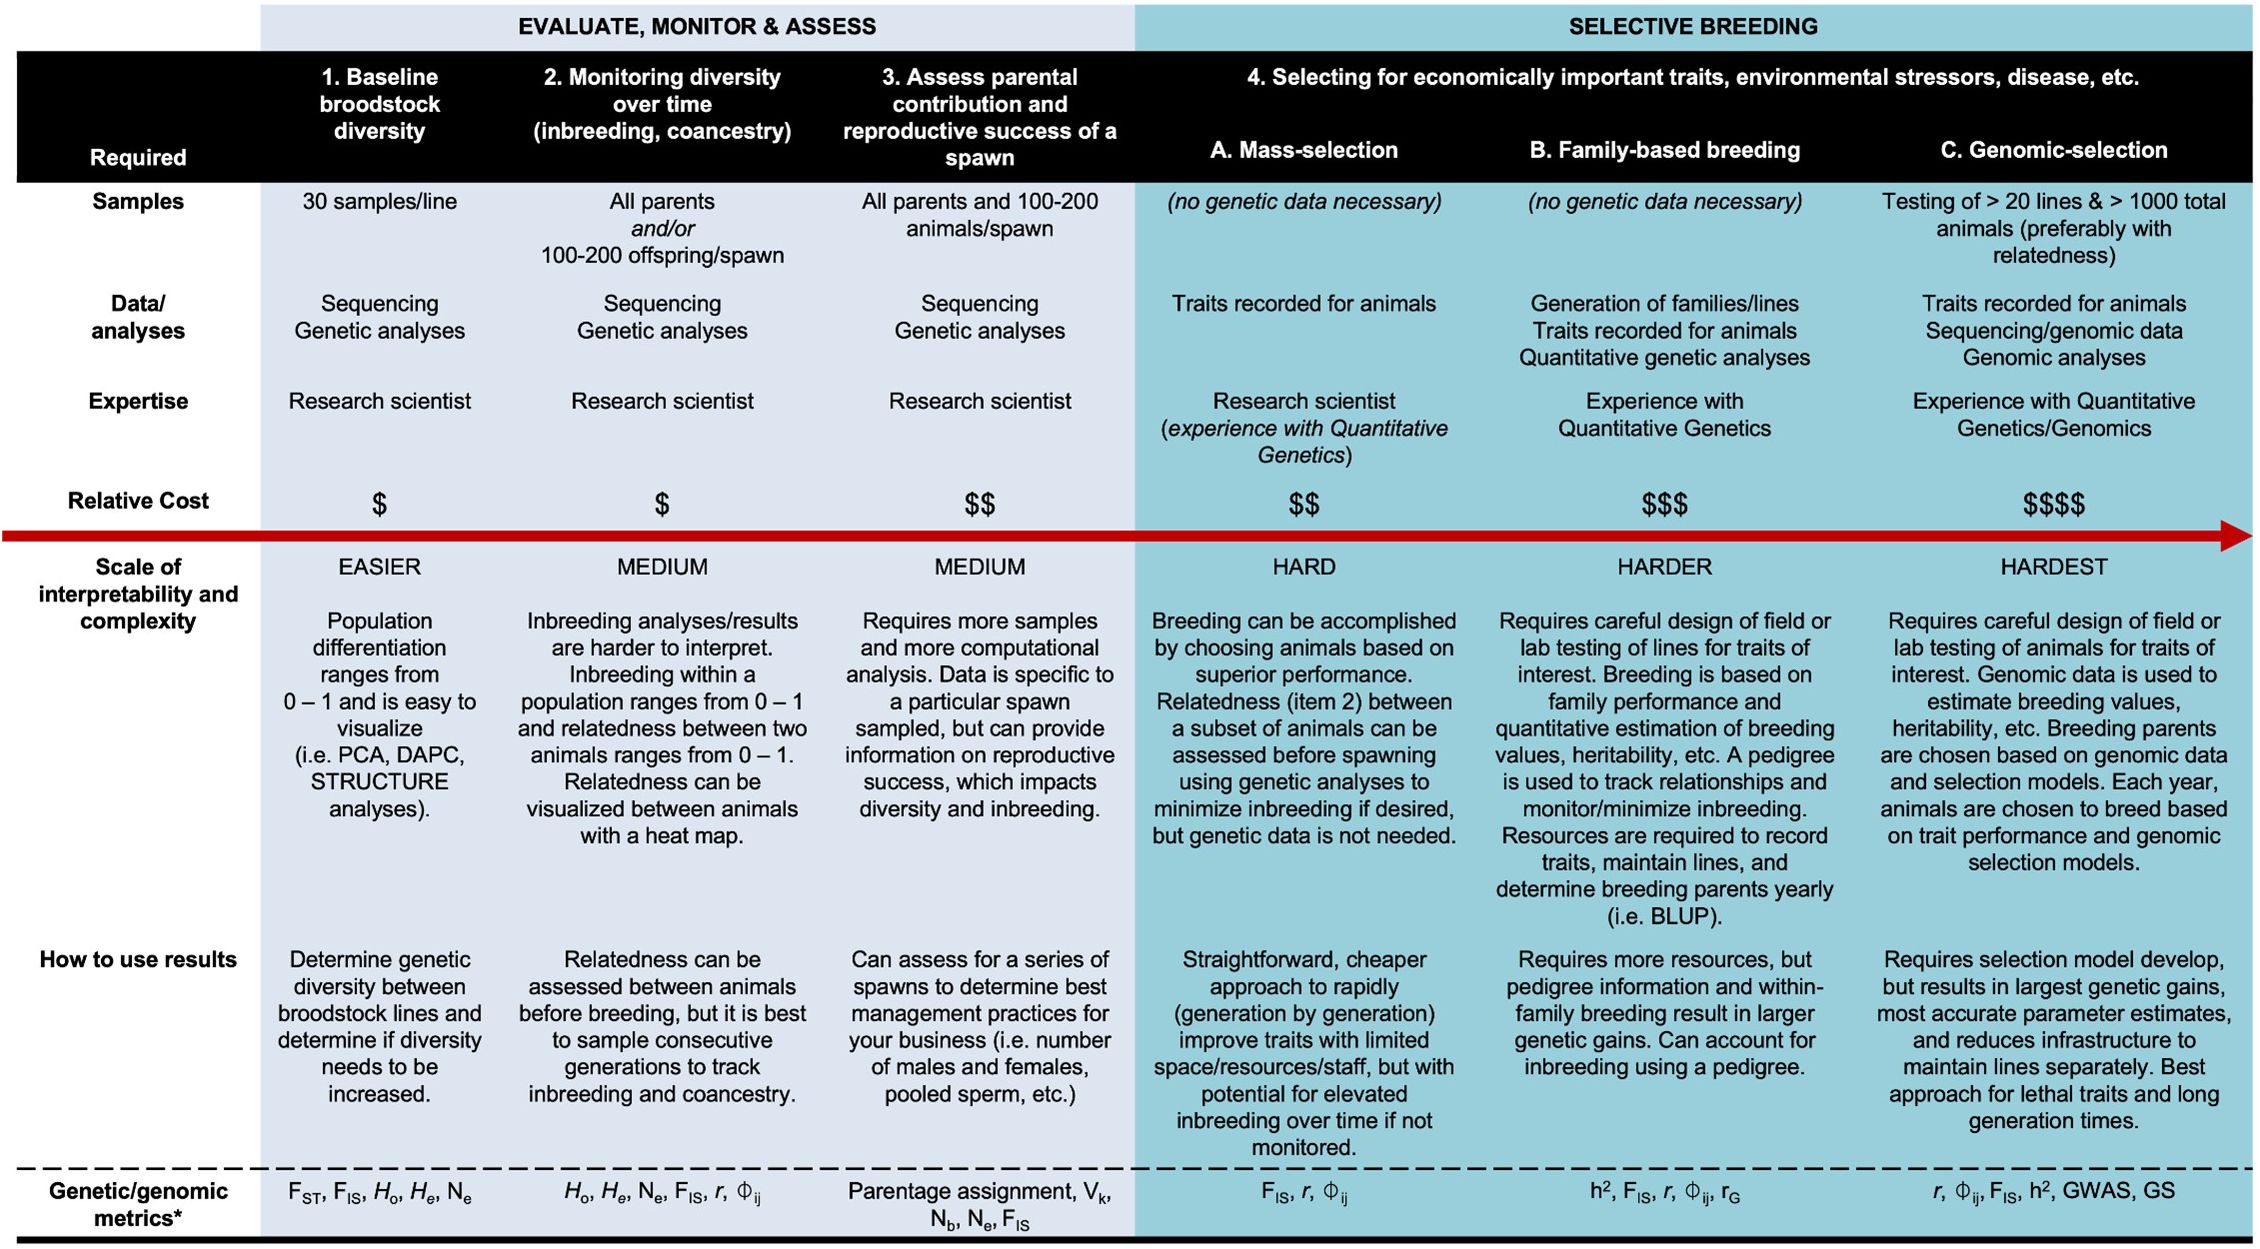
Figure 3. Genetic application table with genetic tools listed in order of increasing cost and complexity (left to right). The tools are grouped as either being important for evaluating, monitoring or assessing current stocks (light blue), or for selective breeding (turquoise). The requirements for sample number, data/analyses, expertise level, and relative cost are outlined, including information regarding the scale of interpretability and complexity, how the results can be used, and the coinciding genetic/genomic metrics. $ = $100 – $1,000s; $$ = $1,000 – $10,000s; $$$ = $10,000 – $100,000s; $$$$ = $100,000 +. *See Data Availability for Glossary.
The project report and workshop were structured to explain the genetic tools demonstrated by the comparison of industry samples to wild populations. Distribution of the project report before the workshop allowed time for companies to digest the information and develop follow-up questions. Four of the five major Virginia hatcheries attended the in-person workshop and were active participants. Following the workshop, participants requested additional resources outlining specific steps companies need to take to address questions such as inbreeding (see Data Availability), demonstrating comprehension of the material and presentation. Immediate requests were made for project leaders to collect industry hard clam samples to assess the genetic health of their proprietary material before the next spawning cycle began. Other industry needs that require the development of research projects were identified, providing an opportunity for future collaborative efforts between scientists and industry. The interaction resulted in a subsequent industry-led project that funded the development of a low-density genotyping tool to directly assess the genetic health of industry broodstock (Virginia Fishery Research Grant Program 2024-01).
4 Discussion and conclusions
Understanding genetics, how scientists delineate genetic structure within populations, and how this data can be used to assess the genetic health of organisms often lies beyond the experience of the average person. This impediment often arises from scientists’ failure to communicate complex concepts and research outcomes in a way that is accessible to non-scientists. This is certainly the case for practitioners of aquaculture, who understand the importance of genetics for their work but are hesitant to incorporate genetic assessments into their operations due to a technology transfer gap between basic genetic research and application. This project specifically addressed that gap by conducting, demonstrating, and interpreting a genetic analysis of hard clam broodstocks and distilling available genetic technologies into a clear and accessible matrix of options.
4.1 Demonstrating genetic technology
Genetic diversity of wild hard clam populations along the Atlantic coast was used to contextualize Virginia commercial broodstock samples. The PCA plot depicted the presence of population structure in wild samples based on the geographic location of capture. For the wild populations, northern groups were most genetically differentiated from southern groups (Table 2, FST values: Middle Bay, ME and North Inlet, SC = 2.2%, Middle Bay, ME and Bogue Sound, NC = 2.5%). The DAPC clustering further supports this clustering by geographic location as the northern (MA/ME) and southern (VA/NC/SC) groups form distinct clusters, with the clams from the most southern states (NC and SC) forming a distinct cluster when using K = 4 (Supplementary Figure 1). Previous studies of hard clams on the east coast have shown distinct population structure for populations north of Cape Cod into Canada and populations south of Cape Hatteras (Dillon and Manzi, 1992; Baker et al., 2008; Ropp et al., 2023), with populations in these geographically opposite regions showing the highest level of differentiation (Ropp et al., 2023). The clustering based on geographic origin likely coincides with the three biogeographic provinces that differ in their temperature, salinity, and seasonality: the Acadian north of Cape Cod, the Virginian, and the Carolinian south of Cape Hatteras (Hale, 2010; Mach et al., 2011). Our analyses resulted in fewer clusters (K=3) than previously detected (K=6, Ropp et al., 2023), with samples from New York to South Carolina (the Virginian and Carolinian provinces) forming one cluster. This difference is likely due to the inclusion of the more genetically distinct cultured, which resulted in obscuring the finer-scale wild population structure. Differences in the wild samples and implications of these results have previously been discussed in detail (see Ropp et al., 2023).
The cultured stocks from Virginia were found to be significantly different from the wild populations. Cultured hard clam samples were more similar to each other than to the wild population samples and aligned nearly orthogonal to the wild population north-south gradient of samples (green commercial stocks, Figure 1). This suggests that the selective pressures shared between the cultured hard clams during hatchery spawning and rearing are different than those experienced by the wild populations. The limited number of adults (relative to spawning in the wild) used in hatchery spawning events often results in lower genetic diversity and greater genetic similarity on shorter timescales than is typically observed in wild populations (e.g. Doublet et al., 2019; Hargrove et al., 2015; Hornick and Plough, 2019; Luo et al., 2022; Venney et al., 2021). These effects are further intensified if hatchery populations are founded using very few individuals (Gosling, 1982; Hedgecock and Sly, 1990). Domestication selection can also occur in hatchery settings and results in nontargeted selection for genes specific to favorable hatchery rearing conditions (e.g. Christie et al., 2012; Frankham, 2008; Howe et al., 2024), further contributing to increased similarity within the cultured groups. Similar signs of increased rates of genetic drift and differentiation were previously observed for cultured versus wild stocks of hard clams in Florida (Hargrove et al., 2015), likely due to hatchery practices. It is unknown if the broodstock from the three hatcheries in this study share common ancestry or if the similarities represent different origins converging to a shared genetic make-up consistent with hatchery-based spawning and domestication selection (larval survival) and regional climatic forces.
When compared to the wild populations, the cultured Virginia hard clams are most closely related to wild populations in the mid-Atlantic (NY – VA), specifically populations in the mid-Atlantic Ocean rather than the Chesapeake Bay (smaller FST values between cultured stocks and wild populations from New York to Wachapreague, VA, than cultured stocks and wild populations from Chesapeake Bay; Table 2). Broodstock for these commercial hard clam stocks is likely derived from mid-Atlantic animals (Gallivan and Allen, 2000), but the exact history of origin of these cultured clam stocks is unknown and largely undocumented. Commercial broodstock could be genetically similar to mid-Atlantic oceanic populations due to similar selective pressures of the regional grow-out conditions. The major hard clam hatcheries are located on the seaside of the ESVA and the oceanic environment is similar along the coast. The highly variable estuarine environment of the Chesapeake Bay likely results in different selective pressures due to greater temperature and salinity fluctuations. A meta-analysis detected a genetic break at the Delmarva peninsula for multiple species with long pelagic larval phases (Altman et al., 2013), including data from two hard clam studies (Dillon and Manzi, 1987; Baker et al., 2008), further supporting the idea of differing selective and adaptive pressures between these two environments. It is unknown if the genetic similarities are because commercial broodstock originated from mid-Atlantic environments, or because the environmental pressures of the mid-Atlantic Ocean (i.e. temperature, salinity, tidal fluxes, etc.) have resulted in genetic similarities between Virginia commercial stocks and wild mid-Atlantic populations.
Despite industry selection for unique broodstock, diversity metrics were similar between the cultured stocks and wild populations. The results indicated no substantial loss in genetic diversity resulting from hatchery-based breeding, which was the main concern communicated to us by industry. This finding is consistent with previous observations using microsatellite markers (Dillon and Manzi, 1987; Hargrove et al., 2015). Higher levels of heterozygosity and diversity have been shown to correlate with increased fitness in wild populations (e.g. Markert et al., 2010; Reed and Frankham, 2003), providing the material needed to adapt and survive long-term. It is important to measure and maintain diversity in cultured populations because they typically have lower heterozygosity and diversity (e.g. Alarcón et al., 2004; Benzie and Williams, 1996; Lind et al., 2009; Xu et al., 2001), which may decrease overall fitness and increase vulnerability to stressors. The level of relatedness within a sample was not statistically significantly different between the wild and cultured groups, providing further evidence for a lack of unintentional inbreeding based on the stocks examined. Genetic diversity statistics were slightly different from previously reported values (Ropp et al., 2023), but previous analyses included wild samples from PEI and did not include the cultured samples, which resulted in different parameters for the analyses (e.g., a different set of included loci).
It is worth noting that our sample sizes, especially for the cultured stocks, were small. Additionally, cultured samples in this project were purchased from the market, so authors can only assume the samples represent seed produced from industry proprietary broodstock lines. Therefore, values reported here should be interpreted lightly and are presented solely to demonstrate the ability to assess similarities among hard clam samples for the industry. By demonstrating the ability of genetic analyses to define distinct groups of hard clams on spatial and temporal scales and transferring this information and technology to the hard clam industry, practitioners can now analyze and manage their broodstock lines to ensure the continued success of the hard clam industry.
4.2 Report and workshop outcomes
Engagement of the hard clam industry was key to the success of this project. We were able to gain industry trust and participation by tailoring the project to address their information needs based on pre-project input. Masking the company names throughout the entire project ensured that confidentiality was maintained, which addressed a major industry hesitation in seeking help for genetic analysis. The tiered structure of the genetic tools infographic successfully broke down complex information. The format of the table and report to focus on explaining genetic tools using the comparison of industry samples to the wild populations allowed the authors to focus on educating industry personnel on options for addressing the genetic health of their material. Distribution of the report before the workshop allowed for complete transparency about what was going to be discussed during the in-person workshop to further gain trust. The workshop stepped through the project report in a practical way that built understanding and acceptance. This project serves as an example of how to effectively build trust and address needs when serving the private sector.
This project successfully communicated the relevance of genetic applications to industry, an area of interest often perceived as out of reach for general practitioners. All industry members participated in discussions either during or after the workshop. Requests to proceed immediately with the analysis of their broodstock indicated both a comfort level and desire to use these tools in their programs. Specific questions regarding further testing of inbreeding levels with reference to specifics in the genetic application table prove that this project was successful in communicating genetic concepts. The numerous requests for additional resources and new collaborative research projects further indicate the success of our efforts. A high level of trust between researchers and industry members, along with a willingness to seek assistance from scientific professionals, is essential for them to function effectively as a service.
This project has resulted in industry members and scientific professionals further collaborating to secure funding for the development of a genotyping tool that industry is actively using. Collaborations with government agencies, academic institutions, research centers, and private sequencing facilities can help develop and improve access to the genetic tools and expertise needed to effectively manage broodstock. Industry may also consider voicing the importance of genetic assessments to private companies and state governments to ensure routine genetic services and expertise are affordable and accessible to all hard clam industry members. To ensure the continued success of the hard clam industry, hatchery operators should consider educating themselves about genetic assessments for broodstock management by attending workshops, technical training sessions, or seeking out online resources. The deliverables from this project serve as resources not only to the hard clam industry in Virginia, but to extension specialists, professionals, and industry members interested in communicating or applying genetic tools within their programs beyond this region. The authors hope these resources will be useful for other professionals when communicating the importance of genetics to industry.
4.3 Management strategies for commercial hatcheries
It is vital that commercial hatcheries use adequate breeding techniques to sustain both the hard clam aquaculture industry and wild populations. When selecting broodstock, it is worth considering the genetic source population, as wild hard clam populations exhibit genetic structure based on geographic location (e.g. Dillon and Manzi, 1992; Baker et al., 2008; Ropp et al., 2023). For example, companies operating on the seaside of the ESVA should usually source broodstock animals from the seaside and mid-Atlantic Ocean. Animals from the bayside of the ESVA, as well as other northern or southern regions, are likely to perform worse in the mid-Atlantic seaside environment. However, other broodstock animals may be deliberately interbreed with typical, local broodstock animals if trying to breed in specific traits of interest. For example, broodstock animals from the Chesapeake Bay may be used if trying to breed in tolerance for low salinity. If sourcing broodstock animals from non-local areas, careful attention should be given to monitoring the genetics of the local wild populations. Interbreeding of broodstock or hatchery animals could result in reduced fitness and potential loss of important adaptive traits in the wild population (e.g. Waal et al., 2013; Araki et al., 2007, 2008).
Commercial hatcheries maintaining broodstock should conduct regular genetic assessments to monitor genetic diversity and inbreeding over time. This is particularly important for aquaculture species like the hard clam that are highly fecund, have small effective population sizes, and large variances in parental success during spawns (known as sweepstakes reproductive success; Hedgecock and Pudovkin, 2011, reviewed in Hollenbeck and Johnston, 2018; Plough, 2016; Plough et al., 2016). If not managed properly, these attributes can result in reduced genetic variation. With advancements in genotyping capabilities, hatcheries can determine relatedness from molecular markers with significantly more accuracy than estimates based solely on pedigree relationships (Daetwyler et al., 2007; Dekkers, 2007; Vandeputte and Haffray, 2014), allowing for better control of inbreeding. Relatedness can be measured within cohorts and tracked through generations (parents to offspring) to ensure trends remain in a safe range. Regular assessments will generate long-term data to monitor changes in diversity metrics and population structure over time, which can be indicative of selection for different environmental and disease pressures. The identification of genetic variants underlying adaptation to certain stressors allows for more precise breeding using genome-based breeding techniques. SNP arrays and whole genome sequencing can be used to provide more accurate assessments of genetic variation. Environmental data, phenotypic traits, and spatial data can be analyzed alongside the genetic data to identify signatures of localized adaptation, hatchery production (i.e. selected broodstock, reduced number of parents, signatures of hatchery selection), and to track shifts in these signatures over time. By regularly monitoring diversity metrics, hatcheries can confidently manage their broodstock and implement new practices to introduce and maintain genetic diversity when necessary.
Until recently, integrating genetic information into everyday management has been nearly impossible for hard clam farms. Development of genomic resources, such as reference genomes and genotyping arrays, combined with decreases in the cost of sequencing and genotyping, have increased the feasibility of genome-based breeding approaches in aquaculture species (reviewed by Hollenbeck and Johnston, 2018; Houston et al., 2020; Zenger et al., 2019). Reference genomes allow for quantitative trait locus mapping and genome-wide association studies to identify causative genetic variants, detection of epigenetic markers associated with specific environmental conditions, and comparative genomic analysis to determine the function of specific genetic variants (reviewed in Houston et al., 2020). These tools collectively help identify genes and pathways underlying traits of interest. More practically for hard clam companies, animals can now be genotyped using arrays containing hundreds to tens of thousands of genome-wide markers at a relatively low cost (reviewed in Hollenbeck and Johnston, 2018; Houston et al., 2020; Zenger et al., 2019). Genotyping arrays provide commercial companies with a feasible solution for integrating genetic assessments into their programs. Companies offering genotyping services often have experts available to interpret results, providing a direct line of expertise and guidance to commercial companies. Genotyping animals also eliminates the necessity of housing individuals from different broodstock lines or families separately, greatly reducing infrastructure requirements (Fernández et al., 2014). The development of a hard clam reference genome (Song et al., 2021) and both a high-density (Grouzdev et al., 2024) and low-density genotyping panel (Virginia Fishery Research Grant Program Award 2024-01) provide the hard clam commercial industry with ample genomic resources to start incorporating genetic assessments into their programs.
Data availability statement
The datasets presented in this study can be found in online repositories. The names of the repository/repositories and accession number(s) can be found in the article/Supplementary Material.
Ethics statement
Ethical approval was not required for the study involving animals in accordance with the local legislation and institutional requirements because the study did not involve vertebrate animals. The study uses tissue from hard clams, which do not require approval to sample.
Author contributions
AM: Conceptualization, Data curation, Formal analysis, Investigation, Methodology, Project administration, Visualization, Writing – original draft. JM: Conceptualization, Methodology, Resources, Supervision, Writing – review & editing. KR: Conceptualization, Methodology, Resources, Supervision, Writing – review & editing. RS: Conceptualization, Methodology, Resources, Supervision, Writing – review & editing. KH: Conceptualization, Funding acquisition, Methodology, Project administration, Resources, Supervision, Writing – review & editing.
Funding
The author(s) declare that financial support was received for the research and/or publication of this article. This project was funded by award NA22OAR4170113 from the National Oceanic and Atmospheric Administration.
Acknowledgments
We would like to thank Nate Geyerhahn, Jessica Small, and William Walton from the Virginia Institute of Marine Science, and Louis Plough from the University of Maryland Center for Environmental Sciences for their expertise and support during this project. The work previously done by Ann Ropp assessing the population structure of wild hard clam populations was crucial and provided the foundation for this project, funded by Virginia Sea Grant to Richard Snyder. Most importantly, we would like to thank the Virginia hard clam industry for their willingness to participate and provide invaluable guidance during all parts of the project.
Conflict of interest
The authors declare that the research was conducted in the absence of any commercial or financial relationships that could be construed as a potential conflict of interest.
Generative AI statement
The author(s) declare that no Generative AI was used in the creation of this manuscript.
Publisher’s note
All claims expressed in this article are solely those of the authors and do not necessarily represent those of their affiliated organizations, or those of the publisher, the editors and the reviewers. Any product that may be evaluated in this article, or claim that may be made by its manufacturer, is not guaranteed or endorsed by the publisher.
Supplementary material
The Supplementary Material for this article can be found online at: https://www.frontiersin.org/articles/10.3389/faquc.2025.1556440/full#supplementary-material
References
Alarcón J. A., Magoulas A., Georgakopoulos T., Zouros E., and Alvarez M. C. (2004). Genetic comparison of wild and cultivated European populations of the gilthead sea bream (Sparus aurata). Aquaculture 230, 65–80. doi: 10.1016/S0044-8486(03)00434-4
Altman S., Robinson J., Pringle J., Byers J., and Wares J. (2013). Edges and overlaps in Northwest Atlantic phylogeography. Diversity 5, 263–275. doi: 10.3390/d5020263A
Araki H., Berejikian B. A., Ford M. J., and Blouin M. S. (2008). Fitness of hatchery-reared salmonids in the wild. Evolutionary Appl. 1, 342–355. doi: 10.1111/j.1752-4571.2008.00026.x
Araki H., Cooper B., and Blouin M. S. (2007). Genetic effects of captive breeding cause a rapid, cumulative fitness decline in the wild. Science 318, 100–103. doi: 10.1126/science.1145621
Baker P., Austin J. D., Bowen B. W., and Baker S. M. (2008). Range-wide population structure and history of the northern quahog (Merceneria merceneria) inferred from mitochondrial DNA sequence data. ICES J. Marine Sci. 65, 155–163. doi: 10.1093/icesjms/fsn007
Benzie J. A. H. and Williams S. T. (1996). Limitations in the genetic variation of hatchery produced batches of the giant clam, Tridacna gigas. Aquaculture 139, 225–241. doi: 10.1016/0044-8486(95)01171-4
Castagna M. and Chanley P. (1973). Salinity tolerance of some marine bivalves from inshore and estuarine environments in Virginian waters on the western mid-Atlantic coast. Malacologia 12, 47–96.
Castagna M. and Kraeuter J. N. (1981). Manual for growing the hard clam Mercenaria. Special Report in Applied Marine Science and Ocean Engineering No. 249 Virginia sea grant program virginia institute of marine science (Gloucester Point, VA, USA), 107 pp.
Castagna M. A., Mason L. W., and Biggs F. C. (1970). Hard clam culture method developed at VIMS. Marine resource advisory no. 4 (William & Mary: Virginia Institute of Marine Science). doi: 10.25773/v5-myy6-xz68
Christie M. R., Marine M. L., French R. A., and Blouin M. S. (2012). Genetic adaptation to captivity can occur in a single generation. Proc. Natl. Acad. Sci. 109, 238–242. doi: 10.1073/pnas.1111073109
Daetwyler H. D., Villanueva B., Bijma P., and Woolliams J. A. (2007). Inbreeding in genome-wide selection. J. Anim. Breed. Genet. 124, 369–376. doi: 10.1111/j.1439-0388.2007.00693.x
Dekkers J. C. M. (2007). Prediction of response to marker-assisted and genomic selection using selection index theory. J. Anim. Breed. Genet. 124, 331–341. doi: 10.1111/j.1439-0388.2007.00701.x
Deng Y., Liu X., Zhang G., and Guo X. (2005). Inbreeding depression and maternal effects on early performance of Pacific abalone. North Am. J. Aquaculture 67, 231–236. doi: 10.1577/A04-021.1
Dillon R. T. and Manzi J. J. (1987). Hard clam, Mercenaria mercenaria, broodstocks: Genetic drift and loss of rare alleles without reduction in heterozygosity. Aquaculture 60, 99–105. doi: 10.1016/0044-8486(87)90301-2
Dillon R. T. J. and Manzi J. J. (1992). Population genetics of the hard clam, Mercenria mercenaria, at the northern limit of its range. Can. J. Fisheries Aquat. Sci. 49, 2574–2578. doi: 10.1139/f92-284
Doublet A. C., Croiseau P., Fritz S., Michenet A., Hozé C., Danchin-Burge C., et al. (2019). The impact of genomic selection on genetic diversity and genetic gain in three French dairy cattle breeds. Genet. Selection Evol. 51, 52. doi: 10.1186/s12711-019-0495-1
Evans F., Matson S., Brake J., and Langdon C. (2004). The effects of inbreeding on performance traits of adult Pacific oyster (Crassostrea gigas). Aquaculture 230, 89–98. doi: 10.1016/j.aquaculture.2003.09.023
Fernández J., Toro M., Sonesson A. K., and Villanueva B. (2014). Optimizing the creation of base populations for aquaculture breeding programs using phenotypic and genomic data and its consequences on genetic progress. Front. Genet. 5. doi: 10.3389/fgene.2014.00414
Fjalestad K. T., Moen T., and Gomez-Raya L. (2003). Genetic improvement of disease resistance in fish: an overview. Aquaculture 111, 65–74. doi: 10.1016/0044-8486(93)90025-T
Frankham R. (1996). Relationship of genetic variation to population size in wildlife. Conserv. Biol. 10, 1500–1508. doi: 10.1046/j.1523-1739.1996.10061500.x
Frankham R. (2008). Genetic adaptation to captivity in species conservation programs. Mol. Ecol. 17, 325–333. doi: 10.1111/j.1365-294X.2007.03399.x
Gallivan T. and Allen S. K. (2000). Clam strain registry. Marine resource advisory no. 72; VSG-00-10 (College of William and Mary: Virginia Institute of Marine Science). doi: 10.21220/m2-2qpb-7758
Gosling E. M. (1982). Genetic variability in hatchery-produced Pacific oysters (Crassostrea gigas Thunberg). Aquaculture 26, 273–287. doi: 10.1016/0044-8486(82)90163-6
Gosselin T. (2020). radiator: RADseq Data Exploration, Manipulation and Visualization using R. R package version 1.1.9 doi: 10.5281/ZENODO.3995080
Grouzdev D., Farhat S., Guo X., Espinosa E. P., Reece K., McDowell J., et al. (2024). Development and validation of a 66K SNP array for the hard clam (Mercenaria mercenaria). BMC Genomics 25, 847. doi: 10.1186/s12864-024-10756-7
Gruber B., Unmack P. J., Berry O. F., and Georges A. (2018). dartr: An R package to facilitate analysis of SNP data generated from reduced representation genome sequencing. Mol. Ecol. Resour 18, 691–699. doi: 10.1111/1755-0998.12745
Hale S. S. (2010). Biogeographical patterns of marine benthic macroinvertebrates along the Atlantic Coast of the northeastern USA. Estuaries Coasts 33, 1039–1053. doi: 10.1007/S12237-010-9332-Z
Hargrove J. S., Sturmer L., Scarpa J., and Austin J. D. (2015). Assessment of genetic diversity in wild and aquaculture stocks of Mercenaria mercenaria in Florida. J. Shellfish Res. 34, 355–365. doi: 10.2983/035.034.0218
Hedgecock D. and Pudovkin A. I. (2011). Sweepstakes reproductive success in highly fecund marine fish and shellfish: A review and commentary. Bull. Marine Sci. 87, 971–1002. doi: 10.5343/bms.2010.1051
Hedgecock D. and Sly F. (1990). Genetic drift and effective population sizes of hatchery-propagated stocks of the Pacific oyster, Crassostrea gigas. Aquaculture 88, 21–38. doi: 10.1016/0044-8486(90)90316-F
Hoffmann A. A. and Sgrò C. M. (2011). Climate change and evolutionary adaptation. Nature 470, 479–485. doi: 10.1038/nature09670
Hollenbeck C. M. and Johnston I. A. (2018). Genomic tools and selective breeding in molluscs. Front. Genet. 123 (2), 92–105. doi: 10.3389/fgene.2018.00253
Hornick K. M. and Plough L. V. (2019). Tracking genetic diversity in a large-scale oyster restoration program: effects of hatchery propagation and initial characterization of diversity on restored vs. wild reefs. Heredity (Edinb). 21 (7), 389–409. doi: 10.1038/s41437-019-0202-6
Houston R. D., Jin Y. H., Jenkins T. L., Selly S. L. C., Martin S. A. M., Stevens J. R., et al. (2020). Harnessing genomics to fast-track genetic improvement in aquaculture. Nat. Rev. Genet. doi: 10.1038/s41576-020-0227-y
Howe N. S., Hale M. C., Waters C. D., Schaal S. M., Shedd K. R., and Larson W. A. (2024). Genomic evidence for domestication selection in three hatchery populations of Chinook salmon, Oncorhynchus tshawytscha. Evol. Appl. 17 (2), e13656. doi: 10.1111/eva.13656
Ibarra A. M., Cruz P., and Romero B. A. (1995). Effects of inbreeding on growth and survival of self-fertilized catarina scallop larvae, Argopecten circularis. Aquaculture 134, 37–47. doi: 10.1016/0044-8486(95)00022-T
Jombart T. (2008). adegenet: a R package for the multivariate analysis of genetic markers. Bioinformatics 24, 1403–1405. doi: 10.1093/bioinformatics/btn129
Jombart T. and Ahmed I. (2011). adegenet 1.3-1: new tools for the analysis of genome-wide SNP data. Bioinformatics 27, 3070–3071. doi: 10.1093/bioinformatics/btr521
Jombart T. and Collins C. (2015). Discriminant analysis of principal components: a new method for the analysis of genetically structured populations. BMC Genetics 11, 94.
Jombart T., Devillard S., and Balloux F. (2010). Discriminant analysis of principal components: a new method for the analysis of genetically structured populations. BMC Genet. 11, 94. doi: 10.1186/1471-2156-11-94
Kruskal W. H. and Wallis W. A. (1952). Use of ranks in one-criterion variance analysis. J. Am. Stat. Assoc 47, 583–621. doi: 10.1080/01621459.1952.10483441
Lind C. E., Evans B. S., Knauer J., Taylor J. J. U., and Jerry D. R. (2009). Decreased genetic diversity and a reduced effective population size in cultured silver-lipped pearl oysters (Pinctada maxima). Aquaculture 286, 12–19. doi: 10.1016/j.aquaculture.2008.09.009
Luo W., Wu Q., Zhang X., Wei Y., Liao M., Gao T., et al. (2022). Potential risks for seahorse stock enhancement: Insight from the declivity of genetic levels with hatchery management. Front. Genet. 12. doi: 10.3389/fgene.2021.830626
Mach M. E., Sbrocco E. J., Hice L. A., Duffy T. A., Conover D. O., and Barber P. H. (2011). Regional differentiation and post-glacial expansion of the Atlantic silverside, Menidia menidia, an annual fish with high dispersal potential. Marine Biol. 158, 515–530. doi: 10.1007/s00227-010-1577-3
Markert J. A., Champlin D. M., Gutjahr-Gobell R., et al. (2010). Population genetic diversity and fitness in multiple environments. BMC Evol Biol 10, 205. doi: 10.1186/1471-2148-10-205
Meirmans P. G. (2020). genodive version 3.0: Easy-to-use software for the analysis of genetic data of diploids and polyploids. Mol. Ecol. Resour 20, 1126–1131. doi: 10.1111/1755-0998.13145
Mijangos J. L., Gruber B., Berry O., Pacioni C., and Georges A. (2022). dartR v2: An accessible genetic analysis platform for conservation, ecology and agriculture. Methods Ecol. Evol. 13, 2150–2158. doi: 10.1111/2041-210X.13918
Nei M. (1987). “Bibliography,” in Molecular evolutionary genetics (Columbia University Press, New York, NY), 433–496. doi: 10.7312/nei-92038-016
Plough L. V. (2016). Genetic load in marine animals: A review. Curr. Zoology 62, 567–579. doi: 10.1093/cz/zow096
Plough L. V., Shin G., and Hedgecock D. (2016). Genetic inviability is a major driver of type III survivorship in experimental families of a highly fecund marine bivalve. Mol. Ecol. 25, 895–910. doi: 10.1111/mec.13524
Reed D. H. and Frankham R. (2003). Correlation between fitness and genetic diversity. Conserv. Biol. 17, 230–237. doi: 10.1046/j.1523-1739.2003.01236.x
Ropp A. J. (2021). Population structure of the hard clam, Mercenaria Mercenaria, along the east coast of North America. Dissertations, Theses, and Masters Projects. William & Mary. Paper 1616444311. doi: 10.25773/v5-wa9q-8c19
Ropp A. J., Reece K. S., Snyder R. A., Song J., Biesack E. E., and McDowell J. R. (2023). Fine-scale population structure of the northern hard clam (Mercenaria mercenaria) revealed by genome-wide SNP markers. Evol. Appl. 16, 1422–1437. doi: 10.1111/eva.13577
Ryman N. and Laikre L. (1991). Effects of supportive breeding on the genetically effective population size. Conserv. Biol. 5, 325–329. doi: 10.1111/j.1523-1739.1991.tb00144.x
Song H., Guo X., Sun L., Wang Q., Han F., Wang H., et al. (2021). The hard clam genome reveals massive expansion and diversification of inhibitors of apoptosis in Bivalvia. BMC Biol. 19, 15. doi: 10.1186/s12915-020-00943-9
Vandeputte M. and Haffray P. (2014). Parentage assignment with genomic markers: A major advance for understanding and exploiting genetic variation of quantitative traits in farmed aquatic animals. Front. Genet. 5. doi: 10.3389/fgene.2014.00432
Venney C. J., Wellband K. W., and Heath D. D. (2021). Rearing environment affects the genetic architecture and plasticity of DNA methylation in Chinook salmon. Heredity (Edinb) 126, 38–49. doi: 10.1038/s41437-020-0346-4
Waal S., Balkhair M., Al-Mashikhi A., and Khoom S. (2013). Investigating the translocation and seeding of wild Haliotis mariae wood 1828, in the sultanate of Oman. J. Shellfish Res. 32, 315–323. doi: 10.2983/035.032.0210
Wada K. T. and Komaru A. (1994). Effect of selection for shell coloration on growth rate and mortality in the Japanese pearl oyster, Pinctada fucata martensii. Aquaculture 125, 59–65. doi: 10.1016/0044-8486(94)90282-8
Weir B. S. and Cockerham C. C. (1984). Estimating F-statistics for the analysis of population structure. Evol. (N Y) 38, 1358. doi: 10.2307/2408641
Xu Z., Primavera J. H., de la Pena L. D., Pettit P., Belak J., and Alcivar-Warren A. (2001). Genetic diversity of wild and cultured Black Tiger Shrimp (Penaeus monodon) in the Philippines using microsatellites. Aquaculture 199, 13–40. doi: 10.1016/S0044-8486(00)00535-4
Zenger K. R., Khatkar M. S., Jones D. B., Khalilisamani N., Jerry D. R., and Raadsma H. W. (2019). Genomic selection in aquaculture: application, limitations and opportunities with special reference to marine shrimp and pearl oysters. Front. Genet. 9. doi: 10.3389/fgene.2018.00693
Keywords: hard clam, aquaculture, population structure, genetics, industry support, extension
Citation: McCarty AJ, McDowell JR, Reece KS, Snyder RA and Hudson K (2025) Application of genetic technology in support of the northern hard clam (Mercenaria mercenaria) aquaculture industry. Front. Aquac. 4:1556440. doi: 10.3389/faquc.2025.1556440
Received: 06 January 2025; Accepted: 28 April 2025;
Published: 27 May 2025.
Edited by:
Grazielle Evangelista Gomes, Federal University of Pará, BrazilReviewed by:
Sumanta Kumar Mallik, Directorate of Cold Water Fisheries Research (ICAR), IndiaPapius Dias Tibihika, National Agricultural Research Organisation (NARO), Uganda
Copyright © 2025 McCarty, McDowell, Reece, Snyder and Hudson. This is an open-access article distributed under the terms of the Creative Commons Attribution License (CC BY). The use, distribution or reproduction in other forums is permitted, provided the original author(s) and the copyright owner(s) are credited and that the original publication in this journal is cited, in accordance with accepted academic practice. No use, distribution or reproduction is permitted which does not comply with these terms.
*Correspondence: Alexandra J. McCarty, bGV4eUBjbGFtYW5kb3lzdGVyLmNvbQ==
†Present address: Alexandra J. McCarty, Cherrystone Aqua-Farms, Cape Charles, VA, United States
‡ORCID: Alexandra J. McCarty, orcid.org/0000-0002-7222-5255
Jan R. McDowell, orcid.org/0000-0002-4849-0649
Kimberly S. Reece, orcid.org/0000-0002-1751-1566