Abstract
Corynebacterium pseudotuberculosis is the causative bacterial agent of the zoonotic disease known as caseous lymphadenitis, and it presents several mechanisms of response to host defenses, including the presence of virulence factors (VFs). The genomes of these bacteria have several polymorphic markers known as microsatellites, or simple sequence repeats (SSRs), that can be used to characterize the genome, to study possible polymorphisms existing among strains, and to verify the effects of such polymorphic markers in coding regions and regions associated with VFs. In this study, several SSRs were identified within coding regions throughout the 54 genomes of this species, revealing possible polymorphisms associated with coding regions that could be used as strain-specific or serotype-specific identifiers of C. pseudotuberculosis. The similarities associated with SSRs amongst the different serum variants of C. pseudotuberculosis, biovars equi and ovis, were also evaluated, and it was possible to identify SSRs located in coding regions responsible for a VF enrolled in pathogenesis known to mediate bacterial adherence (SpaH-type pili virulence factor). Phylogenetic analyses revealed that strains sharing SSR patterns, including the possible polymorphisms identified in the same position of gene-coding regions, were displayed by strains with a common ancestor, corroborating with the Genome Tree Report of the NCBI. Statistical analysis showed that the microsatellite groups belonging to equi and ovis biovars have a significance of 0.006 (p-value) in similarity, thus indicating them as good biomarker candidates for C. pseudotuberculosis.
Introduction
The intracellular pathogen Corynebacterium pseudotuberculosis causes a chronic infectious disease called caseous lymphadenitis, manifested by the presence of necrosis in the lymphatic glands (Radostits et al., 2002). This bacterium has several response mechanisms to host defense, including virulence factors such as the presence of lipids associated with the cell wall that gives the microorganism resistance to digestion by cellular enzymes and, consequently, the ability to spread through the host tissues (Airello et al., 2001).
Studies have already been developed on the genomic structure and virulence of C. pseudotuberculosis (Soares et al., 2013; Baraúna et al., 2017; Gomide et al., 2018a; Gomide et al., 2018b; Araújo et al., 2019). Although these studies are extensive, there have been no reports on microsatellites associated with gene composition and virulence in C. pseudotuberculosis, and such microsatellites are widely used for genetic studies and as molecular markers (Han et al., 2015). Microsatellites, or simple sequence repeats (SSRs), are found in eukaryotes, prokaryotes, and viruses having a wide distribution throughout the genome, being present in both gene-coding and intergenic regions. SSRs are repeated sequences in tandem, whose repetition unit, called pattern or motif, is between 1 and 10 base pairs long (Jarne and Lagoda, 1996). These tandem repetitions have mutation rates that occur between 10³ and 106 per cell generation, and, due to this instability, have high relevance in evolutionary studies (Vieira et al., 2016).
As SSRs occur throughout the genome of different species, they have become suitable for the study of genetic diversity amongst species and populations. They can be classified according to the type of repetition into the following: (I) perfect microsatellites, presenting perfect repetitions, for e.g., (AT) 20; (II) imperfect microsatellites, presenting interruptions in the repetition caused by different nucleotides than those that occur in the repetitive pattern, for e.g., (AT) 12 GC (AT) 8; and (III) compound microsatellites, containing different motifs (two or more) repeated in tandem, for e.g., (AT) 7 (GC) 6 (Saeed et al., 2016).
Microsatellites are widely used to identify a particular molecular sequence in an unknown DNA pool. Previous studies suggested that the origin of microsatellites in microbial genomes is not random. Several mechanisms can stimulate the presence of SSRs in gene regions, such as insertions, deletions, recombination, transpositions, and horizontal gene transfer (Saeed et al., 2016). These markers are highly polymorphic and can influence gene regulation, thus being used in the studies of kinship and ancestry (Chen et al., 2011).
SSRs are more than just repetitive strings, as they can play an important role in several biological pathways and be inserted within genes responsible for virulence in several pathogenic bacteria. They might also alter the expression of genes involved in the host–pathogen interaction. In addition, the presence of trinucleotide and hexanucleotide repetitions in genes encoding proteins may be highly relevant to the protein 3D structure. In humans, tri- and tetra-motifs located in protein-coding regions are often associated with genetic diseases (Mrázek et al., 2007).
Due to high mutation rates and next-generation sequencing (NGS) technologies, microsatellites are useful molecular markers that can be easily detected by low-cost PCR techniques (Paglia and Morgante, 1998). The screening of SSRs has been poorly explored in certain species of prokaryotes, as prokaryotic genomes are known for containing less repetitive elements in their DNA than those observed in eukaryotes (Metzgar et al., 2001). Therefore, the identification and characterization of SSRs in the genome of the many different strains of C. pseudotuberculosis are an important asset in the study of its pathogenicity by identifying possible markers associated with virulence genes.
Materials and methods
Genomic dataset
The search for microsatellites in 54 genomes of Corynebacterium pseudotuberculosis available in the National Center for Biotechnology Information’s RefSeq database (NCBI) was carried out using the software package of IMEx tools (Mudunuri and Nagarajaram, 2007). The collective strain information of the biovar, host, country, genome size, and number of genes and proteins for each genome used in this study is shown in Table 1. For the scope of this work, we selected only 54 genomes amongst all the genomes available at the time due to the clonal nature of the sequenced strains of C. pseudotuberculosis (Soares et al., 2013) and to secure space out of the global dataset, so we would be able to later test our findings from this training dataset on other available non-included strain, using the markers identified by this work.
TABLE 1
| Species/strain | Biovar | Host | Country | Size (Mb) | Gene | Protein |
|---|---|---|---|---|---|---|
| C. pseudotuberculosis I19 | Ovis | Cow | Israel | 2,33821 | 2,123 | 2,004 |
| C. pseudotuberculosis PAT10 | Ovis | Sheep | Argentina | 2,33830 | 2,139 | 1,993 |
| C. pseudotuberculosis 267 | Ovis | llama | USA | 2,33790 | 2,137 | 2,035 |
| C. pseudotuberculosis 226 | Ovis | Goat | USA | 2,33783 | 2,132 | 1,966 |
| C. pseudotuberculosis 29156 | Ovis | Cow | Israel | 2,33775 | 2,123 | 2,006 |
| C. pseudotuberculosis PO269-5 | Ovis | Goat | Portugal | 2,33826 | 2,130 | 2,010 |
| C. pseudotuberculosis 1002B | Ovis | Goat | Brazil | 2,33831 | 2,138 | 2,021 |
| C. pseudotuberculosis PA01 | Ovis | Sheep | Brazil | 2,33777 | 2,138 | 2,036 |
| C. pseudotuberculosis MEX25 | Ovis | Sheep | Mexico | 2,33813 | 2,132 | 2,018 |
| C. pseudotuberculosis PO222/4-1 | Ovis | Goat | Portugal | 2,33816 | 2,129 | 2,014 |
| C. pseudotuberculosis E55 | Ovis | Sheep | Egypt | 2,33829 | 2,126 | 1,987 |
| C. pseudotuberculosis PA02 | Ovis | Goat | Brazil | 2,33834 | 2,128 | 2,029 |
| C. pseudotuberculosis MEX29 | Ovis | Sheep | Mexico | 2,33780 | 2,133 | 2,032 |
| C. pseudotuberculosis MEX1 | Ovis | Goat | Mexico | 2,33827 | 2,134 | 2,016 |
| C. pseudotuberculosis PA04 | Ovis | Sheep | Brazil | 2,33773 | 2,129 | 1,982 |
| C. pseudotuberculosis PA07 | Ovis | Sheep | Brazil | 2,33820 | 2,127 | 1,994 |
| C. pseudotuberculosis CAP3W | Ovis | Caprine | Brazil | 2,33818 | 2,146 | 2,028 |
| C. pseudotuberculosis CAPJ4 | Ovis | Caprine | Brazil | 2,33808 | 2,146 | 2,029 |
| C. pseudotuberculosis Cap1W | Ovis | Caprine | Brazil | 2,33817 | 2,141 | 2,024 |
| C. pseudotuberculosis CAPMI03 | Ovis | Caprine | Brazil | 2,33812 | 2,141 | 2,021 |
| C. pseudotuberculosis 04MAT | Ovis | Caprine or ovine | Brazil | 2,33801 | 2,141 | 2,021 |
| C. pseudotuberculosis 38MAT | Ovis | Caprine or ovine | Brazil | 2,33771 | 2,139 | 1,992 |
| C. pseudotuberculosis OVID04 | Ovis | Ovine | Brazil | 2,33810 | 2,139 | 1,995 |
| C. pseudotuberculosis OVIOS02 | Ovis | Ovine | Brazil | 2,33793 | 2,141 | 2,022 |
| C. pseudotuberculosis OVIZ01 | Ovis | Ovine | Brazil | 2,33781 | 2,139 | 1,994 |
| C. pseudotuberculosis MEX2 | Ovis | Goat | Mexico | 2,33809 | 2,135 | 2,015 |
| C. pseudotuberculosis PAT16 | Ovis | Sheep | Argentina | 2,33815 | 2,131 | 2,014 |
| C. pseudotuberculosis PAT14 | Ovis | Sheep | Argentina | 2,33825 | 2,129 | 2,008 |
| C. pseudotuberculosis CIP 52.97 | Equi | Horse | Kenya | 2,33748 | 2,164 | 2,039 |
| C. pseudotuberculosis 1/06-A | Equi | Horse | USA | 2,33835 | 2,101 | 1,863 |
| C. pseudotuberculosis 31 | Equi | Buffalo | Egypt | 2,33727 | 2,204 | 2,058 |
| C. pseudotuberculosis 258 | Equi | Horse | Belgium | 2,33749 | 2,164 | 2,037 |
| C. pseudotuberculosis Cp162 | Equi | Camel | UK | 2,33736 | 2,162 | 2,009 |
| C. pseudotuberculosis 262 | Equi | Cow | Belgium | 2,33757 | 2,156 | 2,032 |
| C. pseudotuberculosis E19 | Equi | Horse | Chile | 2,33753 | 2,179 | 2,043 |
| C. pseudotuberculosis MB11 | Equi | Horse | USA | 2,33741 | 2,167 | 2,027 |
| C. pseudotuberculosis MB14 | Equi | Horse | USA | 2,33740 | 2,176 | 1,962 |
| C. pseudotuberculosis MB30 | Equi | Horse | USA | 2,33752 | 2,171 | 2,026 |
| C. pseudotuberculosis MB66 | Equi | Horse | USA | 2,33737 | 2,175 | 1,955 |
| C. pseudotuberculosis MB20 | Equi | Horse | USA | 2,33739 | 2,180 | 1,896 |
| C. pseudotuberculosis 32 | Equi | Buffalo | Egypt | 2,33730 | 2,216 | 2,077 |
| C. pseudotuberculosis 33 | Equi | Buffalo | Egypt | 2,33729 | 2,214 | 2,072 |
| C. pseudotuberculosis 34 | Equi | Buffalo | Egypt | 2,33733 | 2,212 | 2,076 |
| C. pseudotuberculosis 35 | Equi | Buffalo | Egypt | 2,33732 | 2,216 | 2,074 |
| C. pseudotuberculosis 36 | Equi | Buffalo | Egypt | 2,33734 | 2,211 | 2,068 |
| C. pseudotuberculosis 38 | Equi | Buffalo | Egypt | 2,33731 | 2,210 | 2,065 |
| C. pseudotuberculosis 39 | Equi | Buffalo | Egypt | 2,33728 | 2,209 | 2,070 |
| C. pseudotuberculosis 43 | Equi | Buffalo | Egypt | 2,33756 | 2,170 | 2,037 |
| C. pseudotuberculosis 46 | Equi | Buffalo | Egypt | 2,33755 | 2,167 | 2,034 |
| C. pseudotuberculosis 48 | Equi | Buffalo | Egypt | 2,33735 | 2,211 | 2,072 |
| C. pseudotuberculosis I37 | Equi | Cow | Israel | 2,33742 | 2,166 | 2,029 |
| C. pseudotuberculosis MEX30 | Equi | Horse | Mexico | 2,33751 | 2,173 | 2,010 |
| C. pseudotuberculosis MEX31 | Equi | Horse | Mexico | 2,33754 | 2,182 | 2,058 |
| C. pseudotuberculosis 316 | Equi | Horse | USA | 2,33750 | 2,162 | 2,025 |
General information on the genomic dataset of 54 genomes of Corynebacterium pseudotuberculosis used in this work.
Simple sequence repeat identification
IMEx software identified the perfect microsatellites for the genome of each of the 54 selected strains, in the form of nucleotide sequences. The tool also accepts.ptt (Protein Table File) files as input, allowing the identification of SSRs located in genetic and intergenic regions. We established the perfect microsatellite search parameters in the IMEx tool as follows (size of motifs—the minimum number of repetitions): 1-12, 2-6, 3-4, 4-3, 5-3, and 6-3; based on research by Chen et al. (2011). The online tool VFanalyzer (Liu et al., 2019) was used to identify virulence factors (VFs) in the 54 genomes, and then only VFs containing microsatellites inserted in their sequences were selected.
Assessment of SSR patterns
The WEB BedSect tool (Mishra et al., 2020) was used to evaluate all SSRs regarding their positions in the genome to identify all possible similarities among the 54 genomes in this study. Additionally, two extra genomes of the same species were used for a biovar identification test by the position and type of microsatellite detected, considering the profile patterns discovered in this study. The selected genomes were C. pseudotuberculosis C231 belonging to the ovis biovar and C. pseudotuberculosis MB154 from the equi biovar.
Visualization of data
The results presented in the form of bar graphs were generated by the statistical analysis software environment R (https://www.r-project.org/) (R.D.C.T. 3.5.1, 2018). The output of the WEB BedSect tool was presented in the form of a heatmap. All bar graphs associated with each genome individually not presented in the discussion are provided in the Supplementary Material. The visualization of annotation and sequence features was executed using the Artemis genome browser (Carver et al., 2012).
Dataset for phylogenetic analysis
We conducted a phylogenetic analysis to check whether the heatmap and clusters recovered by the WEB BedSect tool match phylogenetic groups. A dataset formed by 38 genes that contain microsatellites shared by all 54 studied genomes was produced. For this, each gene for every sample of the 54 genomes was individually aligned and checked visually using MUSCLE software (Edgar, 2004), a plug-in from PhyDE® software (Müller et al., 2006). All aligned genes were concatenated using SequenceMatrix 1.8 software (Vaidya et al., 2011) to produce a dataset with 42,606 bp length, which is available in Supplementary Appendix S1.
Evolutionary model and partition scheme selection
PartitionFinder 2.1.1 software (Lanfear et al., 2017) was used to find the best-fit partitioning scheme of the dataset and the evolutionary nucleotide substitution model for each partition. All genes were defined according to the codon positions. The rcluster searching method was used to test all models implemented using RAxML 8.2.10 software (Stamatakis, 2014). The best models were selected by AICc values. Complete information on the partitioning schemes and the evolutionary nucleotide substitution model selected for each partition is presented in Supplementary Table S1.
Phylogenetic analysis
Phylogenetic reconstructions among different lineages of Corynebacterium pseudotuberculosis were performed using the maximum likelihood (ML) and neighbor-joining (NJ) algorithms. The ML analysis was carried out in RAxML 8.2.10 software (Stamatakis, 2014) using the selected partitioning schemes and substitution models (Supplementary Table S1). The most likelihood tree was searched 1,000 times, and the support of the internal nodes was estimated by 1,000 pseudo-replicates of bootstrap. The NJ analysis was carried out in MEGA X software (Kumar et al., 2018) using the K2P + G substitution model. Node support was estimated by bootstrap, using 1,000 pseudo-replicates.
Statistical analysis
The full dataset of microsatellites from the ovis biovar was gathered and imported into the RStudio software environment using the universal motif package (RStudio Team, 2020; Tremblay, 2022). The same step was performed for the microsatellites of equi biovar. Using the functions of the universal motif package, we merged all the motifs into two separate categories (ovis and equi). We applied a Euclidean distance method between the two groups to measure their similarity and represent the two microsatellite categories through an information content matrix. This calculation is based on Shannon’s entropy (Shannon, 1948), with the final values representing “bits” (Schneider, 1991).
Results
Through the IMEx tool, it was possible to locate all microsatellites fully inserted in coding regions, in non-coding regions, partially inserted in coding regions on the left (coding left overlap), and partially inserted in coding regions on the right (coding right overlap) (Figure 1). All genomes had microsatellites inserted in these four categories, except for the genomes of C. pseudotuberculosis 162 and C. pseudotuberculosis I19 that did not present microsatellites partially inserted in coding regions on the left (coding left overlap).
FIGURE 1
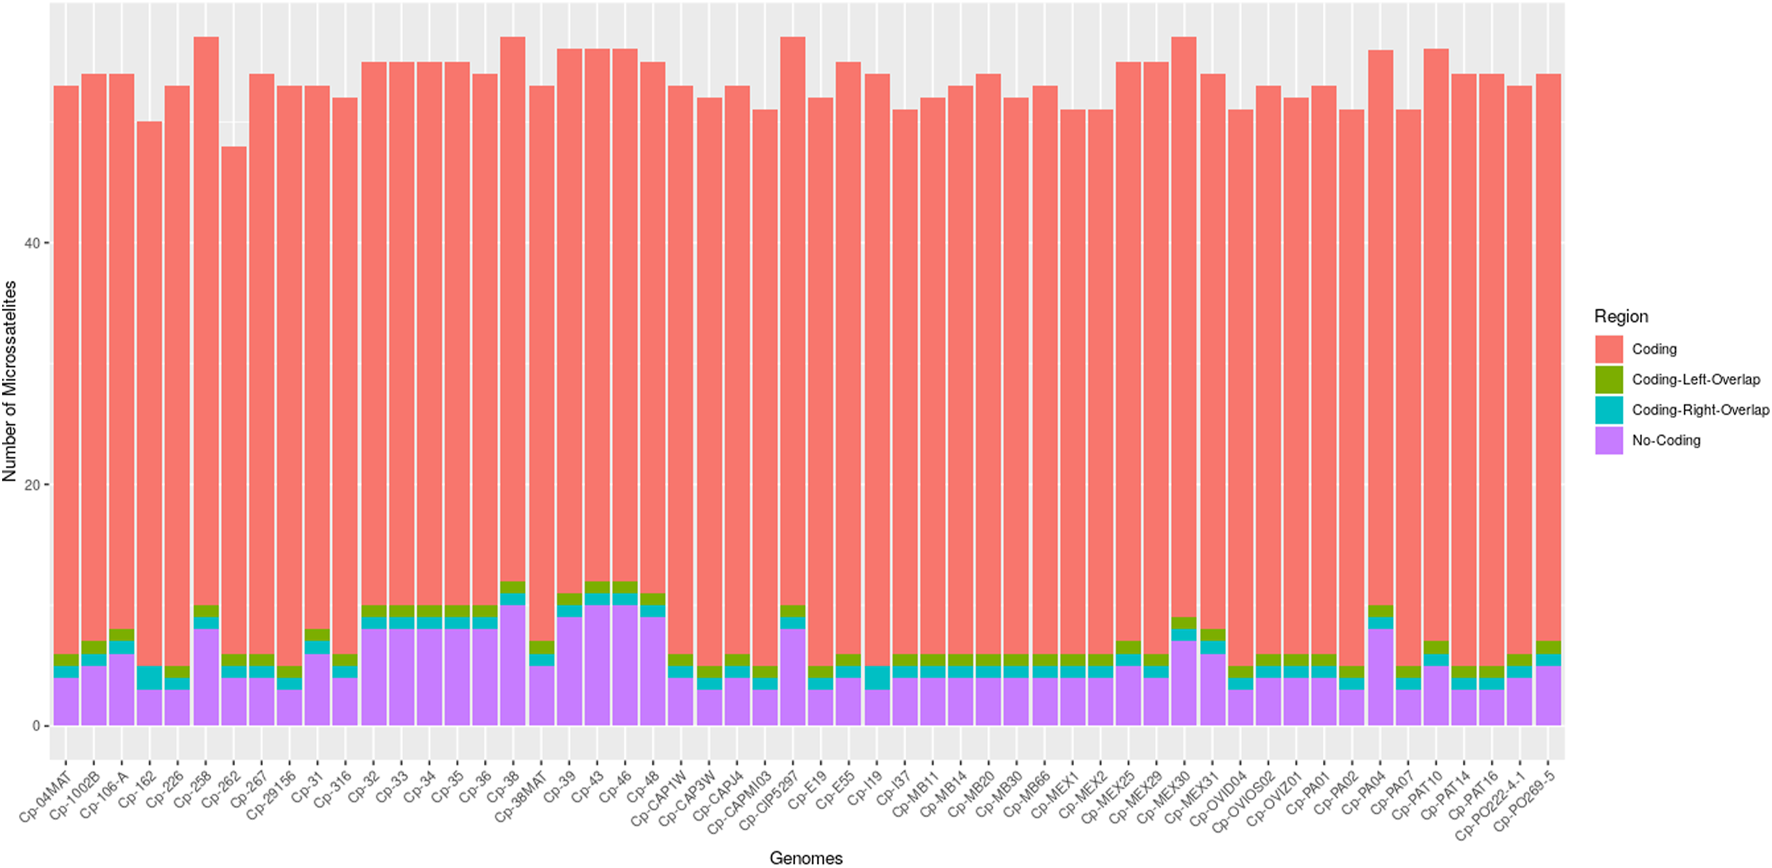
Bar graph showing the number of microsatellites found in the 54 genomes of C. pseudotuberculosis, divided into four categories: coding, non-coding, coding left overlap, and coding right overlap.
The genomes with the highest amount of SSRs were C. pseudotuberculosis MEX30, C. pseudotuberculosis CIP 52.97, C. pseudotuberculosis 38, and C. pseudotuberculosis 258, with a count of 57 SSRs each. All the other genomes in the study had a count of fewer than 57 microsatellites (Supplementary Table S1).
We selected every SSR present in coding regions and screened for the presence of those same motifs in different genomic regions. Thus, for each genome, a bar plot was made to display the frequency of these motifs. Therefore, if a motif has a frequency equal to two, it means that we can find the same motif in two different coding regions (two different genes with the same motif). The bar plot also displays the motif occurring within a coding region for a virulence factor, which is marked in red (Figures 2, 3).
FIGURE 2
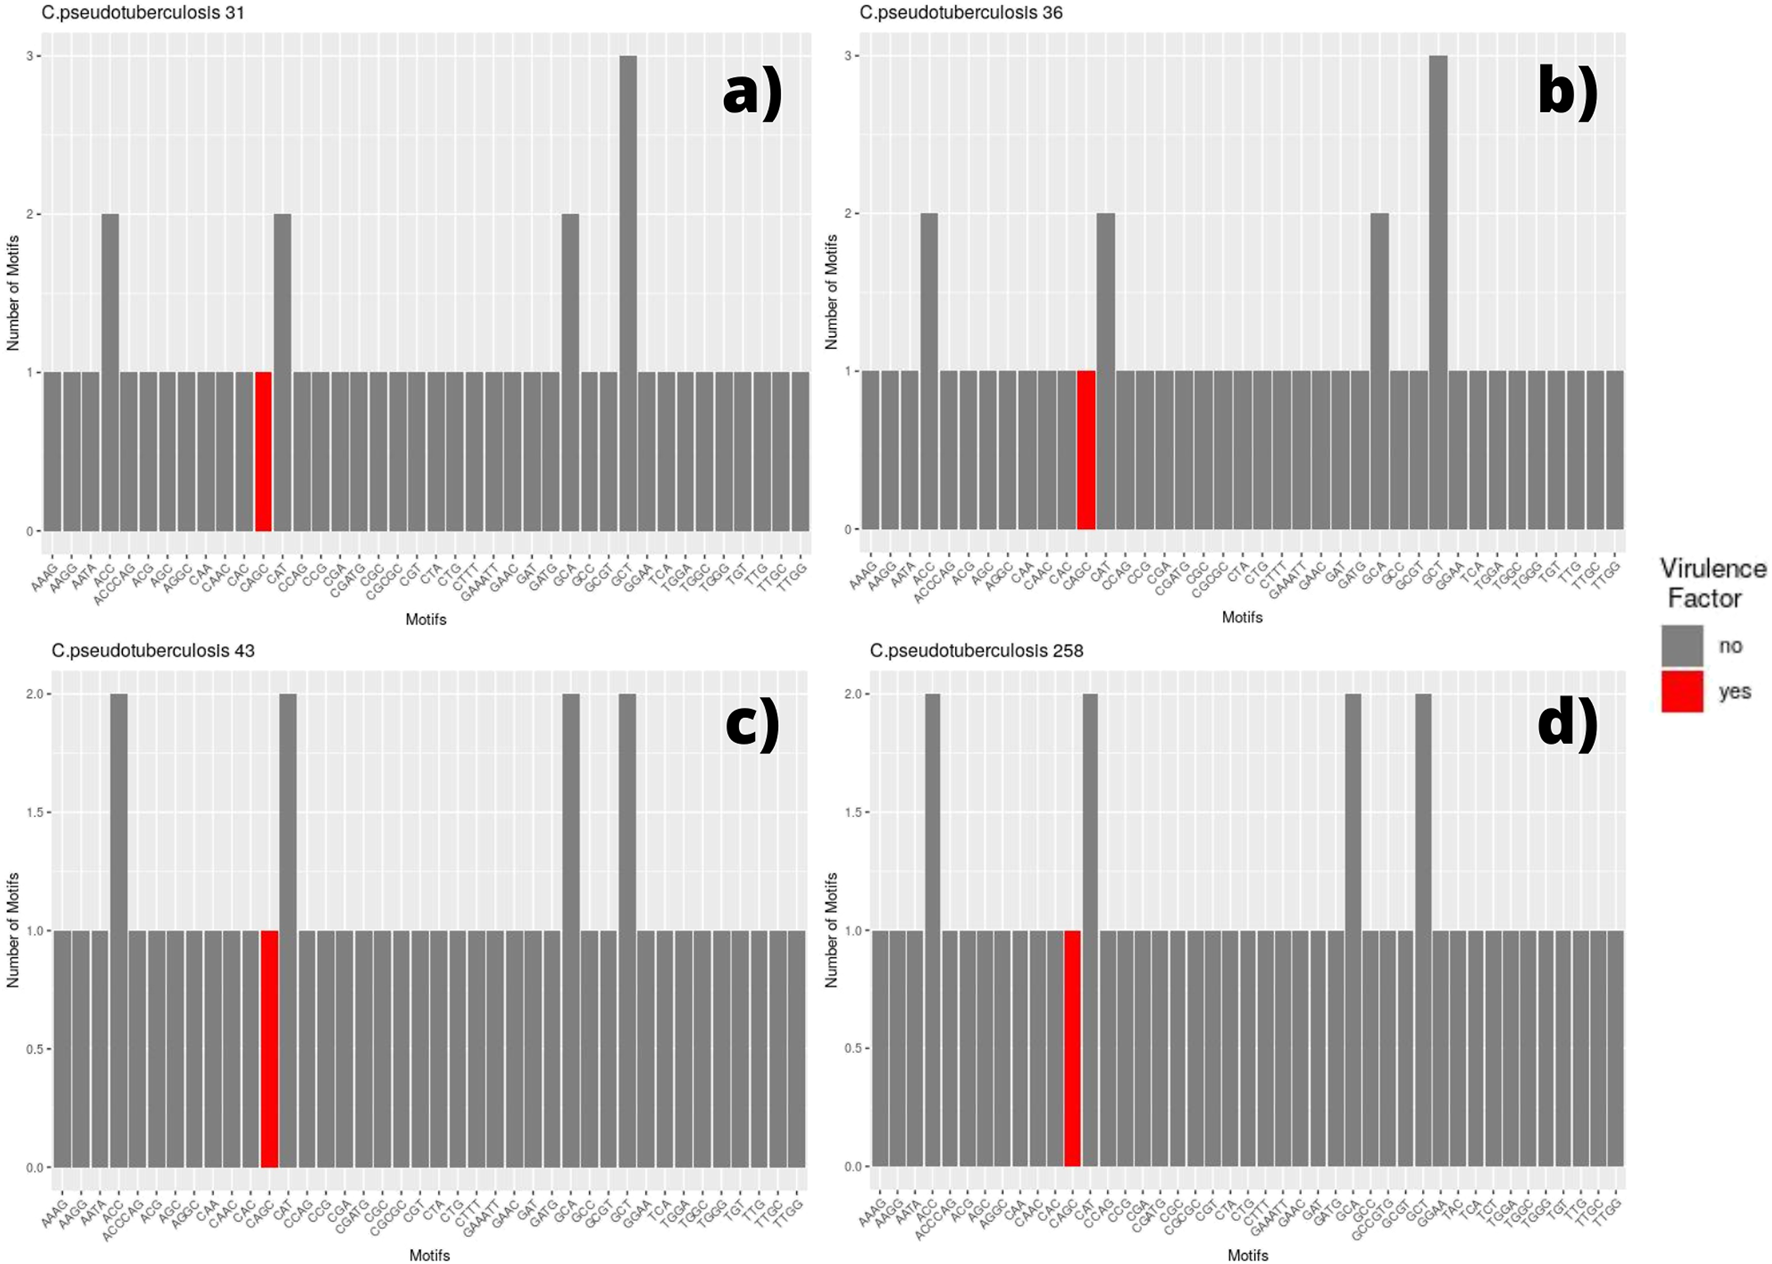
Bar graph showing the number of different SSR motifs observed in Corynebacterium pseudotuberculosis strains. In order, strain 31 (A); strain 36, with remarks to the absence of the CGT motif in this genome (B); strain 43, with remarks to the GCT motif occurring twice in this genome in different regions (C); and strain 258, presenting the same pattern that can be observed in C. pseudotuberculosis CIP 52.97 (D).
FIGURE 3
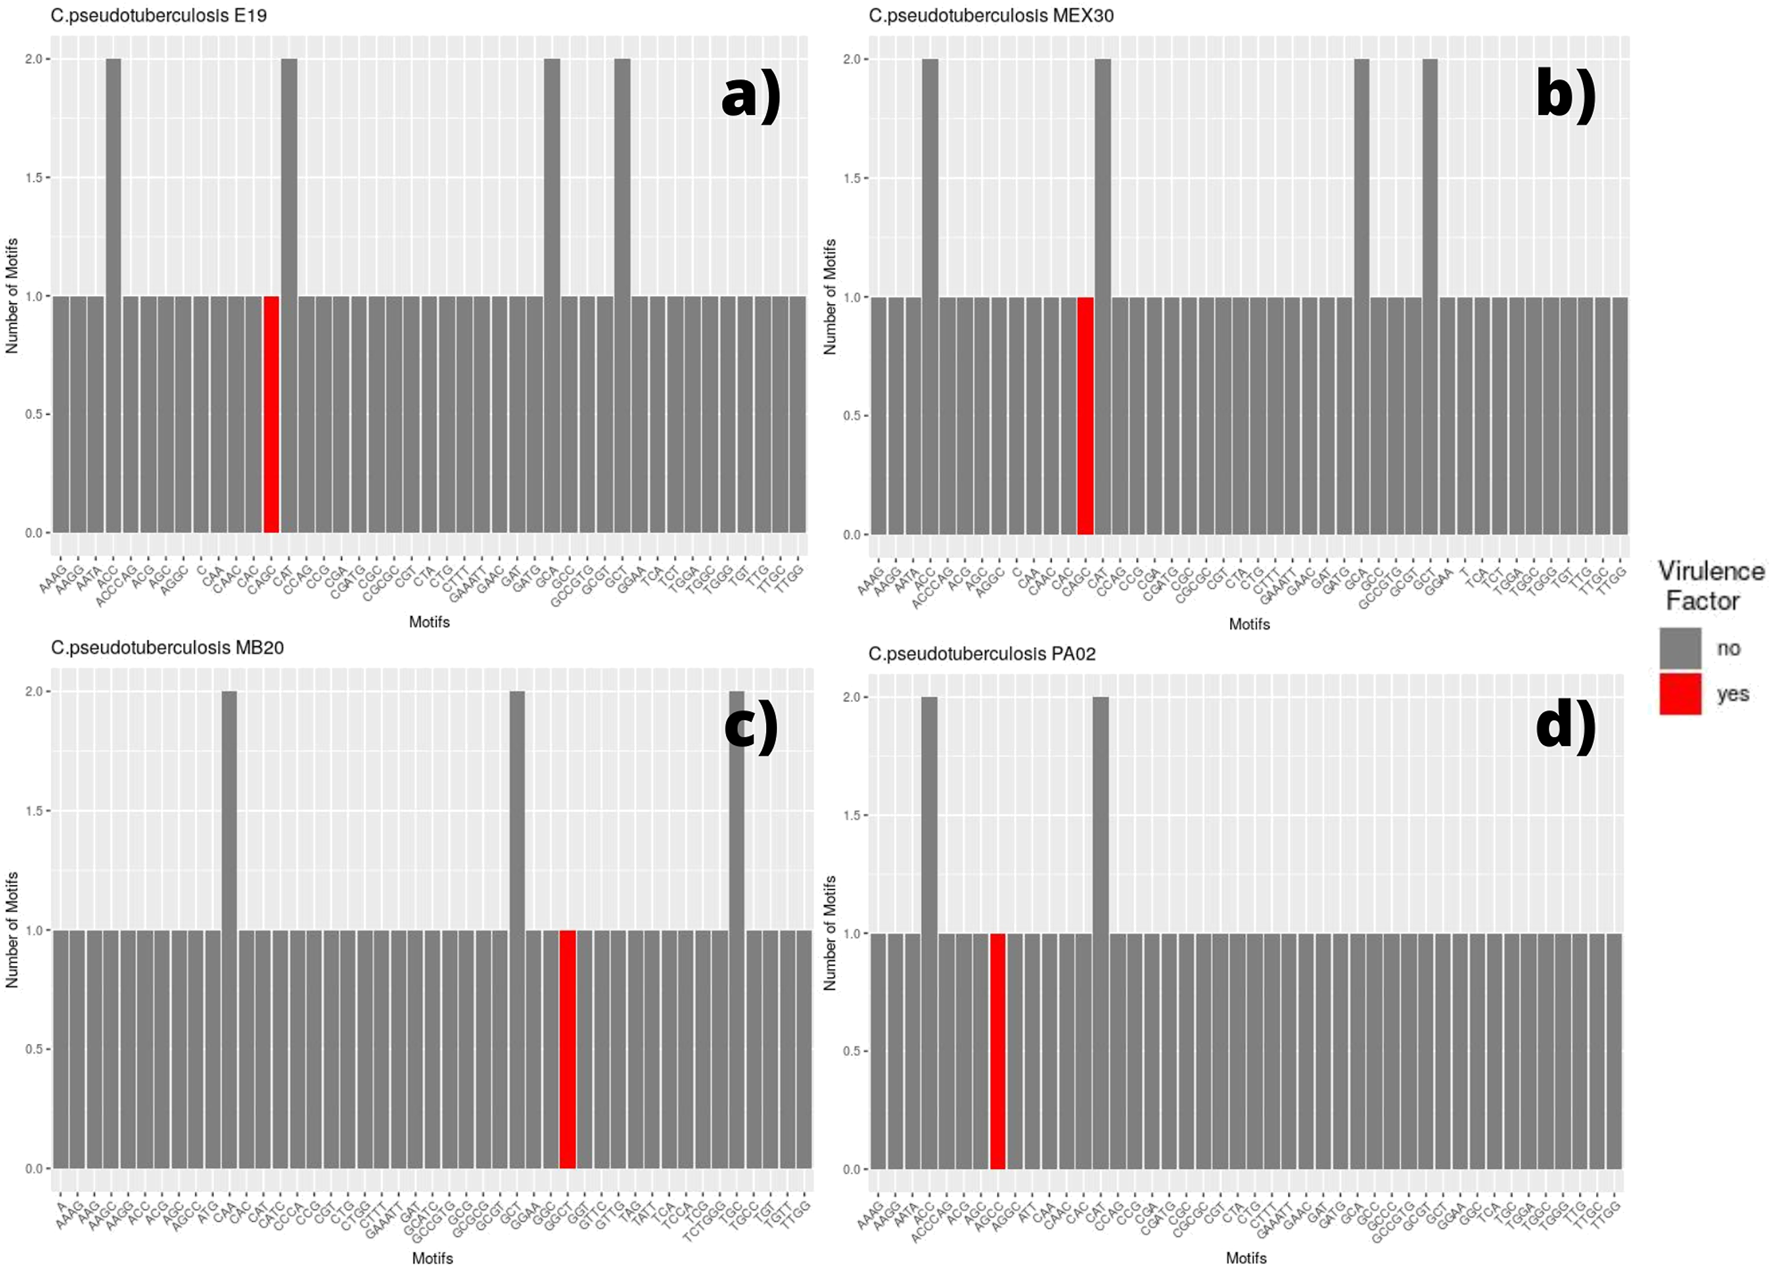
Bar graph showing the number of different SSR motifs observed in Corynebacterium pseudotuberculosis strains. In order, strain E19 (A); strain MEX 30 (B); strain MB20, in which the microsatellite with a GGCT motif occurs within a virulence factor located on the direct ribbon (C); and strain PA02, in which the microsatellite with an AGCC motif occurs within a virulence factor located on the reverse ribbon (D).
Biovar equi
Among the genomes belonging to the equi biovar, we identified that the strains C. pseudotuberculosis 31, 32, 33, 34, 35, 36, 38, and 39 presented the same pattern, which can be observed in Figure 2, which shows the genome of C pseudotuberculosis 31 (Figure 2A). The presence of a motif located within a gene encoding for a virulence factor, the motif CAGC, is highlighted in the plot by a red bar.
In this genome, we can see that the most frequent motifs are: GCT, present in three different coding regions—hypothetical protein, cation-translocating P-type ATPase, and transporter; ACC, present in two different coding regions—elongation factor G and SPFH/Band 7/PHB domain protein; CAT, present in two distinct coding regions—potassium channel family protein and GNAT family N-acetyltransferase; and GCA, also present in two distinct regions—DNA-binding protein WhiA and S8 family peptidase. The only difference observed between these genomes (C. pseudotuberculosis 31, 32, 33, 34, 35, 36, 38, and 39) occurred in the genome of C. Pseudotuberculosis 36 in which the CGT motif was not found (Figure 2B).
The strains C. pseudotuberculosis 43 (Figure 2C) showed similar SSR patterns to C. pseudotuberculosis 46 and 31 strains, except for the GCT motif, presented in three distinct coding regions for C. pseudotuberculosis 31 and only in two distinct regions for C. pseudotuberculosis 43 and 46 strains. The C. pseudotuberculosis 258 (Figure 2D) and CIP 52.97 strains also showed identical microsatellite profiles from their genomes.
The SSR profile of C. pseudotuberculosis E19 was similar to strains 258 and CIP 52.97, except for a single microsatellite having a mononucleotide C as a motif inserted in a gene encoding the NADP-dependent oxidoreductase product (Figure 3A). Single microsatellites of mononucleotide C and mononucleotide T were also observed in the genome of C. pseudotuberculosis MEX 30 (Figure 3B).
On the equi biovar, the presence of a microsatellite inserted within a virulence factor coding region was observed at every genome. The inserted SSR for most of the strains presented a CAGC motif, whereas, for C. pseudotuberculosis MB20 and MB66 strains, it was a GGCT motif (Figure 3C).
Biovar ovis
Regarding the genomes of ovis biovar, the C. pseudotuberculosis strains 226, 267, 29156, I19, MEX25, MEX29, PAT10, PAT14, and PAT16 did not present any microsatellites inserted within genes that encode virulence factors (Supplementary Figure S1). Still, while in the equi biovar the CAGC motif was identified in most of the VFs found in each genome; in the ovis biovar, the most identified motif was GGCT (Supplementary Figure S1), except for the C. pseudotuberculosis PA01, PA04, and PA07 strains in which the observed motif was CAGC (Supplementary Figure S1). Remarkably, it was observed that in the genome of C. pseudotuberculosis PA02, unlike all genomes in this study, the motif associated with the virulence factor was AGCC (Figure 3D).
WEB BedSect analysis
The analysis of the genomic regions containing microsatellites showed similarity among the genomes of the ovis biovar, and they displayed an intrinsic similarity among the genomes from the equi biovar. It was possible to distinguish the two biovars of C. pseudotuberculosis by analyzing the patterns observed inter-biovars (ovis vs. equi) and intra-biovars (ovis vs. ovis, and equi vs. equi), comparing exclusively the regions where SSRs were found for every genome of this study. The following graph shows a remarkable separation between biovars (Figure 4).
FIGURE 4
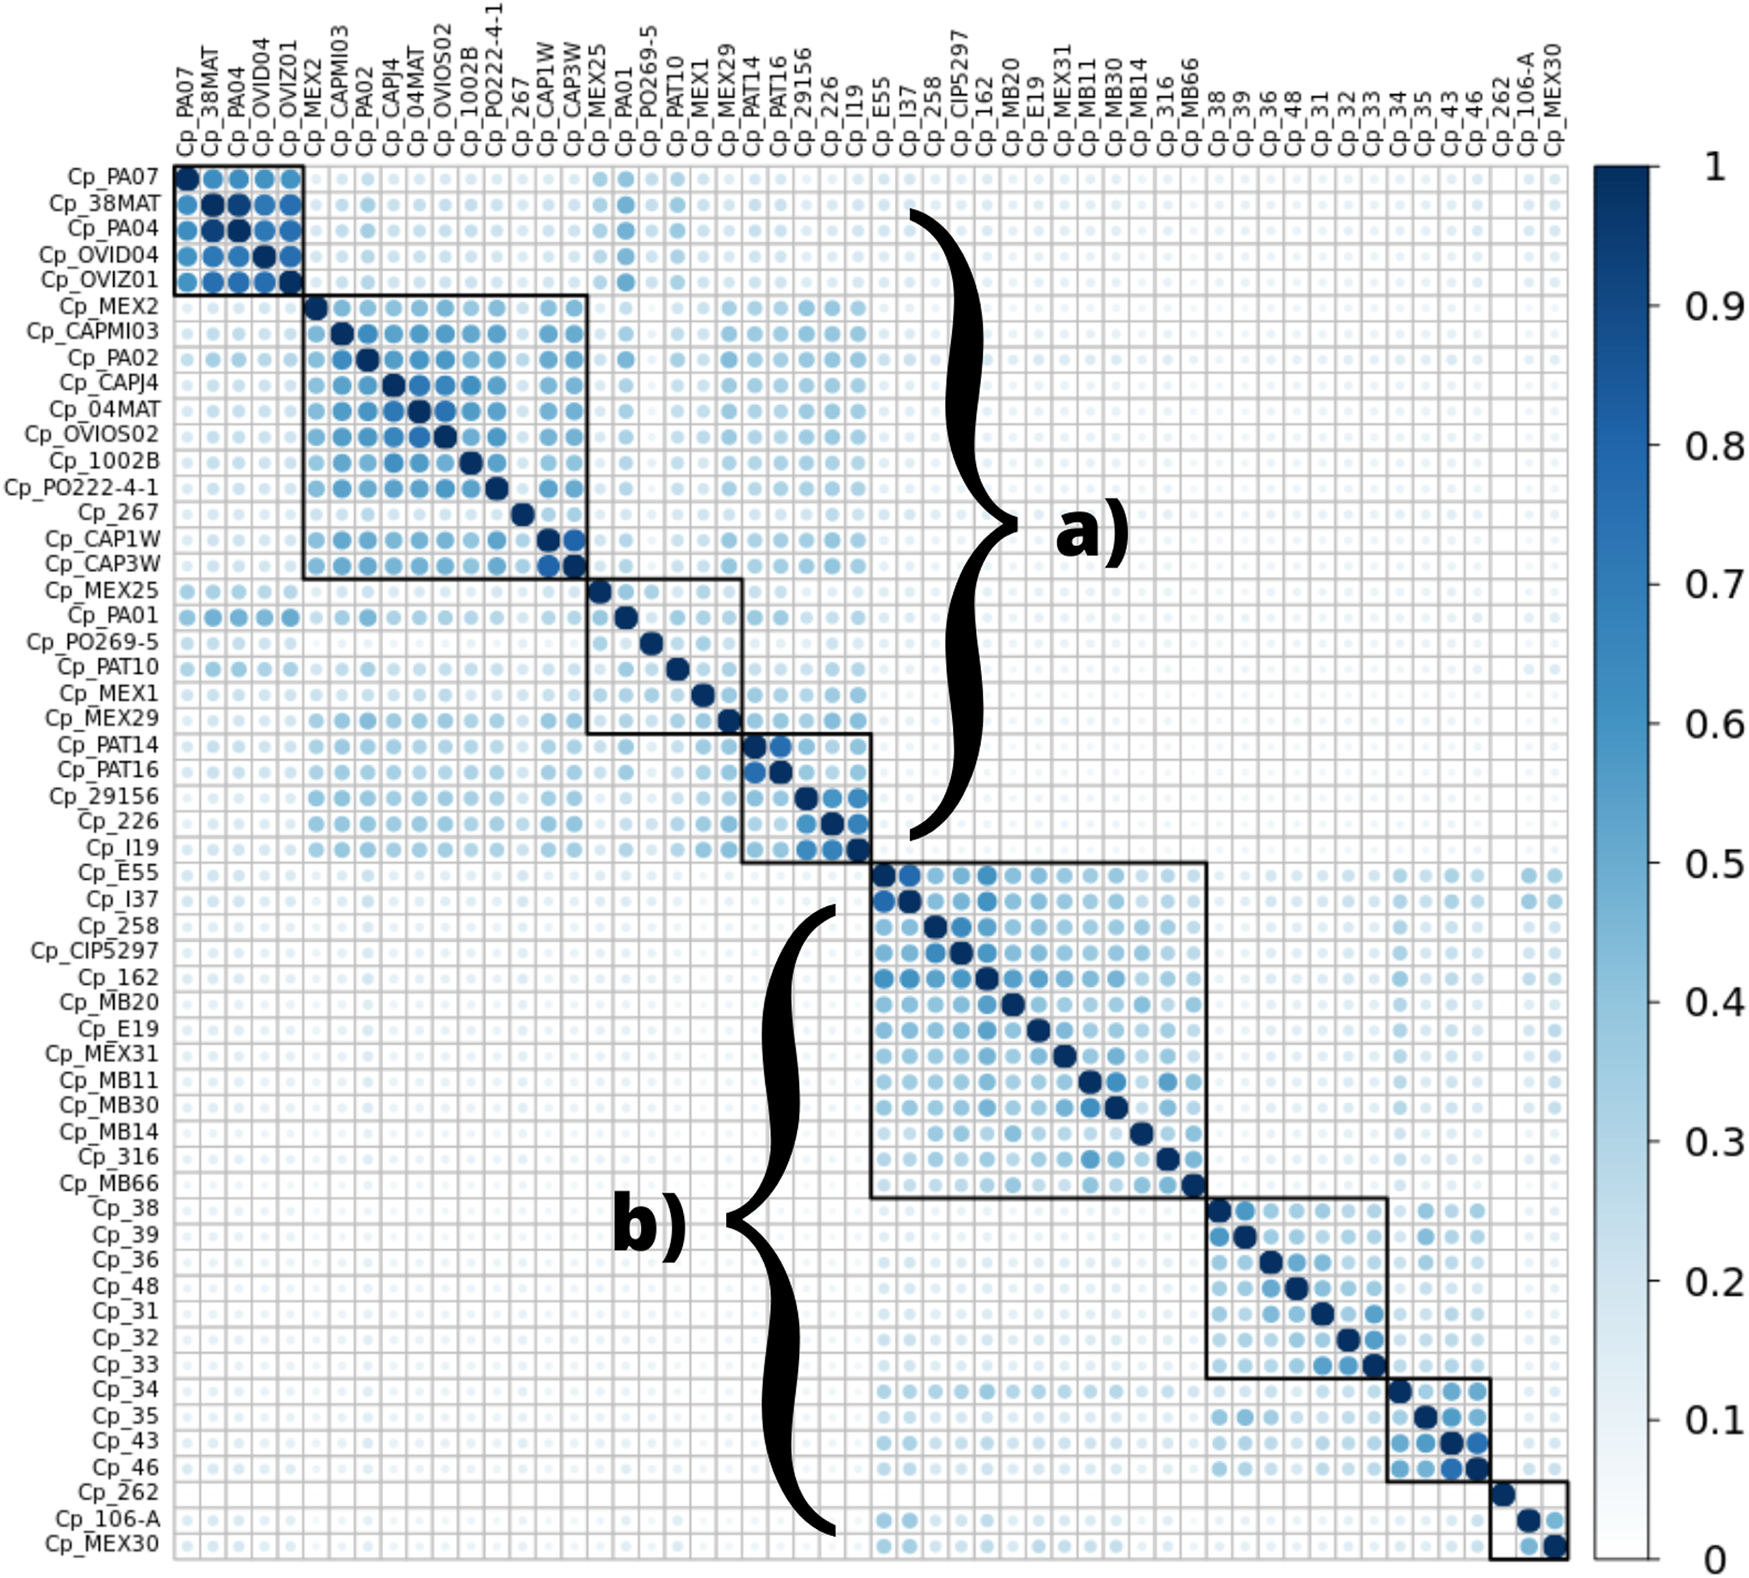
Heatmap demonstrating the similarity between microsatellite regions among the 54 genomes of C. pseudotuberculosis in this study, in particular displaying a significant separation between biovars ovis(A) and equi(B). The similarity observed is displayed on a color scale from blank to light blue to darker blue (a greater number of identical regions).
Some microsatellites identified by the WEB BedSect intersections were selected to identify the differences between the ovis and equi biovars. There was a positional change in these motifs occurring between biovars (Tables 2, 3).
TABLE 2
| Motif | Start | End | Biovar | Motif | Start | End | Biovar | Motif | Start | End | Biovar |
|---|---|---|---|---|---|---|---|---|---|---|---|
| GGAA | 42,622 | 42,633 | Ovis | GGAA | 44,639 | 44,640 | Ovis | GGAA | 52,758 | 52,769 | Equi |
| GGAA | 44,251 | 44,262 | Ovis | GGAA | 44,640 | 44,641 | Ovis | GGAA | 52,800 | 52,810 | Equi |
| GGAA | 44,621 | 44,623 | Ovis | GGAA | 44,641 | 44,642 | Ovis | GGAA | 52,810 | 52,811 | Equi |
| GGAA | 44,623 | 44,626 | Ovis | GGAA | 44,642 | 44,643 | Ovis | GGAA | 52,811 | 52,814 | Equi |
| GGAA | 44,626 | 44,627 | Ovis | GGAA | 52,021 | 52,022 | Equi | GGAA | 52,814 | 52,818 | Equi |
| GGAA | 44,627 | 44,628 | Ovis | GGAA | 52,022 | 52,023 | Equi | GGAA | 52,818 | 52,821 | Equi |
| GGAA | 44,628 | 44,629 | Ovis | GGAA | 52,023 | 52,024 | Equi | GGAA | 52,821 | 52,825 | Equi |
| GGAA | 44,629 | 44,630 | Ovis | GGAA | 52,024 | 52,026 | Equi | GGAA | 52,825 | 52,829 | Equi |
| GGAA | 44,630 | 44,631 | Ovis | GGAA | 52,026 | 52,032 | Equi | GGAA | 52,829 | 52,832 | Equi |
| GGAA | 44,631 | 44,632 | Ovis | GGAA | 52,032 | 52,033 | Equi | GGAA | 52,832 | 52,836 | Equi |
| GGAA | 44,632 | 44,634 | Ovis | GGAA | 52,033 | 52,034 | Equi | GGAA | 52,836 | 52,847 | Equi |
| GGAA | 44,634 | 44,637 | Ovis | GGAA | 52,034 | 52,035 | Equi | GGAA | 56,279 | 56,290 | Equi |
| GGAA | 44,637 | 44,638 | Ovis | GGAA | 52,035 | 52,037 | Equi | GGAA | 57,146 | 57,157 | Equi |
| GGAA | 44,638 | 44,639 | Ovis | GGAA | 52,698 | 52,709 | Equi | GGAA | 57,167 | 57,178 | Equi |
Localization of the GGAA motif between equi and ovis biovars.
TABLE 3
| Motif | Start | End | Biovar | Motif | Start | End | Biovar | Motif | Start | End | Biovar |
|---|---|---|---|---|---|---|---|---|---|---|---|
| CAC | 54,914 | 54,925 | Ovis | CAC | 56,951 | 56,952 | Ovis | CAC | 65,108 | 65,119 | Equi |
| CAC | 56,564 | 56,575 | Ovis | CAC | 56,952 | 56,953 | Ovis | CAC | 65,119 | 65,125 | Equi |
| CAC | 56,905 | 56,916 | Ovis | CAC | 56,953 | 56,954 | Ovis | CAC | 65,125 | 65,129 | Equi |
| CAC | 56,932 | 56,936 | Ovis | CAC | 56,954 | 56,955 | Ovis | CAC | 65,129 | 65,130 | Equi |
| CAC | 56,936 | 56,938 | Ovis | CAC | 56,955 | 56,956 | Ovis | CAC | 65,130 | 65,134 | Equi |
| CAC | 56,938 | 56,939 | Ovis | CAC | 64,331 | 64,332 | Equi | CAC | 65,134 | 65,136 | Equi |
| CAC | 56,939 | 56,940 | Ovis | CAC | 64,332 | 64,333 | Equi | CAC | 65,136 | 65,138 | Equi |
| CAC | 56,940 | 56,941 | Ovis | CAC | 64,333 | 64,334 | Equi | CAC | 65,138 | 65,140 | Equi |
| CAC | 56,941 | 56,942 | Ovis | CAC | 64,334 | 64,336 | Equi | CAC | 65,140 | 65,145 | Equi |
| CAC | 56,942 | 56,943 | Ovis | CAC | 64,336 | 64,342 | Equi | CAC | 65,145 | 65,147 | Equi |
| CAC | 56,943 | 56,944 | Ovis | CAC | 64,342 | 64,343 | Equi | CAC | 65,147 | 65,149 | Equi |
| CAC | 56,944 | 56,945 | Ovis | CAC | 64,343 | 64,344 | Equi | CAC | 65,149 | 65,158 | Equi |
| CAC | 56,945 | 56,947 | Ovis | CAC | 64,344 | 64,345 | Equi | CAC | 66,032 | 66,043 | Equi |
| CAC | 56,947 | 56,949 | Ovis | CAC | 64,345 | 64,347 | Equi | CAC | 69,456 | 69,467 | Equi |
| CAC | 56,949 | 56,950 | Ovis | CAC | 65,009 | 65,020 | Equi | CAC | 69,477 | 69,488 | Equi |
| CAC | 56,950 | 56,951 | Ovis | CAC | 65,068 | 65,079 | Equi |
Localization of the CAC motif between equi and ovis biovars.
The GGAA motif always appears between coordinates 42,000 and 45,000 in the ovis biovar, whereas, in the equi biovar, it occurs between coordinates 52,000 and 57,000, approximately. Likewise, the CAC motif always appears between the coordinates 54,000 and 56,900 in the ovis biovar, whereas, in the equi biovar, it occurs approximately between coordinates 64,000 and 69,000. This positional difference of microsatellites between biovars was also observed for the CAA, CTG, TGT, and CTG motifs, among others, making these microsatellites potential biomarkers capable of distinguishing biovars.
To test this potential, two genomes (C. pseudotuberculosis C231—ovis and C. pseudotuberculosis MB154—equi) that were not amongst the 54 initial genomes in this study were selected, and the CAC and GGAA motifs were used to identify the biovars by the position and type of microsatellite observed. Thus, other strains out of the scope of this work had their biovars successfully identified only by the coordinates of SSRs found in this study (Table 4).
TABLE 4
| Genome | CAC | GGAA | Biovar |
|---|---|---|---|
| C. pseudotuberculosis C231 | 56941–56952 | 44628–44639 | Ovis |
| C. pseudotuberculosis MB154 | 65124–65135 | 52813–52824 | Equi |
Location of CAC and GGAA motifs for a test of biovar identification.
Phylogenetic analysis
ML and NJ tree reconstructions produced similar branching patterning. Two main clades were obtained with maximum bootstrap values, which reflect the ovis and equi groups (Figure 5) with one exception. The sample Cp_262, which is an equi lineage, was more similar to the ovis samples, grouping with them in the basal position of this clade (Figure 5). To investigate this incongruence, we compute the pairwise genetic distances between all samples using p-distance. As shown in Supplementary Table S2, Cp_262 is slightly more similar to the ovis samples (p-distance from 0.66 to 0.68%) than to the equi ones (p-distance from 0.82 to 0.91%). However, the genetic divergences between almost all samples of ovis were less than 0.09%, except for the sample Cp_267, which ranged from 0.13 to 0.18% (Supplementary Table S2). It shows that Cp_262 is different from both ovis and equi clades. Three monophyletic groups were recovered in each ovis clade and equi clade from both ML and NJ analyses, but the phylogenetic relationships within each group were inconsistent (Figure 5, Supplementary Figure S1).
FIGURE 5
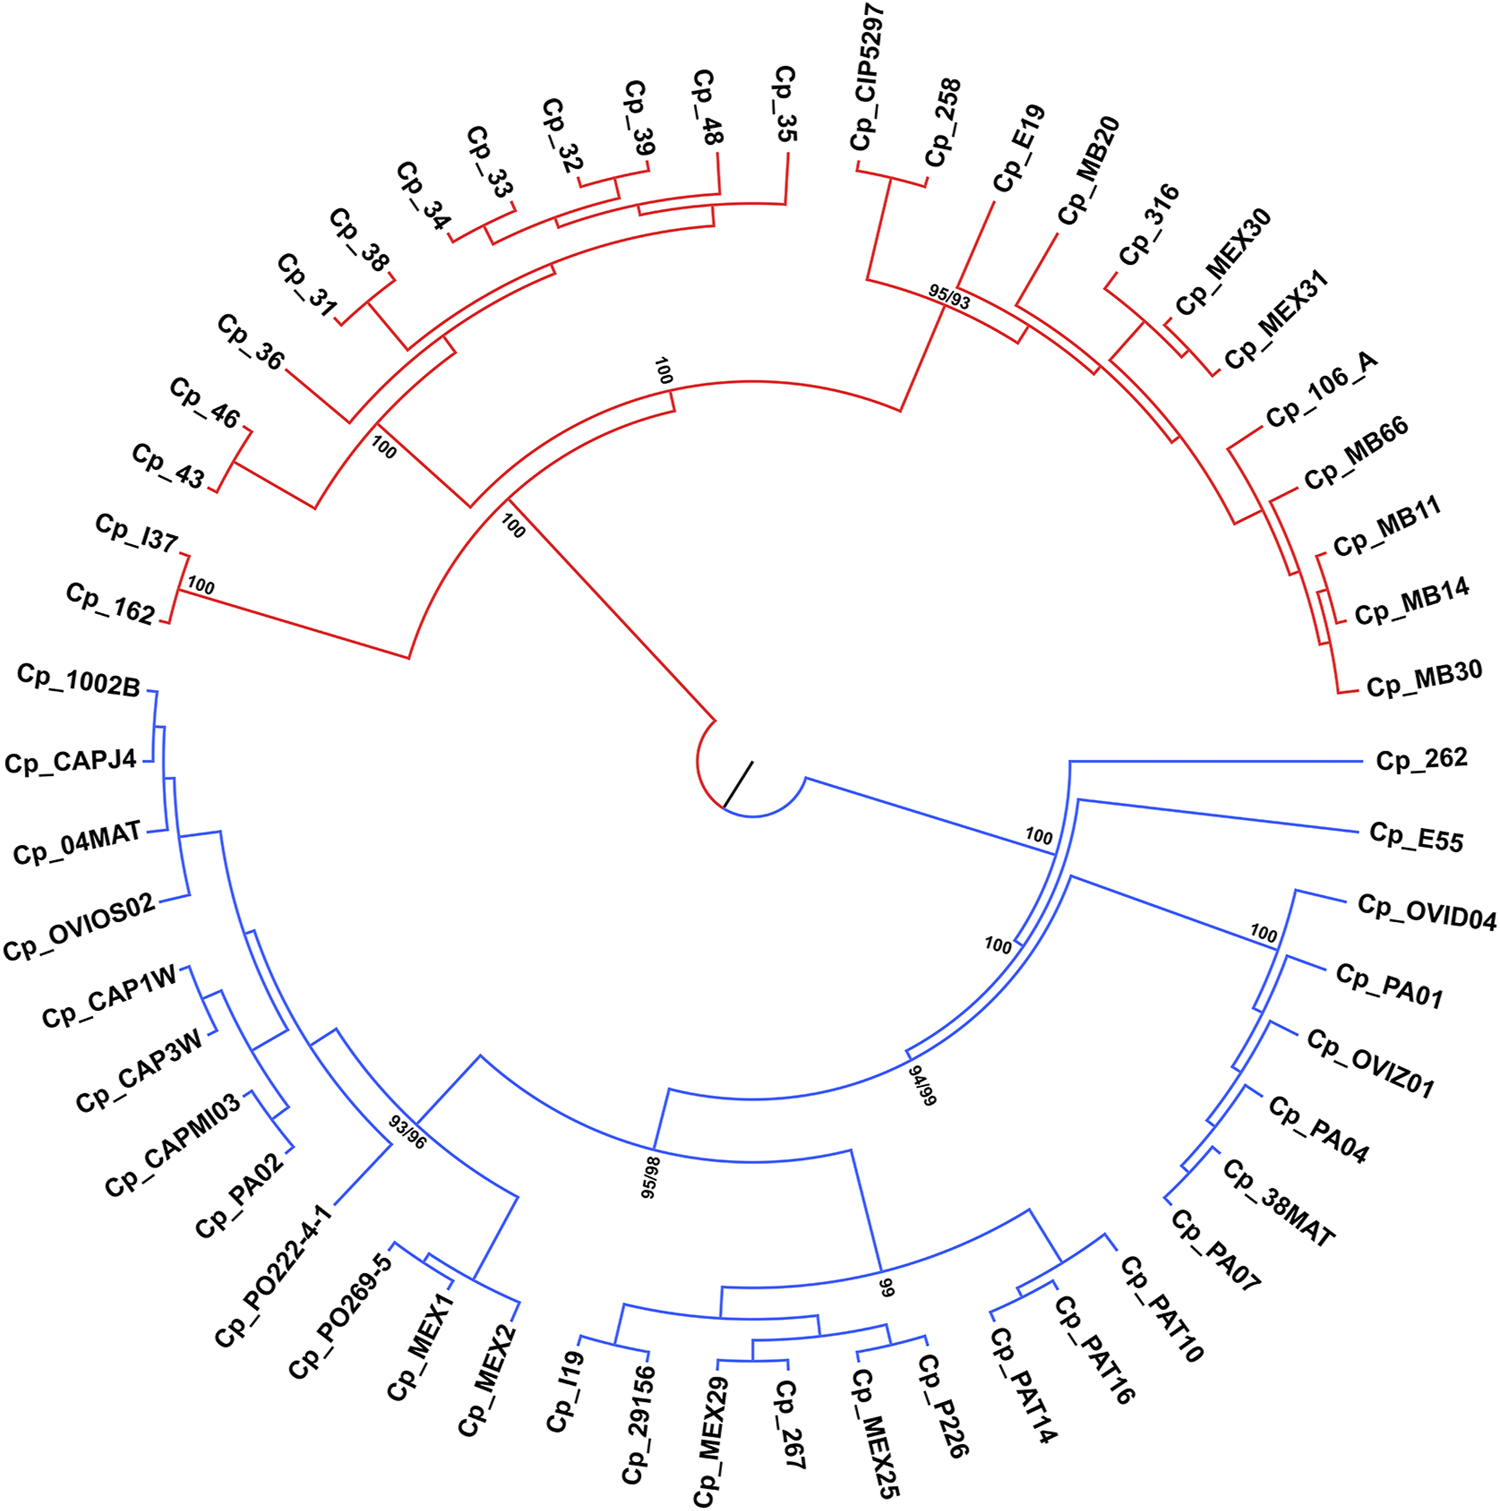
Phylogenetic tree reconstruction of the 54 genomes of C. pseudotuberculosis, branching into two main clades with maximum bootstrap values for the ovis (in blue) and equi (in red) biovars.
Statistical analysis
The two groups of microsatellites, equi and ovis biovars, were similar under statistical analysis, presenting a Euclidean distance score of 0.169405 and a significance of 0.006 (p-value). The probability of each base for each microsatellite position observed was estimated. These results are represented through an information content matrix where it is possible to evaluate which positions are the most important, as each position’s total information indicates the conservation level. Thus, we can graphically observe this matrix in the form of a sequence logo, highlighting a difference between the equi and ovis biovars in position 3, indicating the possibility of using them as markers for the different biovars (Figure 6).
FIGURE 6
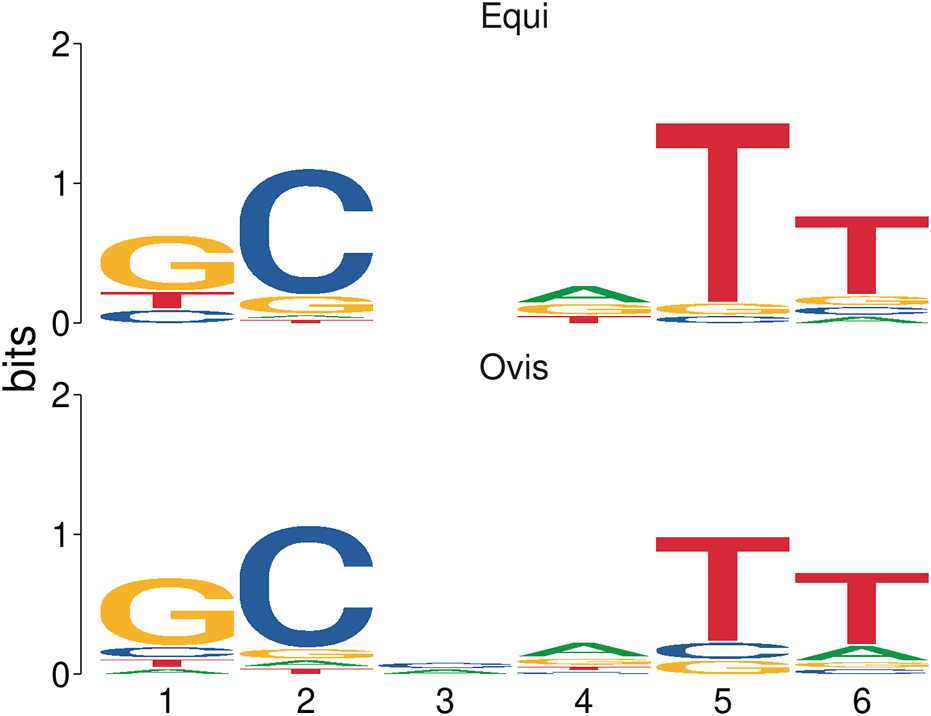
Sequence logo representation based on an information content matrix comparison between ovis and equi microsatellite biovars. In this figure, we can see the difference in position 3 and the similarities in the other positions when comparing the two sets of microsatellites by using the information content matrix method.
Discussion
Microsatellites are repetitive elements characterized by having a high degree of polymorphism, hence, less likely to be evolutionarily retained in essential gene clusters (Oliveira et al., 2006). According to the results observed in Figure 1, the amount of SSRs observed in coding regions of Corynebacterium pseudotuberculosis is much higher than that in non-coding regions. This observation could be understood as a result of prokaryotic genomes having a smaller number of intergenic regions than eukaryotic genomes (Koonin and Wolf, 2008).
The only virulence factor that contained SSRs observed in the genomes of this study is associated with a structure known as SpaH-type pili. A 2007 study on Corynebacterium diphtheriae reported that the low conservation rate of this SpaH locus suggests that mutations in these regions are better tolerated because they are less important for C. diphtheriae infection. Adherence tests have shown that the pili of the SpaH type preferentially mediate binding to the cells of the larynx and lung (Mandlik et al., 2007). The presence of SSRs occurring only in this VF in C. pseudotuberculosis suggests that it is also well-tolerated by this species and possible polymorphisms in such regions would not affect its virulence. However, further in vitro studies of C. pseudotuberculosis would be necessary to confirm this hypothesis.
The CAGC motif inserted within the VF-coding region occurred whenever the gene was located in the reverse strand (Figure 7), while the GGCT motif was found in the VF when the corresponding gene was on the direct strand (Figure 8). This fact explains why the strains MB20 (Figure 8) and MB66 were the only ones in the equi biovar to present the GGCT motif, as, unlike the others of this biovar, the virulence factor observed in these two strains was on the direct strand. Therefore, such results suggest a potential for using different microsatellites located in the same gene to identify positional changes associated with the DNA strand of these genes in different genomes of C. pseudotuberculosis.
FIGURE 7
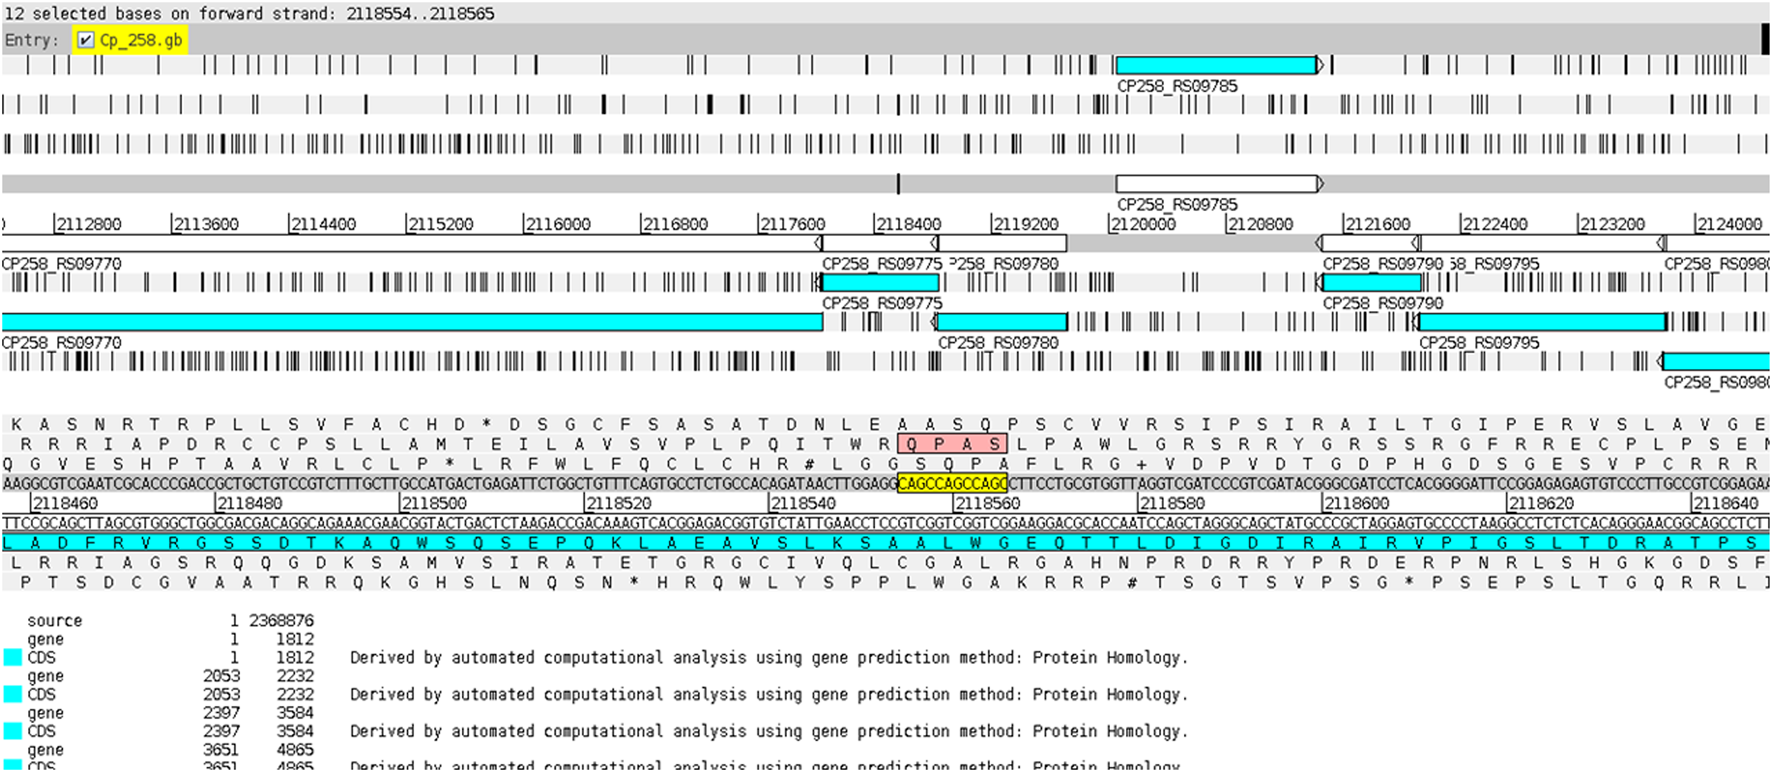
Display of the CAGC motif inserted within the virulence factor SpaH on the reverse ribbon of the genome of C. pseudotuberculosis 258 using the Artemis genome browser (Carver et al., 2012).
FIGURE 8
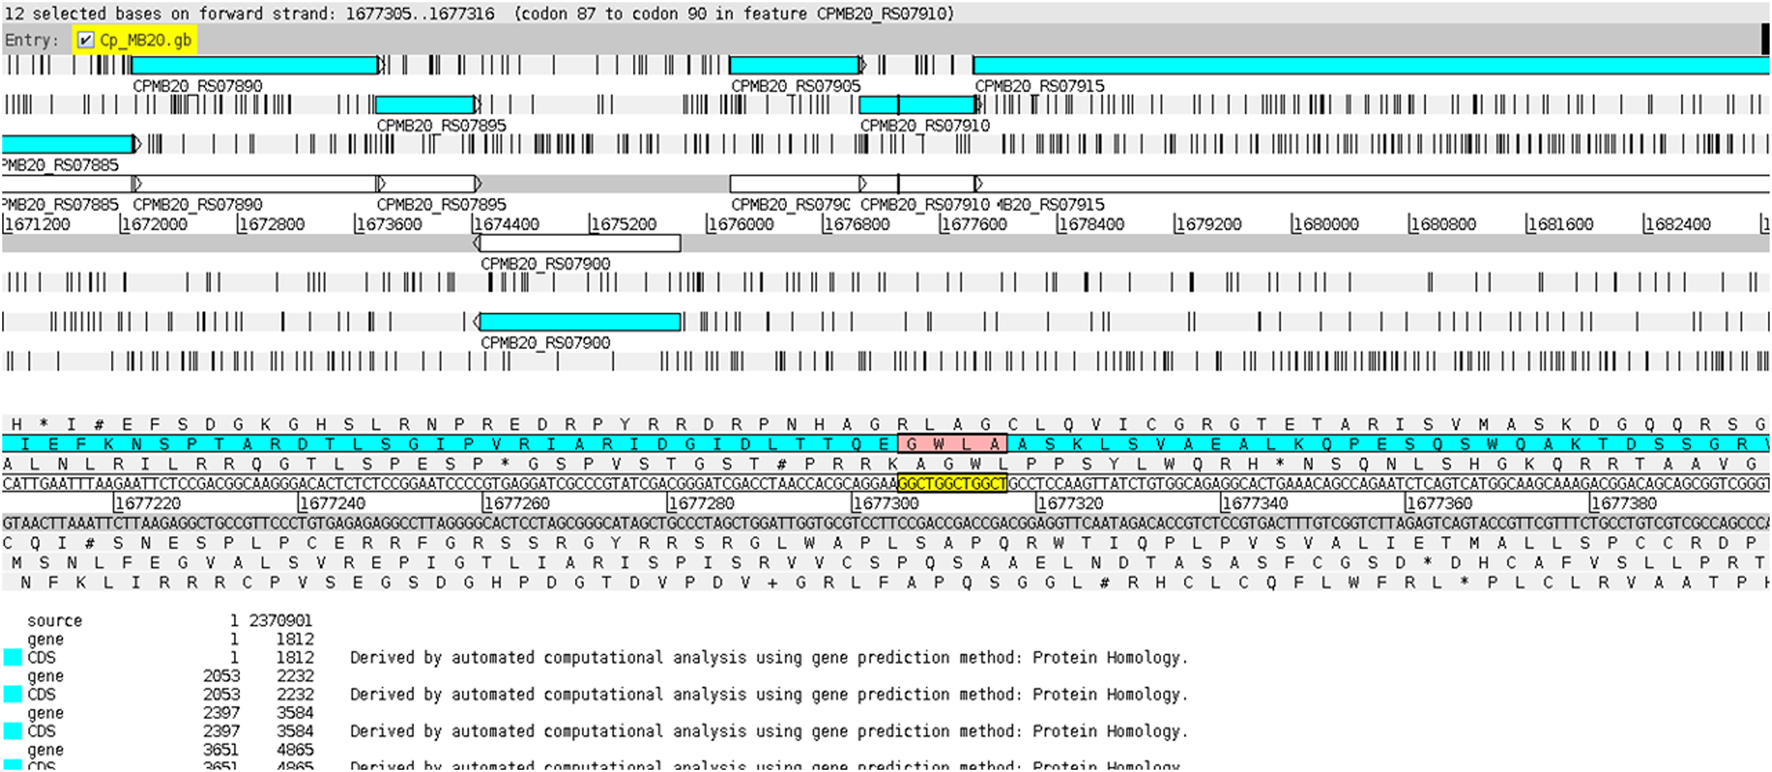
Display of the GGCT motif inserted within the virulence factor SpaH on the direct ribbon of the genome of C. pseudotuberculosis MB20 using the Artemis genome browser (Carver et al., 2012).
Some genomes of the equi biovar (C. pseudotuberculosis 31, 32, 33, 34, 35, 36, 38, and 39) showed 100% similarity in all microsatellite regions observed, except for the C. pseudotuberculosis 36 strain in which the CGT motif was not found (Figure 2B; Supplementary Table S2). According to the phylogenetic analyses, the p-distance also showed that these genomes are 100% equal, including strains 36 and 48 (Supplementary Table S2). The samples of C. pseudotuberculosis 43 and 46 differ from the other samples only by 0.0023%. This CGT motif was found in a gene that encodes an HNN endonuclease (HNHE), encoded by many bacteriophage and prophage genomes next to their cohesive end site and terminase genes (Xu and Gupta, 2013).
While looking at the flanking regions in the genomes, the following arrangement of bases was detected: TGG CGT CGT CGT CGT GAA. However, in the genome of C. pseudotuberculosis 36, the arrangement of bases was as follows: TGG CGT CGT CGT GAA. Hence, it was not identified as an SSR because a tandem repetition of at least four times is required to identify a trinucleotide motif. This suggests a possible polymorphism in this region of C. pseudotuberculosis 36, where a CGT trinucleotide was deleted. The same SSR pattern displayed by strain 36 can be seen in strain 48, including the possible polymorphism identified in the same position of the gene encoding for an HNNE. This result corroborates with the Genome Tree Report of the NCBI (Agarwala et al., 2018), as well as with phylogenetic reconstructions (Figure 5) where these two strains (C. pseudotuberculosis 36 and C. pseudotuberculosis 48) have a common ancestor.
The C. pseudotuberculosis 43 (Figure 2C) and 46 strains also showed patterns of microsatellites identical to each other and similar to C. pseudotuberculosis 31, while strains 43 and 46 have an ancestor in common, corroborated by the Genome Tree Report of the NCBI (Agarwala et al., 2018) and phylogenetic trees (Figure 5). Identical microsatellites can also be observed in the C. pseudotuberculosis 258 and CIP 52.97 strains, which are genetically identical to each other (Supplementary Table S2) and share a common ancestor (Figure 5). Interestingly, the C. pseudotuberculosis MEX30 strain was the only one from the equi biovar to present in its genome two mononucleotides as microsatellites. Such characteristics demonstrate the potential use of these microsatellites as biomarkers capable of differentiating strains of the same species.
Regarding the genomes of the ovis biovar, some strains (C. pseudotuberculosis 226, 267, 29156, I19, MEX25, MEX29, PAT10, PAT14, and PAT16) did not show the virulence factor SpaH and, consequently, did not show any microsatellites with GGCT or CAGC motifs, which are the ones that occur within this VF, once again showing the potential of using such SSRs to screen for possible changes in the genome as well as for the absence of some genes.
The major difference between the motifs found in VFs occurred in the genome of C. pseudotuberculosis PA02, where the observed motif within the SpaH gene was AGCC (Figure 3D). This fact can be explained by a polymorphism that may have occurred in this region (2080272–2080287 bases) of the genome of C. pseudotuberculosis PA02 (TTGG AGCC AGCC AGCC AGCC TT), where the change from cytosine to guanine (highlighted in red) changed the pattern of tandem nucleotides, as seen in the strains PA01, PA04, and PA07 (TTGG AGG CAGC CAGC CAGC CTT).
The C. pseudotuberculosis C231 strain presented the CAC motif at coordinates 56941–56952 bp, as expected for a genome belonging to the ovis biovar (Table 4). The same CAC motif can be observed in the lineage C. pseudotuberculosis MB154 at coordinates 65124–65135 bp, as expected for a strain of the equi biovar. Since the same motif can be located in different regions between biovars, these microsatellites showed potential as biomarkers capable of differentiating biovars.
Statistical analysis showed that the two groups of microsatellites belonging to equi and ovis biovars are similar, thus indicating that they are good candidates for markers for C. pseudotuberculosis. It was still possible to observe a feature difference in position 3 of SSR patterns between the two groups (Figure 6) and a difference between the equi and ovis biovars, thus indicating the possibility of using them as biovar markers as well.
As a zoonotic bacterial pathogen, C. pseudotuberculosis is widely spread bacteria that infect many kinds of animals; however, biovar differentiation remains to be a challenging task (Almeida et al., 2017). The groups of SSR patterns identified in this work could serve as an in silico alternative and could be employed as potential biovar-specific biomarkers for C. pseudotuberculosis. In addition, the correct diagnosis and identification of many other major bacterial pathogens also impose a great challenge to public health and veterinary practice worldwide. Therefore, the computational methodology applied to this issue here could also be applied to other bacterial pathogens in the future.
Conclusion
Different patterns of microsatellites, or simple short repeats (SSRs), were observed for different strain groups of Corynebacterium pseudotuberculosis, and SSRs unique to the strains and distinct from the other genomes were evaluated in this study. Patterns of SSRs associated with genes that encode virulence factors (VFs) were also identified, being all of the SSR motifs related to the same SpaH-like pili VF in all genomes. These VR-related SSRs can serve as indicators of the genome organization and identify polymorphisms among the strains evaluated here.
In addition, microsatellites are important evolutionary markers and can be isolated by NGS technology from the genome of a model and non-model species, allowing the tracking of SSR length variations, such as point mutations and duplications across the entire genome to identify similarities and differences among strains.
Finally, the results in this work demonstrated an unexplored potential for using these molecular markers not only for the identification of species and strains but also in the screening of specific biovars. Therefore, the study of SSRs has been proven crucial to the understanding of the genomic content, dynamics, and structure of bacterial pathogens, such as C. pseudotuberculosis.
Statements
Data availability statement
Publicly available datasets were analyzed in this study. These data can be found at: https://www.ncbi.nlm.nih.gov/refseq/.
Author contributions
KP, BG, and RR designed the study. KP, BG, WN, OC-A, and AJ compiled and curated the data and performed bioinformatics analysis. KP, BG, WN, and AJ interpreted the results. AdS and RR supervised and administered the project. KP, BG, and WN wrote the original draft and manuscript with input from FA, AQ, OC-A, AdS, AJ, and RR. All authors critically reviewed the manuscript and approved the final version.
Funding
The authors kindly thank the Coordenação de Aperfeiçoamento de Pessoal de Nível Superior – CAPES, the Brazilian National Council for Scientific and Technological Development – CNPq, and PROPESP/UFPA (Pró-Reitoria de Pesquisa e Pós-Graduação/Universidade Federal do Pará), and the funding agency FAPESPA (Fundação Amazônia de Amparo à Estudos e Pesquisas) for financial support on this work.
Conflict of interest
The authors declare that the research was conducted in the absence of any commercial or financial relationships that could be construed as a potential conflict of interest.
Publisher’s note
All claims expressed in this article are solely those of the authors and do not necessarily represent those of their affiliated organizations, or those of the publisher, the editors, and the reviewers. Any product that may be evaluated in this article, or claim that may be made by its manufacturer, is not guaranteed or endorsed by the publisher.
Supplementary material
The Supplementary Material for this article can be found online at: https://www.frontiersin.org/articles/10.3389/fbinf.2022.931583/full#supplementary-material
Abbreviations
ML, maximum likelihood; NCBI, National Center for Biotechnology Information; NGS, next-generation sequencing; NJ, neighbour-joining; SSRs, simple short repeats or microsatellites; VFs, virulence factors.
References
1
Agarwala R. Barrett T. Beck J. Benson D. A. Bollin C. Bolton E. et al (2018). Database resources of the national center for Biotechnology information. Nucleic Acids Res.46, D8–D13. 10.1093/nar/gkx1095
2
Airello P. M. A. Mays A. Oliveira S. (2001). Manual merck de Veterinária. 8th ed.São Paulo: Editora Roca.
3
Almeida S. Dorneles E. M. S. Diniz C. Abreu V. Sousa C. Alves J. et al (2017). Quadruplex PCR assay for identification of Corynebacterium pseudotuberculosis differentiating biovar Ovis and Equi. BMC Vet. Res.13, 290. 10.1186/s12917-017-1210-5
4
Araújo C. L. Alves J. Nogueira W. Pereira L. C. Gomide A. C. Ramos R. et al (2019). Prediction of new vaccine targets in the core genome of Corynebacterium pseudotuberculosis through omics approaches and reverse vaccinology. Gene702, 36–45. 10.1016/j.gene.2019.03.049
5
Baraúna R. A. Ramos R. T. J. Veras A. A. O. Pinheiro K. C. Benevides L. J. Viana M. V. C. et al (2017). Assessing the genotypic differences between strains of Corynebacterium pseudotuberculosis biovar equi through comparative genomics. PLoS One12, e0170676. 10.1371/journal.pone.0170676
6
Carver T. Harris S. R. Berriman M. Parkhill J. McQuillan J. A. (2012). Artemis: An integrated platform for visualization and analysis of high-throughput sequence-based experimental data. Bioinformatics28, 464–469. 10.1093/bioinformatics/btr703
7
Chen M. Zeng G. Tan Z. Jiang M. Zhang J. Zhang C. et al (2011). Compound microsatellites in complete Escherichia coli genomes. FEBS Lett.585, 1072–1076. 10.1016/j.febslet.2011.03.005
8
Edgar R. C. (2004). MUSCLE: Multiple sequence alignment with high accuracy and high throughput. Nucleic Acids Res.32, 1792–1797. 10.1093/nar/gkh340
9
Gomide A. C. P. de Sá P. G. Cavalcante A. L. Q. de Jesus Sousa T. Gomes L. G. R. Ramos R. T. J. et al (2018). Heat shock stress: Profile of differential expression in Corynebacterium pseudotuberculosis biovar Equi. Gene645, 124–130. 10.1016/j.gene.2017.12.015
10
Gomide A. C. P. Ibraim I. C. Alves J. T. C. de Sá P. G. de Oliveira Silva Y. R. Santana M. P. et al (2018). Transcriptome analysis of Corynebacterium pseudotuberculosis biovar Equi in two conditions of the environmental stress. Gene677, 349–360. 10.1016/j.gene.2018.08.028
11
Han B. Wang C. Tang Z. Ren Y. Li Y. Zhang D. et al (2015). Genome-wide analysis of microsatellite markers based on sequenced database in Chinese spring wheat (Triticum aestivum L.). PLoS One10, e0141540. 10.1371/journal.pone.0141540
12
Jarne P. Lagoda P. J. L. (1996). Microsatellites, from molecules to populations and back. Trends Ecol. Evol.11, 424–429. 10.1016/0169-5347(96)10049-5
13
Koonin E. V. Wolf Y. I. (2008). Genomics of bacteria and archaea: The emerging dynamic view of the prokaryotic world. Nucleic Acids Res.36, 6688–6719. 10.1093/nar/gkn668
14
Kumar S. Stecher G. Li M. Knyaz C. Tamura K. Mega X. (2018). MEGA X: Molecular evolutionary genetics analysis across computing platforms. Mol. Biol. Evol.35, 1547–1549. 10.1093/molbev/msy096
15
Lanfear R. Frandsen P. B. Wright A. M. Senfeld T. Calcott B. (2017). Partitionfinder 2: New methods for selecting partitioned models of evolution for molecular and morphological phylogenetic analyses. Mol. Biol. Evol.34, 772–773. 10.1093/molbev/msw260
16
Liu B. Zheng D. Jin Q. Chen L. Yang J. (2019). Vfdb 2019: A comparative pathogenomic platform with an interactive web interface. Nucleic Acids Res.47, D687–D692. 10.1093/nar/gky1080
17
Mandlik A. Swierczynski A. Das A. Ton-That H. (2007). Corynebacterium diphtheriae employs specific minor pilins to target human pharyngeal epithelial cells. Mol. Microbiol.64, 111–124. 10.1111/j.1365-2958.2007.05630.x
18
Metzgar D. Thomas E. Davis C. Field D. Wills C. (2001). The microsatellites of Escherichia coli: Rapidly evolving repetitive DNAs in a non-pathogenic prokaryote. Mol. Microbiol.39, 183–190. 10.1046/j.1365-2958.2001.02245.x
19
Mishra G. P. Ghosh A. Jha A. Raghav S. K. (2020). BedSect: An integrated web server application to perform intersection, visualization, and functional annotation of genomic regions from multiple datasets. Front. Genet.11, 3. 10.3389/fgene.2020.00003
20
Mrázek J. Guo X. Shah A. (2007). Simple sequence repeats in prokaryotic genomes. Proc. Natl. Acad. Sci. U. S. A.104, 8472–8477. 10.1073/pnas.0702412104
21
Mudunuri S. B. Nagarajaram H. A. (2007). IMEx: Imperfect microsatellite extractor. Bioinformatics23, 1181–1187. 10.1093/bioinformatics/btm097
22
Müller J. Müller K. F. Neinhuis C. Quandt D. (2006). PhyDE - phylogenetic data editor, Www.Phyde.De.
23
Oliveira E. J. Pádua J. G. Zucchi M. I. Vencovsky R. Vieira M. L. C. (2006). Origin, evolution and genome distribution of microsatellites. Genet. Mol. Biol.29, 294–307. 10.1590/S1415-47572006000200018
24
Paglia G. Morgante M. (1998). PCR-based multiplex DNA fingerprinting techniques for the analysis of conifer genomes. Mol. Breed.4, 173–177. 10.1023/A:1009637608702
25
Radostits O. M. Gay C. C. Blood D. C. Hinchcliff K. W. (2002). Clínica veterinária: Um tratado de doenças dos bovinos, ovinos, suínos, caprinos e eqüinos.
26
R.D.C.T. 3.5.1 (2018). A language and environment for statistical computing. R. Found. Stat. Comput.2. Available at: https://www.R-project.org.
27
RStudio Team (2020). RStudio | Open source & professional software for data science teams - RStudio. Boston, MA, USA: RStudio Inc.Available at: https://www.rstudio.com/(Accessed August 13, 2022).
28
Saeed A. F. Wang R. Wang S. (2016). Microsatellites in pursuit of microbial genome evolution. Front. Microbiol.6, 1462. 10.3389/fmicb.2015.01462
29
Schneider T. D. (1991). Theory of molecular machines. II. Energy dissipation from molecular machines. J. Theor. Biol.148, 125–137. 10.1016/S0022-5193(05)80467-9
30
Shannon C. E. (1948). A mathematical theory of communication. Bell Syst. Tech. J.27, 379–423. 10.1002/j.1538-7305.1948.tb01338.x
31
Soares S. C. Silva A. Trost E. Blom J. Ramos R. Carneiro A. et al (2013). The pan-genome of the animal pathogen Corynebacterium pseudotuberculosis reveals differences in genome plasticity between the biovar ovis and equi strains. PLoS One8, e53818. 10.1371/journal.pone.0053818
32
Stamatakis A. (2014). RAxML version 8: A tool for phylogenetic analysis and post-analysis of large phylogenies. Bioinformatics30, 1312–1313. 10.1093/bioinformatics/btu033
33
Tremblay B. J. (2022). universalmotif: Import, modify, and export motifs with R., R packag. Version 1.14.1.
34
Vaidya G. Lohman D. J. Meier R. (2011). SequenceMatrix: Concatenation software for the fast assembly of multi-gene datasets with character set and codon information. Cladistics27, 171–180. 10.1111/j.1096-0031.2010.00329.x
35
Vieira M. L. C. Santini L. Diniz A. L. Munhoz C. de F. (2016). Microsatellite markers: What they mean and why they are so useful. Genet. Mol. Biol.39, 312–328. 10.1590/1678-4685-GMB-2016-0027
36
Xu S. Y. Gupta Y. K. (2013). Natural zinc ribbon HNH endonucleases and engineered zinc finger nicking endonuclease. Nucleic Acids Res.41, 378–390. 10.1093/nar/gks1043
Summary
Keywords
Corynebacterium pseudotuberculosis , caseous lymphadenitis, biomarkers, microsatellites, virulence factors (VFs), simple sequence repeats (SSRs)
Citation
Pinheiro KdC, Gois BVA, Nogueira WG, Araújo FA, Queiroz ALC, Cardenas-Alegria O, da Silva ALdC, Júnior AMGM and Ramos RTJ (2022) In silico approach to identify microsatellite candidate biomarkers to differentiate the biovar of Corynebacterium pseudotuberculosis genomes. Front. Bioinform. 2:931583. doi: 10.3389/fbinf.2022.931583
Received
29 April 2022
Accepted
24 August 2022
Published
16 September 2022
Volume
2 - 2022
Edited by
Gabriele Orlando, KU Leuven, Belgium
Reviewed by
Akanksha Rajput, University of California, San Diego, United States
Sajjad Ahmad, Abasyn University, Pakistan
Hassan S. S, University of Karachi, Pakistan
Updates
Copyright
© 2022 Pinheiro, Gois, Nogueira, Araújo, Queiroz, Cardenas-Alegria, da Silva, Júnior and Ramos.
This is an open-access article distributed under the terms of the Creative Commons Attribution License (CC BY). The use, distribution or reproduction in other forums is permitted, provided the original author(s) and the copyright owner(s) are credited and that the original publication in this journal is cited, in accordance with accepted academic practice. No use, distribution or reproduction is permitted which does not comply with these terms.
*Correspondence: Rommel Thiago Jucá Ramos, rommelthiago@gmail.com
This article was submitted to Genomic Analysis, a section of the journal Frontiers in Bioinformatics
Disclaimer
All claims expressed in this article are solely those of the authors and do not necessarily represent those of their affiliated organizations, or those of the publisher, the editors and the reviewers. Any product that may be evaluated in this article or claim that may be made by its manufacturer is not guaranteed or endorsed by the publisher.