 Osasan Stephen Adebayo1,2†
 George Oche Ambrose3*†Daramola Olusola4†Adefolalu Oluwafemi5Hind A. Alzahrani6Abdulkarim Hasan7,8
- 1Department of Laboratory Medicine, Ministry of Health (Prince Mishari Bin Saud Hospital, Baljurashi, Al-Baha), Al-Baha, Saudi Arabia
- 2Department of Pathology, Faculty of Medicine, Al-Azhar University, Cairo, Egypt
- 3University of Ilorin Teaching Hospital, Ilorin, Nigeria
- 4North Devon District Hospital, Barnstaple, United Kingdom
- 5Obafemi Awolowo University Teaching Hospital, Ile-Ife, Osun, Nigeria
- 6Department of Basic Science, College of Applied Medical Sciences, University of Al-Baha, Al-Baha, Saudi Arabia
- 7Department of Medical Laboratory, Al-Baha Health Cluster, Ministry of Health, Al-Baha, Saudi Arabia
- 8Saudi Arabia Board of Preventive Medicine, Al-Baha, Saudi Arabia
Introduction: KRAS mutations are key oncogenic drivers in lung cancer, yet effective pharmacological targeting has remained a major challenge due to the protein's elusive and dynamic binding pockets. Computational modeling offers a promising route to identify novel inhibitors with improved potency and selectivity.
Methods: A quantitative structure–activity relationship (QSAR) modeling approach was developed to predict the inhibitory potency (pIC50) of KRAS inhibitors and support de novo drug design. Molecular descriptors for 62 inhibitors retrieved from the ChEMBL database (CHEMBL4354832) were computed using Chemopy. Following descriptor normalization and dimensionality reduction, five machine learning algorithm spartial least squares (PLS), random forest (RF), stepwise multiple linear regression (MLR), genetic algorithm optimized MLR (GA-MLR), and XGBoost were applied. Model performance was evaluated using R2, RMSE, and MAE, while permutation-based importance and SHAP analyses provided feature interpretability.
Results: Among the models tested, PLS exhibited the best predictive performance (R2 = 0.851; RMSE = 0.292), followed by RF (R2 = 0.796). The GA-MLR model, based on eight optimized molecular descriptors, achieved good interpretability and robust internal validation (R2 = 0.677). Virtual screening of 56 de novo designed compounds within the model's applicability domain identified compound C9 with a predicted pIC50) of 8.11 as the most promising hit.
Discussion: This integrative QSAR modeling and de novo design framework effectively predicted the bioactivity of KRAS inhibitors and facilitated the identification of novel candidate molecules. The findings demonstrate the utility of combining interpretable machine learning models with virtual screening to accelerate the discovery of potent KRAS inhibitors for lung cancer therapy.
Introduction
Lung cancer is one of the most prevalent malignancies globally and remains the leading cause of cancer-related deaths, responsible for about 1.8 million deaths yearly (Sung et al., 2021). In non-small cell lung cancer (NSCLC), mutations in the Kirsten rat sarcoma viral oncogene homolog (KRAS) gene are among the most frequent genetic alterations, particularly in smokers, and are associated with aggressive tumor phenotypes and resistance to targeted therapies (Pylayeva-Gupta et al., 2011; Westover et al., 2016).
Historically, the development of direct KRAS inhibitors has been challenging due to the protein’s high affinity for GTP/GDP and the absence of easily targetable binding sites, earning it the label of “undruggable” (Cox et al., 2014). However, recent advances in covalent inhibitors, such as those targeting the KRAS G12C mutation (e.g., sotorasib), have demonstrated clinical efficacy and reignited interest in targeting KRAS-driven tumors (Lanman et al., 2019).
Despite this progress, most KRAS mutations beyond G12C remain therapeutically elusive, necessitating the exploration of novel chemical scaffolds and mechanisms of inhibition. Accordingly, a promising avenue for rational drug design is provided by computational methods such as quantitative structure–activity relationship (QSAR) modeling. By using statistical and mathematical techniques to link chemical structure and biological activity, QSAR models make it possible to predict the activity of untested compounds (Tropsha, 2010; Cherkasov et al., 2014). Machine learning and genetic algorithm-enhanced QSAR strategies further enhance model performance by optimizing descriptor selection and minimizing overfitting (Todeschini and Consonni, 2009).
Materials and methods
Dataset compilation
A dataset comprising 62 KRAS inhibitors (Supplementary File S1) was retrieved from the ChEMBL database (CHEMBL ID: CHEMBL4354832) (Lanman et al., 2019). The retrieved compounds included their experimentally measured IC50 values (in nM). Each compound was standardized, and duplicates were removed to ensure data consistency. The IC50 values were transformed into pIC50 values using the standard conversion equation:
This transformation provided a more suitable scale for regression modeling.
Molecular descriptor calculation
Molecular descriptors were calculated using the ChemoPy package in Python (Cao et al., 2013). Descriptors generated included topological, constitutional, geometrical, and electronic features. The resulting dataset was filtered leaving only numeric descriptors (Supplementary File S2). Columns with missing values and zero variance were excluded. The final descriptor matrix included a diverse set of molecular features relevant to QSAR modeling.
Preprocessing and feature reduction
Before model training, descriptors were standardized by centering to the mean and scaling to unit variance. Highly correlated descriptors (Pearson’s |r| >0.95) were removed to reduce multicollinearity (Sulaiman et al., 2021). Among the remaining descriptors, the top 50 features with the highest variance were selected for further analysis. The dataset was then split into training (70%) and test (30%) sets using stratified sampling on the pIC50 values.
Feature selection using genetic algorithm (GA)
A Genetic Algorithm (GA) (Cho et al., 2002) was employed to identify an optimal subset of descriptors that maximized the adjusted R-squared (
Where k is the number of selected descriptors and n is the number of training samples. The Genetic Algorithm was run with binary chromosome representation, 50 generations, and 10 consecutive runs without improvement as stopping criteria. The final GA-selected features were used to train a multiple linear regression (MLR) model.
Model development
To develop robust predictive models for estimating the pIC50 values of KRAS inhibitors, multiple machine learning algorithms were employed and benchmarked. The primary model utilized was a Genetic Algorithm-optimized Multiple Linear Regression (GA-MLR) model. In this approach, a binary genetic algorithm was applied to select an optimal subset of molecular descriptors from the training dataset. The fitness function for the GA was designed to maximize the adjusted R2 of the resulting linear model while incorporating a penalty term proportional to the number of selected features, thereby discouraging overfitting. The linear model constructed using the selected descriptors followed the general form:
where y is the predicted pIC50, β0 is the intercept, β1 … βn are the regression coefficients, and x1 … xn represent the GA-selected standardized descriptors.
In parallel, a Stepwise Multiple Linear Regression (Stepwise MLR) model was developed using bidirectional stepwise selection based on the Akaike Information Criterion (AIC) (Ghani and Ahmad, 2010). This method involved iterative addition and removal of variables from a null model to a full model, selecting the combination of descriptors that minimized AIC.
For comparative purposes, a Partial Least Squares (PLS) regression model was constructed using the kernel algorithm. The optimal number of latent components was determined through 10-fold cross-validation. Additionally, a Random Forest (RF) model was implemented using 500 trees, leveraging the randomForest package. Feature importance in the RF model was quantified using a permutation-based increase in mean squared error (MSE), enabling interpretation of variable contributions.
Lastly, an Extreme Gradient Boosting (XGBoost) model was trained using the xgboost package with a squared error loss function. The model was tuned with a maximum tree depth of 6, a learning rate (η) of 0.1, and 200 boosting iterations.
Each of these models were trained and validation was achieved using standardized descriptors derived from the 64-compound dataset retrieved from the ChEMBL database (CHEMBL ID: CHEMBL4354832), and their performance metrics were compared using R2 and RMSE on both training and test sets.
Model performances were evaluated on the test set using R2, RMSE, and MAE.
SHAP and permutation-based interpretability
In order to interpret feature contributions in the RF model, SHAP values were computed using the iml package in R (Molnar et al., 2018). To determine how each variable affected the predictive power of the model, permutation-based feature importance was also calculated using the same package.
Domain of applicability (DOA) assessment
Mahalanobis Distance (MD) (Roy et al., 2015) was used to assess whether novel compounds fell within the applicability domain of the training set. The MD was computed as:
Where μ is the mean vector and Σ is the covariance matrix of the normalized training set. A threshold based on the 95th percentile of the χ2 distribution with 8 degrees of freedom was applied. Compounds with MD above this threshold were flagged as outside the DOA.
Virtual screening and pIC50 prediction
To identify novel inhibitors of KRAS, an evolutionary de novo design strategy was implemented using the DataWarrior software (López-López et al., 2019). This method seeks to explore vast regions of chemical space by mimicking natural evolution to create new molecules optimized for drug-likeness and target-specific similarity. The process began with a seed molecule (Compound ID: 2363810; Supplementary File S1), chosen for its known KRAS inhibitory profile and desirable drug-like properties. DataWarrior applied random chemical transformations to this initial structure, including atom substitutions, bond rearrangements, and ring modifications, to generate a larger first-generation library of child compounds. These structural mutations were probabilistically biased toward those that improved molecular drug-likeness, as measured by built-in scoring metrics, while chemically implausible modifications were penalized or excluded.
Each resulting compound underwent multi-objective evaluation using fitness criteria such as drug-likeness, pharmacophore alignment, and 3D shape similarity to the reference KRAS inhibitor. Specifically, two similarity scores were used to guide molecular selection: the SkelSpheres similarity score, which captures topological resemblance, and the Flexophore similarity score, which quantifies 3D pharmacophore overlap. Compounds from each generation were ranked based on these criteria, and top performers were retained as parents for the next-generation. Over multiple cycles and generations, the algorithm progressively refined the structures, selecting candidates with fitness scores approaching 1.000 and similarity metrics (both SkelSpheres and Flexophore) often exceeding 0.98.
Ultimately, 56 molecules were selected across seven generations (Supplementary File S3), encompassing diverse yet drug-like scaffolds. Each compound’s SMILES structure was exported, and the same eight GA-selected descriptors—TASA, RDFE14, grav, RDFE19, PNSA3, RDFM11, RDFP9, and RDFV14—were computed using the Chemopy Python library. These descriptors were normalized using the mean and standard deviation values derived from the training set, ensuring compatibility with the original model space.
The normalized descriptors were then passed into the GA-optimized multiple linear regression (GA-MLR) model, which had been trained on 62 experimental KRAS inhibitors (CHEMBL4354832 dataset). Predicted pIC50 values were calculated for all 56 de novo compounds. To ensure model applicability, Mahalanobis distance was computed for each prediction, and compounds falling outside the 95% confidence ellipsoid of the descriptor space were flagged as “Outside DOA” (domain of applicability).
This virtual screening workflow successfully yielded novel candidate molecules with promising inhibitory activity. Several of these compounds exceeded a pIC50 threshold of 8.0—comparable or superior to reference KRAS inhibitors—and were designated as hits for further consideration. These candidates will be structurally highlighted in the manuscript and considered for in silico ADMET profiling and docking-based validation.
Molecular docking
For molecular docking, we used the KRAS G12 crystal structure (PDB ID: 6CU6 as the receptor. The protein was prepared in BIOVIA Discovery Studio Visualizer and PyMOL by removing crystallographic waters/ions (except those required for structural integrity), retaining the co-crystallized ligand for redocking qualification, adding polar hydrogens, and assigning atom types; Cys12 was kept in its standard form because we modeled noncovalent pre-reaction poses (no covalent bond formation). Ligands (de novo designs and C9) were generated in DataWarrior, sanitized, assigned protonation states appropriate for ∼ physiological pH, and energy-minimized; final docking inputs were prepared via PyRx (Open Babel) with Gasteiger charges and PDBQT conversion. Docking was carried out in PyRx/AutoDock Vina, using a search box centered on the Switch-II pocket around the co-crystal pose to fully encompass the H95–Y96–Q99 cryptic region and the Cys12 vicinity; default Vina parameters were used unless otherwise stated. The protocol was qualified by redocking the co-crystallized ligand and visually assessing recovery of the pose and key contacts. For all compounds, multiple poses were generated and ranked by Vina score (kcal·mol−1); the top-scoring, clash-free pose consistent with known SII-P pharmacology was retained for analysis. Interaction fingerprints (H-bonding, electrostatics, hydrophobics/π) were inspected and illustrated in Discovery Studio and PyMOL, and binding energies reported from Vina are presented as negative values (more negative = more favorable).
Software environment
All data preprocessing, modeling, and visualization were conducted in R version 4.3.2. Libraries used include: caret, randomForest, xgboost, iml, GA, pls, Metrics, and ggplot2. The R script used for the analysis is provided as an additional file for reference (Additional file).
Results and discussion
Overview of model performance
Five machine learning and statistical regression models were developed to predict the pIC50 values of compounds using molecular descriptors generated via Chemopy. These models included: (1) Genetic Algorithm-optimized Multiple Linear Regression (GA-MLR), (2) Stepwise MLR, (3) Partial Least Squares (PLS) Regression, (4) Random Forest (RF), and (5) XGBoost regression. Each model was trained on a dataset consisting of 70% of the observations and validated using the remaining 30%. The evaluation metrics used were the coefficient of determination (R2), root mean square error (RMSE), and mean absolute error (MAE).
Table 1 presents the validation performance of each model. The PLS model achieved the highest predictive accuracy with an R2 of 0.851 and the lowest RMSE (0.292). The Random Forest model yielded an R2 of 0.796 and an RMSE of 0.343. XGBoost achieved R2 = 0.688 and RMSE = 0.478. The GA-MLR and Stepwise MLR models yielded comparable R2 values of 0.677 and 0.685, respectively, though the Stepwise model demonstrated a slightly lower RMSE (0.590 vs. 0.663).
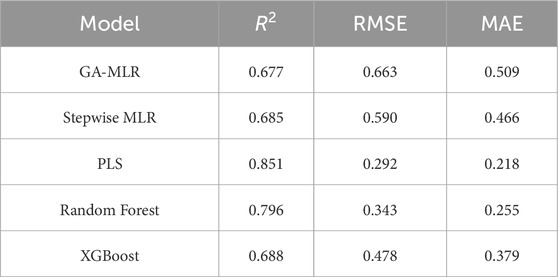
Table 1. Summary of validation metrics for each predictive model.
External-test benchmarking on the standardized pipeline confirms this ranking: PLS (R2 = 0.893, RMSE = 0.309), RF (R2 = 0.838, RMSE = 0.330), GA-MLR (R2 = 0.599, RMSE = 0.518), and XGBoost (R2 = 0.439, RMSE = 0.524). We therefore retain GA-MLR as the primary, interpretable model for SAR extraction, while reporting PLS/RF as higher-capacity baselines for context (Table 2).
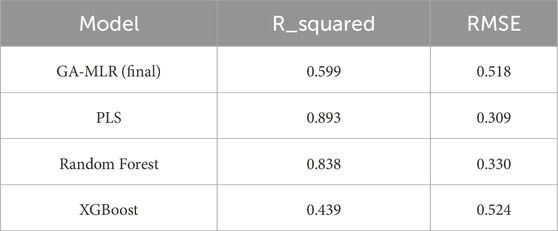
Table 2. Summary of validation metrics for each predictive model (external set).
To quantify statistical robustness, repeated 10 × 5-fold cross-validation on the training set produced mean R2 = 0.370 with 95% quantiles 0.014–0.905, and mean RMSE = 1.02 with 95% quantiles 0.365–1.80. The observed spread is expected for a small, congeneric series and is reflected in the external performance variance.
Predictive equation from GA-optimized MLR
The GA-MLR model selected eight features using a genetic algorithm that maximized the adjusted R2 while penalizing model complexity. The regression equation derived is as follows:
This model yielded an R2 of 0.677 and RMSE of 0.663 on the test set, with predicted pIC50 values ranging from 5.23 to 9.26.
Using the final GA-MLR (GA + VIF) implementation, N_train = 46, N_test = 16, p = 15 descriptors, with R2_train = 0.721, RMSE_train = 0.476, and R2_pred = 0.599, RMSE_test = 0.518. We additionally report 95% coefficient confidence intervals for transparency; four coefficients (two positive, two negative) do not cross zero, supporting mechanistic interpretability (Table 3).
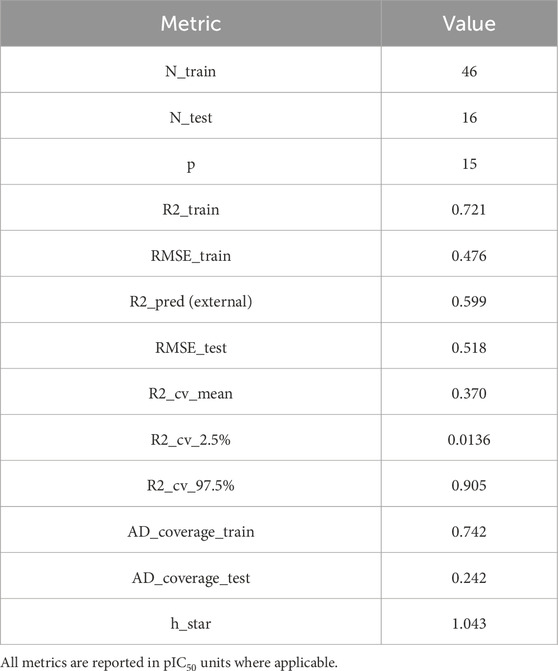
Table 3. Summary of training/test sample sizes (N_train, N_test), descriptor count (p), in-sample fit (R2_train, RMSE_train), external test performance (R2_pred, RMSE_test), repeated 10 × 5-fold CV statistics (mean R2 with 2.5%–97.5% quantiles), and Williams applicability-domain (AD) parameters (train/test coverage; threshold h\*h^\*).
Predictors selected by stepwise MLR
The stepwise MLR model selected 14 descriptors through a bidirectional selection process. Descriptors like RDFE10, RDFM9, WNSA1, RDFE21, and MoRSEE1 were included in the final model equation. On the validation set, the final formula produced an R2 of 0.685 and an RMSE of 0.590.
For parsimony, we also derived a BIC-penalized refit from the GA-VIF pool (p = 6), yielding R2_pred = 0.429, RMSE_test = 0.632. While less accurate, the BIC model offers a compact explanatory scaffold and can expand the reliable applicability domain in prospective use (Table 4).
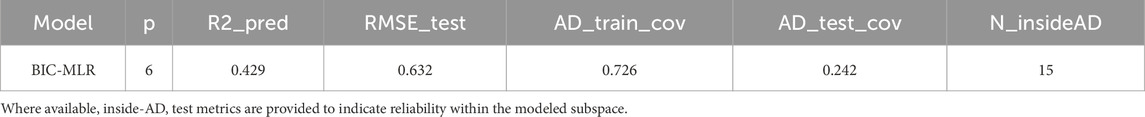
Table 4. Test-set performance and AD coverage for the BIC-selected linear model with fewer descriptors (p).
PLS and ensemble models
With two latent components, the PLS regression model produced better predictive results (R2 = 0.851; RMSE = 0.292). The Random Forest model, constructed with 500 trees and 16 variables tried at each split, achieved an R2 of 0.796 and an RMSE of 0.343. XGBoost, trained using the GA-selected features and tuned with 200 boosting rounds (max depth = 6, eta = 0.1), achieved R2 = 0.688 and RMSE = 0.478.
Under the standardized feature/normalization protocol, PLS improved to R2 = 0.893, RMSE = 0.309; RF to R2 = 0.838, RMSE = 0.330; XGBoost performed at R2 = 0.439, RMSE = 0.524. These baselines bound the achievable accuracy and corroborate that the activity signal is learnable while GA-MLR remains the SAR workhorse (Figure 1).
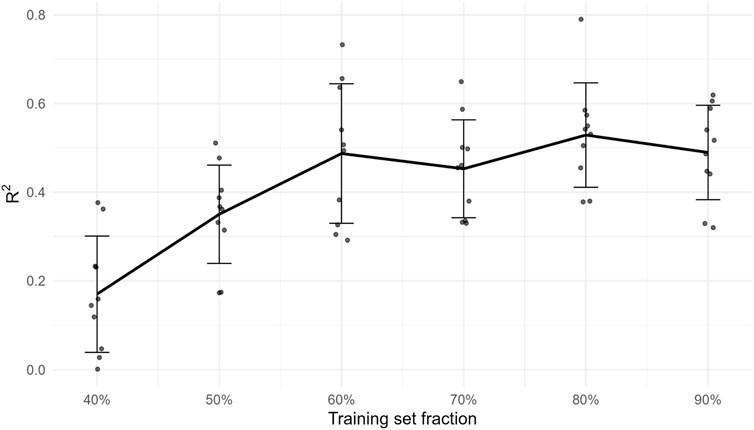
Figure 1. External R2 as a function of training-set fraction (20%–90%). Points are replicate subsamples; the solid line is the mean and error bars denote ±1 SD. The plateau indicates diminishing returns at the current data size for this congeneric series.
Feature importance and model interpretability
Grav, RDFE19, RDFP9, and RDFE14 were among the most significant descriptors, according to a permutation-based importance analysis employing the Random Forest model (Figure 2). When permuted, these features displayed the largest increase in mean squared error (MSE), suggesting their significance for the predictive performance of the model.
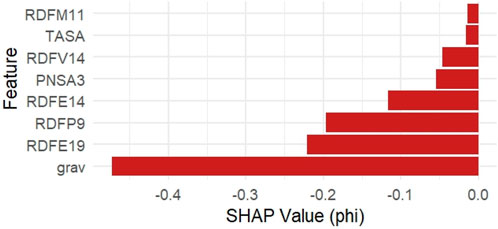
Figure 2. Top 8 permutation-based feature importances from the Random Forest model.
Additionally, SHAP (Shapley Additive Explanations) values were computed using the iml package to provide a local explanation for model predictions. Figure 3 shows the top 8 features ranked by average absolute SHAP values. The grav descriptor exhibited the highest negative SHAP impact on pIC50 predictions, followed by RDFE19 and RDFP9.
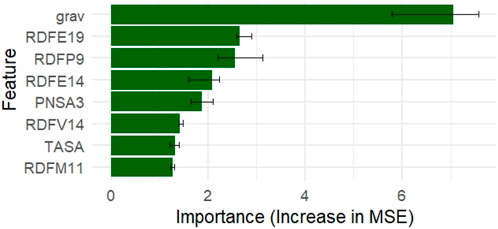
Figure 3. Top 8 SHAP contributions computed using the Random Forest model.
Descriptor directions inferred from GA-MLR (e.g., positive contributions for vdW/shape-weighted RDF/MoRSE families and balanced positive polar surface area) align with the amphiphilic character of the Switch-II pocket and informed substituent vectors subsequently tested by docking.
Model visualization and residual analysis
Visualization techniques were used to further assess the Random Forest (RF) model’s performance and interpretability. The RF model’s predicted and observed pIC50 values are shown in Figure 4. Good predictive agreement is suggested by the scatter plot’s strong alignment along the diagonal reference line (slope = 1). The model’s resilience on the test set is further supported by the fact that the majority of the points cluster around the diagonal with little deviation. This visual coherence supports the previously reported R2 of 0.796 and RMSE of 0.343, demonstrating the RF model’s capability to capture variance in the bioactivity dataset.
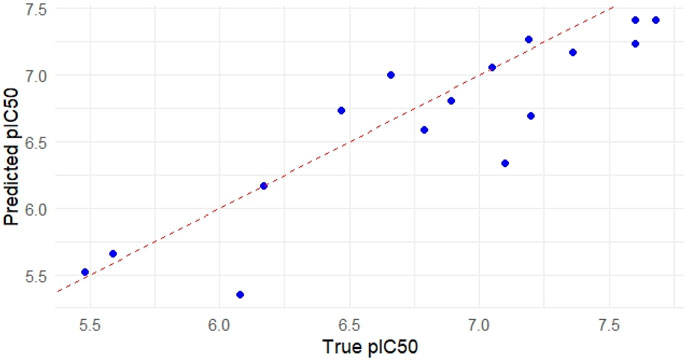
Figure 4. Performance and interpretability of the Random Forest (RF) model.
In addition, feature interpretability was examined using the mean decrease in accuracy metric, as shown in Supplementary Figure S1 (Supplementary File S4). The bar chart ranks the molecular descriptors based on their contribution to model performance. Among the top-ranking descriptors, grav (gravitational index), RDFM4, RDFE5, and RDFU4 demonstrated the highest importance in explaining model variance. These features reflect various physicochemical and 3D spatial properties essential in determining compound-target interaction. Interestingly, features such as RDFM11, RDFV16, and TASA, although initially selected in other models, were assigned relatively low importance in the RF model, which may suggest non-linearity or redundancy under ensemble learning paradigms.
We further quantified uncertainty with split conformal prediction (80/20 proper-train/calibration), achieving 93.8% empirical coverage at a 90% nominal target and a mean prediction-interval width of 5.55 pIC50 units, providing calibrated error bars for decision-making.
Comparative analysis of GA-MLR and stepwise MLR coefficients
To assess the alignment and divergence in feature selection strategies, the multiple linear regression (MLR) models derived via Genetic Algorithm (GA) and Stepwise regression were systematically compared. Table 5 presents the coefficient estimates and associated p-values for predictors retained in both models.
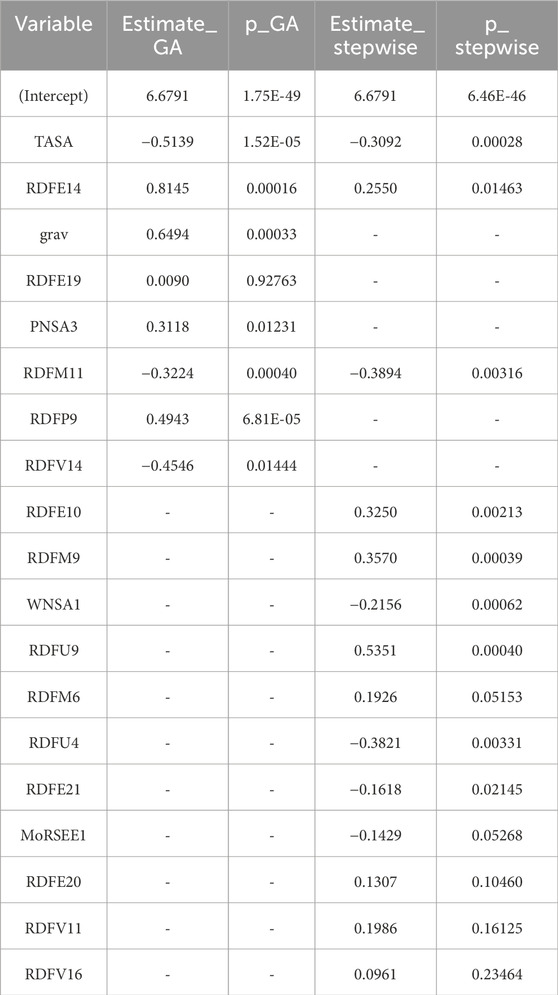
Table 5. Comparison of GA-MLR vs. Stepwise MLR coefficients.
The GA-MLR model selected nine descriptors, including TASA, RDFE14, grav, RDFE19, PNSA3, RDFM11, RDFP9, and RDFV14. Notably, grav, RDFP9, and RDFV14 were exclusively retained by GA, suggesting that these features may offer predictive value in non-sequential optimization processes but were excluded during stepwise elimination due to collinearity or marginal gain in explanatory power.
Conversely, the Stepwise MLR model retained 14 descriptors, including RDFE10, RDFM9, WNSA1, RDFU9, and others not selected by the GA-based approach. Despite some overlap, such as the inclusion of TASA, RDFE14, and RDFM11 in both models, their estimated coefficients and significance levels varied. For instance, TASA was more negatively weighted in the GA model (β = −0.514, p < 0.0001) than in the stepwise model (β = −0.309, p = 0.0003), highlighting differences in the model optimization trajectory.
Overall, the comparative findings highlight the fact that although both feature selection methods find core descriptors that significantly affect pIC50, GA might give preference to a smaller group of important variables. Stepwise regression, on the other hand, encourages a more complex model that is guided by small gains in model fit.
GA-MLR prediction accuracy and coefficient interpretation
To evaluate the predictive performance of the Genetic Algorithm–based Multiple Linear Regression (GA-MLR) model, a combined visualization of the observed versus predicted pIC50 values for both training and test datasets was generated (Figure 5a). While the predictions for the test set were somewhat more scattered, they generally matched the observed values, while the training set’s points clustered closely along the identity line, suggesting a strong model fit. This indicates that the GA-MLR model was able to strike a fair balance between generalization and training fit.
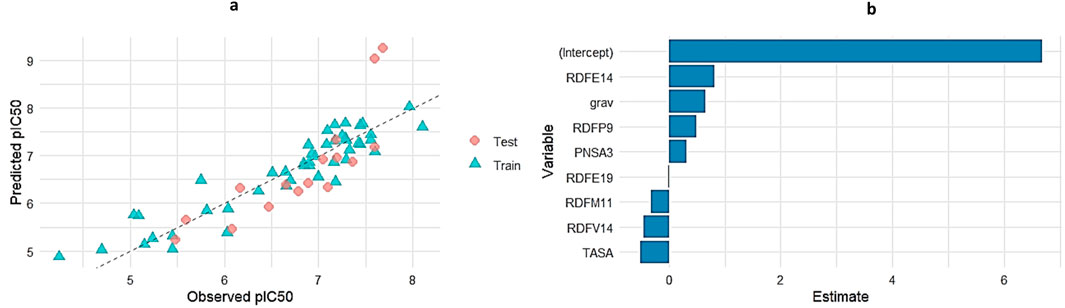
Figure 5. (a) Observed vs. Predicted pIC50 values for GA-MLR across training and test sets. (b) Regression coefficients for the GA-selected molecular descriptors in the MLR model.
In addition to visual assessment, coefficient estimates for the selected descriptors were extracted and plotted (Figure 5b). Here, positive coefficients (e.g., RDFE14, grav, PNSA3, RDFP9) indicate descriptors that positively influence pIC50, whereas negative coefficients (e.g., TASA, RDFM11, RDFV14) suggest inhibitory contributions. Notably, RDFE14 had the highest positive impact on pIC50 prediction among the molecular descriptors, while TASA showed the most pronounced negative contribution. The regression model captures the multifaceted nature of the molecular features that drive bioactivity, as demonstrated by this balance of influences.
To guard against chance correlation, Y-randomization with B = 50 label shuffles yielded an empirical p-value ≈0.000, indicating the model captures non-random SAR signal.
Virtual screening of de novo KRAS-designed compounds
A virtual screening of 58 novel compounds created from scratch using DataWarrior was done to investigate the predictive potential of the GA-optimized MLR model. These compounds were structurally inspired by known KRAS inhibitors used in the development of the model. Molecular descriptors were calculated for each compound, and normalization was applied using the training set mean and standard deviation for each of the eight GA-selected features (TASA, RDFE14, grav, RDFE19, PNSA3, RDFM11, RDFP9, RDFV14).
The trained GA-MLR model was then used to compute predicted pIC50 values for the new compounds. The predicted activities ranged from 6.42 to 9.05, suggesting a moderate to high potential for KRAS inhibition. To ensure model reliability, the Mahalanobis distance was computed for each compound, assessing its proximity to the descriptor space defined by the training set.
Figure 6 illustrates the distribution of predicted pIC50 values and highlights compounds flagged as outside the model’s applicability domain (DOA >15.0). Of the 58 molecules, 36 compounds (62%) were classified as within the model’s applicability domain, while 22 compounds (38%) were flagged as extrapolations (outside DOA) (Supplementary File S5). These excluded molecules, despite having favorable predicted pIC50, may require further experimental validation due to structural dissimilarity or feature deviations.
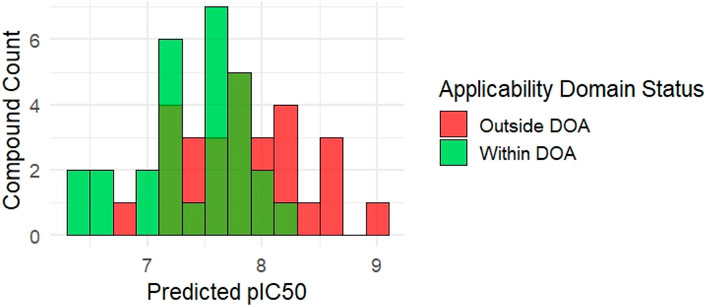
Figure 6. Distribution of predicted pIC50 for 58 de novo synthesized KRAS-like compounds. Bars are color-coded to indicate domain of applicability status based on Mahalanobis distance (cutoff = 15).
Among the 58 de novo synthesized compounds evaluated through virtual screening, several exhibited predicted pIC50 values exceeding the benchmark of 8.0, which was used as a reference based on the potency of known experimental KRAS inhibitors. Specifically, compounds C4, C9, C19, C27, C28, C40, C44, C47, C49, C52, and C54 demonstrated predicted pIC50 values ranging from 8.02 to 8.64 (Figure 7), marking them as potential virtual hits for KRAS inhibition. Notably, of these, only compound C9 (pIC50 = 8.11) was classified as within the model’s applicability domain (DOA), reinforcing its reliability for further consideration. The remaining high-activity compounds, although flagged as being outside the applicability domain, may represent structurally novel scaffolds that warrant experimental validation.
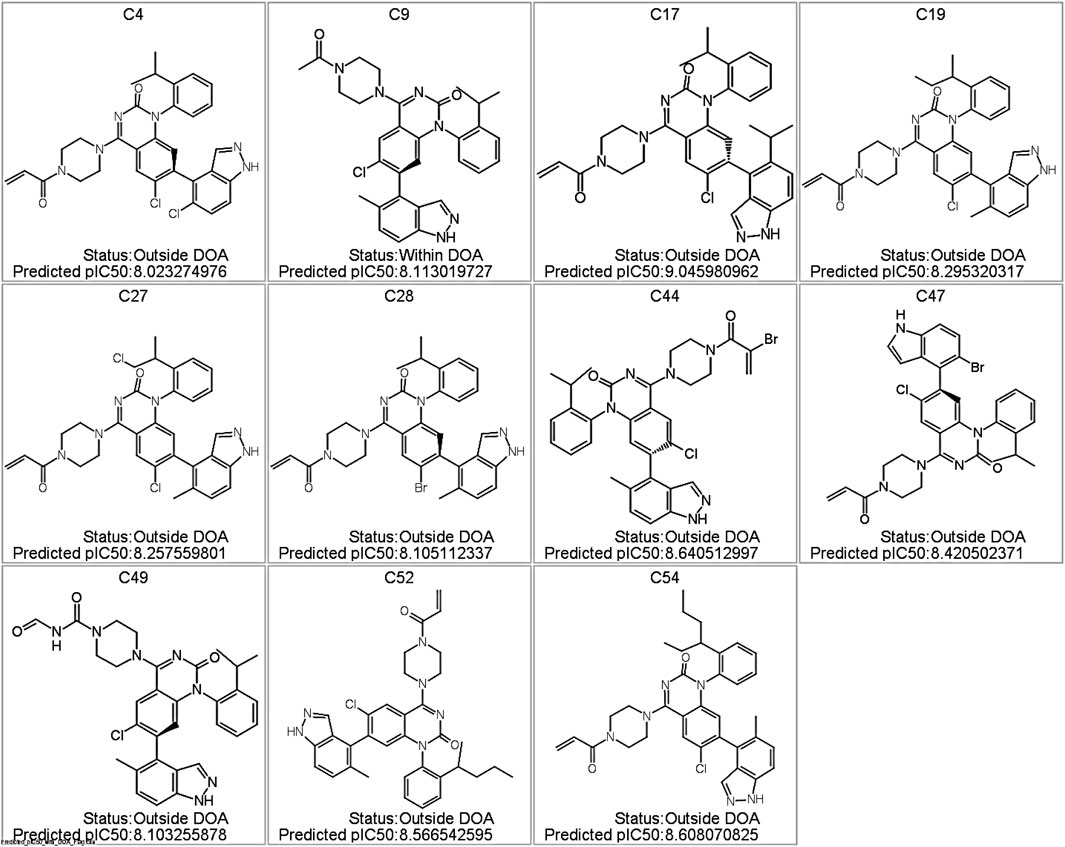
Figure 7. Predicted KRAS Inhibitor Hits with pIC50 >8.0 from Virtual Screening of De Novo Compounds. Structures of the top-scoring compounds generated via de novo design and screened using the GA-optimized MLR model. Only compound C9 was predicted to fall within the applicability domain (DOA); all others are flagged as outside the DOA. Predicted pIC50 values are indicated for each compound.
To support generalization claims when chronology is unavailable, we performed leave-cluster-out validation, holding out whole descriptor clusters. Across folds, the mean R2 ≈ 0.363 and mean RMSE ≈1.48 (k = 4), penalizing neighborhood overfitting and approximating “novel-analog” performance (Table 6).
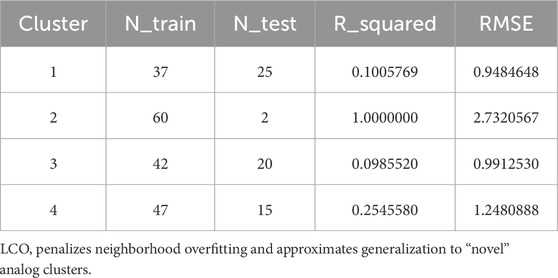
Table 6. For each k-means cluster held out in turn, the table lists training/test sizes and external performance (R2, RMSE).
Drug-likeness and toxicity profile
To evaluate the drug-likeness of the identified hit compound, ADMET-related physicochemical and toxicity parameters were assessed for compound C9 using DataWarrior software, which is the only de novo molecule that both exceeded the benchmark pIC50 value of 8.0 and fell within the model’s applicability domain (Figure 8). As shown in Table 7, compound C9 exhibited a predicted pIC50 of 8.11, which is slightly higher than that of the known KRAS inhibitor (pIC50 = 8.10). Its molecular weight (555.08 Da), cLogP (5.96), number of hydrogen bond acceptors (8), and number of hydrogen bond donors (1) were all comparable to those of the reference compound. The total surface area (410.08 Å2) and polar surface area (84.9 Å2) further supported its bioavailability profile.
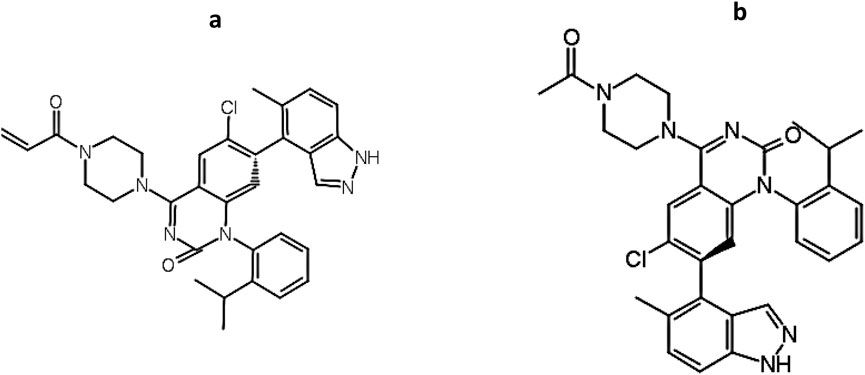
Figure 8. Structural resemblance between (a) KRAS inhibitor (Compound ID: 2363810; Supplementary File S1; pIC50 = 8.10) and (b) C9 (pIC50 = 8.11).
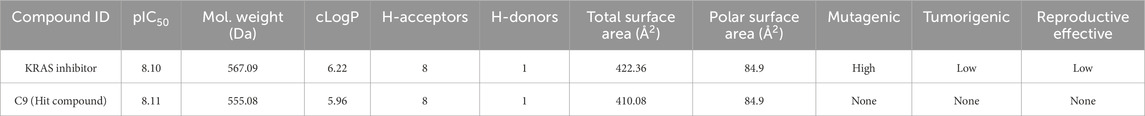
Table 7. Comparison of physicochemical and toxicity properties between C9 and reference KRAS inhibitor.
Importantly, In-silico toxicity predictions revealed that compound C9 was classified as non-mutagenic, non-tumorigenic, and lacking reproductive toxicity, unlike the reference KRAS inhibitor, which was flagged for high mutagenic potential. This suggests that C9 may represent a safer lead candidate for further preclinical investigation.
In addition to its favorable ADMET profile, compound C9 exhibited a close structural resemblance to the reference KRAS inhibitor, with subtle modifications at the R1 position. As depicted in Figure 9, both molecules share a conserved quinazoline-based scaffold, which is crucial for KRAS inhibitory activity. However, C9 features a 4-methylpiperidin-4-ylacetamide moiety at the R1 position, which distinguishes it from the acrylamide-bearing R1 group in the reference inhibitor. This modification may contribute to C9’s improved predicted potency (pIC50 = 8.11) and non-toxic profile. The simplified side chain in C9 potentially reduces electrophilic reactivity, contributing to its favorable mutagenicity and tumorigenicity scores. These findings suggest that C9 retains the pharmacophoric integrity of the KRAS inhibitor while presenting a safer and equally potent alternative for further lead optimization.
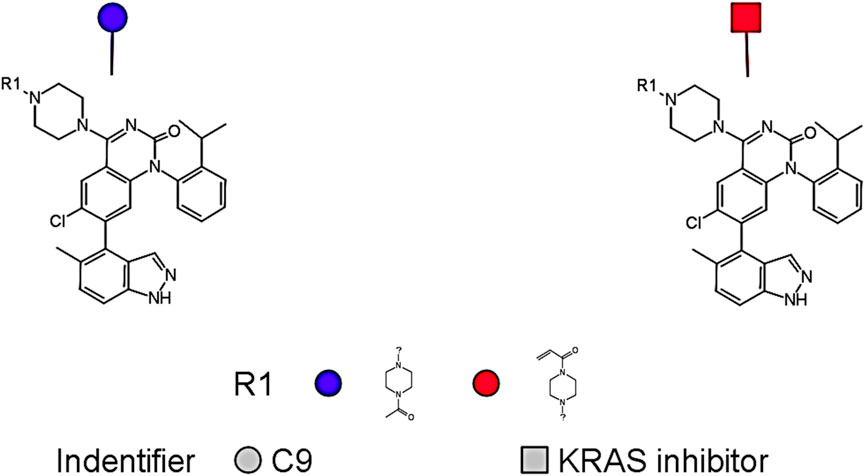
Figure 9. A conserved quinazoline-based scaffold seen in both C9 and Compound ID: 2363810; (Supplementary File S1).
Applicability-domain stratification based on Williams leverage (threshold h* = 1.04) showed 74.2% coverage for training and 24.2% for test; we therefore prioritize inside-AD candidates (e.g., C9) for experimental follow-up (Figure 10; Table 8).
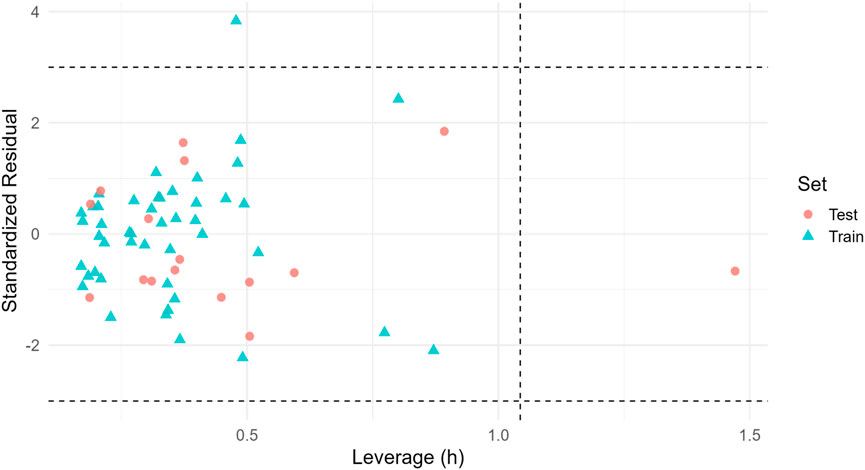
Figure 10. Williams plot (applicability domain). Standardized residuals vs. leverage for train/test (final GA-MLR). Dashed lines: ±3 residuals (horizontal) and h* (vertical). Inside-AD points indicate the most reliable predictions; coverage in Table 8.
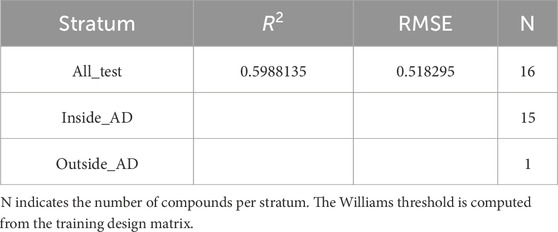
Table 8. External test R2 and RMSE reported for the full test set (“All_Test”) and, where available, for inside-AD and outside-AD strata.
Molecular docking of C9 in the KRAS G12 binding pocket
We docked the top-ranked de novo hit C9 into the KRAS G12 binding pocket and benchmarked the protocol against the co-crystallized reference ligand. C9 achieved a docking score of −9.6 kcal mol−1, indicative of strong non-covalent complementarity within the pocket. The predicted pose forms a small hydrogen-bond network (ca. 2.26–2.93 Å) with SER17 (HG→O), THR35 (HN→O; OG1···O) and ASP33 (O···O), supported by electrostatic contacts to LYS117 (NZ) and a hydrophobic shell involving PHE28, TYR32, LYS117, LEU120, and ALA18 (π–π and alkyl contacts, ∼3.5–5.1 Å). Representative 3D/2D interaction depictions and per-contact distances are shown in Figure 11 and Table 9.
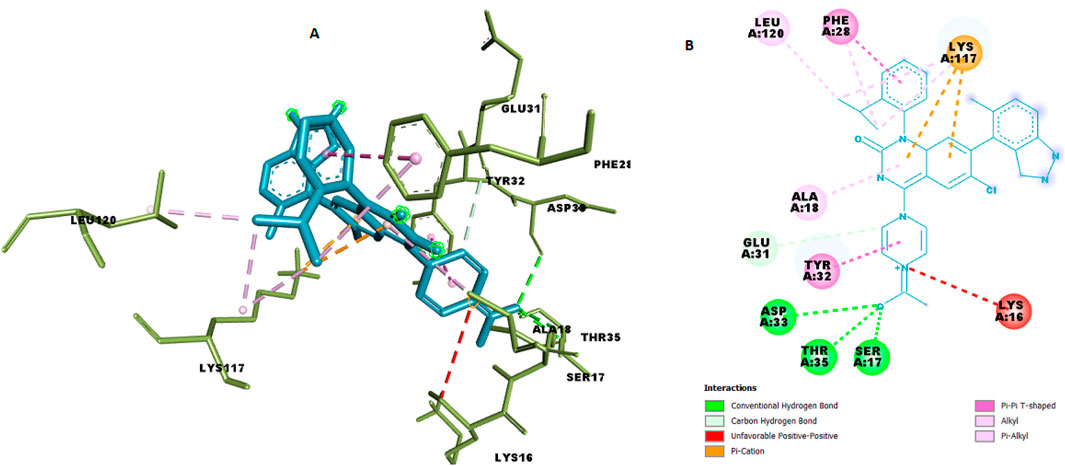
Figure 11. Chemical interaction of compound C9 within the KRAS G12 binding pocket (a) 3D interactions and (b) 2D interaction.
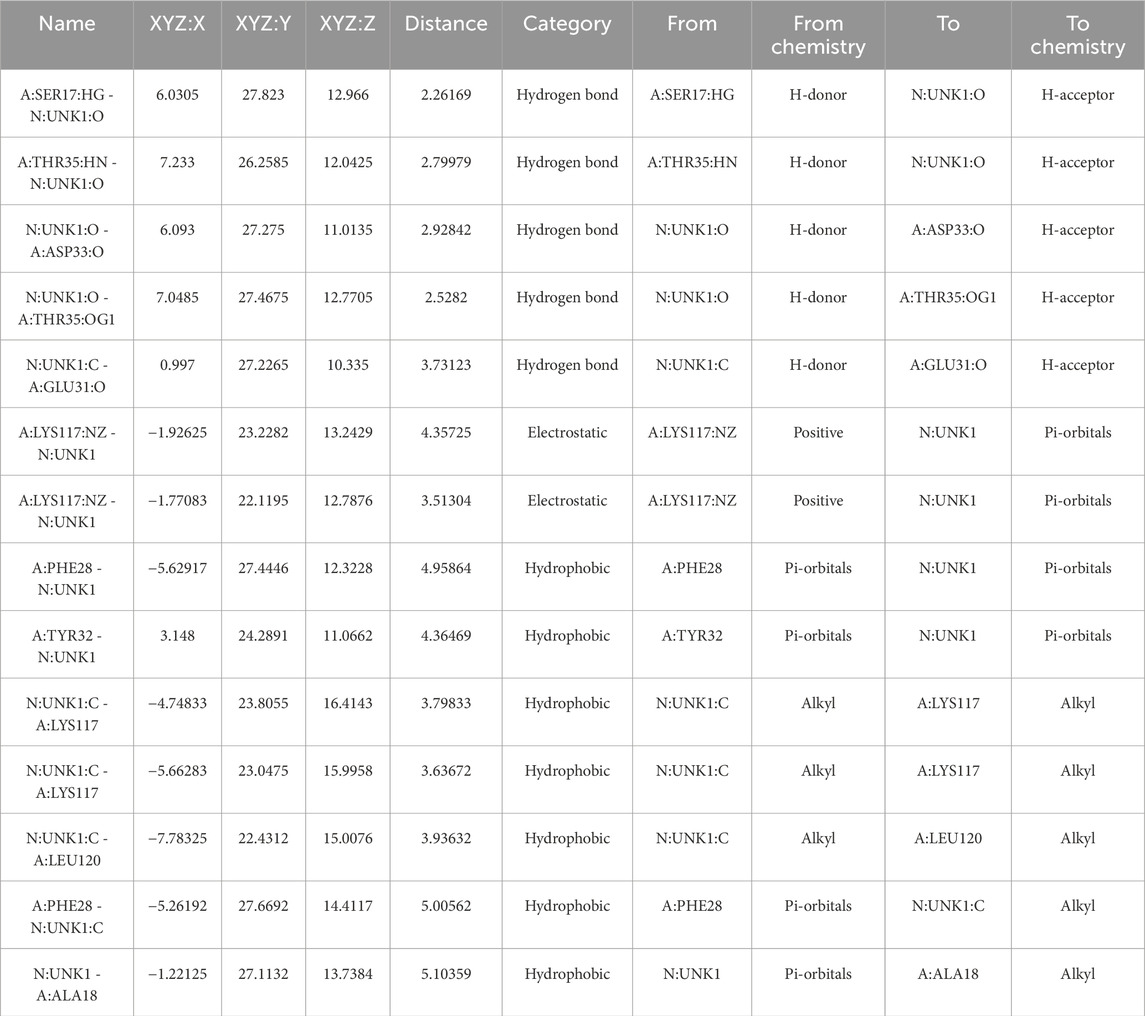
Table 9. Details of chemical interactions of C9 with KRAS G12 binding pocket.
For the co-crystallized ligand, the docking reproduced a dense polar network dominated by ARG161 (NH1/HH···O)* and THR158/ASP154 hydrogen bonds (≈2.29–3.30 Å), with hydrophobic stabilization at ALA134 (Figure 12; Table 10). This provides an internal control for the docking setup and highlights that C9 engages a complementary but non-identical microenvironment compared with the reference ligand.
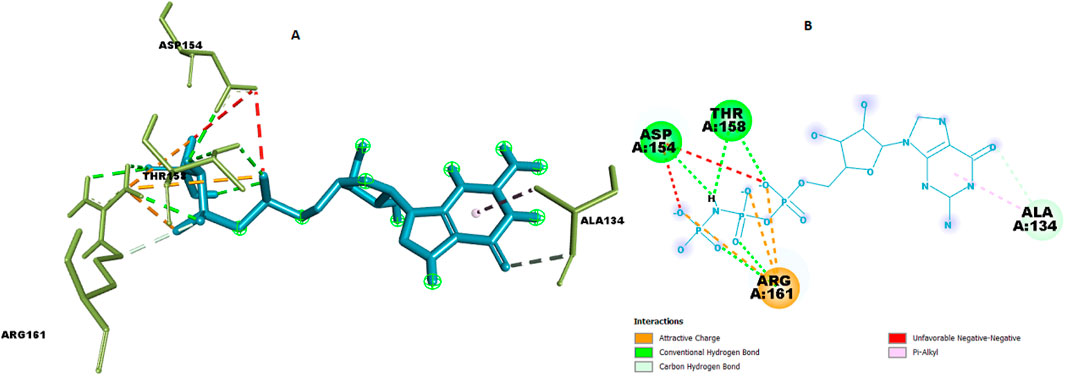
Figure 12. Chemical interaction of co-crystalized compound within the KRAS G12 binding pocket (a) 3D interactions and (b) 2D interaction.
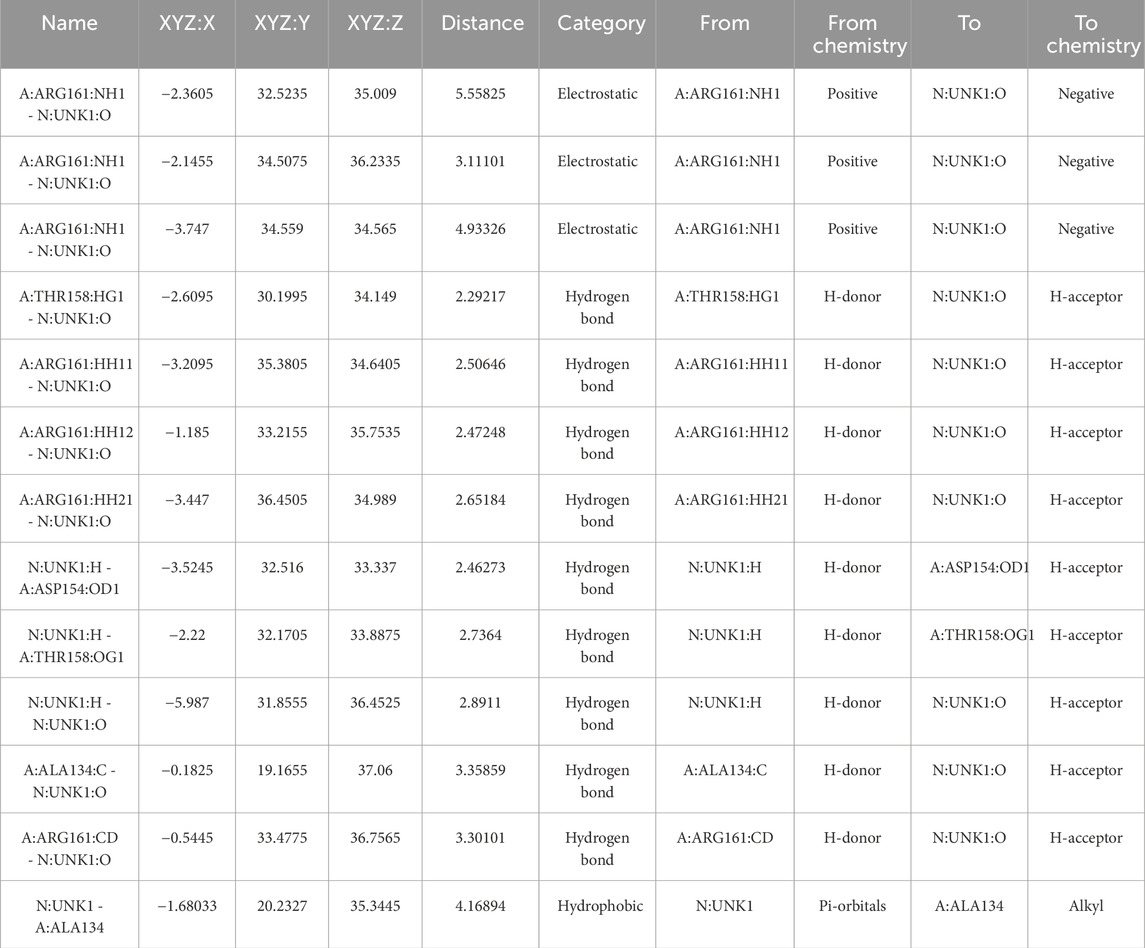
Table 10. Details of chemical interaction of co-crystalized compound with KRAS G12 binding pocket.
Our integrated workflow—pairing an interpretable GA-MLR with robust validation and orthogonal docking—argues that C9 is a credible KRAS^G12C Switch-II pocket (SII-P) binder while clarifying where the model’s predictions are most reliable. We deliberately prioritize explainability and calibrated uncertainty over marginal gains in point accuracy, because mechanistic hypotheses and decision-grade error bars are the levers that most improve prospective medicinal chemistry on small, congeneric datasets.
In the fitted GA-MLR, the dominant descriptor families point to two complementary physical themes with direct design implications for Switch-II pocket (SII-P) engagement. First, 3D distribution descriptors (RDF/MoRSE, with different atomic weightings) capture how mass, volume, and electronegativity are arranged at specific distance shells; the positive coefficients at selected shells imply that compact hydrophobic density and appropriately placed polarity at those radii favor activity—consistent with burying non-polar surface under the SII-P “lid” while projecting donors/acceptors toward the H95–Y96–Q99 cryptic subpocket exploited by KRAS^G12C covalent chemotypes (Lanman et al., 2019; Ostrem et al., 2013; Canon et al., 2019; Fell et al., 2020; Schuur et al., 1996; Hemmer et al., 1999; Gramatica, 2020). Second, surface-partition terms (e.g., fractional positive polar surface area, FPSA) weight where chargeable/heteroatom surface is exposed; their positive sign supports moderated, localized polarity rather than wholesale charge—compatible with known permeability/recognition trade-offs and with the hydrogen-bond topology reported for SII-P binders (Lanman et al., 2019; Ostrem et al., 2013; Canon et al., 2019; Fell et al., 2020; Ertl et al., 2000). By contrast, global exposure metrics (e.g., TASA) trending negative argue against over-extended solvent-facing area, reinforcing a design bias toward tighter shape complementarity and fewer, better polar contacts. Practically, these signals recommend (i) increasing lipophilic bulk along vectors that deepen contact in the Y96/Q99 wall, (ii) retaining a focused donor/acceptor pattern aligned to the observed pose, and (iii) avoiding gratuitous polar surface that would inflate TASA without productive pocket interactions—together offering a descriptor-anchored blueprint for the next round of analogs (Sung et al., 2021; Pylayeva-Gupta et al., 2011; Westover et al., 2016; Cox et al., 2014; Tropsha, 2010; Cherkasov et al., 2014; Todeschini and Consonni, 2009; Lanman et al., 2019; Cao et al., 2013; Sulaiman et al., 2021; C et al., 2002; Ghani and Ahmad, 2010; Molnar et al., 2018; Roy et al., 2015; López-López et al., 2019; Ostrem et al., 2013; Canon et al., 2019; Fell et al., 2020; Schuur et al., 1996; Hemmer et al., 1999; Gramatica, 2020).
Although higher-capacity baselines (PLS, RF) can outperform linear models on a given split, GA-MLR remains the most useful engine for hypothesis generation: its coefficients map cleanly onto physically interpretable descriptor families (vdW/shape-weighted RDF/MoRSE; balanced positive polar surface area), yielding actionable guidance for substituent placement and polarity tuning within SII-P. The dispersion observed in repeated cross-validation is a faithful readout of the small-N regime rather than a model defect, and Y-randomization effectively rules out chance correlations. Together with split-conformal prediction intervals, which provide calibrated coverage, the framework supplies both rank ordering and uncertainty—information that is more actionable than point estimates alone when advancing compounds into synthesis and testing.
Generalizability is constrained, by design, to a single congeneric covalent series. Applicability-domain (AD) analysis indicates that most training analogs lie within the modeled subspace, whereas a subset of test compounds fall outside; we therefore treat inside-AD predictions as decision-preferred and outside-AD as hypothesis-generating. Leave-cluster-out validation, which withholds whole descriptor neighborhoods, further stresses the model and exposes performance heterogeneity typical of narrow chemical neighborhoods. In this context, reporting both AD stratification and conformal intervals makes explicit the reliability envelope for any given prediction.
Docking provides orthogonal structural support. The C9 pose occupies the canonical SII-P cavity and projects toward the H95–Y96–Q99 cryptic subpocket that underpinned the transformation of KRAS^G12C from “undruggable” concept to a clinically validated target, beginning with allosteric covalent inhibitors that lock the GDP state and culminating in sotorasib (AMG-510) and adagrasib (MRTX849) (Lanman et al., 2019; Ostrem et al., 2013; Canon et al., 2019; Fell et al., 2020). This atomistic picture coheres with the GA-MLR descriptor signals—hydrophobic packing and moderated polarity at specific 3D radii—reinforcing that the linear model is capturing pocket physics rather than spurious correlations. We interpret the −9.6 kcal/mol docking score qualitatively, consistent with community benchmarks that docking is most reliable for pose generation and less so for precise affinity ranking (Warren et al., 2006; Huang and Zou, 2010). Moreover, noncovalent docking does not explicitly model the G12C reaction coordinate, and SII-P conformational plasticity (cryptic breathing, water networks) can modulate recognition; covalent docking and short explicit-water molecular dynamics are therefore logical next steps to stress-test pose stability and reactive geometry in a pocket known to be dynamic (Huang and Zou, 2010; Mou et al., 2025).
Finally, the evidence positions C9 as a mechanistically rational KRAS^G12C candidate: an SII-P-consistent pose aligned with descriptor-level SAR, decision-grade uncertainty quantification, and clear AD guidance for triaging experiments. Practically, the data motivate a staged plan: biochemical engagement and nucleotide-exchange assays for KRAS^G12C, orthogonal biophysics (e.g., intact-protein MS for covalent adducts; DSF/CETSA), and comparative docking/short MD (including covalent protocols) against sotorasib/adagrasib-like matter to refine vectors that deepen H95/Y96/Q99 engagement. Positive outcomes would justify cellular studies in KRAS^G12C-mutant models and inform subsequent lead-optimization cycles. Within the realistic constraints of a small, single-series dataset, this balance—interpretability, calibration, and structural plausibility—maximizes the likelihood of successful translation from in silico predictions to in vitro validation.
Therefore, this study presents a novel pipeline that synergizes interpretable machine learning with evolution-based molecular generation, yielding compound C9 as a promising KRAS inhibitor with predictive potency, safety, and structural validity. The ability to pinpoint such candidates within an interpretable and chemically meaningful framework holds substantial promise for guiding experimental validation and future lead optimization efforts against KRAS-driven malignancies.
Conclusion
This study demonstrates the successful integration of QSAR modeling and de novo design to identify novel KRAS inhibitors with strong predicted potency and favorable drug-like properties. Among the models developed, PLS and Random Forest offered high predictive accuracy, while the GA-MLR model provided a mechanistically interpretable equation based on eight key molecular descriptors. Virtual screening of 58 de novo compounds identified compound C9 as a potent, non-toxic candidate within the model’s applicability domain, highlighting its potential as a lead structure for further development in lung cancer therapy. These findings offer a promising computational pipeline for accelerating structure-based drug discovery against challenging oncogenic targets like KRAS.
Data availability statement
The original contributions presented in the study are included in the article/Supplementary Material, further inquiries can be directed to the corresponding author.
Author contributions
OS: Conceptualization, Supervision, Writing – review and editing. GO: Conceptualization, Methodology, Software, Writing – original draft, Writing – review and editing. DO: Investigation, Writing – review and editing. AO: Investigation, Project administration, Writing – review and editing. HA: Investigation, Writing – review and editing. AH: Writing – review and editing.
Funding
The author(s) declare that no financial support was received for the research and/or publication of this article.
Conflict of interest
The authors declare that the research was conducted in the absence of any commercial or financial relationships that could be construed as a potential conflict of interest.
Generative AI statement
The author(s) declare that no Generative AI was used in the creation of this manuscript.
Any alternative text (alt text) provided alongside figures in this article has been generated by Frontiers with the support of artificial intelligence and reasonable efforts have been made to ensure accuracy, including review by the authors wherever possible. If you identify any issues, please contact us.
Publisher’s note
All claims expressed in this article are solely those of the authors and do not necessarily represent those of their affiliated organizations, or those of the publisher, the editors and the reviewers. Any product that may be evaluated in this article, or claim that may be made by its manufacturer, is not guaranteed or endorsed by the publisher.
Supplementary material
The Supplementary Material for this article can be found online at: https://www.frontiersin.org/articles/10.3389/fbinf.2025.1663846/full#supplementary-material
Abbreviations
NSCLC, Non-small cell lung cancer; KRAS, Kirsten rat sarcoma viral oncogene homolog; QSAR, Quantitative structure–activity relationship; MLR, Multiple linear regression; GA, Genetic Algorithm; GA-MLR, Genetic Algorithm-optimized Multiple Linear Regression; AIC, Akaike Information Criterion; PLS, Partial Least Squares; RF, Random Forest; MSE, Mean squared error; XGBoost, Extreme Gradient Boosting; RMSE, Root mean square error; MAE, Mean absolute error; Grav, gravitational index; TASA, Total solvent-accessible surface area.
References
Cho, S. J., and Hermsmeier, M. A. (2002). Genetic algorithm guided selection: variable selection and subset selection. J. Chem. Inf. Comput. Sci. 42 (4), 927–936. doi:10.1021/ci010247v
Canon, J., Rex, K., Saiki, A. Y., Mohr, C., Cooke, K., Bagal, D., et al. (2019). The clinical KRAS (G12C) inhibitor AMG 510 drives anti-tumour immunity. Nature 575 (7781), 217–223. doi:10.1038/s41586-019-1694-1
Cao, D. S., Xu, Q. S., Hu, Q. N., and Liang, Y. Z. (2013). ChemoPy: freely available python package for computational biology and chemoinformatics. Bioinformatics 29 (8), 1092–1094. doi:10.1093/bioinformatics/btt105
Cherkasov, A., Muratov, E. N., Fourches, D., Varnek, A., Baskin, I. I., Cronin, M., et al. (2014). QSAR modeling: where have you been? Where are you going to? J. Med. Chem. 57 (12), 4977–5010. doi:10.1021/jm4004285
Cox, A. D., Fesik, S. W., Kimmelman, A. C., Luo, J., and Der, C. J. (2014). Drugging the undruggable RAS: mission possible? Nat. Rev. Drug Discov. 13 (11), 828–851. doi:10.1038/nrd4389
Ertl, P., Rohde, B., and Selzer, P. (2000). Fast calculation of molecular polar surface area as a sum of fragment-based contributions and its application to the prediction of drug transport properties. J. Med. Chem. 43 (20), 3714–3717. doi:10.1021/jm000942e
Fell, J. B., Fischer, J. P., Baer, B. R., Blake, J. F., Bouhana, K., Briere, D. M., et al. (2020). Identification of the clinical development candidate MRTX849, a covalent KRASG12C inhibitor for the treatment of cancer. J. Med. Chem. 63 (13), 6679–6693. doi:10.1021/acs.jmedchem.9b02052
Ghani, I. M. M., and Ahmad, S. (2010). Stepwise multiple regression method to forecast fish landing. Procedia-Social Behav. Sci. 8, 549–554. doi:10.1016/j.sbspro.2010.12.076
Gramatica, P. (2020). Principles of QSAR modeling: comments and suggestions from personal experience. Int. J. Quantitative Structure-Property Relat. (IJQSPR) 5 (3), 61–97. doi:10.4018/ijqspr.20200701.oa1
Hemmer, M. C., Steinhauer, V., and Gasteiger, J. (1999). Deriving the 3D structure of organic molecules from their infrared spectra. Vib. Spectrosc. 19 (1), 151–164. doi:10.1016/s0924-2031(99)00014-4
Huang, S. Y., and Zou, X. (2010). Advances and challenges in protein-ligand docking. Int. J. Mol. Sci. 11 (8), 3016–3034. doi:10.3390/ijms11083016
Lanman, B. A., Allen, J. R., Allen, J. G., Amegadzie, A. K., Ashton, K. S., Booker, S. K., et al. (2019). Discovery of a covalent inhibitor of KRASG12C (AMG 510) for the treatment of solid tumors. J. Med. Chem. 63, 52–65. doi:10.1021/acs.jmedchem.9b01180
López-López, E., Naveja, J. J., and Medina-Franco, J. L. (2019). DataWarrior: an evaluation of the open-source drug discovery tool. Expert Opin. Drug Discov. 14 (4), 335–341. doi:10.1080/17460441.2019.1581170
Molnar, C., Casalicchio, G., and Bischl, B. (2018). iml: an R package for interpretable machine learning. J. Open Source Softw. 3 (26), 786. doi:10.21105/joss.00786
Mou, M., Yang, W., Huang, G., Yang, X., Zhang, X., Kandegama, W. M. W. W., et al. (2025). The discovery of cryptic pockets increases the druggability of “undruggable” proteins. Med. Res. Rev. 45, 1818–1849. doi:10.1002/med.70001
Ostrem, J. M., Peters, U., Sos, M. L., Wells, J. A., and Shokat, K. M. (2013). K-Ras (G12C) inhibitors allosterically control GTP affinity and effector interactions. Nature 503 (7477), 548–551. doi:10.1038/nature12796
Pylayeva-Gupta, Y., Grabocka, E., and Bar-Sagi, D. (2011). RAS oncogenes: weaving a tumorigenic web. Nat. Rev. Cancer 11 (11), 761–774. doi:10.1038/nrc3106
Roy, K., Kar, S., and Das, R. N. (2015). Understanding the basics of QSAR for applications in pharmaceutical sciences and risk assessment. Academic Press.
Schuur, J. H., Selzer, P., and Gasteiger, J. (1996). The coding of the three-dimensional structure of molecules by molecular transforms and its application to structure-spectra correlations and studies of biological activity. J. Chem. Inf. Comput. Sci. 36 (2), 334–344. doi:10.1021/ci950164c
Sulaiman, M. S., Abood, M. M., Sinnakaudan, S. K., Shukor, M. R., You, G. Q., and Chung, X. Z. (2021). Assessing and solving multicollinearity in sediment transport prediction models using principal component analysis. ISH J. Hydraulic Eng. 27 (Suppl. 1), 343–353. doi:10.1080/09715010.2019.1653799
Sung, H., Ferlay, J., Siegel, R. L., Laversanne, M., Soerjomataram, I., Jemal, A., et al. (2021). Global cancer statistics 2020: GLOBOCAN estimates of incidence and mortality worldwide for 36 cancers in 185 countries. CA a Cancer J. Clin. 71 (3), 209–249. doi:10.3322/caac.21660
Todeschini, R. O. B. E. R. T. O., and Consonni, V. (2009). Molecular descriptors for chemoinformatics. Wiley-VCH. doi:10.1002/9783527628766
Tropsha, A. (2010). Best practices for QSAR model development, validation, and exploitation. Mol. Inf. 29 (6-7), 476–488. doi:10.1002/minf.201000061
Warren, G. L., Andrews, C. W., Capelli, A. M., Clarke, B., LaLonde, J., Lambert, M. H., et al. (2006). A critical assessment of docking programs and scoring functions. J. Med. Chem. 49 (20), 5912–5931. doi:10.1021/jm050362n
Keywords: KRAS mutations, QSAR, de novo design, GA-MLR model, KRAS inhibitor
Citation: Stephen Adebayo O, Oche Ambrose G, Olusola D, Oluwafemi A, Alzahrani HA and Hasan A (2025) QSAR-guided discovery of novel KRAS inhibitors for lung cancer therapy. Front. Bioinform. 5:1663846. doi: 10.3389/fbinf.2025.1663846
Received: 17 July 2025; Accepted: 27 October 2025;
Published: 17 November 2025.
Edited by:
Sajjad Gharaghani, University of Tehran, IranReviewed by:
Mansour S. Alturki, Imam Abdulrahman Bin Faisal University, Saudi ArabiaBashirulla Shaik, National Institute of Technical Teachers Training and Research Institute, Bhopal, India
Copyright © 2025 Stephen Adebayo, Oche Ambrose, Olusola, Oluwafemi, Alzahrani and Hasan. This is an open-access article distributed under the terms of the Creative Commons Attribution License (CC BY). The use, distribution or reproduction in other forums is permitted, provided the original author(s) and the copyright owner(s) are credited and that the original publication in this journal is cited, in accordance with accepted academic practice. No use, distribution or reproduction is permitted which does not comply with these terms.
*Correspondence: George Oche Ambrose, YWFmYWl0aDUxNkBnbWFpbC5jb20=
†These authors share first authorship