 Marie Carquet
 Denis Pompon
 Gilles Truan
- 1Université de Toulouse, INSA, UPS, INP, LISBP, Toulouse, France
- 2INRA, UMR792 Ingénierie des Systèmes Biologiques et des Procédés, Toulouse, France
- 3CNRS, UMR5504, Toulouse, France
Fine tuning of individual enzyme expression level is necessary to alleviate metabolic imbalances in synthetic heterologous pathways. A known approach consists of choosing a suitable combination of promoters, based on their characterized strengths in model conditions. We questioned whether each step of a multiple-gene synthetic pathway could be independently tunable at the transcription level. Three open reading frames, coding for enzymes involved in a synthetic pathway, were combinatorially associated to different promoters on an episomal plasmid in Saccharomyces cerevisiae. We quantified the mRNA levels of the three genes in each strain of our generated combinatorial metabolic library. Our results evidenced that the ORF nature, position, and orientation induce strong discrepancies between the previously reported promoters’ strengths and the observed ones. We conclude that, in the context of metabolic reconstruction, the strength of usual promoters can be dramatically affected by many factors. Among them, transcriptional interference and ORF nature seem to be predominant.
Introduction
Many biotechnological processes involve microorganisms to produce molecules of interest in a sustainable way, sometimes competing efficiently with chemical synthesis (Kim et al., 2013). In this context, one of the typical goals of synthetic biology, and more particularly of metabolic engineering, is to genetically modify known and robust microorganisms to create artificial pathways compatible with industrial processes. However, unregulated expression of foreign enzymes used to rebuild synthetic pathways in heterologous hosts may interfere with endogenous metabolic fluxes, causing metabolic burden, overconsumption of resources, or release of toxic intermediates (Glick, 1995; Neubauer et al., 2003). It is thus necessary to properly adjust the levels of all enzymes participating in the heterologous metabolic pathway to maximize metabolic fluxes toward the desired path while avoiding undesirable impacts on cell physiology and viability (Lu and Jeffries, 2007; Ajikumar et al., 2010; Ramon and Smith, 2011). Balancing natural versus synthetic fluxes can be achieved by individually tuning the expression level of each foreign enzyme. In the host Saccharomyces cerevisiae, regulated promoters with tunable strengths can be used (Da Silva and Srikrishnan, 2012), but this approach is often limited by the non-linear responses to the inducer concentration or by the cost of these molecules, prohibitive in an industrial context (Siegele and Hu, 1997; Mnaimneh et al., 2004). Alternatively, collections of natural or engineered constitutive promoters of various strengths allow fine tuning of enzyme expression levels (Alper et al., 2005; Lu and Jeffries, 2007; Du et al., 2012).
The importance of promoter strength and regulation on net protein output has been extensively reviewed (Da Silva and Srikrishnan, 2012; Blazeck and Alper, 2013). Some studies characterized constitutive promoters by placing lacZ (Partow et al., 2010) or fluorescent protein encoding ORFs as reporters (Sun et al., 2012; Lee et al., 2013). Lee et al. (2013) characterized a set of S. cerevisiae constitutive promoters giving a robust control over gene expression. They used them to build a combinatorial library leading to violacein production without any knowledge of the optimal combination of individual enzymes levels. However, Karim et al. (2013) demonstrated that growth rates and plasmid copy number (parameters known to impact production efficiency) were influenced by additional factors, including the origin of replication and selection marker on episomal plasmids. One can question whether expression levels measured with model systems consistently reflect the strengths of the considered promoters, regardless of their direct genetic environment.
While chromosome integration of genes is the preferred technique for final, industrial strains, first optimization steps are usually performed on plasmids (Ro et al., 2006; Steen et al., 2008; Ukibe et al., 2009; Kocharin et al., 2012). Our goal was to assess whether the assigned strengths of promoters, when described in model systems, can be transposable when multiple expression cassettes are inserted on a single episomal plasmid. We therefore used as model a small, heterologous pathway leading to the synthesis of zeaxanthin, and implemented it in S. cerevisiae. The heterologous production of carotenoid molecules has previously been described using S. cerevisiae (Verwaal et al., 2007; Ukibe et al., 2009; Sun et al., 2012), demonstrating that rerouting the endogenous terpene pathway to these heterologous metabolites is feasible (Figure 1). Three heterologous ORFs from different carotenoid-producing organisms were used: CRTI (phytoene desaturase gene), CRTYB (bifunctional phytoene synthase and lycopene cyclase gene), both from Xanthophyllomyces dendrorhous, and CRTZ (β-carotene hydroxylase gene) from Pantoea ananatis. A small metabolic combinatorial library was built using six constitutive promoters that were reported to be strong, medium, or weak using the fluorescent protein GFP as a reporter (Sun et al., 2012). mRNA levels of the three abovementioned genes were quantified in various culture conditions.
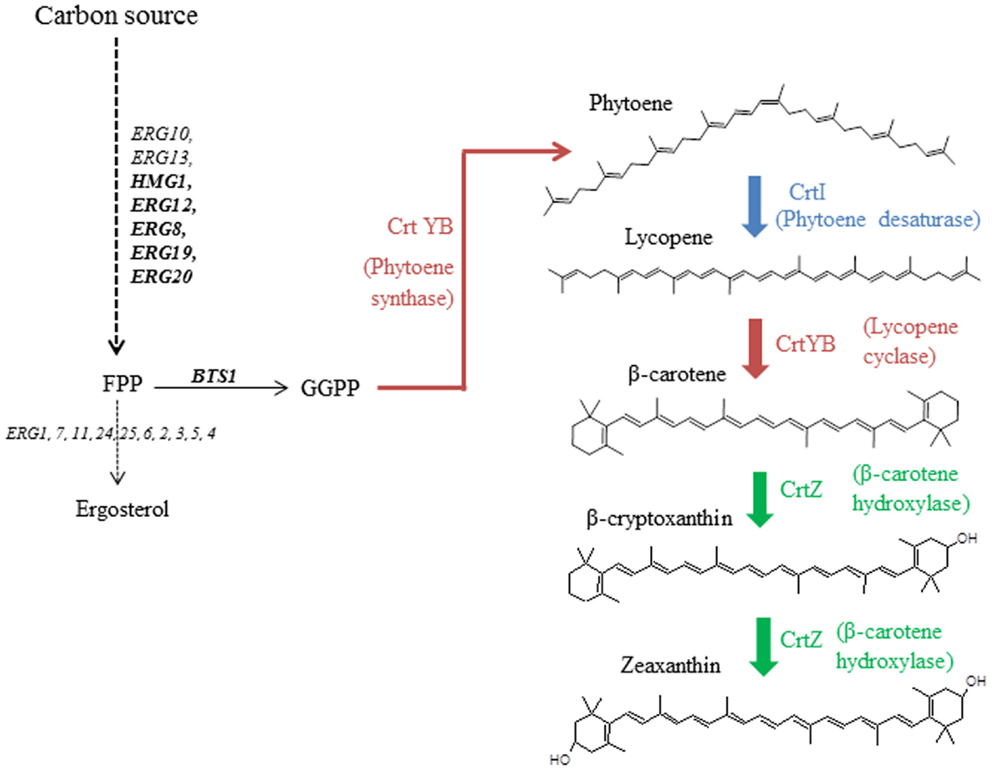
Figure 1. Zeaxanthin reconstruction pathway in the host S. cerevisiae from geranylgeranyl pyrophosphate (GGPP). Heterologous steps are colored.
Materials and Methods
Plasmid Constructions
Genes CRTI and CRTYB from X. dendrorhous were amplified from plasmid YEplac195 YB/I (kindly supplied by Prof. Gerhard Sandmann (Verwaal et al., 2007). CRTZ from P. Ananatis (GenBank accession number D90087) was chemically synthetized (Genecust, Luxembourg) after S. cerevisiae codon bias optimization using Gene Designer 2.0 (see Supplementary Material for optimized sequence). TEF1, PDC1, PGI1, GPD, ENO2, and TEF2 promoters, as well as ADH1, TEF2, and CYC1 terminators were amplified from genomic DNA of S. cerevisiae. Overlaps of 30 bp were designed between adjacent fragments and no spacer sequences were added between the different transcription units (Table S1 in Supplementary Material). PCR products were purified and further used for overlapping amplification to construct individual expression cassettes (promoter-ORF-terminator). A last PCR amplification was performed with primers RECpRS426_F and RECpRS426_R to extend (40 bp) the recombination segments between the synthetized fragments and pRS426 (Christianson et al., 1992). The library of promoter-ORF-terminator associations was subsequently assembled by Gibson cloning method (Gibson et al., 2009) in a SacI/XhoI linearized pRS426 (URA3 selection marker) (Gibson Assembly Cloning Kit, NEB, Ipswich, MA, USA). The whole construction method is detailed in Figure S1 in Supplementary Material. The combinatorial library is composed of nine plasmids, named pRS426/A to pRS426/I (Table 1). Empty pRS426 is named H. To avoid recombination event, no repeated sequence was inserted into the plasmids. That explains the absence of reuse of the same promoter in each single construct, and the choice of three different terminators. The catalytic subunit of HMG-CoA reductase gene (tHMG1) was amplified from genomic DNA of S. cerevisiae, with primers tHMG1_pCM185_F and tHMG1_pCM185_R (Table S1 in Supplementary Material) and inserted in pCM185 (TRP1 selection marker) (Gari et al., 1997), resulting in pCM185/tHMG1. All constructions were verified by sequencing.
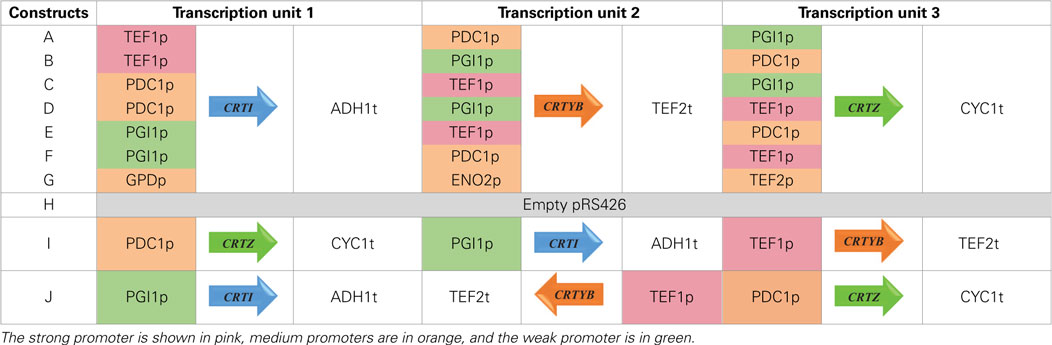
Table 1. Order of genes in the different pRS426 derivatives.
Strains, Culture, and Sampling Conditions
The generated vectors were transformed in the S. cerevisiae CEN.PK 113-7D strain (Mata his3 – 1 leu2-3,112 trp1-289 ura3-52 MAL2-8c) by the lithium acetate method (Gietz et al., 1992), giving birth to strains A to I or A+H to I+H, according to the presence of empty pCM185 or pCM185/tHMG1, respectively. Recombinant strains were grown on CSM-URA-TRP plates (MP Biomedicals, Santa Ana, CA, USA) from a glycerol stock at 30°C during approximately 3 days. A single colony was then grown in 50 mL of complete synthetic, selective medium (Table S2 in Supplementary Material) at 30°C and 200 rpm during 24 h. 100 mL of the same medium was further inoculated at a final OD600 of 0.5, in 500 mL shake flasks. Two milliters of samples were drawn and immediately cooled to 4°C and centrifuged at 3,200 g (4°C). The cell-containing pellets were washed once with 1 mL of ice cold ultrapure water, rapidly centrifuged at 4°C, and quenched in liquid nitrogen before being stored at −80°C for subsequent nucleic acids extraction. At the end of the 72 h of culture, cells were harvested by centrifugation (8,200 g, 2 min), washed once with deionized water, frozen at −80°C, and lyophilized with a CHRIST Alpha 2–4 LD plus freeze-drier. All culture experiments were performed in triplicates. For real independency of triplicates, shake-flasks cultures were performed neither simultaneously, nor from the same inoculum.
NMR Identification and Quantification of Extracellular Compounds
Supernatants were filtered over 0.2 μm and quenched at −80°C prior to their use for NMR quantification of extracellular metabolites on the MetaToul platform. 1H-MMR spectra were recorded on a Bruker Avance II 500.13 MHz instrument, equipped with a 5 mm probe BBI. Supernatant samples (500 μL) were mixed with 100 μL of a 4 mM 2-(Trimethylsilyl)propionic-2,2,3,3-d4 acid (TSP-d4) solution in D2O as an internal intensity- and chemical shift-standard without further sample pretreatment for metabolite quantification. Measurements were performed with a zgpr pulse program, at 286 K with eight scans per spectrum and a flip angle of 30°(d1: 15 s, TD: 128 K, and presaturation of the 1H2O signal – O1P: 4,700 ppm). Basic analysis of the acquired spectra and peak integrations were performed using the Bruker “TopSpin 3.0” software suit.
RT-qPCR Experiments
Frozen cells were mechanically disrupted using a Tissue Lyser II (Qiagen, Venlo, the Netherlands) during 3 min at a frequency of 30 Hz. Total nucleic acids were extracted using the GeneJET RNA purification kit (Thermo Scientific, Waltham, MA, USA). Genomic DNA contamination was eliminated by an additional DNase treatment performed with the RNase-free DNase I (Thermo Scientific, Waltham, MA, USA). RNA quality was assayed on a Bioanalyzer 2100 with the RNA 6000 Nano LabChip kit (Agilent Technologies, Santa Clara, CA, USA). One microgram of RNA was reverse-transcribed into cDNA in a 20 μL reaction using the Maxima first strand cDNA synthesis kit (Thermo Scientific, Waltham, MA, USA). Four microliters of a 10-fold dilution of the previously synthetized cDNA were added to the qPCR Master Mix to perform cDNA relative quantification. Quantitative PCR (qPCR) reactions were performed in triplicates, in 20 μL final volume and in 96-well plates (Bio-Rad, Hercules, CA, USA) using the Maxima SYBR Green/Fluorescein qPCR Master Mix (2X) from Thermo Scientific (Waltham, MA, USA), in the MyIQ real-time PCR system from Bio-Rad. A blank (No Template Control) was also incorporated in each assay. Primers were designed using Primer3Plus1, and their specificity was verified using the PrimerBLAST tool from NCBI2. qPCR primer sequences are given in Table S3 in Supplementary Material. The PCR efficiency of each primer pair(Eff) was evaluated by the dilution series method using a mix of sampled cDNAs as template. The absence of contaminant genomic DNA in RNA preparations was verified using RNA as a template in real-time PCR assays (minus RT control). The thermocycling program consisted of one hold at 95°C for 10 min, followed by 40 cycles of 15 s at 95°C and 60 s at 60°C. After completion of these cycles, melting-curve data were collected to verify PCR specificity, contamination, and absence of primer dimers.
mRNA Variation Quantification
Biological samples were prepared in independent triplicates, and qPCR analyses were performed in technical triplicates, bringing to six the number of analysis performed for each tested condition. Four internal control genes were used: ALG9, TFC1, UBC6, and TAF10, chosen on their demonstrated expression stability over culture conditions (Teste et al., 2009). All data were calculated using the gene expression module of the BIORAD iQ5 software, using the 2ΔΔCt method (Livak and Schmittgen, 2001). Presented data are average of biological triplicates, normalized to the internal control genes values, with SD. Results were then expressed in terms of mRNA normalized variations, relative to the appropriate reference strain for the observed condition (H or H+H). Although these reference strains do not contain the genes CRTI, CRTYB, and CRTZ, some non-specific amplification was detectable in reverse transcription quantitative PCR (RT-qPCR) when the corresponding cDNAs were targeted. Results were normalized by arbitrarily set at 1 the level of signal observed in the reference strains, and expressing mRNA levels in the tested conditions in fold changes relative to the appropriate reference.
pRS426 Copy Number Determination
Nucleic acids were extracted as described previously. RNA contamination was eliminated by a DNase-free RNase A treatment (Thermo Scientific, Waltham, MA, USA) at 37°C during 10 min, followed by 10 min at 45°C and 10 min at 60°C. Standard curve for plasmid quantification was done as follows: genomic DNA extracted from a native CEN.PK 113-7D strain and three different amounts of pRS426 plasmid were pooled as to mimic 5.3, 10.6, and 15.9 pRS426 copy number per haploid genome. Quantification was performed using URA3 gene. Twenty nanograms of each mixture was added to the qPCR Master Mix, generating the standard curve. pRS426 quantification in the various strains was performed using the same qPCR amplification starting with 20 ng of extracted DNA (Figure S2 in Supplementary Material).
Results
Zeaxanthin Pathway Library Generation
We wanted to understand if promoters of reported strengths (Sun et al., 2012) can be used to impose a precise transcriptional regulation of expression level of genes involved in a synthetic pathway in yeast. Individual ORFs encoding a synthetic zeaxanthin pathway were combinatorially placed under the control of yeast constitutive promoters having different strengths: TEF1p (strong), PGI1p (weak), PDC1p, GPDp, ENO2p, TEF2p (medium), and three independent terminators (see Materials and Methods). An in vitro recombination method was used to quickly and reliably obtain the various individual constructs (Figure S1 in Supplementary Material).
The production, in yeast, of mevalonate by HMG-CoA reductase is known to be rate-limiting for the metabolic flux leading to sterols (Donald et al., 1997) and carotenoids (Verwaal et al., 2007; Yan et al., 2012). Therefore, to faithfully reproduce the deregulation strategy, usually applied when producing terpene compounds, and to potentially visualize an effect of precursor boost on heterologous genes expression, a gene encoding the catalytic subunit of HMG-CoA reductase (tHMG1) from S. cerevisiae was cloned on pCM185 (pCM185/tHMG1).
Seven strains were generated: six upon transformation with the six plasmids harboring various promoter strengths and one corresponded to the transformation with the seventh plasmid harboring medium strengths promoters. The reference strain was transformed with the empty pRS426. These eight generated strains (Table 1) were further transformed with pCM185 or pCM185/tHMG1, leading to 16 different strains named A to H when transformed with empty pCM185 (named set 1 throughout the rest of this document) or A+H to H+H when transformed with pCM185/tHMG1 (named set 2 throughout the rest of this document).
S. cerevisiae Strains, Culture, and Sampling
We first determined that no significant differences existed between the growth curves of the zeaxanthin producing strains and the reference strains (Figure S3 in Supplementary Material). During batch growth on glucose, yeast cells shift from fermentation to respiration (diauxic shift) after exhausting the primary carbon source, causing extensive reprogramming of the transcription machinery (Galdieri et al., 2010). GPD, PDC1, PGI1, and ENO2 genes are involved in both glucose and ethanol assimilation processes. Consequently, the associated promoters are potentially sensitive to the cell metabolic state. We analyzed by NMR the supernatant of the culture medium of the strains A, C, D, and H (Figure 2). After 15 h of growth, the medium contained glucose as well as ethanol produced by fermentation. Interestingly, the glucose concentration was slightly lower in strain H than in any other strain harboring the zeaxanthin pathway, although the difference between the growth curves measured for strain H compared to the zeaxanthin strain was within error range. However, it is possible that the reference strain H consumed glucose slightly faster than any of the zeaxanthin producing strains. On the contrary, after 40 h of growth, only ethanol could be found in the medium. We therefore determined that at 15 h of growth, the strains were still fermenting glucose (preferred carbon source); while at 40 h of growth, they had shifted to respiratory conditions (consuming ethanol). mRNA extraction and quantification were then performed either in fermentative context (15 h, glucose) or in respiratory context (40 h, ethanol).
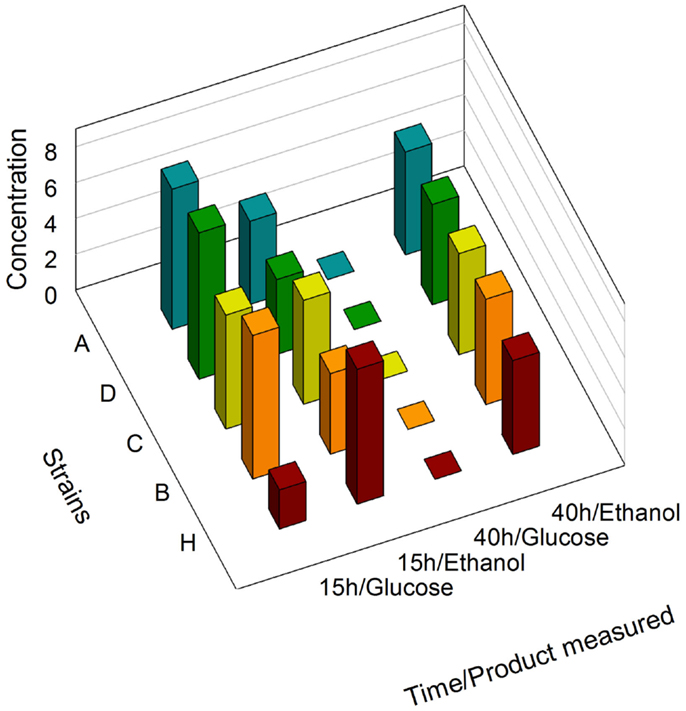
Figure 2. NMR determination of glucose and ethanol concentrations. Supernatants of strains A, B, C, D, and H were analyzed after 15 h and 40 h of growth.
pRS426 Copy Number Quantification
Prior to analyze the transcription variation of the combinatorial metabolic library genes, we investigated whether the copy number of the pRS426 derivatives changed in the different strains. We determined that strain H contained approximately 28 ± 0.1 copies of the empty pRS426, a regular value for a 2 μ based plasmid (Romanos et al., 1992) (Figure 3). Using strain F as a representative for all zeaxanthin producing strains, we determined that the pRS426/F copy number was 2.0 ± 0.2 copies per cell only. It has been demonstrated that in case of deleterious gene products, a decrease in the plasmid copy number was observed (Fang et al., 2011). Zeaxanthin biosynthesis may lead to a certain toxicity, resulting in a positive selection pressure on cells harboring a reduced number of the pRS426 derivatives. Interestingly, adding a second, monocopy plasmid (pCM185/tHMG1) in these two strains (F and H, generating F+H and H+H respectively) promoted a systematic decrease of the copy number of pRS426 derivatives (6.0 ± 0.3 copies for H+H compared to 28 ± 0.1 for strain H and about 0.5 ± 0.3 copy for F+H compared to 2.0 ± 0.2 copies in strain F). This suggests a possible interference between the two plasmids, as already observed in Escherichia coli (Gruber et al., 2008). As a conclusion, the copy number of pRS426 derivatives was affected by the zeaxanthin pathway expression and the presence of pCM185/tHMG1.
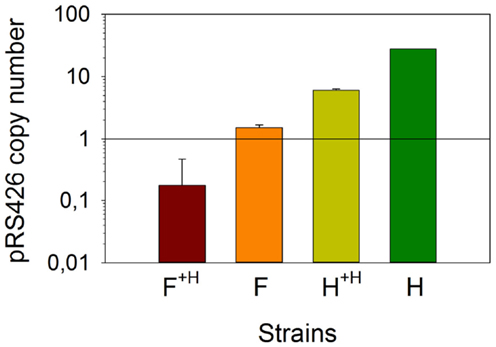
Figure 3. Absolute quantification of the copy number of pRS426/F. Strains F and F+H were compared with pRS426 in reference strains H and H+H.
Expression Profile of the pRS426 Marker
Given the discrepancies in the copy number of pRS426 derivatives when tHMG1 or carotenoid genes were expressed, we wanted to confirm if this variation was reflected in mRNA levels of the URA3 gene present in the pRS426 backbone (Figure S4 in Supplementary Material). mRNA levels of URA3 in each set of strains (set 1 or set 2) were averaged, and standardized to the levels calculated from the reference strain H or H+H, respectively (Figure 4). First, the fairly minor SD showed that the variation of the URA3 mRNA levels was minimal between the different strains. Secondly, the mean values of mRNA levels were almost constant over the different conditions (small variations being within error range), but dramatically reduced (50–100-folds) in zeaxanthin producing strains, when compared to the reference. As mentioned earlier, the copy number of pRS426 derivatives decreased down to approximately 1 in the strains harboring the zeaxanthin pathway compared to approximately 30 copies in the reference strains. Consequently, the strong decrease in the URA3 mRNA levels could hardly be explained by the sole reduction of the copy number of the pRS426 derivatives. The three heterologous genes were placed far away and downstream the URA3 gene in pRS426 (Figure S4 in Supplementary Material), theoretically limiting possible transcriptional effects between them. Nonetheless, transcription of CRTI, CRTYB, and CRTZ may interfere in some way with URA3 promoter activity either due to some competition between the different promoters or possible changes in the plasmid DNA structure, hampering a correct DNA unwinding prior transcription. A regulation of endogenous ura3-52 gene present in CEN.PK may also take part in the URA3 mRNA level reduction. Indeed, the addition of a plasmid containing the URA3 gene may modify transcriptional regulation of endogenous uracil pathway.
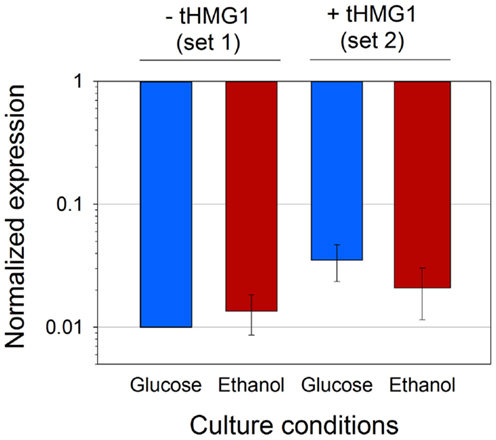
Figure 4. Average URA3 mRNA level in four conditions. Analyses were performed on set 2 or set 1 (with or without tHMG1 expression, respectively), in glucose (blue bars) or ethanol (red bars) metabolism. Results were normalized with URA3 signal in strain H for strains from set 1, and with URA3 signal in strain H+H for strains from set 2. Error bars represent 1 SD.
Controls of Plasmid Integrity and Cell Physiology
In order to ascertain reproducibility of our quantifications, several controls experiments were conducted. To ensure that no recombination events occurred between one of the plasmids and S. cerevisiae genome, or between the two plasmids, we verified their integrity after transformation and cultivation. Restriction analyses (Figure S5 in Supplementary Material), performed on extracted plasmids, demonstrated that the specific bands of pRS426 and pCM185 derivatives corresponded to normal restriction profiles. We then verified if the expression of the different pRS426 derivatives could lead to changes in the transcriptional regulation of some specific genes. mRNA levels of a restricted number of genes involved in the production of endogenous carotenoids precursors were evaluated in the 14 engineered strains. BTS1, ERG20, ERG19, ERG8, ERG12, and HMG1 were chosen as targets because of their implication in the production of geranylgeranyl pyrophosphate (GGPP), the precursor involved in the first step of the heterologous biosynthetic pathway (Figure 1). For HMG1 mRNA quantification, primers were designed to avoid detection of transcripts from tHMG1. There was almost no impact of the carotenoid pathway on the transcriptional response of the six chosen genes when tHMG1 was not expressed (level changes are within the error range) (Figure 5A). However, when tHMG1 was expressed, there was a slight tendency to overexpress the GGPP pathway genes (Figure 5B). However, this increase is small compared to the technical error on this experimental design. In any case, the effects were minor and equivalent between all producing strains (no more than 3× the reference level) compared to non-producing strains H and H+H. Therefore, the production of zeaxanthin in our conditions did probably not strongly impact the pool of precursors and no physiological adaptation was therefore seen at the level of GGPP pathway regulation.
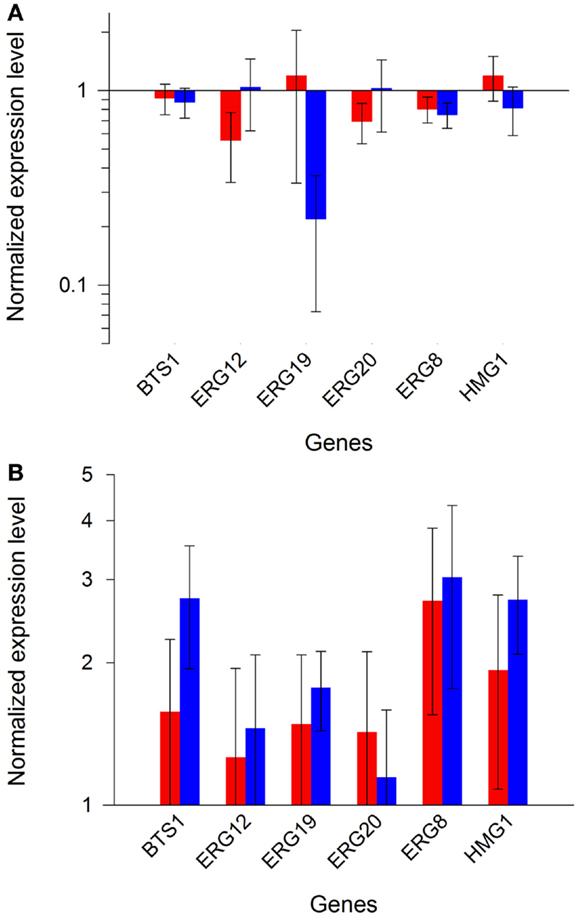
Figure 5. Expression profiles of endogenous GGPP pathway genes. Bars represent the mean value of the different gene expressions in the strains from set 1 [(A), red and blue bars for glucose or ethanol metabolism, respectively], or in the strains from set 2 [(B), red and blue bars for glucose or ethanol metabolism, respectively]. Error bars represent 1 SD.
Absence of Correlation between Promoters Strengths and mRNA Levels
We analyzed the normalized mRNA levels of CRTI, CRTYB, and CRTZ genes for each strain and in every growth context. We again emphasize that only the promoter nature (and strength) in front of each ORF is different in strains from set 1 or set 2, independently (Table 1). Surprisingly, Figure 6 highlights one major profile in these sets of strains that can be described as follows: CRTI is the most expressed gene, followed by CRTYB and finally by CRTZ. The general tendency shows lower levels of mRNAs in set 2 (in accordance with the pRS426 derivatives copy number decrease when tHMG1 was expressed) or in respiratory conditions. However, in strain G+H, CRTZ mRNA level (in glucose) was not impacted by tHMG1 and even augmented compared to the one measured in strain G. Furthermore, in strain G+H, CRTZ mRNA level was not modified between glucose and ethanol conditions, unlike CRTI and CRTYB mRNA levels. In construct G, TEF2p, controlling CRTZ transcription, is the only promoter not to be involved in glucose or ethanol assimilation. This may be related to the CRTZ mRNA level stability over culture conditions. This results in CRTYB, CRTI, and CRTZ mRNA levels variation less than 15-fold in strain G+H, a feature that is in good accordance with the expected mRNA levels imposed by the chosen promoters (medium strength promoters for all three genes) (Sun et al., 2012). In conclusion, in our experimental conditions, mRNA levels did not reflect the previously described strengths of promoters (Sun et al., 2012).
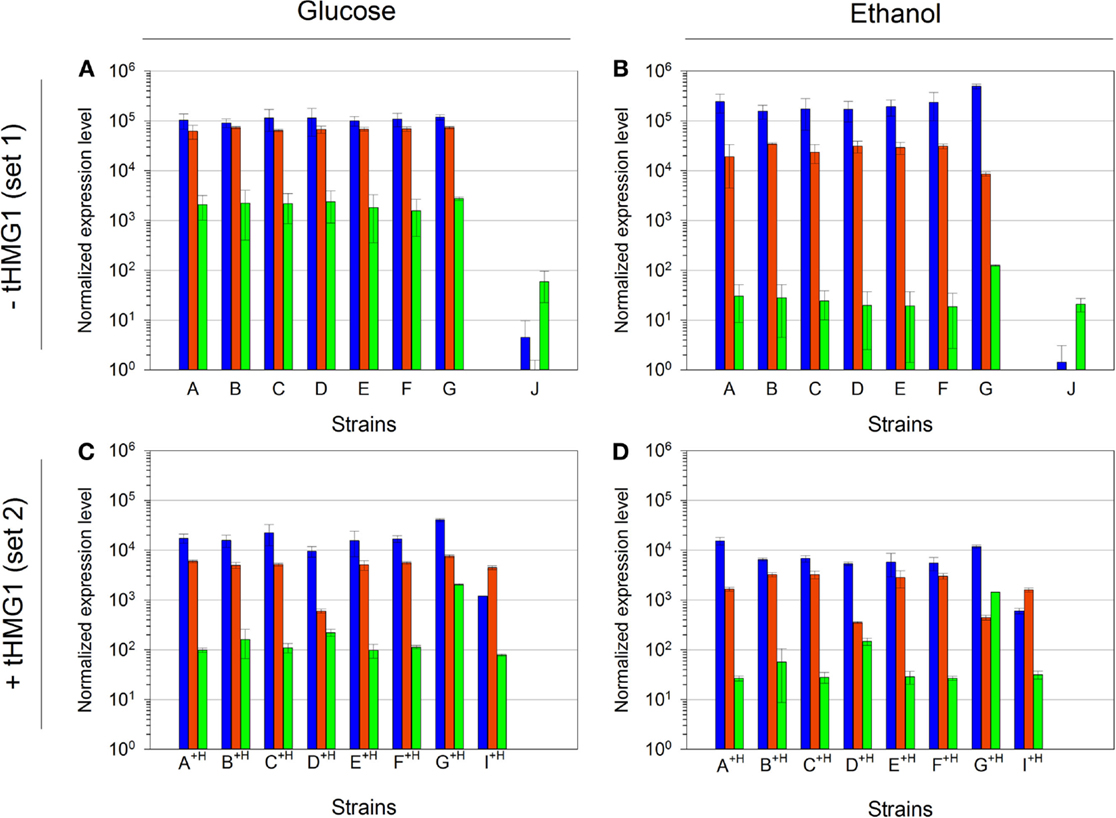
Figure 6. Quantitative RT-PCR analysis of mRNA levels of the three implemented carotenoid genes. (A) mRNA levels in strains A to J, in glucose metabolism (normalized with strain H); (B) mRNA levels in strains A to J, in ethanol metabolism (normalized with strain H); (C) mRNA levels in strains A+H to I+H, in glucose metabolism (normalized with strain H+H); (D) mRNA levels in strains A+H to I+H, in ethanol metabolism (normalized with strain H+H). Bar colors are as follows: CRTI, blue; CRTYB, red; and CRTZ, green. Error bars represent 1 SD. mRNA levels for strain J in glucose metabolism were done in duplicate and the error bars represent the two maximum values.
Gene Orientation and Order Strongly Affect Promoters Strengths
We tested the hypothesis that the mRNA levels in our system were dependent on the genes’ position. We designed two new plasmids, keeping the promoter-ORF-terminator associations of pRS426/E, but swapping the positions of the three genes (pRS426/I) or reversing the CRTYB transcription unit orientation (pRS426/J) (Table 1). Due to very poor transformation efficiency of CEN.PK with these new plasmids, only strains I+H and J were generated.
Compared to strain E+H, CRTI mRNA level in strain I+H was decreased by a factor of 10 while the mRNA levels of CRTYB and CRTZ were constant (Figures 6C,D). This phenomenon was not dependent on culture conditions, as it was true in glucose and in ethanol metabolisms. A failure of CRTYB transcription termination may explain the observed diminution of CRTI mRNA level. Although TEF2t (terminator associated to CRTYB) was not tested in Curran et al. (2013) study, its efficiency may not be sufficient to promote the normal release of the entire transcription machinery at the termination site. This phenomenon may hinder the RNA polymerase fixation at CRTI promoter. Therefore, changing the CRTI transcription unit position could alter the promoter strength, demonstrating that the construction structure and more precisely the relative gene position interfered with its expression level.
Relative quantifications of mRNA levels in strain J pointed a strong decrease of CRTI and CRTYB mRNAs (Figures 6A,B). In this strain, CRTYB mRNA was absent and CRTI mRNA level was strongly decreased, while the CRTZ mRNA level was lowered only by a factor of 10. To ascertain that no recombination events could have modified the plasmid harboring the zeaxanthin pathway, we verified (restriction and sequence analysis) that all three genes were still present and correctly ordered on the pRS426/J extracted from strain J (Figure S5 in Supplementary Material). In pRS426/J, CRTI and CRTYB were in a convergent configuration, potentially leading to a collision between the two opposite RNA polymerases. This phenomenon may render difficult their progress toward the terminator. Furthermore, during the transcriptional process, the RNA polymerases progress on DNA making positive supercoils on both strands simultaneously (Liu and Wang, 1987). This may create a region of hyper-supercoiling that could possibly prevent further advancement in either direction on the template, leading to the suppression of the transcriptional processes of CRTI and CRTYB. Hence, in our experiments, CRTI mRNA level seemed to be affected by the gene position and orientation while CRTYB mRNA level was impacted only by the gene orientation.
Discussion
Our series of experiments reveal that the promoter-independent control of mRNA levels may result from several different mechanisms. The ORF nature, via the sequence related variation of mRNA half-life, may strongly influence the mRNA level. Occurrence of cryptic promoters in ORFs (Pedersen et al., 1999) might also promote or inhibit transcription independently of the promoter-induced regulation. Gene terminators are also known to influence mRNA stabilization (Curran et al., 2013; Yamanishi et al., 2013). Curran et al. (2013) reported that the terminator of CYC1 gene (CYC1t) was a poor expression enhancing terminator. Therefore, the use of CYC1t behind CRTZ may explain the low levels of its corresponding mRNA. Overall, the quasi absence of correlation between the strengths of the different promoters and their corresponding mRNA levels strongly suggests that the relative ORF positions on the plasmid may drive transcription efficiency. Experiments performed with the I and J strains reveal that CRTYB ORF nature also imposed a regulation of its transcription, and that the observed suppression of CRTI and CRTYB transcription in strain J was probably due to poor terminator (TEF2t) efficiency. As CRTZ mRNA level was the most stable over the different tested conditions, its ORF nature or associated terminator (CYC1t), or both, seemed to impose a strong transcriptional regulation.
Parts of the effects seen in these two last constructions might also be attributed to transcription interference (TI). TI is defined as the suppressive influence of one transcriptional process, directly and in cis, on a second transcriptional process (Shearwin et al., 2005). This phenomenon was well-studied with native S. cerevisiae genes (Prescott and Proudfoot, 2002; Wang et al., 2014) but only two studies addressed the case of TI in heterologous expression, demonstrating transcription inhibition effects only in the case of divergent genes (Bae et al., 2008; Lee et al., 2014). It is known that the genome of S. cerevisiae is highly compact (an ORF every 2 kb in average) and less than 6% of the convergent adjacent genes show a pattern of co-expression. This suggests that a counter-selection pressure for co-transcribed convergent genes exists (Dujon, 1996). Prescott and Proudfoot (2002) described a drastic effect on the transcription processes of two convergent genes when intergenic sequences containing genes terminators were removed. They interpreted this phenomenon by a collision, in the absence of terminators, between RNA polymerases simultaneously transcribing the two genes. These effects were abolished when the two transcriptional processes were not simultaneous, confirming the strong TI in the case of simultaneous transcription. Contrarily to previous studies (Bae et al., 2008; Lee et al., 2014), our results provide a clear indication that relative positioning of three contiguous transcription units and their orientations probably induce TI on a multicopy plasmid. Large TI effects demonstrated in our design may be related to terminators efficiency, and are probably accentuated by the absence of extra-space between our three transcription units.
We show here that the strengths of chosen promoters, as given by the available literature data, are not systematically conserved when used for the reconstruction of foreign pathways. TI, ORF nature, and possibly terminator may also counterbalance the initially imposed regulation. In strains from set 1, we observed a factor of 1,000 between CRTI and CRTZ mRNA levels, a surprising result considering that the expected regulation of mRNA levels by promoters strengths is supposedly a factor of 10 between the strongest and the weakest promoters (Sun et al., 2012). Overall, we propose that combinatorial metabolic libraries [similar to COMPACTER method (Du et al., 2012)], associating various promoters/terminators to heterologous genes and varying their positions is probably a quick and reliable method to generate diversity at the level of transcription regulation. However, due to possible unexpected transcriptional effects, we propose that a systematic analysis of all heterologous genes mRNA levels should be conducted to link the desired metabolite production level to the real pattern of transcription. This may allow researchers to select the best combination according to the production of the desired molecule.
Author Contributions
MC designed the study, made experiments, and wrote this manuscript; GT and DP designed the study and wrote this manuscript.
Conflict of Interest Statement
The authors declare that the research was conducted in the absence of any commercial or financial relationships that could be construed as a potential conflict of interest.
Acknowledgments
This work was supported by the grant 11050480 from Région Midi-Pyrénées (financial support for “Accueil d’Equipes d’Excellence”). The Ph.D. grant for MC was funded by the Région Midi-Pyrénées and ADRIAF. The authors wish to thank Jean-Luc Parrou and Marie-Ange Teste from the LISBP-INSA Toulouse for their precious help with qPCR design. MetaToul (Metabolomics & Fluxomics Facitilies, Toulouse, France3) and its staff members are gratefully acknowledged for carrying out metabolome analysis. MetaToul is part of the national infrastructure MetaboHUB-ANR-11-INBS-0010 (The French National infrastructure for metabolomics and fluxomics4). MetaToul is supported by grants from the Région Midi-Pyrénées, the European Regional Development Fund, the SICOVAL, the Infrastructures en Biologie Sante et Agronomie (IBiSa, France), the Centre National de la Recherche Scientifique (CNRS), and the Institut National de la Recherche Agronomique (INRA).
Supplementary Material
The Supplementary Material for this article can be found online at http://www.frontiersin.org/Journal/10.3389/fbioe.2015.00021/abstract
Abbreviations
GGPP, geranylgeranyl pyrophosphate; GFP, green fluorescent protein; RT-qPCR, reverse transcription quantitative PCR; qPCR, quantitative PCR; tHMG1, truncated HMG-CoA reductase.
Footnotes
References
Ajikumar, P. K., Xiao, W. H., Tyo, K. E., Wang, Y., Simeon, F., Leonard, E., et al. (2010). Isoprenoid pathway optimization for taxol precursor overproduction in Escherichia coli. Science 330, 70–74. doi: 10.1126/science.1191652
Pubmed Abstract | Pubmed Full Text | CrossRef Full Text | Google Scholar
Alper, H., Fischer, C., Nevoigt, E., and Stephanopoulos, G. (2005). Tuning genetic control through promoter engineering. Proc. Natl. Acad. Sci. U.S.A. 102, 12678–12683. doi:10.1073/pnas.0504604102
Pubmed Abstract | Pubmed Full Text | CrossRef Full Text | Google Scholar
Bae, J. Y., Laplaza, J., and Jeffries, T. W. (2008). Effects of gene orientation and use of multiple promoters on the expression of XYL1 and XYL2 in Saccharomyces cerevisiae. Appl. Biochem. Biotechnol. 145, 69–78. doi:10.1007/s12010-007-8076-0
Pubmed Abstract | Pubmed Full Text | CrossRef Full Text | Google Scholar
Blazeck, J., and Alper, H. S. (2013). Promoter engineering: recent advances in controlling transcription at the most fundamental level. Biotechnol. J. 8, 46–58. doi:10.1002/biot.201200120
Pubmed Abstract | Pubmed Full Text | CrossRef Full Text | Google Scholar
Christianson, T. W., Sikorski, R. S., Dante, M., Shero, J. H., and Hieter, P. (1992). Multifunctional yeast high-copy-number shuttle vectors. Gene 110, 119–122. doi:10.1016/0378-1119(92)90454-W
Curran, K. A., Karim, A. S., Gupta, A., and Alper, H. S. (2013). Use of expression-enhancing terminators in Saccharomyces cerevisiae to increase mRNA half-life and improve gene expression control for metabolic engineering applications. Metab. Eng. 19, 88–97. doi:10.1016/j.ymben.2013.07.001
Pubmed Abstract | Pubmed Full Text | CrossRef Full Text | Google Scholar
Da Silva, N. A., and Srikrishnan, S. (2012). Introduction and expression of genes for metabolic engineering applications in Saccharomyces cerevisiae. FEMS Yeast Res. 12, 197–214. doi:10.1111/j.1567-1364.2011.00769.x
Pubmed Abstract | Pubmed Full Text | CrossRef Full Text | Google Scholar
Donald, K. A., Hampton, R. Y., and Fritz, I. B. (1997). Effects of overproduction of the catalytic domain of 3-hydroxy-3-methylglutaryl coenzyme A reductase on squalene synthesis in Saccharomyces cerevisiae. Appl. Environ. Microbiol. 63, 3341–3344.
Du, J., Yuan, Y., Si, T., Lian, J., and Zhao, H. (2012). Customized optimization of metabolic pathways by combinatorial transcriptional engineering. Nucleic Acids Res. 40, e142. doi:10.1093/nar/gks549
Pubmed Abstract | Pubmed Full Text | CrossRef Full Text | Google Scholar
Dujon, B. (1996). The yeast genome project: what did we learn? Trends Genet. 12, 263–270. doi:10.1016/0168-9525(96)10027-5
Pubmed Abstract | Pubmed Full Text | CrossRef Full Text | Google Scholar
Fang, F., Salmon, K., Shen, M. W., Aeling, K. A., Ito, E., Irwin, B., et al. (2011). A vector set for systematic metabolic engineering in Saccharomyces cerevisiae. Yeast 28, 123–136. doi:10.1002/yea.1824
Pubmed Abstract | Pubmed Full Text | CrossRef Full Text | Google Scholar
Galdieri, L., Mehrotra, S., Yu, S., and Vancura, A. (2010). Transcriptional regulation in yeast during diauxic shift and stationary phase. OMICS 14, 629–638. doi:10.1089/omi.2010.0069
Pubmed Abstract | Pubmed Full Text | CrossRef Full Text | Google Scholar
Gari, E., Piedrafita, L., Aldea, M., and Herrero, E. (1997). A set of vectors with a tetracycline-regulatable promoter system for modulated gene expression in Saccharomyces cerevisiae. Yeast 13, 837–848. doi:10.1002/(SICI)1097-0061(199707)13:9<837::AID-YEA145>3.0.CO;2-T
Pubmed Abstract | Pubmed Full Text | CrossRef Full Text | Google Scholar
Gibson, D. G., Young, L., Chuang, R. Y., Venter, J. C., Hutchison, C. A. III, and Smith, H. O. (2009). Enzymatic assembly of DNA molecules up to several hundred kilobases. Nat. Methods 6, 343–345. doi:10.1038/nmeth.1318
Pubmed Abstract | Pubmed Full Text | CrossRef Full Text | Google Scholar
Gietz, D., St Jean, A., Woods, R. A., and Schiestl, R. H. (1992). Improved method for high efficiency transformation of intact yeast cells. Nucleic Acids Res. 20, 1425. doi:10.1093/nar/20.6.1425
Glick, B. R. (1995). Metabolic load and heterologous gene expression. Biotechnol. Adv. 13, 247–261. doi:10.1016/0734-9750(95)00004-A
Pubmed Abstract | Pubmed Full Text | CrossRef Full Text | Google Scholar
Gruber, D. F., Pieribone, V. A., Porton, B., and Kao, H. T. (2008). Strict regulation of gene expression from a high-copy plasmid utilizing a dual vector system. Protein Expr. Purif. 60, 53–57. doi:10.1016/j.pep.2008.03.014
Pubmed Abstract | Pubmed Full Text | CrossRef Full Text | Google Scholar
Karim, A. S., Curran, K. A., and Alper, H. S. (2013). Characterization of plasmid burden and copy number in Saccharomyces cerevisiae for optimization of metabolic engineering applications. FEMS Yeast Res. 13, 107–116. doi:10.1111/1567-1364.12016
Pubmed Abstract | Pubmed Full Text | CrossRef Full Text | Google Scholar
Kim, H. J., Turner, T. L., and Jin, Y. S. (2013). Combinatorial genetic perturbation to refine metabolic circuits for producing biofuels and biochemicals. Biotechnol. Adv. 31, 976–985. doi:10.1016/j.biotechadv.2013.03.010
Pubmed Abstract | Pubmed Full Text | CrossRef Full Text | Google Scholar
Kocharin, K., Chen, Y., Siewers, V., and Nielsen, J. (2012). Engineering of acetyl-CoA metabolism for the improved production of polyhydroxybutyrate in Saccharomyces cerevisiae. AMB Express. 2, 52. doi:10.1186/2191-0855-2-52
Pubmed Abstract | Pubmed Full Text | CrossRef Full Text | Google Scholar
Lee, M. E., Aswani, A., Han, A. S., Tomlin, C. J., and Dueber, J. E. (2013). Expression-level optimization of a multi-enzyme pathway in the absence of a high-throughput assay. Nucleic Acids Res. 41, 10668–10678. doi:10.1093/nar/gkt809
Pubmed Abstract | Pubmed Full Text | CrossRef Full Text | Google Scholar
Lee, T. J., Parikh, R. Y., Weitz, J. S., and Kim, H. D. (2014). Suppression of expression between adjacent genes within heterologous modules in yeast. G3 (Bethesda) 4, 109–116. doi:10.1534/g3.113.007922
Pubmed Abstract | Pubmed Full Text | CrossRef Full Text | Google Scholar
Liu, L. F., and Wang, J. C. (1987). Supercoiling of the DNA template during transcription. Proc. Natl. Acad. Sci. U.S.A. 84, 7024–7027. doi:10.1073/pnas.84.20.7024
Livak, K. J., and Schmittgen, T. D. (2001). Analysis of relative gene expression data using real-time quantitative PCR and the 2(-Delta Delta C(T)) method. Methods 25, 402–408. doi:10.1006/meth.2001.1262
Pubmed Abstract | Pubmed Full Text | CrossRef Full Text | Google Scholar
Lu, C., and Jeffries, T. (2007). Shuffling of promoters for multiple genes to optimize xylose fermentation in an engineered Saccharomyces cerevisiae strain. Appl. Environ. Microbiol. 73, 6072–6077. doi:10.1128/AEM.00955-07
Pubmed Abstract | Pubmed Full Text | CrossRef Full Text | Google Scholar
Mnaimneh, S., Davierwala, A. P., Haynes, J., Moffat, J., Peng, W. T., Zhang, W., et al. (2004). Exploration of essential gene functions via titratable promoter alleles. Cell 118, 31–44. doi:10.1016/j.cell.2004.06.013
Pubmed Abstract | Pubmed Full Text | CrossRef Full Text | Google Scholar
Neubauer, P., Lin, H. Y., and Mathiszik, B. (2003). Metabolic load of recombinant protein production: inhibition of cellular capacities for glucose uptake and respiration after induction of a heterologous gene in Escherichia coli. Biotechnol. Bioeng. 83, 53–64. doi:10.1002/bit.10645
Pubmed Abstract | Pubmed Full Text | CrossRef Full Text | Google Scholar
Partow, S., Siewers, V., Bjorn, S., Nielsen, J., and Maury, J. (2010). Characterization of different promoters for designing a new expression vector in Saccharomyces cerevisiae. Yeast 27, 955–964. doi:10.1002/yea.1806
Pubmed Abstract | Pubmed Full Text | CrossRef Full Text | Google Scholar
Pedersen, A. G., Baldi, P., Chauvin, Y., and Brunak, S. (1999). The biology of eukaryotic promoter prediction – a review. Comput. Chem. 23, 191–207. doi:10.1016/S0097-8485(99)00015-7
Prescott, E. M., and Proudfoot, N. J. (2002). Transcriptional collision between convergent genes in budding yeast. Proc. Natl. Acad. Sci. U.S.A. 99, 8796–8801. doi:10.1073/pnas.132270899
Pubmed Abstract | Pubmed Full Text | CrossRef Full Text | Google Scholar
Ramon, A., and Smith, H. O. (2011). Single-step linker-based combinatorial assembly of promoter and gene cassettes for pathway engineering. Biotechnol. Lett. 33, 549–555. doi:10.1007/s10529-010-0455-x
Pubmed Abstract | Pubmed Full Text | CrossRef Full Text | Google Scholar
Ro, D. K., Paradise, E. M., Ouellet, M., Fisher, K. J., Newman, K. L., Ndungu, J. M., et al. (2006). Production of the antimalarial drug precursor artemisinic acid in engineered yeast. Nature 440, 940–943. doi:10.1038/nature04640
Pubmed Abstract | Pubmed Full Text | CrossRef Full Text | Google Scholar
Romanos, M. A., Scorer, C. A., and Clare, J. J. (1992). Foreign gene expression in yeast: a review. Yeast 8, 423–488. doi:10.1002/yea.320080602
Shearwin, K. E., Callen, B. P., and Egan, J. B. (2005). Transcriptional interference – a crash course. Trends Genet. 21, 339–345. doi:10.1016/j.tig.2005.04.009
Pubmed Abstract | Pubmed Full Text | CrossRef Full Text | Google Scholar
Siegele, D. A., and Hu, J. C. (1997). Gene expression from plasmids containing the araBAD promoter at subsaturating inducer concentrations represents mixed populations. Proc. Natl. Acad. Sci. U.S.A. 94, 8168–8172. doi:10.1073/pnas.94.15.8168
Pubmed Abstract | Pubmed Full Text | CrossRef Full Text | Google Scholar
Steen, E. J., Chan, R., Prasad, N., Myers, S., Petzold, C. J., Redding, A., et al. (2008). Metabolic engineering of Saccharomyces cerevisiae for the production of n-butanol. Microb. Cell Fact. 7, 36. doi:10.1186/1475-2859-7-36
Pubmed Abstract | Pubmed Full Text | CrossRef Full Text | Google Scholar
Sun, J., Shao, Z., Zhao, H., Nair, N., Wen, F., Xu, J. H., et al. (2012). Cloning and characterization of a panel of constitutive promoters for applications in pathway engineering in Saccharomyces cerevisiae. Biotechnol. Bioeng. 109, 2082–2092. doi:10.1002/bit.24481
Pubmed Abstract | Pubmed Full Text | CrossRef Full Text | Google Scholar
Teste, M. A., Duquenne, M., Francois, J. M., and Parrou, J. L. (2009). Validation of reference genes for quantitative expression analysis by real-time RT-PCR in Saccharomyces cerevisiae. BMC Mol. Biol. 10:99. doi:10.1186/1471-2199-10-99
Pubmed Abstract | Pubmed Full Text | CrossRef Full Text | Google Scholar
Ukibe, K., Hashida, K., Yoshida, N., and Takagi, H. (2009). Metabolic engineering of Saccharomyces cerevisiae for astaxanthin production and oxidative stress tolerance. Appl. Environ. Microbiol. 75, 7205–7211. doi:10.1128/AEM.01249-09
Pubmed Abstract | Pubmed Full Text | CrossRef Full Text | Google Scholar
Verwaal, R., Wang, J., Meijnen, J. P., Visser, H., Sandmann, G., Van Den Berg, J. A., et al. (2007). High-level production of beta-carotene in Saccharomyces cerevisiae by successive transformation with carotenogenic genes from Xanthophyllomyces dendrorhous. Appl. Environ. Microbiol. 73, 4342–4350. doi:10.1128/AEM.02759-06
Pubmed Abstract | Pubmed Full Text | CrossRef Full Text | Google Scholar
Wang, L., Jiang, N., Wang, L., Fang, O., Leach, L. J., Hu, X., et al. (2014). 3’ Untranslated regions mediate transcriptional interference between convergent genes both locally and ectopically in Saccharomyces cerevisiae. PLoS Genet. 10:e1004021. doi:10.1371/journal.pgen.1004021
Pubmed Abstract | Pubmed Full Text | CrossRef Full Text | Google Scholar
Yamanishi, M., Ito, Y., Kintaka, R., Imamura, C., Katahira, S., Ikeuchi, A., et al. (2013). A genome-wide activity assessment of terminator regions in Saccharomyces cerevisiae provides a “terminatome” toolbox. ACS Synth. Biol. 2, 337–347. doi:10.1021/sb300116y
Pubmed Abstract | Pubmed Full Text | CrossRef Full Text | Google Scholar
Yan, G. L., Wen, K. R., and Duan, C. Q. (2012). Enhancement of beta-carotene production by over-expression of HMG-CoA reductase coupled with addition of ergosterol biosynthesis inhibitors in recombinant Saccharomyces cerevisiae. Curr. Microbiol. 64, 159–163. doi:10.1007/s00284-011-0044-9
Pubmed Abstract | Pubmed Full Text | CrossRef Full Text | Google Scholar
Keywords: metabolic engineering, Saccharomyces cerevisiae, combinatorial metabolic libraries, expression tuning, plasmid-encoded metabolic pathway
Citation: Carquet M, Pompon D and Truan G (2015) Transcription interference and ORF nature strongly affect promoter strength in a reconstituted metabolic pathway. Front. Bioeng. Biotechnol. 3:21. doi: 10.3389/fbioe.2015.00021
Received: 22 December 2014; Accepted: 12 February 2015;
Published online: 26 February 2015.
Edited by:
Shota Atsumi, University of California Davis, USAReviewed by:
Mingfeng Cao, Iowa State University, USAEthan I. Lan, National Chiao Tung University, Taiwan
Copyright: © 2015 Carquet, Pompon and Truan. This is an open-access article distributed under the terms of the Creative Commons Attribution License (CC BY). The use, distribution or reproduction in other forums is permitted, provided the original author(s) or licensor are credited and that the original publication in this journal is cited, in accordance with accepted academic practice. No use, distribution or reproduction is permitted which does not comply with these terms.
*Correspondence: Gilles Truan, Université de Toulouse, INSA, UPS, INP, LISBP, 135 Avenue de Rangueil, Toulouse F-31077, France e-mail:R2lsbGVzLnRydWFuQGluc2EtdG91bG91c2UuZnI=