 Xavier Garcia-Ortega
 Francisco Valero
- Bioprocess Engineering and Applied Biocatalysis Group, Departament d’Enginyeria Química, Escola d’Enginyeria, Universitat Autònoma de Barcelona, Bellaterra, Spain
The most commonly used cell disruption procedures may present lack of reproducibility, which introduces significant errors in the quantification of intracellular components. In this work, an approach consisting in the definition of an overall key performance indicator (KPI) was implemented for a lab scale high-pressure homogenizer (HPH) in order to determine the disruption settings that allow the reliable quantification of a wide sort of intracellular components. This innovative KPI was based on the combination of three independent reporting indicators: decrease of absorbance, release of total protein, and release of alkaline phosphatase activity. The yeast Pichia pastoris growing on methanol was selected as model microorganism due to it presents an important widening of the cell wall needing more severe methods and operating conditions than Escherichia coli and Saccharomyces cerevisiae. From the outcome of the reporting indicators, the cell disruption efficiency achieved using HPH was about fourfold higher than other lab standard cell disruption methodologies, such bead milling cell permeabilization. This approach was also applied to a pilot plant scale HPH validating the methodology in a scale-up of the disruption process. This innovative non-complex approach developed to evaluate the efficacy of a disruption procedure or equipment can be easily applied to optimize the most common disruption processes, in order to reach not only reliable quantification but also recovery of intracellular components from cell factories of interest.
Introduction
Pichia pastoris has been widely used as cell factory in the last years (Potvin et al., 2012). The cytoplasm of yeast cells is a rich source of bio-products, such proteins, cytoplasmic enzymes, or polysaccharides valuable in biotechnology, pharmacology, and food industry (Liu et al., 2013b). The quantitative recovery of the intracellular compounds is determined by the disruption processes, which may affect the stability and the biological activity of the desired product. Thus, the selection of a suitable cell disruption method to recover these compounds and its reliable quantification is very important (Liu et al., 2013a). Disruption can be considered a general term that describes different processes related to cellular disintegration that range from slight release of internal metabolites to full cell breakage (Spiden et al., 2013). The efficiency of cell disruption implies selective and complete release of the product to achieve a high recovery of the target products, reduced contaminants, and minimal micronization of cell debris (Harrison, 1991; Middelberg, 1995; Balasundaram et al., 2009).
The existence of cell wall in the yeast cells requires that the disruption and release of intracellular components destructs the strength-provide components of the wall, in the case of yeasts, namely glucans (Liu et al., 2013b). The basic structural components of the yeast cell wall were identified by Smith et al. (2000). In the case of P. pastoris disruption procedures, the use of methanol in the cultivation has a relevant impact on the cell wall in comparison with other carbon sources, such glycerol or glucose. An important widening of cell wall thickness of P. pastoris cells growing on methanol was described by Canales et al. (1998), which rather increased twice. Furthermore, after the observation of the difficulties to obtain reproducible and reliable results for disruption methods for P. pastoris cells grown on methanol, one can consider that more severe methods and operating conditions than the standard reported for Escherichia coli or Saccharomyces cerevisiae are needed (Balasundaram et al., 2009).
Several methods for disruption of microbial cells are described in the literature; the most commonly used are summarized in some reviews (Harrison, 1991; Middelberg, 1995; Geciova et al., 2002). Most of them have been applied in Pichia: sonication (Lin et al., 2007), bead milling (Pfeffer et al., 2012; Grillitsch et al., 2014), enzymatic and chemical lysis (Naglak and Henry, 1990; Boettner et al., 2002), cell permeabilization (Shepard et al., 2002; Lenassi Zupan et al., 2004), and high-pressure homogenization (Johnson et al., 2003; Tam et al., 2012; Gurramkonda et al., 2013). The last one is described as the most used for large scale cell disruption processes in the biopharmaceutical manufacturing industry (Fonseca and Cabral, 2002; Lin et al., 2007).
Despite cell disruption is a field widely studied, among the works published in the literature, there is not agreement about the reporting indicators that should be chosen for its study. The selection of reliable and simple indicators to measure the degree of cellular disruption is a key point to assess the efficiency of the disruption methods. These indicators must not be degraded in the rupture processes and released from the cell consistently through different cycles. Usually, the measure of the target protein released is the best method to quantify the efficiency of the cell rupture (Middelberg, 1995). However, in some cases, the release of other intracellular components can be used as an alternative to determine the extent of cell disruption. Direct and indirect measurements indicating the cellular disruption degree, using S. cerevisiae as model, have been recently reviewed concluding that different indicators provide different information to monitor the level of disruption (Spiden et al., 2013). Thus, the combination of different reporting indicators in a single parameter of the disruption efficiency is useful to integrate the information given by each indicator, which can facilitate the efficacy study of the process.
Accurate quantification of intracellular proteins, enzymatic activities, and metabolites is basic to carry out research in biochemistry and biotechnology, from determining cellular components to metabolomics and systems biology studies. The reliability of the target component quantification relies on whether the cell disruption process is efficient and reproducible due that the use of non-optimized procedures may not allow to achieve the complete release of the elements that are being studied, which could lead to important errors in the determination of this cellular components. Thus, it is essential that the cell disruption procedures used always assures efficacy and reproducibility. Furthermore, since P. pastoris is commonly used as a recombinant production cell factory, the reliable recovery and quantification of the intracellular product is of capital interest to completely evaluate the efficiency of the bioprocess (Gogate and Pandit, 2008; Pfeffer et al., 2011).
In this sense, the aim of this work is to present a methodology to determine the disruption settings that allows the reliable quantification of a wide sort of intracellular components. This approach can be applied to the most used cell disruption processes. Specifically, the work aims to characterize and optimize the working conditions of a lab scale HPH using P. pastoris suspensions. This study was performed through the definition of an overall key performance indicator (KPI) based on the combination of the following reporting indicators: decrease of absorbance, release of total protein, and release of alkaline phosphatase activity. The reporting indicators have been selected among the main parameters used in other references from the literature, those being preferred, which are simple, rapid, and do not require expensive equipment (Middelberg, 1995). Since this KPI aims to be applicable to study different disruption processes, it is important that the reporting indicators selected are not specific for particular organisms, as could be some intracellular small molecules or metabolites. The usefulness of the methodology has been confirmed for a bigger process scale using a pilot plant HPH. Finally, the optimal results for HPH were compared with other commonly used disruption methodologies.
Materials and Methods
Microorganism
Suspensions of a wild-type X-33 P. pastoris strain growing on mixed feeds of glucose and methanol were obtained from steady state chemostat cultures. The cultivations were set at a D of 0.09 h−1 by feeding a defined growth medium containing 50 g⋅L−1 of glucose/methanol mixture (80% glucose/20% methanol, w/w) as a carbon source, dissolved oxygen levels were kept at a minimum of 15% of air saturation, pH was controlled at 5, and temperature at 25°C. More details about the cultivation conditions can be found elsewhere (Jordà et al., 2012).
Cell Disruption Methodologies
Prior to the disruption processes, the cell suspensions were always cleaned three times by centrifugation and resuspension in fresh PBS. The clean suspensions were vortexed vigorously for homogenizing the samples and dispersing any cellular aggregates. All the samples were kept on ice within the disruption steps in order to avoid the activity of the endogenous proteases. To discard the cell debris after the cell rupture procedures, the disrupted samples were always clarified by centrifugation (4200 × g, 4°C, 15 min).
High-Pressure Homogenization
High-pressure homogenizer (HPH) is the most employed method for the disruption of microbial cells in large scale bioprocesses. The cell suspension is released at high pressure through a specially designed valve assembly, where the cells are disrupted as a consequence of the different forces produced by the interaction between the fluid and the solid walls of the valve (Kleinig and Middelberg, 1998).
The One-Shot Cell Disrupter (Constant Systems Ltd., Warwickshire, UK) was used at lab scale, being 8 mL the volume of the disruption samples. In previous studies, different pressures were compared in order to optimize the method. Two kbars and up to three passes were selected as the best working pressure and maximal number of passes (N) for P. pastoris as a compromise between the efficacy of disruption and the amount of foams produced during the disruption passes, which introduces lack of reproducibility and uncertainty in the process (Van Hee et al., 2004).
Additionally, at pilot plant scale, the homogenizer used was the TS Series Cabinet Disruption System (Constant Systems Ltd., Warwickshire, UK), being 250 mL the volume of the disruption samples. The working pressure was 2.7 kbar, the highest of the equipment, because better disruption results were observed without a substantial increase in foaming production. It is accordingly to its exponential dependence previously referred for HPH (Middelberg, 1995).
Bead Milling
It is a standard cell disruption in which the intracellular cell components are released after the cell cracking caused by the collisions between beads and cells (Ricci-Silva et al., 2000). The performed procedure using glass beads (Sigma-Aldrich G-9268, 425–600 μm) was adapted from the literature (Sreekrishna et al., 1989). The disruption mixture composed by equal volumes of cell suspension with equivalent initial OD (OD0) of 25 and glass beads were vortexed for 1 min 10 times, each followed by 1 min on ice.
Cell Permeabilization
It is an alternative method for the recovery of intracellular proteins from yeast and other microbial cells and organisms, which aims avoiding the common disadvantages of high-pressure homogenization, such as the own complex background of the host producer and mechanical stresses that may affect the recovery and biological activity of the target protein (Somkuti et al., 1998). The used protocol was adapted from a previous published work (Shepard et al., 2002). This is based on suspending and incubating the cells in an aqueous solution containing N,N-dimethyltetradecylamine. The working conditions were as follows: 5 g⋅L−1 of N,N-dimethyltetradecylamine, equivalent initial OD (OD0) of 9, and incubation time of 15 h.
Analytical Methods
Optical Density
Optical density (OD) at 600 nm is commonly used to determine cellular concentration. OD measures, in absorbance units (AU). It can be easily converted to dry cell weight values (DCW, g⋅L−1) using the following conversion factor: OD (AU) × 0.2 = DCW (g⋅L−1) (Resina et al., 2005). Additionally, in the presented work, OD has been used as a direct measure of the cell integrity of the samples; hence, a relative decrease of OD was associated to the proportion of cells disrupted (Spiden et al., 2013). All spectrophotometric analyses were taken in triplicate.
Total Protein Released
Total protein released (TPR) was considered a suitable indirect performance indicator to be correlated to disruption efficiency (Middelberg, 1995). It was determined by Bradford assay, which was performed with Coomassie Plus™ Protein Assay Reagent (Pierce, Rockford, IL, USA) using a bovine albumin as standard. TPR assays were taken in triplicate and the relative SD (RSD) was about 5%.
Alkaline Phosphatase Activity Released
As an intracellular enzyme, the alkaline phosphatase activity released (APAR) gives not only an indication of the protein released but also the preservation of enzymatic activity, which was considered as a reliable indirect performance index (Melendres et al., 1993). The protocol was adapted from the literature (Berstine et al., 1973). Alkaline phosphatase was assayed at pH 10.0 using p-nitrophenyl phosphate as substrate, incubation time at 37°C was 20 min, after which time absorbance was measured at 410 nm. APAR assays were taken in triplicate and the RSD was about 6%.
Data Analysis
The OD decrease (ODD) was determined as a normalized quotient between the pre-homogenized (OD0), and the post-homogenized (ODH) values (Eq. 1):
In the evaluation of the disruption efficacy, the effect of the initial OD was one of the variables studied. Since this parameter is directly related to the total amount of biomass that will be disrupted, TPR and APAR will be affected by this variable. Thus, in order to be able to compare disruption results between samples with different biomass content, these performance indicators were always normalized with the pre-homogenized OD of the samples, and hence, using the specific form; specific TPR (mg⋅OD−1⋅L−1); specific APAR (AU⋅OD−1⋅L−1).
In the parity plot depicted in Figure 1, all the performance indicators values (Yk) were normalized with the corresponding maximal value observed at the best process conditions (Yk,max). In this way, the disruption indicators were scaled and shown together in the same plot.
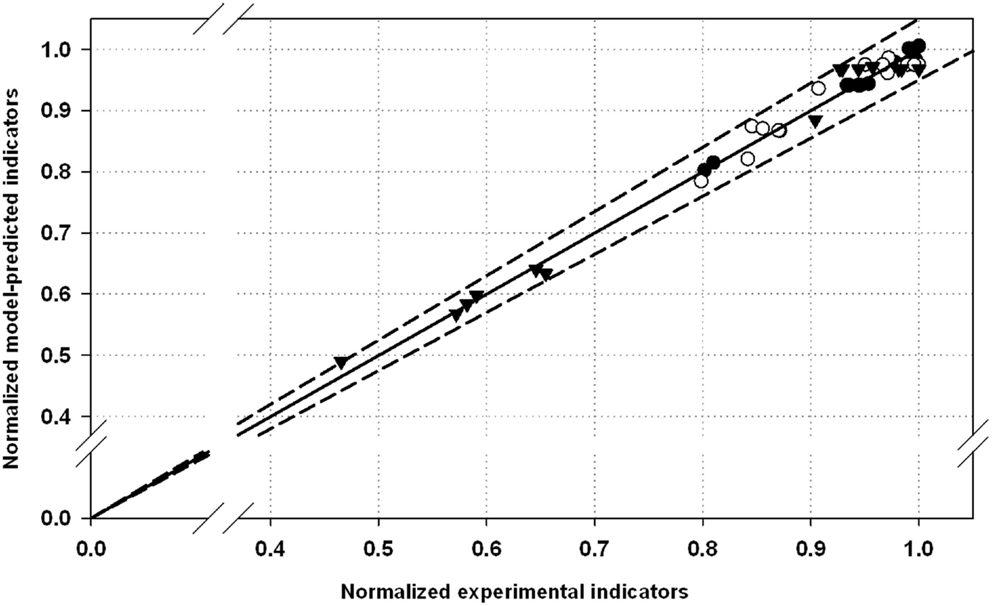
Figure 1. Normalized parity plot for the selected performance indicators with 5% of error: (•), optical density decrease (ODD); (▾), total protein released (TPR); (∘), alkaline phosphatase activity released (APAR). Maximal values for ODD, TPR, and APAR were 88.3%, 85 mg⋅OD−1⋅L−1, and 0.27 AU⋅OD−1⋅L−1, respectively.
Experimental Set-Up and Statistical Analysis for the Design of Experiments
The effect of OD0 and N on ODD, TPR, and APAR was studied by means of a Box–Wilson Central Composite Design (CCD) and response surface methodology (RSM). The CCD performed was a face-centered design (CCF), which was composed by 13 experiment based in two variables having 3 levels each and 5 central points for replication. The OD0 and N range were 20–100 and 1–3, respectively. These ranges were selected from results obtained in preliminary disruption experiments. The empirical response surfaces were built from the values of ODD, specific TPR, and specific APAR. The data results were fit to the empirical model expressed at Eq. 3:
where, X1 = OD0, X2 = N; k = 1 for ODD, k = 2 for TPR, and k = 3 for APAR.
The Sigma Plot statistical package (SigmaPlot 11.0; Systat Software, Inc., Chicago, IL, USA) was used in order to perform the statistical analysis and fit the response surfaces. The quality of the fit is expressed by the coefficient of determination R2 obtained by regression analysis. Additionally, a lack of fit test was performed in order to compare the experimental error to the prediction error. The overall significance of the model was determined by analysis of variance (ANOVA) F-test, whereas the significance of each coefficient was determined by the corresponding t-test. SE of the estimate (SEE, %) was also calculated for all three models to test their estimation capabilities.
Results and Discussion
Characterization of the HPH by Means of DoE
Design of experiments (DoE) and the RSM were used to describe the effects of OD0 and N in the cell disruption of P. pastoris using a HPH. ODD, TPR, and APAR measures were used as quantitative indicators of the disruption degree. This work seeks to take into account more than one reporting parameter for the disruption efficiency evaluation. The experimental results presented were used to estimate the coefficients of the quadratic polynomial equation described in the Eq. 3 (Table 1).
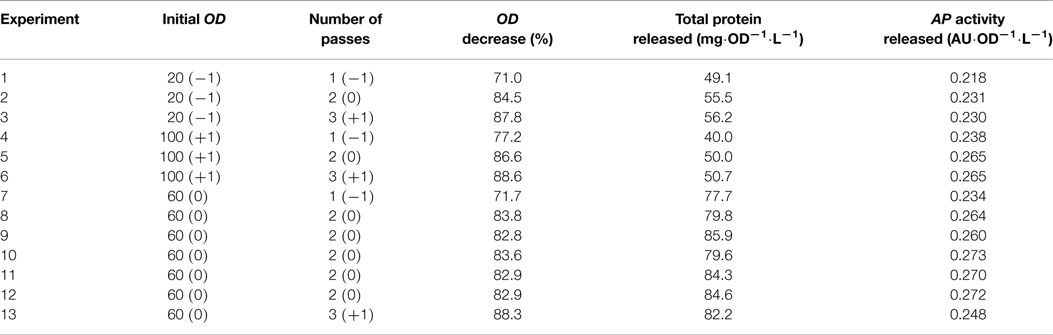
Table 1. Experimental set-up for a CCF design for two factors, matrix design and response.
Table 2 outlines the estimated coefficients determined for the models. The ANOVA F-test associated p-value can be used as indicator of the statistical significance of the coefficients on the response. Coefficients without significance are those with p-value >0.05. The high values of R2 and low values of SEE, always below 4%, point out a proper goodness of the fit for all the models.
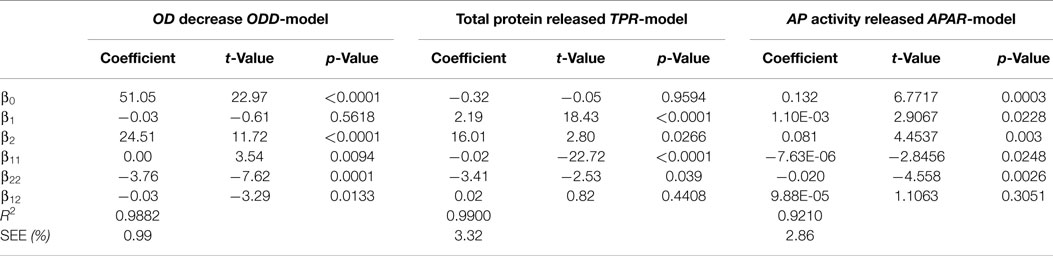
Table 2. Estimated coefficients of the models and ANOVA analysis for the three disruption models in which the experimental results were fitted to the following equation:
where, i = 1 for OD0, i = 2 for N; k = 1 for ODD, k = 2 for TPR, and k = 3 for APAR.
Additionally, a parity plot including all the experimental and model-predicted data is used to present graphically the estimation capabilities of the models (Figure 1). All the experimental points are within the range 5% of error of the fitted model. This also confirms the robustness of the models estimating disruption efficacy in terms of the performance indexes studied.
3-D graphs show the effects of the key selected variables in the responses (Figure 2). For the ODD-model, OD0 does not have a clear influence in the response, so the cell concentration of the samples does not influence the loss of cell integrity within the range studied. In contrast, N seems to affect the outcome. The higher number of passes, the better result is. However, the difference between two and three passes is slight, what could be related to a plateau effect on the cell rupture phenomenon with increasing N. In the case of the TPR-model, the OD0 causes a strong effect in the outcome resulting to a maximal response for intermediate values of initial OD. The cell breaking processes that occurs with intermediate cell concentrations seems to be optimal to recover the maximal amount of total protein. N does not affect significantly, and hence, one single pass through the HPH is enough to let it out most of the total protein that can be released. For the APAR-model, the differences in the response using different conditions are clearly slighter. However, a double plateau effect in both studied variables can be observed, so medium and high OD0 and N leads to high responses of the reporting parameters. Since TPR and APAR are indirect measures, the results obtained are not only due to cell rupture but also to other processes that can degrade the proteins and may have an important influence on the results. Physical and chemical effects, as well as the action of the proteases of the host cell are considered as the main causes of this degradation. Similarly, it is important to bear in mind that these parameters are also conditioned by the foaming formation during homogenization, what could lead to an inaccurate quantification of the parameters (Van Hee et al., 2004; Tam et al., 2012). Normally, these effects occur on processes aiming to recover the maximal amount of protein as a target product, so it is important that models also take it into account. This fact is corroborated by the slightly higher SEE obtained for TPR and APAR models in comparison with the ODD-model.
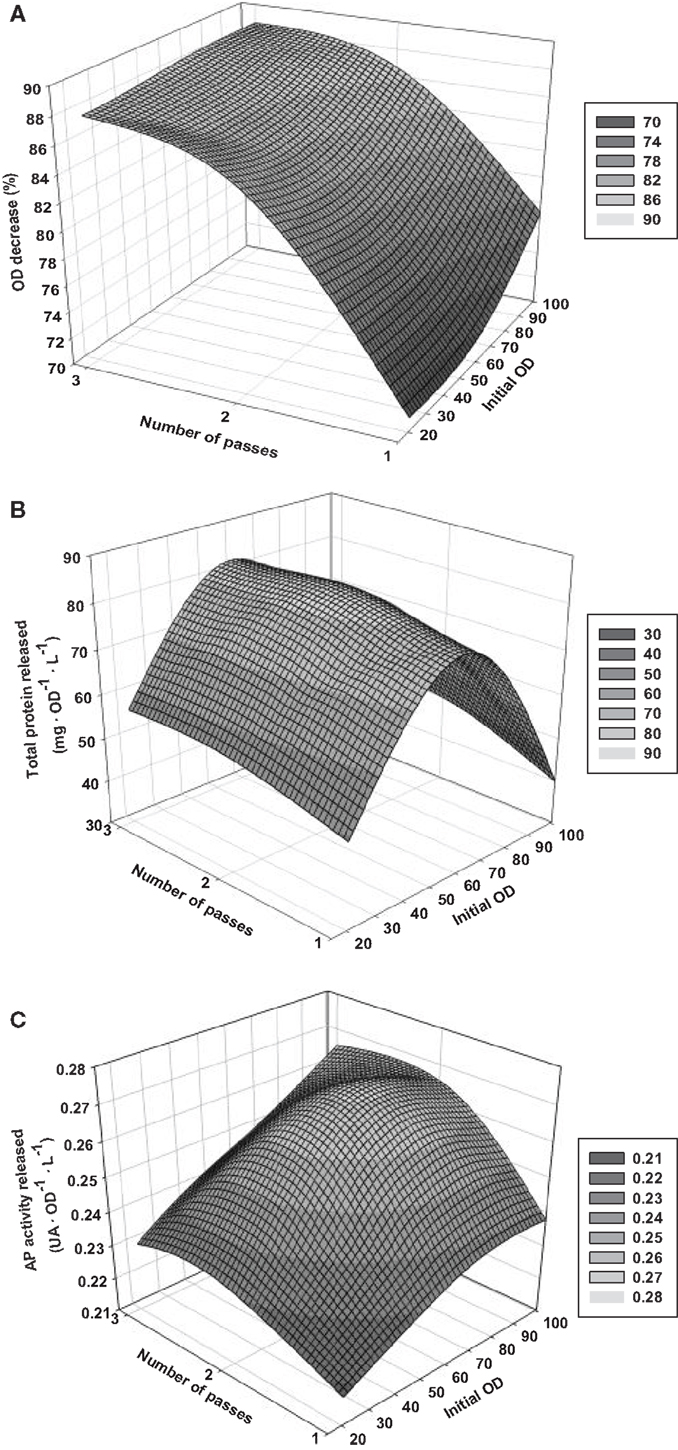
Figure 2. Response surface graphs based on the results of the DoE performed. (A) Optical density decrease (ODD); (B) total protein released (TPR); (C) AP activity released (APAR).
Identifying the Optimal Conditions for HPH
According to the results shown and discussed in the previous section, different reporting parameters must be taken into account for analyzing accurately the efficiency of the disruption procedures. Using a lab scale HPH, three models have been defined in order to maximize the ODD, TPR, and APAR with two operational variables, OD0 and N. Nevertheless, since different operational conditions must be used to achieve optimal results of the diverse performance indicators, it is of great interest to define an overall performance indicator that can be stated as a global KPI. Thus, this KPI is used as a global quantification parameter of disruption efficiency and it is calculated as follows:
where is the normalized Yk calculated dividing by its maximal value obtained Yk,max; αk is a weighting factor, being ∑ αk = 1. 0; k = 1 for ODD, k = 2 for TPR, and k = 3 for APAR.
From the results obtained after evaluating the effect of the different variables with the KPI (Table 3), it is shown that the N value that maximizes the KPI is 2 in any of the analyzed cases. Nevertheless, the OD0 optimal values vary between 60 and 80.
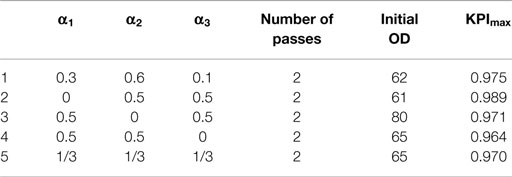
Table 3. Maximal overall performance indicator (KPImax) obtained with a different set of weighting factors and their corresponding number of passes and initial OD.
Among the different weighting criteria, the one that does not take into account the TPR is the option that results into a higher difference in the optimal OD0. This fact leads to conclude that the TPR is the key parameter that causes the major differences in the disruption efficiency. However, since this work seeks to take into account more than one reporting parameter, the final selected criterion was the one that took into consideration all the indicators but giving to the TPR weighting factor as a higher value.
Consequently, the optimal working conditions of the studied HPH have been defined as: working pressure, 2 kbar; OD0, 60; N, two passes. These settings are close to the operational conditions proposed for different commercial HPH disrupting bacteria and yeast (Bury et al., 2001; Spiden et al., 2013). Nevertheless, as a significant novelty, the recommended conditions given in the presented work has been determined as optimal through the use of DoE and an overall KPI based on the combination of simple cell disruption indicators. These process conditions are clearly more advantageous than those suggested for P. pastoris disruption by Tam et al. (2012) in which the N value proposed is 20, resulting into lower overall disruption efficiencies. Although other authors that published previous works in the field concluded that cell concentration does not have an important effect on the disruption efficiency (Brookman, 1974; Middelberg, 1995; Siddiqi et al., 1997; Van Hee et al., 2004; Tam et al., 2012), revising accurately their results on figures, slight differences were observed. The mentioned differences in the results due to the cell concentration are in the same order of magnitude that the described in the present work. Since the aim of this work is to achieve and assure a very accurate, reliable, and reproducible cell disruption procedure; consequently, it has been concluded that the effect of the cell concentration is a significant factor that must be taken into account for optimizing the performance of a HPH.
Comparison among the Alternative Disruption Methodologies
In order to compare the performance of the HPH with some common alternative disruption procedures, bead milling and cell permeabilization were also carried out with the same samples of P. pastoris. The previously used quantitative indicators; ODD, TPR, and APAR were also considered as reporting parameters of the disruption efficiency. Results obtained for each procedure are summarized in Figure 3. The operating conditions for the HPH were the optimal determined in the previous section. For the other disruption methods, incubation time, number of passes (N), and cell and reagent concentrations (OD0 ; R) were selected following a heuristic procedure and adapted protocols, as described in the Section “Materials and Methods” (data not shown).
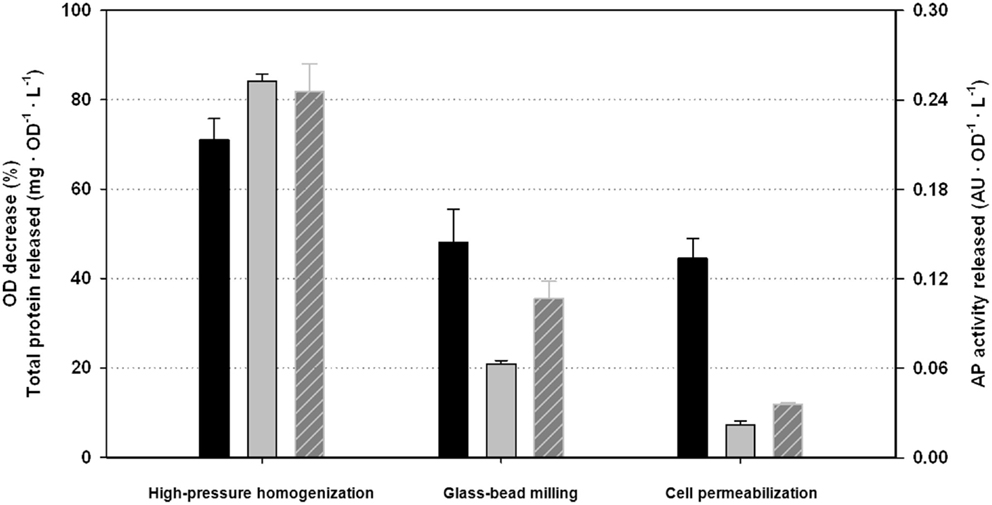
Figure 3. Comparison of the performance indicators among the alternative disruption methods studied: black, optical density decrease (ODD); gray, total protein released (TPR); with stripes, AP activity released (APAR).
As can be stated from all three single performance indexes, results obtained with the HPH were clearly better than using the other alternative procedures. TPR and APAR results using HPH were about fourfold higher than using other methodologies. ODD results were also significantly higher, at least 50% better. Thus, one can conclude that studying intracellular components, the results obtained with HPH will be significantly more consistent and reliable than using other common methods. These results are in accordance with the literature comparing different methods for cell disruption. The use of HPH is preferred due to the higher disruption efficiencies obtained and the possibility to scale-up the processes However, the higher cost of the HPH equipment and maintenance are important drawbacks to be taken into account in comparison with other procedures (Geciova et al., 2002; Balasundaram et al., 2009).
From the presented results, it is also important to point out that the profile of the different performance indicators studied is certainly different among the different disruption methodologies. This fact reinforces the need to consider more than one indicator in order to analyze accurately the efficiency of any disruption processes.
Working Conditions Comparison between HPH at Lab and Pilot Plant Scale
In order to compare the performance parameters at a bigger scale, similar working conditions were evaluated for an equivalent HPH at pilot plant scale but with operating pressure 2.7 kbar, as previously justified in Section “Materials and Methods.” Cell disruption procedures for two different OD0, 60 and 100, were performed. The N range studied was between one and three passes. The disruption efficiency obtained for OD0 = 60 was significantly higher than those for OD0 = 100 (data not shown). Consequently, OD0 = 60 was selected for the comparison between lab and pilot plant scale HPH. The results are presented in Table 4.
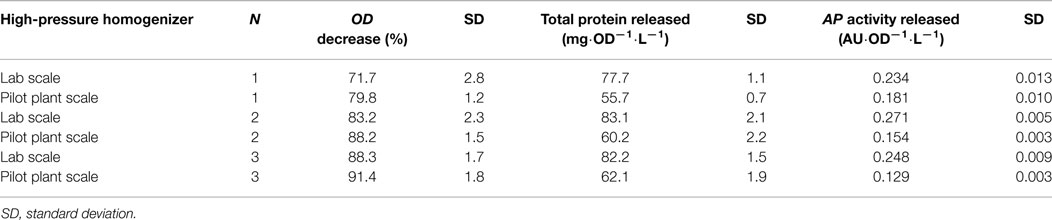
Table 4. Comparison table of the performance indicators for the HPH at different scales using samples at OD0 = 60.
In terms of ODD, the efficacy of the pilot plant scale is slightly better, especially in the first passes. However, the efficiency decreases significantly for both TPR and APAR. Longer disruption (residence) times for the pilot plant HPH, as well as different geometry of the equipment could be feasible reasons for this fact. The decrease of APAR in pilot plant scale could be related with proteolysis activity of the endogenous proteases during the longer disruption times.
Afterwards, using the criteria based on the KPI and selecting the same weighting factors that in the lab scale (detailed in a previous section), the optimal working conditions at pilot plant scale were determined. These were working pressure, 2.7 kbar; OD0, 60; N, three passes. Since a substantial difference was observed in the disruption performance parameters either using two or three passes, it has been conclude that for this pilot plant HPH working with three passes is more effective.
Conclusion
A DoE was conducted to study the effect on the disruption of OD0 and N in a lab scale HPH. Three different performance indicators were selected for evaluating the cell disruption degree: ODD, TPR, and APAR. The optimal working conditions of the HPH at lab scale were determined by means of the definition of an overall KPI, because of the need to consider different indicators for analyzing accurately the efficiency of the disruption processes. Thus, results obtained led to the following optimal operational conditions: 2 kbar; OD0, 60; N, two passes. This disruption method was compared with other commonly used procedures, bead milling and cell permeabilization, showing a disruption efficiency significantly higher for all the reporting parameters studied. These differences were up to fourfold higher in HPH for TPR and APAR.
Finally, the developed approach was also applied to a pilot plant scale HPH obtaining similar results for the ODD. Nevertheless, an important decrease were observed in the TPR and APAR indicators, what could be caused by the effect of the endogenous proteases, accompanied by longer residence times and different geometry of the equipment. In this case, optimal working conditions were: 2.7 kbar; OD0, 60; N, three passes.
Optical density decrease, TPR, and APAR can be stated as general disruption indicators since similar release pattern is expected for other intracellular components of interest. The methodology described to evaluate the efficacy of a disruption procedure or equipment can be applied to optimize these processes, which aim reliable quantification of intracellular cell components. From the results presented in this work, one can conclude that using non-optimized cell disruption procedures can introduce important error in the assays and processes derived from it. Therefore, the quantification of intracellular components, such proteins, metabolites, and other cellular elements of interest, may not be accurate. In addition, the important decrease in recovery yields due to use of non-optimized cell disruption procedures may affect dramatically the efficiency of a bioprocess.
This article demonstrates the importance of the efficiency in cell disruption procedures for research studies derived from the quantification of intracellular components. Furthermore, the contribution is expected to have a big interest in bioprocesses for the recovery of the intracellular components of different cell factories, such recombinant or homologous proteins and enzymes, metabolites, and others.
Conflict of Interest Statement
The authors declare that the research was conducted in the absence of any commercial or financial relationships that could be construed as a potential conflict of interest.
Abbreviations
APAR, alkaline phosphatase activity released (AU·OD−1·L−1); DoE, design of experiments; HPH, high-pressure homogenization; KPI, key performance indicator; N, number of passes; OD, optical density; OD0, initial OD; ODD, OD decrease, %; RSD, relative SD, %; RSM, response surface methodology; SEE, SE of the estimate, %; TPR total protein released (mg·OD−1·L−1).
References
Balasundaram, B., Harrison, S., and Bracewell, D. G. (2009). Advances in product release strategies and impact on bioprocess design. Trends Biotechnol. 27, 477–485. doi: 10.1016/j.tibtech.2009.04.004
Berstine, E. G., Hooper, M. L., Grandchamp, S., and Ephrussi, B. (1973). Alkaline phosphatase activity in mouse teratoma. Proc. Natl. Acad. Sci. U.S.A. 70, 3899–3903. doi:10.1073/pnas.70.12.3899
Boettner, M., Prinz, B., Holz, C., Stahl, U., and Lang, C. (2002). High-throughput screening for expression of heterologous proteins in the yeast Pichia pastoris. J. Biotechnol. 99, 51–62. doi:10.1016/S0168-1656(02)00157-8
Brookman, J. S. G. (1974). Mechanism of cell disintegration in a high pressure homogenizer. Biotechnol. Bioeng. 16, 371–383. doi:10.1002/bit.260160307
Bury, D., Jelen, P., and Kaláb, M. (2001). Disruption of Lactobacillus delbrueckii ssp. bulgaricus 11842 cells for lactose hydrolysis in dairy products: a comparison of sonication, high-pressure homogenization and bead milling. Innov. Food Sci. Emerg. Technol. 2, 23–29. doi:10.1016/S1466-8564(00)00039-4
Canales, M., Buxadó, J. A., Heynngnezz, L., and Enríquez, A. (1998). Mechanical disruption of Pichia pastoris yeast to recover the recombinant glycoprotein Bm86. Enzyme Microb. Technol. 23, 58–63. doi:10.1016/S0141-0229(98)00012-X
Fonseca, L. P., and Cabral, J. M. S. (2002). Penicillin acylase release from Escherichia coli cells by mechanical cell disruption and permeabilization. J. Chem. Technol. Biotechnol. 77, 159–167. doi:10.1002/jctb.541
Geciova, J., Bury, D., and Jelen, P. (2002). Methods for disruption of microbial cells for potential use in the dairy industry – a review. Int. Dairy J. 12, 541–553. doi:10.1016/S0958-6946(02)00038-9
Gogate, P. R., and Pandit, A. B. (2008). Application of cavitational reactors for cell disruption for recovery of intracellular enzymes. J. Chem. Technol. Biotechnol. 83, 1083–1093. doi:10.1002/jctb.1898
Grillitsch, K., Tarazona, P., Klug, L., Wriessnegger, T., Zellnig, G., Leitner, E., et al. (2014). Isolation and characterization of the plasma membrane from the yeast Pichia pastoris. Biochim. Biophys. Acta 1838, 1889–1897. doi:10.1016/j.bbamem.2014.03.012
Gurramkonda, C., Zahid, M., Nemani, S. K., Adnan, A., Gudi, S. K., Khanna, N., et al. (2013). Purification of hepatitis B surface antigen virus-like particles from recombinant Pichia pastoris and in vivo analysis of their immunogenic properties. J. Chromatogr. B Analyt. Technol. Biomed. Life Sci. 940, 104–111. doi:10.1016/j.jchromb.2013.09.030
Harrison, S. T. (1991). Bacterial cell disruption: a key unit operation in the recovery of intracellular products. Biotechnol. Adv. 9, 217–240. doi:10.1016/0734-9750(91)90005-G
Johnson, S. K., Zhang, W., Smith, L. A., Hywood-Potter, K. J., Swanson, S. T., Schlegel, V. L., et al. (2003). Scale-up of the fermentation and purification of the recombinant heavy chain fragment C of botulinum neurotoxin serotype F, expressed in Pichia pastoris. Protein Expr. Purif. 32, 1–9. doi:10.1016/j.pep.2003.07.003
Jordà, J., Jouhten, P., Cámara, E., Maaheimo, H., Albiol, J., and Ferrer, P. (2012). Metabolic flux profiling of recombinant protein secreting Pichia pastoris growing on glucose:methanol mixtures. Microb. Cell Fact. 11, 57. doi:10.1186/1475-2859-11-57
Kleinig, A. R., and Middelberg, A. P. J. (1998). On the mechanism of microbial cell disruption in high-pressure homogenisation. Chem. Eng. Sci. 53, 891–898. doi:10.1016/S0009-2509(97)00414-4
Lenassi Zupan, A., Trobec, S., Gaberc-Porekar, V., and Menart, V. (2004). High expression of green fluorescent protein in Pichia pastoris leads to formation of fluorescent particles. J. Biotechnol. 109, 115–122. doi:10.1016/j.jbiotec.2003.11.013
Lin, D. Q., Dong, J. N., and Yao, S. J. (2007). Target control of cell disruption to minimize the biomass electrostatic adhesion during anion-exchange expanded bed adsorption. Biotechnol. Prog. 23, 162–167. doi:10.1021/bp060286x
Liu, D., Lebovka, N. I., and Vorobiev, E. (2013a). Impact of electric pulse treatment on selective extraction of intracellular compounds from Saccharomyces cerevisiae yeasts. Food Bioprocess Technol. 6, 576–584. doi:10.1007/s11947-011-0703-7
Liu, D., Zeng, X. A., Sun, D. W., and Han, Z. (2013b). Disruption and protein release by ultrasonication of yeast cells. Innov. Food Sci. Emerg. Technol. 18, 132–137. doi:10.1016/j.ifset.2013.02.006
Melendres, A. V., Honda, H., Shiragami, N., and Unno, H. (1993). Enzyme release kinetics in a cell disruption chamber of a bead mill. J. Chem. Eng. Jpn. 26, 148–152. doi:10.1252/jcej.26.148
Middelberg, A. P. J. (1995). Process-scale disruption of microorganisms. Biotechnol. Adv. 13, 491–551. doi:10.1016/0734-9750(95)02007-P
Naglak, T. J., and Henry, W. Y. (1990). “Protein release from the yeast Pichia pastoris by chemical permeabilization: comparison to mechanical disruption and enzymatic lysis,” in Separations for Biotechnology, 2 Edn, ed. D. L. Pyle (Dordrecht: Springer), 55–64.
Pfeffer, M., Maurer, M., Köllensperger, G., Hann, S., Graf, A. B., and Mattanovich, D. (2011). Modeling and measuring intracellular fluxes of secreted recombinant protein in Pichia pastoris with a novel 34S labeling procedure. Microb. Cell Fact. 10, 47. doi:10.1186/1475-2859-10-47
Pfeffer, M., Maurer, M., Stadlmann, J., Grass, J., Delic, M., Altmann, F., et al. (2012). Intracellular interactome of secreted antibody Fab fragment in Pichia pastoris reveals its routes of secretion and degradation. Appl. Microbiol. Biotechnol. 93, 2503–2512. doi:10.1007/s00253-012-3933-3
Potvin, G., Ahmad, A., and Zhang, Z. (2012). Bioprocess engineering aspects of heterologous protein production in Pichia pastoris: a review. Biochem. Eng. J. 64, 91–105. doi:10.1016/j.bej.2010.07.017
Resina, D., Cos, O., Ferrer, P., and Valero, F. (2005). Developing high cell density fed-batch cultivation strategies for heterologous protein production in Pichia pastoris using the nitrogen source-regulated FLD1 promoter. Biotechnol. Bioeng. 91, 760–767. doi:10.1002/bit.20545
Ricci-Silva, M. E., Vitolo, M., and Abrahão-Neto, J. (2000). Protein and glucose 6-phosphate dehydrogenase releasing from baker’s yeast cells disrupted by a vertical bead mill. Process Biochem. 35, 831–835. doi:10.1016/S0032-9592(99)00151-X
Shepard, S. R., Stone, C., Cook, S., Bouvier, A., Boyd, G., Weatherly, G., et al. (2002). Recovery of intracellular recombinant proteins from the yeast Pichia pastoris by cell permeabilization. J. Biotechnol. 99, 149–160. doi:10.1016/S0168-1656(02)00182-7
Siddiqi, S. F., Titchener-Hooker, N. J., and Shamlou, P. A. (1997). High pressure disruption of yeast cells: the use of scale down operations for the prediction of protein release and cell debris size distribution. Biotechnol. Bioeng. 55, 642–649. doi:10.1002/(SICI)1097-0290(19970820)55:4<642::AID-BIT6>3.0.CO;2-H
Smith, A. E., Moxham, K. E., and Middelberg, A. P. J. (2000). Wall material properties of yeast cells. Part II. Analysis. Chem. Eng. Sci. 55, 2043–2053. doi:10.1016/S0009-2509(99)00501-1
Somkuti, G. A., Dominiecki, M. E., and Steinberg, D. H. (1998). Permeabilization of Streptococcus thermophilus and Lactobacillus delbrueckii subsp. bulgaricus with Ethanol. Curr. Microbiol. 36, 202–206. doi:10.1007/s002849900294
Spiden, E. M., Scales, P. J., Kentish, S. E., and Martin, G. J. O. (2013). Critical analysis of quantitative indicators of cell disruption applied to Saccharomyces cerevisiae processed with an industrial high pressure homogenizer. Biochem. Eng. J. 70, 120–126. doi:10.1016/j.bej.2012.10.008
Sreekrishna, K., Nelles, L., Potenz, R., Cruze, J., Mazzaferro, P., Fish, W., et al. (1989). High-level expression, purification, and characterization of recombinant human tumor necrosis factor synthesized in the methylotrophic yeast Pichia pastoris. Biochemistry 28, 4117–4125. doi:10.1021/bi00435a074
Tam, Y. J., Allaudin, Z. N., Mohd Lila, M. A., Bahaman, A. R., Tan, J. S., and Akhavan Rezaei, M. (2012). Enhanced cell disruption strategy in the release of recombinant hepatitis B surface antigen from Pichia pastoris using response surface methodology. BMC Biotechnol. 12:70. doi:10.1186/1472-6750-12-70
Keywords: cell disruption, high-pressure homogenization, intracellular component, optimization, overall key performance indicator, Pichia pastoris
Citation: Garcia-Ortega X, Reyes C, Montesinos JL and Valero F (2015) Overall key performance indicator to optimizing operation of high-pressure homogenizers for a reliable quantification of intracellular components in Pichia pastoris. Front. Bioeng. Biotechnol. 3:107. doi: 10.3389/fbioe.2015.00107
Received: 15 May 2015; Accepted: 10 July 2015;
Published: 03 August 2015
Edited by:
Eugénio C. Ferreira, University of Minho, PortugalReviewed by:
Isabel Belo, University of Minho, PortugalLeqian Liu, University of California San Francisco, USA
Copyright: © 2015 Garcia-Ortega, Reyes, Montesinos and Valero. This is an open-access article distributed under the terms of the Creative Commons Attribution License (CC BY). The use, distribution or reproduction in other forums is permitted, provided the original author(s) or licensor are credited and that the original publication in this journal is cited, in accordance with accepted academic practice. No use, distribution or reproduction is permitted which does not comply with these terms.
*Correspondence: Francisco Valero, Bioprocess Engineering and Applied Biocatalysis Group, Departament d’Enginyeria Química, Escola d’Enginyeria, Universitat Autònoma de Barcelona, Edifici Q, Campus UAB, Bellaterra 08193, Spain,ZnJhbmNpc2NvLnZhbGVyb0B1YWIuY2F0