 Hideaki Fujita
 Chongxia Zhong
 Satoshi Arai
 Madoka Suzuki
- 1WASEDA Bioscience Research Institute in Singapore, Singapore, Singapore
- 2Institute for Protein Research, Osaka University, Osaka, Japan
- 3Research Institute for Science and Engineering, Waseda University, Tokyo, Japan
- 4PRIME-AMED, Tokyo, Japan
- 5PRESTO, Japan Science and Technology Agency, Saitama, Japan
Probing intracellular events is a key step in developing new biomedical methodologies. Optical microscopy has been one of the best options to observe biological samples at single cell and sub-cellular resolutions. Morphological changes are readily detectable in brightfield images. When stained with fluorescent molecules, distributions of intracellular organelles, and biological molecules are made visible using fluorescence microscopes. In addition to these morphological views of cells, optical microscopy can reveal the chemical and physical status of defined intracellular spaces. This review begins with a brief overview of genetically encoded fluorescent probes and small fluorescent chemical dyes. Although these are the most common approaches, probing is also made possible by using tiny materials that are incorporated into cells. When these tiny materials emit enough photons, it is possible to draw conclusions about the environment in which the tiny material resides. Recent advances in these tiny but sufficiently bright fluorescent materials are nextly reviewed to show their applications in tracking target molecules and in temperature imaging of intracellular spots. The last section of this review addresses purely optical methods for reading intracellular status without staining with probes. These non-labeling methods are especially essential when biospecimens are thereafter required for in vivo uses, such as in regenerative medicine.
Introduction
Since Robert Hooke observed a cork and named a compartment he found within it a “cell” using a simple microscope composed of two lenses in the 17th century, microscopic observation has become one of the most essential techniques in cell biology. Most animal cells are almost transparent and various techniques were developed to image these transparent cells. The simplest method is to label the cells with colored probes. Haematoxylin-Eosin staining was introduced back in the 19th century and it is still commonly used in histological labs for diagnostics. Now, there are many probes with various functions and characteristics (Figure 1), which are briefly summarized in section Genetically encoded probes vs. chemical dyes to highlight the variety. These fluorescent probes were not designed to work on single molecules. The signal is captured as an average value of many molecules. When many molecules are concentrated in a small space, a bright fluorescent nanoprobe can be obtained. When optical microscopy is optimized for nanoprobes, location tracking as well as environment probing are made possible using a single particle. Section Bright nano-dots as single probes for tracking of this review focuses on nanoprobes that are designed to be imaged one by one with a purpose to monitor intracellular parameters such as the location of biomolecules and spatial and temporal changes in temperature. Other methods do not involve staining. Differential interference contrast microscopy and phase contrast microscopy both utilize the phase shift between the illuminating light and the light which passes through the specimen and in so doing can visualize transparent cells without labeling. These are not discussed in this review as there is much less information on the cellular states that can be determined using these techniques when compared to the other methods we will discuss. Imaging utilizing the vibrational information of a molecule is discussed in section Imaging technologies without labeling of this review (Figure 2).
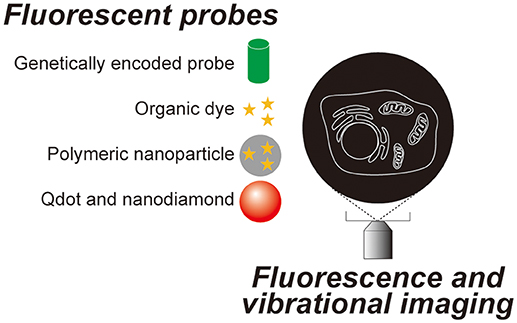
Figure 1. Fluorescent probes and optical microscopy techniques introduced in this review.
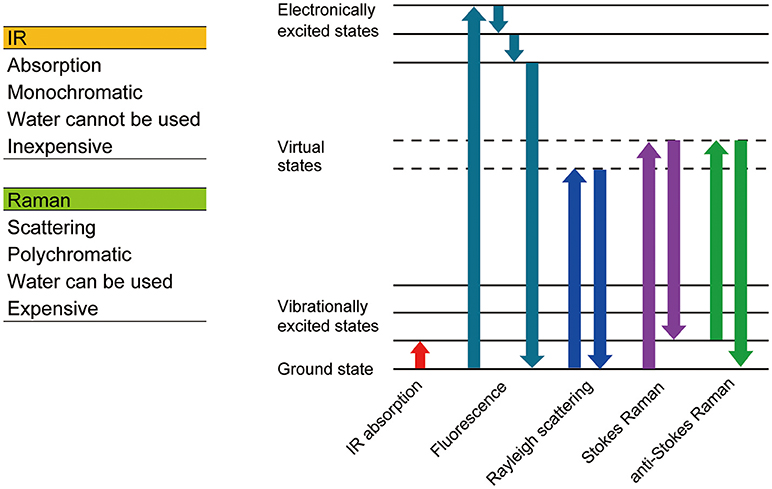
Figure 2. Comparison between Raman and IR spectrometry.
Genetically Encoded Probes vs. Chemical Dyes
Fluorescent sensors are defined as those in which the signal, such as fluorescence intensity, wavelength, or lifetime, is altered in response to a change in the environment. They are called fluorescent probes, indicators, and sensors (hereafter referred to as “fluorescent probes”) (Zhang et al., 2002). The probes can be broadly categorized into two groups: genetically encoded probes and small chemical dyes. Which probe to choose depends on what intracellular events need monitoring and the duration of the observation.
Genetically Encoded Fluorescent Probes
From the standpoint of long-term observation in fluorescence microscopy, genetically encoded probes are preferred. If we are keen to make observations for a few hours or days using small molecule indicators, we need to employ the strategy where the dyes are anchored to the target places or proteins covalently, which is still challenging (Wakayama et al., 2017). Also, to specifically observe an evenet of interest, genetically encoded probes once again prevail over small chemical dyes due to the working mechanism that they employ. The ability of natural proteins to bind to a specific target is adaptable in genetically encoded probes, while small chemical indicators use synthetic modules for sensing which are usually less specific to the target molecule than natural counterparts. Thus, genetically encoded probes exhibit better specificity to a target, especially against small molecules such as Ca2+, cAMP, ATP, and glucose (DiPilato et al., 2004; Imamura et al., 2009; Zhao et al., 2011; Hofig et al., 2018).
Regarding the delivery of probes into cells, genetically encoded probes require transfection using reagents, or physical delivery. To evaluate the probes for more than several days, preparation of a stable cell line into which the genetic code of the probe is integrated into the genome is necessary. Also, if transfection is difficult, such as in the case of primary cultured cells, viral infection is unavoidable. Another feature worth highlighting is that the location of the probes can be controlled at an organelle level. For example, a target sequence, such as for the nucleus (nuclear localization signal), mitochondria (subunit VIII of cytochrome c oxidase), or cellular membrane (growth-associated protein 43, neuromodulin), is conjugated to the N or C terminus of the probe, which then selectively localizes the probe to the target organelle (De Giorgi et al., 1999; Arai et al., 2018). Lastly, once the plasmid for a probe is purchased or given as a gift from the developer, it is always possible to amplify the plasmid at little cost.
Organic Dyes
One may feel that genetically encoded probes are the perfect choice. However, there is one critical issue–ease of handling. Genetically encoded probes require around 1–3 days for expression in cells after delivery of the gene. On the other hand, small chemical indicators are easy to apply for staining, usually taking around 30 min to take effect before imaging can begin (Zhu et al., 2016). For those who rarely perform molecular biology protocols, transfection might be difficult to apply to their biospecimens or it may be that the use of viruses for infection is not allowed in their laboratory. In some cases, biological samples cannot withstand the 1 day incubation time needed for gene expression. In these instances small chemical dyes are the only remaining option. Across the field of research, imaging is often required for a variety of cell and tissue types, as well as different animal species, beyond that of commonly used cell lines (Vendrell et al., 2012). Gene delivery frequently proves to be a challenge under these conditions. Small chemical dyes can therefore prove to be helpful and even be considered the first choice for imaging. One can find in the literature positive examples of labeling using small near-infrared dyes in biomedical research at tissue and animal levels (Hong et al., 2017). The purpose of the experiment and the type of specimen should always be the primary factors in determining which probes to use, regardless of whether they are small chemical dyes, or genetically encoded probes.
These fluorescent probes were designed to take an average of many molecules to measure a given parameter. Thus, spatial resolution is limited by optical microscopy. Are there means to improve accuracy in location while probing parameters using optical microscopy?
Bright Nano-dots as Single Probes for Tracking
The accumulation of fluorescent molecules creates a fluorescent nanoparticle. Quantum dots (Qdots) and nanodiamonds are also nanoparticles that emit photons upon excitation by light. These nanoparticles can be so bright that each dot is tracked in single camera frames repeatedly at 30 Hz or faster. When the nanoparticle is designed as a sensor, it is possible to probe the position of the nanoparticle as well as garner information about its local environment. If said probing is repeated frame by frame, time courses of the measured parameters can be obtained instantly. Among the large variety of applications of nanoparticles for probing, temperature sensing is one of the most advanced for biological usage. As the temperature is a fundamental parameter that can influence chemical and physical processes in any biological systems, the mechanism how living organism senses the temperature and how it releases heat in its body has been one of the major research topics in biology, and in animal, and plant physiologies. Recent advances in optical probes has brought our interest from the macroscopic (such as the temperature of the animal body or of the cell culture medium) to microscopic scale as small as a single cell. However, local event of heat release is still unclarified in live cells. Excellent reviews on fluorescent thermometers in general can be found in the literature (Brites et al., 2012; Wang et al., 2013). Lists detailing the advantages and disadvantages of materials and methods, operating principles, accuracy, and resolution of sensing have been described in reviews (Brites et al., 2012; Wang et al., 2013; Suzuki et al., 2016; Arai and Suzuki, 2018), as well as debates on single-cell thermometry (Baffou et al., 2014, 2015; Kiyonaka et al., 2015; Suzuki et al., 2015). Instead of repeating these details, this section introduces fluorescent nanoparticles that have been applied for probing purposes, including temperature sensing, with single particle analyses in physiological situations. Their functional ranges cover the temperature from ~25°C to ~42°C. Although the accuracy of determining the temperature depends on the optical setup that reads out signals from the probe, 0.5°C or better values are frequently reported. The nanoparticles can be further “functionalized” to target biological molecules and organelles.
Fluorescent Polymeric Nanoparticles for Probing Temperature Changes
We have developed fluorescent polymeric nanoparticles that are able to probe temperature changes in single cells (Oyama et al., 2012; Takei et al., 2014). Each nanoparticle contains temperature-sensitive fluorophores such as Eu-thenolytrifluoroacetonate (EuTTA) or Eu-tris(dinaphthoylmethane)-bis-trioctylphosphine oxide) (EuDT), of which emission intensities inversely correlate with temperature changes. In some cases, less temperature-sensitive fluorophores were also embedded in the same polymeric matrix to form a nanoparticle, whose surface is further covered by a hydrophilic polymer outer layer (Takei et al., 2014; Arai et al., 2015; Ferdinandus et al., 2016). Measurement of the temperature can be achieved by determining the reduction of emission intensity of EuTTA or EuDT, or by the ratio of the intensity of EuTTA or EuDT to that of the less temperature-sensitive fluorophores which act as internal references. The nanoparticle thermosensor assures strong emission intensity since it can pack multiple fluorophores into one particle. Furthermore, it is capable of measuring temperature without being affected by various intracellular factors, such as pH, viscosity, ionic strength, etc.
Quantum Dots
Qdots are fluorescent semiconductor nanocrystals which possess distinct optical and electrical properties. These properties render Qdots as a promising alternative to organic dyes in biological applications from cell biology to in vitro diagnostics. Qdots have broad excitation spectra and narrow emission spectra, which are composition- and size-dependent. Furthermore, the strong photoluminescence and high photostability of Qdots enable them to play an important role in single particle tracking (Michalet et al., 2005; Ichimura et al., 2014b; Pisanic et al., 2014). Applications in intracellular temperature measurement have also been reported using the shift of emission spectra caused by temperature changes (Yang et al., 2011; Tanimoto et al., 2016).
Functionalization is essential for Qdots to be applied to biological investigations. Being mostly synthesized in organic solvents, Qdots are too hydrophobic to be dissolved in aqueous buffers. Ligand exchange with hydrophilic compounds or encapsulation within amphiphilic coatings are therefore necessary to achieve solubility in water. Surface modification of Qdots provides an interface for conjugating to target molecules (cf. section Targeting).
Blinking and cytotoxicity are two major weak points of Qdots, which limit their biological and therapeutic applications. Blinking, also called intermittent fluorescence, is the phenomenon of a single Qdot particle exhibiting light and dark periods under continuous laser illumination (Ko et al., 2011). Blinking interferes with the tracing process in single-particle tracking studies. Both cadminium-containing and cadminium-free Qdots were found to induce the elevation of intracellular reactive oxygen species levels and increase cell apoptosis, which contributes to a decrease in cell viability (Derfus et al., 2004). Qdots in high concentrations also affect embryo development (Dubertret et al., 2002).
Fluorescent Nanodiamonds
One of the newly emerging fluorescent probes is nanodiamonds containing nitrogen vacancy centers (NVCs) (Chang et al., 2018). An NVC is composed of a substitutional nitrogen adjacent to a defect in the lattice. The NVC excited by green light emits light in the range of red. Thus, the nanodiamonds containing NVCs are called fluorescent nanodiamonds. When NVCs are embedded within the nanodiamond they show an outstanding robustness to changes in environmental parameters (Sekiguchi et al., 2018). Similar to Qdots, fluorescent nanodiamonds are extremely photostable. In contrast to Qdots, no blinking is observed. Modification of the surface is also relatively easy (Sotoma et al., 2018); e.g., Tsai et al. successfully used this advantage to attach gold nanorods as tiny heat sources onto the surface of nanodiamonds to probe the local temperature at the heated dot (Tsai et al., 2017). Biocompatibility has been shown to be good. Bearing these advantages in mind, fluorescent nanodiamonds can be considered close to the ideal fluorescent probe.
There remain at least two issues regarding the use of fluorescent nanodiamonds as probes. Firstly, the NVC can be exposed at the surface of the nanodiamond, thus eradicating its robustness to the surrounding environment. Greater care should therefore be taken as the diameter of the nanodiamond gets smaller. Secondly, measurement can require long periods of time when extreme accuracy is required or when the amount of NVCs in the nanodiamond is reduced. For example, it is possible to measure the temperature using the negatively charged NVC, NV−. All optical methods detect changes of the emission peak by changing temperature (Plakhotnik et al., 2014). The temperature-dependent status of NV− can also be detected by the downward peaks in emission intensity when the microwave is swept, known as optically detected magnetic resonance, or ODMR (Kucsko et al., 2013). Collecting enough photons or sweeping the microwave is required to draw spectra to determine the peaks. Efforts to shorten the sweeping process continue (Tzeng et al., 2015).
Targeting
It is a challenging task to target nanoparticles to specific cells, organelles, or molecules within a living cell. Yet several attempts have been successful in biological uses. In in vivo conditions, a probe was prepared based on Qdots by immobilizing a ligand with a high affinity for hexahistidine (Arai et al., 2012). By using this Qdot probe, single molecule-tracking of his-tagged myosin V was achieved. Fujita et al. discovered the major sequestration mechanism for glucose transporter 4 in fully differentiated single 3T3L1 adipocytes (Fujita et al., 2010). Gonda et al. conjugated anti-protease-activated receptor1, a tumor cell membrane protein, with Qdots to uncover changes in membrane fluidity and morphology during tumor metastasis in living mice (Gonda et al., 2010). The extreme photostability of Qdots was one of the major reasons that these studies were made possible. More recently, single nanodiamonds surface functionalized with poly-dopamine followed by thiol terminated poly (ethylene glycol) were successfully targeted to single DNAs using the avidin-biotin system to track their locations (Jung et al., 2018).
There are other types of nanoparticles that are constructed step-by-step directly within living cells at the desired target regions. The first step is to prepare cells expressing single chain avidin (ScAVD) at the target region. The second and the third are to incubate the cells with dibenzocyclooctyne-biotin followed by azide-functionalized organic dyes to perform a copper-free click reaction to construct a ScAVD-biotin-functional dye conjugated nanoprobe (Hou et al., 2016a,b). These nanoprobes have increased brightness and photostability as well as improved localization specificity when compared to single fluorescent dyes.
Imaging Technologies Without Labeling
Although labeling is a powerful technique to visualize the structure of the cell, it is not always preferred. Even when using a bio-safe dye, the detection of cancerous tissue using a labeling method during a surgical operation can significantly prolong the surgery, which increases the chances of complications. Labeling is also not preferred when producing cells for regenerative medicine. In this section, we introduce imaging techniques that don't require labeling. Raman microscopy and fluorescent lifetime imaging microscopy (FLIM) using auto-florescence are discussed (Figure 2).
Raman Imaging Spectroscopy
When light enters a molecule, three types of scatters are generated, Reyleigh scattering, Stokes Raman scattering, and anti-Stokes Raman scattering. Reyleigh scattering has the same energy as incident light, whereas Stokes and anti-Stokes Raman scattering have less and more energy than incident light, respectively. The shift in wavelength (Raman shift) relates to the chemical bonds within the molecule, thus the molecule can be identified using the Raman spectrum. Raman spectroscopy is a non-labeling and non-destructive analysis method, which can obtain information relating to the chemical bonds of a molecule.
Raman imaging spectroscopy usually uses visible light for illumination so the optical resolution is generally higher than Infrared (IR) imaging spectroscopy. Other than standard Spontaneous Raman spectroscopy, there are several other modes of Raman imaging techniques, including Coherent anti-Stokes Raman spectroscopy (CARS), Surface-enhanced Raman spectroscopy (SERS), and Stimulated Raman spectroscopy (SRS). The various types of Raman spectroscopy are reviewed in Krafft and Popp (Krafft and Popp, 2015).
Raman spectra can be used to identify the state of the cell, thus, clinical diagnosis is possible at a tissue level. Raman spectroscopy has been used diagnostically for cancer (Austin et al., 2016; Santos et al., 2017), atherosclerosis (MacRitchie et al., 2018) and liver steatosis (Pacia et al., 2018). Raman imaging of living cells was difficult because the Raman signal is far weaker than fluorescence; strong illumination with a visible laser and a long exposure is therefore needed, which significantly damages the cell. However, recent advances in detectors, spectroscopes, and optical filters have enabled Raman imaging of living cells (Hamada et al., 2008). Now, cell state can be monitored using Raman spectroscopy at a single cell level (Ichimura et al., 2014a, 2015, 2016).
Fluorescent Lifetime Imaging (FLIM)
FLIM is one of the most important technologies in optical microscopy, especially in live cell imaging, as fluorescence lifetime is independent of fluorophore concentration and focus drift. FLIM has been frequently used in Förester resonance energy transfer (FRET) based on fluorescent sensors that comprise two fluorescent proteins as a donor and an acceptor. The lifetime of the fluorescent protein is altered during energy transfer, thus a FRET sensor can be applied for FLIM. As such, small chemical sensors are also possible for FLIM, which are sensitive to the surrounding environment in the fluorescence lifetime domain. For successful examples, intracellular conditions such as levels of Ca2+ (Zheng et al., 2018), K+ (Paredes et al., 2013), Na+ (Roder and Hille, 2014), and Cl− (Chao et al., 1989), as well as pH (Schmitt et al., 2014), and temperature (Itoh et al., 2016) can be monitored using FLIM. FLIM can also be performed in non-label imaging as there are naturally occurring endogenous fluorescent biomolecules, such as reduced nicotinamide adenine dinucleotide (phosphate) [NAD(P)H] and flavines present in the cell. Using FLIM, NADH, and NADPH can be distinguished and the relative ratio can be calculated, which is not possible using fluorescence intensity as their spectra are identical (Blacker et al., 2014).
FLIM using auto fluorescence, which is non-labeling, is especially useful in diagnostic purposes. Detection of macrophages in an atherosclerotic model (Marcu et al., 2005), glioma in brain tissue (Yong et al., 2006), retinal pigment epithelium (Miura, 2018), and basal cell carcinoma in skin (Galletly et al., 2008) are made possible using FLIM. Two-photon FLIM is preferred for tissue diagnostics purposes as it reduces photo-damage to the cells and reaches deeper within the tissue. Two-photon excitation is now used to distinguish between papillary and reticular dermis (Shirshin et al., 2017), in the diagnostics of inflamed human skin (Huck et al., 2016), and in melanoma detection (Seidenari et al., 2013). Second Harmonic Generation (SHG) and two-photon FLIM can be combined to increase the information obtained and used in diagnosis as the same laser source can be used (Provenzano et al., 2009; Ranjit et al., 2016).
Other Non-label Imaging Technologies
There are other modes of non-label imaging technologies such as SHG and infrared (IR) spectroscopy. The information obtained by IR spectroscopy complements that obtained by Raman spectroscopy as when the IR signal from a particular chemical bond is strong, the signal obtained from Raman spectroscopy is weak, and vice versa. A number of products capable of obtaining Raman, FLIM, or IR are released every year, which will further advance this field.
Summary
Nanotechnology provides tools to control, create, or cure biospecimens. The effect should be evaluated in a quantitative manner to gauge the efficacy of the methods or the quality of the results. Optical microscopy can provide essential information on how and why samples have reacted at sub-cellular resolution. Observation of morphological changes of cells (e.g., axon-like elongation for neuronal cells, multi-nucleus, and contractile structures in muscular cells, or lipid droplets in adipocytes) is one of the first steps to be performed. Probing intracellular reactions provides additional and much more detailed insights. In this article, we reviewed optical methods to probe intracellular events at sub-cellular resolutions in living cells using optical microscopes. Some methods use fluorescent nanoprobes, several of which are designed to change their properties in fluorescence in response to changes in the chemical and physical conditions surrounding the probe. Other methods do not require these tiny probes, but are performed in purely optical manner. Considering the ease of availability, optical microscopy should continue to be a standard method. With the wide variety in probes as well as in equipment, methods are available to meet a range of specific needs. Optimal choices will always be dependent on the sample being studied.
Author Contributions
HF, SA, and MS conceived the story. All the authors co-wrote and critically revised the manuscript.
Conflict of Interest Statement
The authors declare that the research was conducted in the absence of any commercial or financial relationships that could be construed as a potential conflict of interest.
Acknowledgments
This work was supported by JSPS KAKENHI Grant Numbers JP15K05251 (to MS), by the Japan Science and Technology Agency Grant Number JPMJPR15F5 (to MS), by the Human Frontier Science Program RGP0047/2018 (to MS), and by Kurita Water and Environment Foundation 17D002 (to MS).
References
Arai, S., Ferdinandus, Takeoka, S., Ishiwata, S., and Suzuki, M. (2015). Micro-thermography in millimeter-scale animals by using orally-dosed fluorescent nanoparticle thermosensors. Analyst 140, 7534–7539. doi: 10.1039/c5an01287b
Arai, S., Hirosawa, S., Oguchi, Y., Suzuki, M., Murata, A., Ishiwata, S., et al. (2012). Mass spectrometric screening of ligands with lower off-rate from a clicked-based pooled library. ACS Combi. Sci. 14, 451–455. doi: 10.1021/co300028n
Arai, S., Kriszt, R., Harada, K., Looi, L. S., Matsuda, S., Wongso, D., et al. (2018). RGB-color intensiometric indicators to visualize spatiotemporal dynamics of ATP in single cells. Angew. Chem. Int. Ed. 57, 10873–10878. doi: 10.1002/anie.201804304
Arai, S., and Suzuki, M. (2018). “Nano-sized optical thermometers,” in Smart Nanoparticles for Biomedicine, ed. G. Ciofani (Amsterdam: Elsevier), 199–217. doi: 10.1016/B978-0-12-814156-4.00014-8
Austin, L. A., Osseiran, S., and Evans, C. L. (2016). Raman technologies in cancer diagnostics. Analyst 141, 476–503. doi: 10.1039/C5AN01786F
Baffou, G., Rigneault, H., Marguet, D., and Jullien, L. (2014). A critique of methods for temperature imaging in single cells. Nat. Methods 11, 899–901. doi: 10.1038/nmeth.3073
Baffou, G., Rigneault, H., Marguet, D., and Jullien, L. (2015). Reply to: “Validating subcellular thermal changes revealed by fluorescent thermosensors” and “The 10(5) gap issue between calculation and measurement in single-cell thermometry.” Nat. Methods 12, 803. doi: 10.1038/nmeth.3552
Blacker, T. S., Mann, Z. F., Gale, J. E., Ziegler, M., Bain, A. J., Szabadkai, G., et al. (2014). Separating NADH and NADPH fluorescence in live cells and tissues using FLIM. Nat. Commun. 5:3936. doi: 10.1038/ncomms4936
Brites, C. D., Lima, P. P., Silva, N. J.I, Millán, A., Amaral, V. S., Palacio, F., and Carlos, L. D. (2012). Thermometry at the nanoscale. Nanoscale 4, 4799–4829. doi: 10.1039/c2nr30663h
Chang, H.-C., Hsiao, W. W.-W., and Su, M.-C. (2018). Fluorescent Nanodiamonds. Chichester: John Wiley & Sons. doi: 10.1002/9781119477099
Chao, A. C., Dix, J. A., Sellers, M. C., and Verkman, A. S. (1989). Fluorescence measurement of chloride transport in monolayer cultured cells. Mechanisms of chloride transport in fibroblasts. Biophys. J. 56, 1071–1081. doi: 10.1016/S0006-3495(89)82755-9
De Giorgi, F., Ahmed, Z., Bastianutto, C., Brini, M., Jouaville, L. S., Marsault, R., et al. (1999). Targeting GFP to organelles. Methods Cell Biol. 58, 75–85. doi: 10.1016/S0091-679X(08)61949-4
Derfus, A.M., Chan, W.C.W., and Bhatia, S.N., (2004). Probing the cytotoxicity of semiconductor quantum dots. Nano Lett. 4, 11–18. doi: 10.1021/nl0347334
DiPilato, L. M., Cheng, X., and Zhang, J. (2004). Fluorescent indicators of cAMP and Epac activation reveal differential dynamics of cAMP signaling within discrete subcellular compartments. Proc. Natl. Acad. Sci. U.S.A. 101, 16513–16518. doi: 10.1073/pnas.0405973101
Dubertret, B., Skourides, P., Norris, D. J., Noireaux, V., Brivanlou, A. H., and Libchaber, A. (2002). In vivo imaging of quantum dots encapsulated in phospholipid micelles. Science 298, 1759–1762. doi: 10.1126/science.1077194
Ferdinandus, Arai, S., Takeoka, S., Ishiwata, S., Suzuki, M., and Sato, H. (2016). Facilely fabricated luminescent nanoparticle thermosensor for real-time microthermography in living animals. ACS Sens. 1, 1222–1227. doi: 10.1021/acssensors.6b00320
Fujita, H., Hatakeyama, H., Watanabe, T. M., Sato, M., Higuchi, H., and Kanzaki, M. (2010). Identification of three distinct functional sites of insulin-mediated GLUT4 trafficking in adipocytes using quantitative single molecule imaging. Mol. Biol. Cell. 21, 2721–2731. doi: 10.1091/mbc.e10-01-0029
Galletly, N. P., McGinty, J., Dunsby, C., Teixeira, F., Requejo-Isidro, J., Munro, I., et al. (2008). Fluorescence lifetime imaging distinguishes basal cell carcinoma from surrounding uninvolved skin. Br. J. Dermatol. 159, 152–161. doi: 10.1111/j.1365-2133.2008.08577.x
Gonda, K., Watanabe, T.M., Ohuchi, N., and Higuchi, H. (2010). In vivo nano-imaging of membrane dynamics in metastatic tumor cells using quantum dots. J. Biol. Chem. 285, 2750–2757. doi: 10.1074/jbc.M109.075374
Hamada, K., Fujita, K., Smith, N. I., Kobayashi, M., Inouye, Y., and Kawata, S. (2008). Raman microscopy for dynamic molecular imaging of living cells. J. Biomed. Opt. 13:044027. doi: 10.1117/1.2952192
Hofig, H., Otten, J., Steffen, V., Pohl, M., Boersma, A. J., and Fitter, J. (2018). Genetically encoded forster resonance energy transfer-based biosensors studied on the single-molecule level. ACS Sens. 3, 1462–1470. doi: 10.1021/acssensors.8b00143
Hong, G., Antaris, A.L., and Dai, H. (2017). Near-infrared fluorophores for biomedical imaging. Nat. Biomed. Eng. 1:0010. doi: 10.1038/s41551-016-0010
Hou, Y., Arai, S., Kitaguchi, T., and Suzuki, M. (2016a). Intracellular bottom-up generation of targeted nanosensors for single-molecule imaging. Nanoscale 8, 3218–3225. doi: 10.1039/C5NR08012F
Hou, Y., Arai, S., Takei, Y., Murata, A., Takeoka, S., and Suzuki, M. (2016b). Focal calcium monitoring with targeted nanosensors at the cytosolic side of endoplasmic reticulum. Sci. Technol. Adv. Mater. 17, 293–299. doi: 10.1080/14686996.2016.1190258
Huck, V., Gorzelanny, C., Thomas, K., Getova, V., Niemeyer, V., Zens, K., et al. (2016). From morphology to biochemical state - intravital multiphoton fluorescence lifetime imaging of inflamed human skin. Sci. Rep. 6:22789. doi: 10.1038/srep22789
Ichimura, T., Chiu, L. D., Fujita, K., Kawata, S., Watanabe, T. M., Yanagida, T., et al. (2014a). Visualizing cell state transition using Raman spectroscopy. PLoS ONE 9:e84478. doi: 10.1371/journal.pone.0084478
Ichimura, T., Chiu, L. D., Fujita, K., Machiyama, H., Kawata, S., Watanabe, T. M., et al. (2015). Visualizing the appearance and disappearance of the attractor of differentiation using Raman spectral imaging. Sci. Rep. 5:11358. doi: 10.1038/srep11358
Ichimura, T., Chiu, L. D., Fujita, K., Machiyama, H., Yamaguchi, T., Watanabe, T. M., et al. (2016). Non-label immune cell state prediction using Raman spectroscopy. Sci. Rep. 6:37562. doi: 10.1038/srep37562
Ichimura, T., Jin, T., Fujita, H., Higuchi, H., and Watanabe, T.M. (2014b). Nano-scale measurement of bio molecules by optical microscopy and semiconductor nanoparticles. Front. Physiol. 5:273. doi: 10.3389/fphys.2014.00273
Imamura, H., Nhat, K. P., Togawa, H., Saito, K., Iino, R., Kato-Yamada, Y., et al. (2009). Visualization of ATP levels inside single living cells with fluorescence resonance energy transfer-based genetically encoded indicators. Proc. Natl. Acad. Sci. U.S.A. 106, 15651–15656. doi: 10.1073/pnas.0904764106
Itoh, H., Arai, S., Sudhaharan, T., Lee, S. C., Chang, Y. T., Ishiwata, S., et al. (2016). Direct organelle thermometry with fluorescence lifetime imaging microscopy in single myotubes. Chem. Commun (Camb). 52, 4458–4461. doi: 10.1039/C5CC09943A
Jung, H.-S., Cho, K.-J., Seol, Y., Takagi, Y., Dittmore, A., Roche, P.A., et al. (2018). Polydopamine encapsulation of fluorescent nanodiamonds for biomedical applications. Adv. Funct. Mater. 28:1801252. doi: 10.1002/adfm.201801252
Kiyonaka, S., Sakaguchi, R., Hamachi, I., Morii, T., Yoshizaki, T., and Mori, Y. (2015). Validating subcellular thermal changes revealed by fluorescent thermosensors. Nat. Methods 12, 801–802. doi: 10.1038/nmeth.3548
Ko, H-C., Yuan, C-T., and Tang, J. (2011). Probing and controlling fluorescence blinking of single semiconductor nanoparticles. Nano Rev. 2:5895. doi: 10.3402/nano.v2i0.5895
Krafft, C., and Popp, J. (2015). The many facets of Raman spectroscopy for biomedical analysis. Anal. Bioanal. Chem. 407, 699–717. doi: 10.1007/s00216-014-8311-9
Kucsko, G., Maurer, P.C., Yao, N.Y., Kubo, M., Noh, H.J., Lo, P.K., et al. (2013). Nanometre-scale thermometry in a living cell. Nature 500, 54–58. doi: 10.1038/nature12373
MacRitchie, N., Grassia, G., Noonan, J., Garside, P., Graham, D., and Maffia, P. (2018). Molecular imaging of atherosclerosis: spotlight on raman spectroscopy and surface-enhanced raman scattering. Heart 104, 460–467. doi: 10.1136/heartjnl-2017-311447
Marcu, L., Fang, Q., Jo, J. A., Papaioannou, T., Dorafshar, A., Reil, T., et al. (2005). In vivo detection of macrophages in a rabbit atherosclerotic model by time-resolved laser-induced fluorescence spectroscopy. Atherosclerosis 181, 295–303. doi: 10.1016/j.atherosclerosis.2005.02.010
Michalet, X., Pinaud, F.F., Bentolila, L.A., Tsay, J.M., Doose, S., Li, J.J., et al. (2005). Quantum dots for live cells, in vivo imaging, and diagnostics. Science 307, 538–544. doi: 10.1126/science.1104274
Miura, Y. (2018). Two-photon microscopy (TPM) and fluorescence lifetime imaging microscopy (FLIM) of retinal pigment epithelium (RPE) of mice in vivo. Methods Mol. Biol. 1753, 73–88. doi: 10.1007/978-1-4939-7720-8_5
Oyama, K., Takabayashi, M., Takei, Y., Arai, S., Takeoka, S, and Ishiwata, S., (2012). Walking nanothermometers: spatiotemporal temperature measurement of transported acidic organelles in single living cells. Lab Chip 12, 1591–1593. doi: 10.1039/c2lc00014h
Pacia, M. Z., Czamara, K., Zebala, M., Kus, E., Chlopicki, S., and Kaczor, A. (2018). Rapid diagnostics of liver steatosis by Raman spectroscopy via fiber optic probe: a pilot study. Analyst 143, 4723–4731. doi: 10.1039/C8AN00289D
Paredes, J. M., Giron, M. D., Ruedas-Rama, M. J., Orte, A., Crovetto, L., Talavera, E. M., et al. (2013). Real-time phosphate sensing in living cells using fluorescence lifetime imaging microscopy (FLIM). J. Phys. Chem. B 117, 8143–8149. doi: 10.1021/jp405041c
Pisanic, T. R., Zhang, Y., and Wang, T. H. (2014). Quantum dots in diagnostics and detection: principles and paradigms. Analyst 139, 2968–2981. doi: 10.1039/C4AN00294F
Plakhotnik, T., Doherty, M.W., Cole, J.H., Chapman, R., and Manson, N.B. (2014). All-optical thermometry and thermal properties of the optically detected spin resonances of the NV− center in nanodiamond. Nano Lett. 14, 4989–4996. doi: 10.1021/nl501841d
Provenzano, P. P., Eliceiri, K. W., and Keely, P. J. (2009). Multiphoton microscopy and fluorescence lifetime imaging microscopy (FLIM) to monitor metastasis and the tumor microenvironment. Clin. Exp. Metastasis 26, 357–370. doi: 10.1007/s10585-008-9204-0
Ranjit, S., Dobrinskikh, E., Montford, J., Dvornikov, A., Lehman, A., Orlicky, D. J., et al. (2016). Label-free fluorescence lifetime and second harmonic generation imaging microscopy improves quantification of experimental renal fibrosis. Kidney Int. 90, 1123–1128. doi: 10.1016/j.kint.2016.06.030
Roder, P., and Hille, C. (2014). ANG-2 for quantitative Na(+) determination in living cells by time-resolved fluorescence microscopy. Photochem. Photobiol. Sci. 13, 1699–1710. doi: 10.1039/C4PP00061G
Santos, I. P., Barroso, E. M., Bakker Schut, T. C., Caspers, P. J., van Lanschot, C. G. F., Choi, D. H., et al. (2017). Raman spectroscopy for cancer detection and cancer surgery guidance: translation to the clinics. Analyst 142, 3025–3047. doi: 10.1039/C7AN00957G
Schmitt, F. J., Thaa, B., Junghans, C., Vitali, M., Veit, M., and Friedrich, T. (2014). eGFP-pHsens as a highly sensitive fluorophore for cellular pH determination by fluorescence lifetime imaging microscopy (FLIM). Biochim. Biophys. Acta 1837, 1581–1593. doi: 10.1016/j.bbabio.2014.04.003
Seidenari, S., Arginelli, F., Dunsby, C., French, P. M., König, K., Magnoni, C., et al. (2013). Multiphoton laser tomography and fluorescence lifetime imaging of melanoma: morphologic features and quantitative data for sensitive and specific non-invasive diagnostics. PLoS One 8:e70682. doi: 10.1371/journal.pone.0070682
Sekiguchi, T., Sotoma, S., and Harada, Y. (2018). Fluorescent nanodiamonds as a robust temperature sensor inside a single cell. Biophys. Physicobiol. 15, 229–234. doi: 10.2142/biophysico.15.0_229
Shirshin, E. A., Gurfinkel, Y. I., Priezzhev, A. V., Fadeev, V. V., Lademann, J., and Darvin, M. E. (2017). Two-photon autofluorescence lifetime imaging of human skin papillary dermis in vivo: assessment of blood capillaries and structural proteins localization. Sci. Rep. 7:1171. doi: 10.1038/s41598-017-01238-w
Sotoma, S., Hsieh, F.-J., and Chang, H.-C. (2018). Biohybrid fluorescent nanodiamonds as dual-contrast markers for light and electron microscopies. J. Chin. Chem. Soc. 65, 1136–1146. doi: 10.1002/jccs.201800157
Suzuki, M., Arai, S., Oyama, K., and Ishiwata, S. (2016). “Nanothermometers: luminescent nanothermometers for biological applications,” in CRC Concise Encyclopedia of Nanotechnology, eds. B. I. Kharisov, O. V. Kharissova, and U. O. Mendez (Boca Raton, FL: CRC Press), 851–859.
Suzuki, M., Zeeb, V., Arai, S., Oyama, K., and Ishiwata, S. (2015). The 10(5) gap issue between calculation and measurement in single-cell thermometry. Nat. Methods 12, 802–803. doi: 10.1038/nmeth.3551
Takei, Y., Arai, S., Murata, A., Takabayashi, M., Oyama, K., Ishiwata, S., et al. (2014). A nanoparticle-based ratiometric and self-calibrated fluorescent thermometer for single living cells. ACS Nano 8, 198–206. doi: 10.1021/nn405456e
Tanimoto, R., Hiraiwa, T., Nakai, Y., Shindo, Y., Oka, K., Hiroi, N., et al. (2016). Detection of temperature difference in neuronal cells. Sci. Rep. 6:22071. doi: 10.1038/srep22071
Tsai, P. C., Epperla, C. P., Huang, J. S., Chen, O. Y., Wu, C. C., and Chang, H. C. (2017). Measuring nanoscale thermostability of cell membranes with single gold-diamond nanohybrids. Angew. Chem. Int. Ed. 56, 3025–3030. doi: 10.1002/anie.201700357
Tzeng, Y. K., Tsai, P. C., Liu, H. Y., Chen, O.Y., Hsu, H., Yee, F. G., et al. (2015). Time-resolved luminescence nanothermometry with nitrogen-vacancy centers in nanodiamonds. Nano Lett. 15, 3945–3952. doi: 10.1021/acs.nanolett.5b00836
Vendrell, M., Zhai, D., Er, J. C., and Chang, Y. T. (2012). Combinatorial strategies in fluorescent probe development. Chem. Rev. 112, 4391–4420. doi: 10.1021/cr200355j
Wakayama, S, Kiyonaka, S., Arai, I., Kakegawa, W., Matsuda, S., Ibata, K., et al. (2017). Chemical labelling for visualizing native AMPA receptors in live neurons. Nat. Commun. 8:14850. doi: 10.1038/ncomms14850
Wang, X. D., Wolfbeis, O.S., and Meier, R.J. (2013). Luminescent probes and sensors for temperature. Chem. Soc. Rev. 42, 7834–7869. doi: 10.1039/c3cs60102a
Yang, J. M., Yang, H., and Lin, L. (2011). Quantum dot nano thermometers reveal heterogeneous local thermogenesis in living cells. ACS Nano 5, 5067–5071. doi: 10.1021/nn201142f
Yong, W. H., Butte, P. V., Pikul, B. K., Jo, J. A., Fang, Q., Papaioannou, T., et al. (2006). Distinction of brain tissue, low grade and high grade glioma with time-resolved fluorescence spectroscopy. Front. Biosci. 11, 1255–1263. doi: 10.2741/1878
Zhang, J., Campbell, R. E., Ting, A. Y., and Tsien, R. Y. (2002). Creating new fluorescent probes for cell biology. Nat. Rev. Mol. Cell Biol. 3, 906–918. doi: 10.1038/nrm976
Zhao, Y., Araki, S., Wu, J., Teramoto, T., Chang, Y. F., Nakano, M., et al. (2011). An expanded palette of genetically encoded Ca(2)(+) indicators. Science 333, 1888–1891. doi: 10.1126/science.1208592
Zheng, K., Jensen, T. P., and Rusakov, D. A. (2018). Monitoring intracellular nanomolar calcium using fluorescence lifetime imaging. Nat. Protoc. 13, 581–597. doi: 10.1038/nprot.2017.154
Keywords: fluorescent protein, nanoparticle, infrared, nanodiamond, quantum dot, Raman, temperature
Citation: Fujita H, Zhong C, Arai S and Suzuki M (2019) Bright Dots and Smart Optical Microscopy to Probe Intracellular Events in Single Cells. Front. Bioeng. Biotechnol. 6:204. doi: 10.3389/fbioe.2018.00204
Received: 11 October 2018; Accepted: 12 December 2018;
Published: 04 January 2019.
Edited by:
Gianni Ciofani, Politecnico di Torino, ItalyReviewed by:
Tzu-Ming Liu, University of Macau, ChinaSatya Ranjan Sarker, Jahangirnagar University, Bangladesh
Takayuki Uchihashi, Nagoya University, Japan
Copyright © 2019 Fujita, Zhong, Arai and Suzuki. This is an open-access article distributed under the terms of the Creative Commons Attribution License (CC BY). The use, distribution or reproduction in other forums is permitted, provided the original author(s) and the copyright owner(s) are credited and that the original publication in this journal is cited, in accordance with accepted academic practice. No use, distribution or reproduction is permitted which does not comply with these terms.
*Correspondence: Madoka Suzuki, c3V6dV9tYWRvQHByb3RlaW4ub3Nha2EtdS5hYy5qcA==