 Mathias Joachim1,2
 Doreen Gerlach
 Peter Czermak
- 1Department of Life Science Engineering, Institute of Bioprocess Engineering and Pharmaceutical Technology, University of Applied Sciences Mittelhessen, Giessen, Germany
- 2Faculty of Biology and Chemistry, Justus Liebig University, Giessen, Germany
- 3Department of Bioresources of Fraunhofer, Institute for Molecular Biology and Applied Ecology IME, Giessen, Germany
Peptides and proteins containing disulfide bonds can be produced in Escherichia coli by targeting the oxidizing periplasm, co-expressing isomerases or chaperons, refolding from inclusion bodies, or by using redox-engineered E. coli strains. Thus far, protein expression in glutathione reductase and thioredoxin reductase deficient (Δgor ΔtrxB) E. coli strains has required a complex medium. However, a chemically defined medium suitable for large-scale production would be preferable for industrial applications. Recently, we developed a minimal medium supplemented with iron (M9i) for high-density cultivation using E. coli Rosetta gami B(DE3)pLysS cells. Here we show that M9i is suitable for the production of insect metalloproteinase inhibitor (IMPI), which contains five disulfide bonds, in the same E. coli strain. We demonstrated the scalability of the new fed-batch process by combining the scale-up criteria of constant dissolved oxygen (DO) and matching volumetric power inputs (P/V) at the borders of the stirrer cascade. Process intensification was achieved by investigating production feed rates and different induction times. We improved product titers by ~200-fold compared to the standard process in complex medium while maintaining the activity of the IMPI protein. Our results show for the first time that it is possible to produce active proteins containing multiple disulfide bonds in a Δgor ΔtrxB E. coli strain using M9i medium. The success of scale-up and process intensification shows that the industrial production of complex recombinant proteins in such strains using chemically defined M9i minimal medium is feasible.
Introduction
The spread of antibiotic-resistant pathogens due to the overuse of conventional antibiotics is a severe threat to healthcare systems worldwide (Goossens et al., 2005; Costelloe et al., 2010; Klein et al., 2018). Antimicrobial peptides (AMPs) have been proposed as a potential solution to the demand for new antibiotics (Joerger, 2003; Hancock and Sahl, 2006; Pöppel et al., 2015; Bolouri Moghaddam et al., 2016) and insects produce the broadest spectrum of AMPs, therefore offering a valuable resource for the isolation of peptides with medical applications (Mylonakis et al., 2016; Tonk and Vilcinskas, 2016). Most pharmaceutical proteins are produced in recombinant microbes or eukaryotic cell lines (Sanchez-Garcia et al., 2016), and AMPs have therefore been produced in Escherichia coli (Hoffmann et al., 2019) as well as insect cells (Zitzmann et al., 2018).
Proteins with multiple disulfide bonds can be difficult to produce in bacteria, but AMPs with disulfide bonds have been produced in E. coli strains engineered with an oxidizing cytoplasm (Berkmen, 2012; Zhang et al., 2014), by co-expression with disulfide bond isomerases (Gaciarz et al., 2017) or as inclusion bodies (Hoffmann et al., 2019). Although inclusion bodies reduce the toxicity of AMPs toward host bacteria, the refolding procedure is labor-intensive and requires extensive optimization. In many cases, only 15–25% of the inclusion body material can be refolded into active proteins (Singh and Panda, 2005). Recombinant proteins with disulfide bonds can be targeted to the periplasm, or to the cytoplasm of redox-engineered E. coli cells. However, the periplasm makes up to only 8–16% of the total cell volume, whereas the cytoplasm accounts for most of the cell volume and contains more than 30% of the total cellular protein, making it a preferable accumulation site.
Thus far, redox-engineered E. coli strains for the production of recombinant proteins have required complex media containing ingredients such as yeast extract and peptone, which makes them unsuitable for large-scale production in industry (Gaciarz et al., 2017). We previously described an iron-enriched chemically defined minimal medium (M9i) which supports the cultivation of E. coli at high cell densities (Joachim et al., 2018). Here we tested the ability of M9i medium to support the growth of a glutathione reductase and thioredoxin reductase deficient (Δgor ΔtrxB) E. coli strain for the cytoplasmic production of recombinant proteins with disulfide bonds. As a model product, we expressed the insect metalloprotease inhibitor (IMPI), an AMP with five disulfide bonds (Wedde et al., 1998), fused to an elastin-like polypeptide (ELP) to facilitate product recovery. ELPs contain a repetitive pentapeptide (VPGXG), where the guest residue X can be any amino acid except proline, which allows reversible precipitation at a given transition temperature (Meyer and Chilkoti, 1999; Trabbic-Carlson et al., 2004; Banki et al., 2005; Hassouneh et al., 2010). We created a fed-batch process with a stirrer and aeration cascade for dissolved oxygen (DO) control. We then scaled up the process using the combined transfer criteria of constant DO and matching volumetric power inputs at the borders of the stirrer cascade. Using this approach, we investigated the industrial potential of redox-engineered E. coli combined with iron-enriched chemically defined M9i minimal medium at different feed rates and times of induction to achieve process intensification.
Materials and Methods
Bacterial Strain and Vector Construction
Expression Strain
The glutathione reductase and thioredoxin reductase deficient (Δgor ΔtrxB) E. coli strain Rosetta gami B(DE3)pLysS was purchased from Merck, Darmstadt, Germany.
Expression Vector
The expression plasmid was created by Golden Gate (GG) cloning as previously described (Schreiber et al., 2017), with the addition of an 80x ELP (V48G16L16) with an N-terminal His6 tag at the fusion partner site, and a ΔI-CM intein at the cleavage site (Wood et al., 1999, 2000). A mutated version of the insect metalloproteinase inhibitor [IMPI (I38V)] was inserted at the product site (Hoffmann et al., 2019). As described by Schreiber et al. (2017), the 20-μL reaction mixture contained 40 fmol of each donor plasmid, 20 U T4 DNA ligase, 2 μL T4 DNA ligase buffer (Promega, Madison, WI, USA) and 10 U of BsaI (NEB, Ipswich, MA, USA). After warming to 37°C for 15 min, the GG mix was incubated for 50 cycles of 2 min at 37°C and 5 min at 16°C. Finally, the enzymes were heat-inactivated at 50°C for 15 min and 65°C for 5 min. The 2517-bp product (T7/lac+6xHis-ELP80-TrxB-intein-IMPI(I38V)-T7) was used for bacterial transformation (for plasmid see Supplementary Data).
Transformation, Plasmid Propagation, and Verification
Chemically competent E. coli NEB10-β cells (NEB) were transformed by adding 5 μL of the vector DNA to 80 μL of cells (optical density at 600 nm (ΔOD600) ≈ 13), in 100 mM CaCl2 + 15% glycerol (Carl Roth, Karlsruhe, Germany). The mixture was incubated on ice for 5 min followed by a 42°C heat shock for 60 s and then incubated on ice for another 5 min. We then added 500 μL lysogeny broth (LB) medium and allowed the cells to recover for 1 h at 37°C, shaking at 1,000 rpm on a thermomixer (Eppendorf, Hamburg, Germany). The cells were plated on LB agar containing 15 μg L−1 gentamycin (AppliChem, Darmstadt, Germany), and incubated at 37°C overnight. Individual colonies were picked and transferred to 5 mL LB medium containing antibiotics as above and incubated at 37°C, shaking at 250 rpm overnight. Cultures were harvested and plasmid DNA was purified using the NucleoSpin Plasmid EasyPure kit (Macherey-Nagel, Düren, Germany). Isolated DNA was digested and sequenced by Microsynth Seqlab (Seqlab Sequence Laboratories, Göttingen, Germany). Plasmids with correct inserts were introduced into chemically competent E. coli Rosetta-gami B(DE3)pLysS cells as described above, with all solid and liquid media supplemented with 34 μg L−1 chloramphenicol (Carl Roth).
Media
Shaking flask and bioreactor media were prepared as recently described (Joachim et al., 2018) with a range of Fe(III)citrate concentrations. Each batch of medium was supplemented with 10 g L−1 glucose as the carbon source and 15 μg L−1 gentamycin, the latter to maintain selection pressure and ensure the growth of only those cells carrying the vector.
Analytical Methods
Cell Growth
Absolute OD600 values were measured using a BioSpectrometer Kinetic (Eppendorf AG). At OD600 > 0.3, samples were diluted with 0.9% NaCl. The ΔOD600 was then calculated by subtracting the blank (OD600, b) from the sample absorbance (OD600, s) and multiplying by the dilution factor (F) as shown in Equation (1):
The cell dry weight was determined using a MA100Q infrared moisture analyzer (Sartorius, Göttingen, Germany) or by weighing the dried pellet (48 h at 65°C) prepared from 2 mL of culture broth. The glucose concentration was determined using a Biosen C-line glucose/lactate analyzer (EKF Diagnostics, Cardiff, UK).
Target Protein Analysis
After cell disruption using BugBuster Mastermix (Merck), recombinant protein levels in the soluble fraction were determined with an enzyme-linked immunosorbent assay (ELISA) using THE plates coated with an antibody specific for the His6 tag (Genescript, Piscataway, NJ, USA). His6-tagged interleukin 6 (Firalis, Huningue, France) was used as a standard. A horseradish peroxidase (HRP)-coupled QIAexpress antibody specific for the His6 tag (Qiagen, Hilden, Germany) was used as a reporter. Standards, samples and the antibody were diluted in 0.2% bovine serum albumin (BSA; Carl Roth) in phosphate-buffered serine (PBS; Merck) and the signal was detected using the HRP substrate 1-Step Ultra TMB-ELISA (Thermo Fisher Scientific, Waltham, MA, USA). The plates were analyzed for 23 min at 1-min intervals at 370 nm in a Synergy HTX multi-mode reader running Gen5 software (BioTek Instruments, Winooski, VT, USA).
AMP Activity Assay
The activity of IMPI(I38V) was measured with a fluorescence-based assay using the metalloprotease thermolysin (Eisenhardt et al., 2015) and approximately 10 μg of ELP-coupled IMPI(I38V). Phosphoamidon (100 ng) was used as a positive control.
Bioreactor Cultivations
Three different cultivation scales were compared in this study. Small-scale cultivations were carried out using a 0.5 L MiniBio 500 stirred-tank reactor system (Applikon Biotechnology, Delft, Netherlands) equipped with two Rushton impellers and a microsparger for aeration. Medium-scale cultivations were carried out using a 7.5 L Labfors3 bioreactor (Infors, Bottmingen, Switzerland) equipped with three Rushton impellers, three baffles and a standard sparger for aeration. Large-scale cultivation was carried out using a BIO BENCH 20 L bioreactor (Applikon Biotechnology) equipped with three Rushton impellers, four baffles and a standard sparger for aeration. All systems were also equipped with standard sensors for temperature, pH and oxygen saturation and BlueInOne Ferm offgas analyzers (BlueSens, Herten, Germany). The starting volume in the small-scale system was 0.25 L. Geometric similarity was ensured by applying Equation (2) (Junker, 2004), setting the vessel diameter of the small and large scale setups (D1 and D2) in relation to the corresponding liquid volumes (V1 and V2). This resulted in starting volumes of 2.86 L for the medium-scale experiments and 6.47 L for the large-scale experiments.
The bioreactors were inoculated at an initial ΔOD600 of 0.1. After reaching a DO concentration of 30%, this value was maintained by a cascade of higher stirrer speeds, increasing aeration rates and finally the addition of oxygen. In small-scale experiments, the cascade consisted of increasing the stirrer speed from 1,000 to 1,600 rpm and the aeration rate from 0.1 to 1.0 vvm. The borders of the stirrer cascade in the medium-scale and large-scale experiments were determined by the criterion of an equal volumetric power input (P/V) (Equation 3).
where n [s−1] is the impeller speed, d [m] is the impeller diameter at the corresponding scale (Figure 1), ρ [kg m−3] is the density of the medium, and NeG is the gassed Newton number, calculated using Equation (4) (Henzler, 1982).
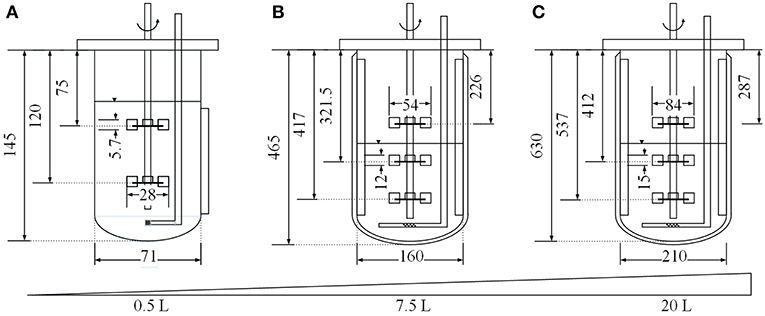
Figure 1. Dimensions (in mm) of the MiniBio 500 (A), Labfors3 (B) and BIO BENCH 20 L (C) bioreactor systems.
where z is the number of immersed impellers, D [m] is the diameter of the vessel (Figure 1) and Ne0≈ 4.9 (for Fr < 0.07(D/d)3; 0.2 < d/D < 0.42; Re>104) (Henzler, 1982). Two dimensionless variables must be calculated, namely the Froude number (Fr) as shown in Equation (5)
and the gas flow number (Q) as shown in Equation (6)
where g [m s−1] is the gravitational acceleration and FAIR [m3 s−1] is the volumetric gas flow rate. By equating the P/V (Equation 3) of the larger scales to that of the small-scale system, the stirrer speed at the larger scale was calculated according to the stirrer speed in the small-scale experiments. The medium-scale stirrer cascade was therefore set to 754–1,207 rpm and that of the large scale was set to 465–744 rpm. The aeration cascade was set to 0.1–1 vvm for all scales. After the initial batch phase, a fed-batch phase was automatically initiated by the sharp increase in the DO signal after glucose depletion. The start feed rate was calculated using Equation (7).
where mX [g] is the current biomass in the vessel, uset [h−1] is the growth rate, YX/S [g g−1] is the glucose consumption rate (0.35 g g−1), m is the maintenance-coefficient (0.04 g (g h)−1) and cS, R is the glucose concentration in the feed reservoir (450 g L−1). The subsequent exponential feed rate was then calculated using Equation (8).
Determination of the Volumetric Mass Transfer Coefficient (KLa)
In the bioreactor systems, KLa values were determined by the direct online evaluation of exhaust gas analyzer data. By using a literature value for the molar volume Vm [m3 mol−1] and knowing the airstream [m3 h−1] and the volume of the liquid phase VL [m3], as well as the mole fractions of oxygen xO2 [-] and carbon dioxide xCO2 [-] in the ingas (α) and offgas (β) streams, the molar oxygen uptake rate (OUR) can be calculated as shown in Equation (9).
By including the molar mass of oxygen MO2 [g mol−1] and the calculation of [g m−3] (Schumpe et al., 1978), the KLa value can be calculated as an online variable (Equation 10):
Optimization of Fe(III)Citrate Levels
The optimal Fe(III)citrate concentration (within the boundaries 0–2 g L−1) for IMPI expression was determined using a seven-level factorial design at concentrations of 0, 0.33, 0.67, 1, 1.33, 1.67, and 2 g L−1. The cultures were inoculated at ΔOD600 = 0.1 and incubated at 37°C in 500 mL baffled shake flasks containing 50 mL medium, shaking at 250 rpm on a Multitron Standard shaker (Infors). At ΔOD600 = 1, IMPI expression was induced by addinig isopropyl-β-D-thiogalactopyranoside (IPTG; Carl Roth) at a final concentration of 1 mM followed by incubation for 4 h as above. The cells were then harvested by centrifugation (5,236 × g for 10 min at 4°C) in a Sigma 6-16 KS centrifuge equipped with a 11,650 rotor and four 13,650 cups (Sigma, Osterode am Harz, Germany). The pellet was disrupted for IMPI activity testing as described above. The results were evaluated using Design Expert v11 (Stat Ease, Minneapolis, MN, USA).
Optimization of Induction
Small-scale experiments to determine the best induction conditions in MiniBio 500 reactors were conducted using 250 mL of the chemically defined minimal medium supplemented with 7 g L−1 glucose at 37°C. The pH was maintained at 6.8 by adding 25% aqueous ammonia, which also provided nitrogen. DO levels were maintained at ≥30% by a cascade in which the stirrer speed was gradually increased from 1,000 to 1,600 rpm, then the air flow rate was increased from 0.1 to 1.67 vvm, and finally the O2 flow was increased from 0 to 0.47 vvm (relative to the initial volume). The fed-batch phase started with an initial feeding rate of F(t0) = 4.428 ×10⁻⁴ L h−1 after a sudden rise in the DO levels due to the depletion of glucose. The growth rate of the exponential feeding function was set to μ = 0.1 h−1. When the culture reached ΔOD600 = 17, induction conditions were investigated using response surface methodology and a central composite design. The design consisted of a total of 36 runs, investigating inductor (IPTG) levels in the range 0.1–2.1 mM, induction durations of 0.63–7.36 h and induction temperatures of 31.3–44.7°C. At given time points, samples were taken to measure ΔOD600, cell dry weight and product titers as described above.
Evaluation of Scale-Up
To determine the success of scale-up in terms of ΔOD600, KLa and product titers, the data for each scale were plotted as parity plots against the other scales followed by linear fitting. R2 was used to evaluate the linear dependency, and the difference in the resulting slope of the fit (sF) to the slope of the parity line (sP) was used to quantify the success of scale-up (Equation 11).
Results and Discussion
Optimization of Fe(III)Citrate Concentration
Iron is a critical factor for the growth of E. coli Rosetta gami B(DE3)pLysS cells (Joachim et al., 2018) but the impact of different iron concentrations on recombinant protein expression has not been tested in detail. We found that the effect of iron was significant (p = 0.0322). The quartic model based on the experimental data had a p-value of 0.0038 (F = 17.48) and had no significant lack of fit (p = 0.1839). The model was fitted with an adjusted R2 value of 0.8799. Optimization for the highest product titers revealed that the optimal Fe(III)citrate-hydrate concentration was 0.44 g L−1, which was selected for the iron-enriched minimal medium hereafter termed M9i. The effect of Fe(III)citrate-hydrate on the ΔOD600 at the time of harvest was also significant (p = 0.0051) as was the corresponding quartic model (p = 0.0004), which had no significant lack of fit (p = 0.5412) resulting in an adjusted R2 value of 0.9543. The model was confirmed by testing biological triplicates at 0.44 g L−1 Fe(III)citrate-hydrate, resulting in fusion protein yields of 0.098 ± 0.01 mg L−1. The 95% confidence interval of the model was met with these findings and the product concentration was similar to the 0.097 mg L−1 achieved using LB complex medium (Figure 2). The optimal Fe(III)citrate-hydrate concentration for recombinant protein expression in this strain (0.44 g L−1) agreed well with the optimum of 0.49 g L−1 for non-induced growth (Joachim et al., 2018). A possible explanation for the decrease of the product titers at concentrations above the determined optimum might be the negative effect of formed radicals on the growth of E. coli at high iron concentrations (Gelvan, 1997; Chamnongpol et al., 2002). Although the product titer of 0.098 ± 0.01 mg L−1 using M9i medium was similar to the low levels achieved using complex LB medium, such product titers are not uncommon for the production of AMPs in E. coli. For example, the yield of CM4 coupled to a thioredoxin tag was 1.4 mg L−1 (Zhou et al., 2009), and this declined to 0.6 mg L−1 when the same product was coupled to an ELP-intein tag (Shen et al., 2010). Although (Gaciarz et al., 2017) found no evidence for the efficient production of soluble proteins in redox-engineered E. coli strains growing in chemically defined media, we have shown that our M9i medium achieves comparable product titers to the same E. coli strains growing on complex LB medium.
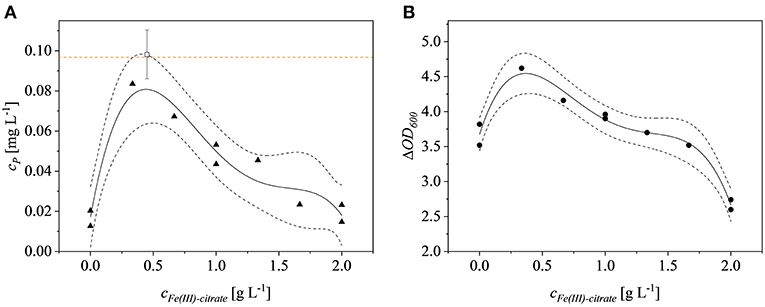
Figure 2. Fe(III)-citrate optimization. (A) Product concentration of the model runs (▴) and of the confirmation runs (□). The orange dotted line represents the product concentration achieved in LB complex medium with no additional Fe(III)-citrate. (B) ΔOD600 (•) at the time of harvest is dependent on the Fe(III)-citrate concentration. Dotted black lines represent the confidence bands (95%) of the plotted model (solid line).
Optimization of Induction Parameters
We found that the induction parameters had a significant influence on the yield of recombinant protein based on a cubic model (p < 0.0001) with no significant lack of fit (p = 0.4740). The fit of the model was possible with a predicted R2 value of 0.7335. Equation (12) shows the corresponding third-order polynomial equation, giving the recombinant protein concentration cP [mg L−1] as a function of the concentration of inducer cIPTG [mM], the duration of induction tind [h] and the temperature T [°C]:
Numerical optimization revealed an optimum, within the investigated parameter ranges, of 1.1 mM IPTG, an induction temperature of 40°C and at the longest induction time we evaluated (7.36 h). Given the model (Equation 12), the projected maximum product concentration cP; max was 1.1 mg L−1. The mean of three confirmation runs, under the predicted optimal conditions, was 1.03 ± 0.06 mg L−1 and thereby fitted the 95% confidence interval of the model and confirmed its validity (Figure 3). Some earlier studies found similar optimal induction conditions, such as 1 mM IPTG and no difference within the temperature range 37–42°C (Collins et al., 2013). Others achieved the highest recombinant protein yields at 0.1 mM IPTG and 22°C (Wang et al., 2005). The optimization of induction is therefore still a matter of trial and error (Papaneophytou and Kontopidis, 2014). The induction optimization experiments were performed at an exponential feed rate with a growth rate of 0.15 h−1 and at an induction ΔOD600 of 17 in the MiniBio 500 bioreactor. To determine the influence of higher feed rates and higher cell concentrations at the time of induction, an appropriate scale-up strategy was required.
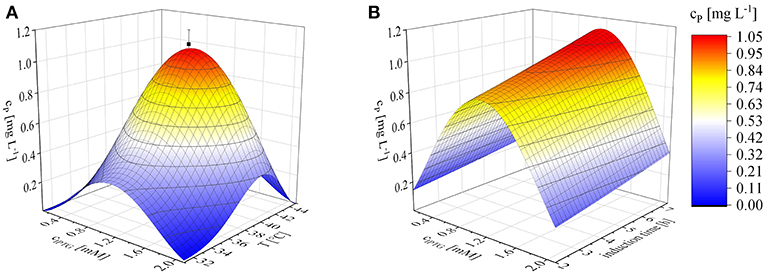
Figure 3. Optimization of induction to maximize the recombinant protein concentration (cP) using Equation (12), shown as 3D plots. (A) Concentration of inducer against temperature after induction for 6 h. (B) IPTG concentration against the duration of induction at a constant temperature of 40°C. Confirmation runs (■) under the optimal conditions predicted by the model were performed using biological triplicates.
Scaling Up the Production of IMPI
A vessel with a higher working volume was needed to increase the feed rate and hence the growth rate, allowing us to investigate the influence of induction at higher cell densities. To make sure the observed changes could be attributed to changes in the growth rate and cell density rather than the scale per se, the selected parameters (μset = 0.15 h−1 and induction at ΔOD600 = 17) were scaled up in parallel. The scale-up criteria applied in biotechnological processes have been widely reviewed (Junker, 2004; Schmidt, 2005; Garcia-Ochoa and Gomez, 2009). Junker (2004) emphasized constant DO levels as an appropriate scale-up criterion for microbial bioprocesses, as long as the DO is kept above 30–70% saturation (DO-const.). Controlling the DO levels solely by increasing the stirrer speed can lead to undesirable morphological changes (Okada and Iwamatu, 1997). Therefore, a combined scale-up strategy of a constant DO level (30% saturation) and matching P/V at the borders of the stirrer cascade was applied in this study. All cultivations were started at a P/V of ~3 kW m−3. Having reached the scale-up criteria (Figure 4A), a stirrer cascade was used to increase the P/V to a final value of ~12 kW m−3. During this phase, the influence of the stirrer speed (NStirrer) on P/V followed Equation (13) and the corresponding parameters are shown in Table 1. The steepening slope showing the progressively higher influence of the stirrer speed on P/V as the scale increased from 0.5 to 7.5 and finally 20 L was not surprising because the impeller diameter in Equation (3) is raised to the power 5, and thus has a massive impact on the P/V when the stirrer speed is increased (Figure 4B).
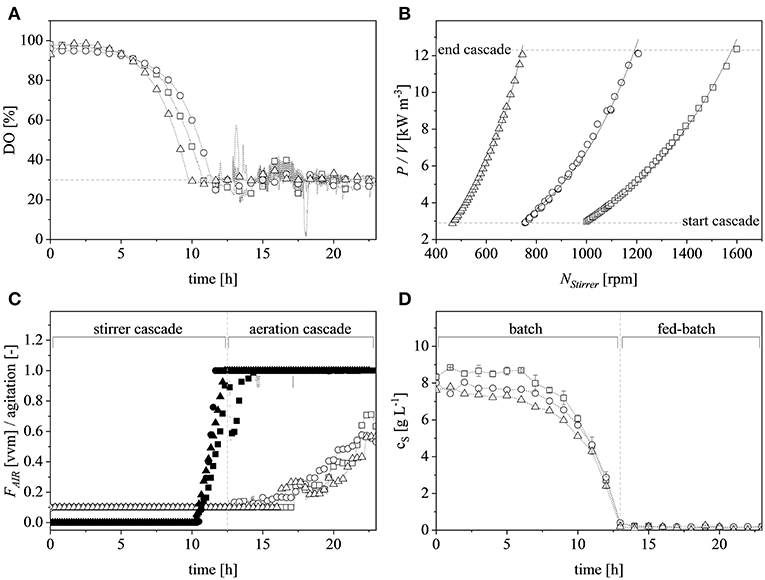
Figure 4. Scaling up by applying the combined criteria of constant dissolved oxygen (DO) levels and matching volumetric power input (P/V) at the limits of the stirrer cascade at the 0.5 L (□), 7.5 L (°) and 20 L (Δ) scales. (A) DO trends at the different scales during the course of cultivation. The dashed gray line represents the scale-up criteria of 30% DO. (B) P/V plotted against the agitation of the stirrer at the corresponding scale. The dashed gray lines show the cascade limits whereas the solid black lines show the exponential fits (R2 > 0.99 for all scales). (C) Normalized stirrer agitation over the course of a representative cultivation at the 0.5 L (■), 7.5 L (•), and 20 L (▴) scales, and after reaching the end of the cascade (dashed gray line) the subsequent aeration cascade over the course of a representative cultivation at the 0.5 L (□), 7.5 L (°), and 20 L (Δ) scales. (D) Glucose concentration over the course of a representative cultivation in the supernatant of the 0.5 L (□), 7.5 L (°), and 20 L (Δ) scales. Gray, dashed, vertical line depicts the total glucose depletion and therefore the start of the exponential feed profile.
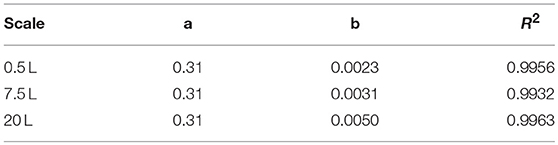
Table 1. Fitting parameters of the three scales (Equation 13).
After reaching the end of the stirrer cascade, the DO level was maintained at 30% by increasing the aeration rate from 0.1 to 1 vvm relative to the starting volume (Figure 4C). Following the initial batch phase, the fed-batch began after complete glucose depletion with the appropriate feed rate for each scale. The μset of 0.15 h−1 led to a glucose-limited fed-batch profile for all scales (Figure 4D). The growth rate in the initial batch phase was 0.43 h−1 for the 0.5 and 7.5 L reactors and 0.42 h−1 (corresponding to a generation time of approximately 1.6 h) at the 20 L scale (Figures 5A–C). After initiating the feeding, inducing with 1.1 mM IPTG and raising the temperature to 40°C, the growth rate fell to 0.11, 0.12, and 0.11 h−1 for the 0.5, 7.5, and 20 L scales, respectively (Figure 5D). Plotting the ΔOD600 values of the 0.5 and 7.5 L cultivations against each other revealed a linear dependency, with a difference to the line of parity of Δs = 0.1% (Figure 5B). A comparison of the ΔOD600 values of the 7.5 and 20 L scales also revealed a linear dependency and a Δs value of 4.6% (Figure 5C). Finally, the direct scale-up from 0.5 to 20 L revealed a linear dependency with a Δs value of 3.2% (Figure 5A). For all linear fits, R2 > 0.99. The ΔOD600 slopes for each comparison revealed <5% deviation from the line of parity at the different scales when the scale-up strategy of DO-const. and a matching P/V at the borders of the stirrer cascade was applied. Islam et al. (2008) showed that different KLa values severely affected the success of scaling up processes based on E. coli. Therefore, a scale-up methodology which duplicates the KLa trend during the course of cultivation should improve process reproducibility when changing scales. The DO reached 30% ~10 h after inoculation and was subsequently kept constant (Figure 4C). From this time point, it was possible to calculate the volumetric mass transfer coefficient online. The exponential growth in the KLa value during cultivation came as no surprise, given earlier reports of similar trends (Castan and Enfors, 2000). Moreover, the growth rates of the exponential functions (b in Equation 14) showed reasonable agreement with the μset of 0.15 h−1 (Table 2). As discussed above for the ΔOD600 values, plotting the KLa values of the smaller and larger scales against each other revealed a linear dependency (Figure 6). When the KLa of the 0.5 L system was compared to the larger scales, the difference to the line of parity (Δs) was 20.97% for the 7.5 L system and 21.8% for the 20 L system. However, when the two larger systems were compared the Δs value was only 0.16%. The discrepancy between the 0.5 L system and the larger scales was attributed to a technical artifact in the aeration strategy. A more or less pronounced stepwise increase in the air flow rate was observed at the different scales (Figure 4C) and had a more severe impact in the small-scale process. This stepwise increase in aeration was also found in the KLa values, hence the difference in the volumetric mass transfer coefficient from the 0.5 L scale to the larger scales.
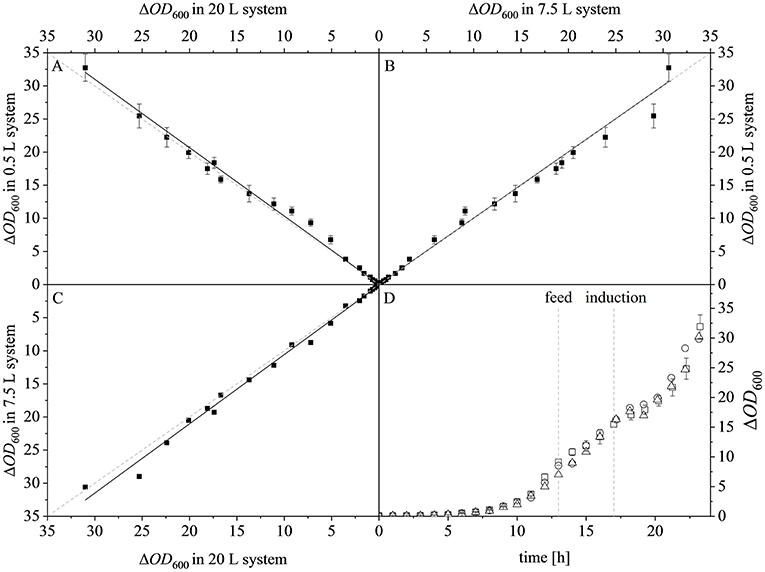
Figure 5. Optical densities (ΔOD600) at different scales. (A) Parity plot of ΔOD600 at the 20 L (x-axis) and 0.5 L (y-axis) scales, linear fit (y = 0.019 + 1.032x), R2 = 0.9940. (B) Parity plot of ΔOD600 at the 7.5 L (x-axis) and 0.5 L (y-axis) scales, linear fit (y = 0.033 + 1.001x), R2 = 0.9943. (C) Parity plot of ΔOD600 at the 20 L (x-axis) and 7.5 L (y-axis) scales, linear fit (y = 0.116 + 1.046x), R2 = 0.9969. Solid black lines show the linear fits and the dashed gray lines represent lines of parity. (D) ΔOD600 of the 0.5 L (□), 7.5 L (°), and 20 L (Δ) scales during the course of each fermentation.
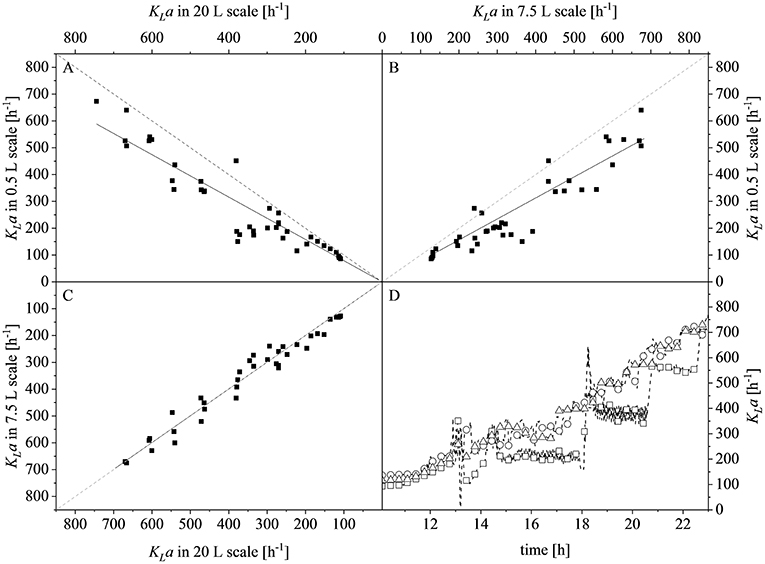
Figure 6. Comparison of volumetric mass transfer coefficients (KLa) at different scales and during the course of cultivation. (A) Parity plot of KLa for the 20 L (x-axis) and 0.5 L (y-axis) scales with a slope of 0.7903, R2 = 0.9595. (B) Parity plot of KLa for the 7.5 L (x-axis) and 0.5 L (y-axis) scales with a slope of 0.7820, R2 = 0.9634. (C) Parity plot of KLa for the 20 L (x-axis) and 7.5 L (y-axis) scales with a slope of 0.9984, R2 = 0.9895. Solid black lines show the linear fits and dashed gray lines represent lines of parity. (D) KLa values determined online for the 0.5 L (□), 7.5 L (°), and 20 L (Δ) scales during the course of each fermentation. Data points are connected by dashed lines to guide the eyes.
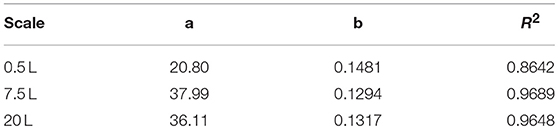
Table 2. Fitting parameters of the three scales (Equation 14).
Plotting the product concentrations (cP) of the 0.5 and 7.5 L scales against each other revealed a linear dependency with a slope of 0.88. Similarly there was a linear dependency between the 0.5 and 20 L scales with a slope of 1.20, and between the 7.5 and 20 L scales with a slope of 1.32. Hence, the difference between the slopes and the line of parity (Δs) at the three scales was 12 ± 4.2, 20 ± 5.9, and 32 ± 8.5%, respectively (Figures 7A–C). The high deviations were attributed to the intrinsic high error rate of the immunoassay. Weber et al. (2013) proposed that an inter-assay coefficient of variance of 22% is acceptable for ELISAs using biological samples. The highest product concentrations were reached after 6 h at all three scales: 0.5 L (1.64 ± 0.16 mg L−1), 7.5 L (2.03 ± 0.23 mg L−1), and 20 L (1.59 ± 0.21 mg L−1). There were no significant differences among the scales (p-values of 0.0810, 0.8531, and 0.0940, respectively). The scale-up of the fed-batch process was successful in terms of growth, volumetric mass coefficient and protein production. The similar behavior of the cultures when scale transfer was implemented using the combined scale-up criteria of a constant DO concentration and matching P/V at the borders of the stirrer cascade allowed us to test changes in the feed rate and time of induction at the 7.5 L scale, and also at the 20 L scale.
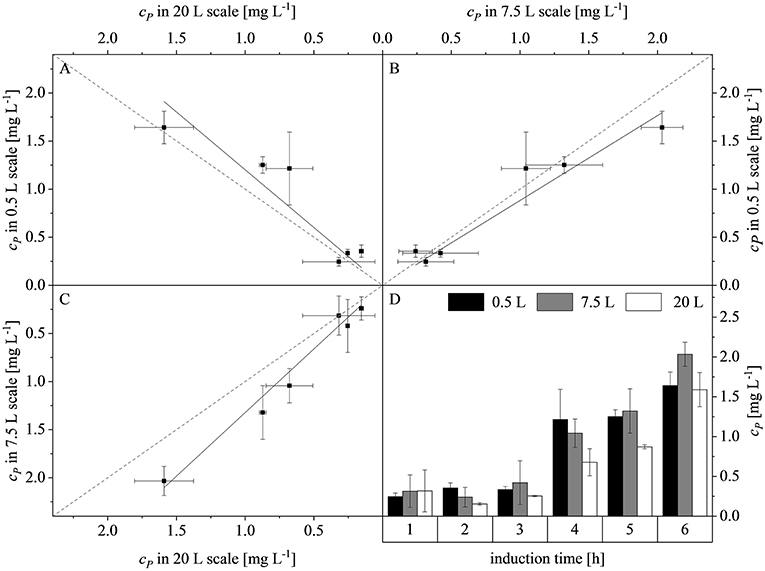
Figure 7. Concentration of recombinant protein (cP) compared among the production scales and during the course of induction. (A) Parity plot of cP at the 20 and 0.5 L scales (adj. R2 = 0.93, with a slope of 1.20). (B) Parity plot of cP at the 7.5 and 0.5 L scales (adj. R2 = 0.98, with a slope of 0.88). (C) Parity plot of cP at the 7.5 and 20 L scales (adj. R2 = 0.99, with a slope of 1.32). Solid black lines show the linear fits and dashed gray lines represent lines of parity. (D) Trend of cP during induction at the 0.5, 7.5, and 20 L scales.
Investigation of the Feed Rate and Time of Induction
After scaling up the established process from 0.5 to 7.5 L, we investigated the effect of increasing the feed rate. The specific growth rate of E. coli is known to affect plasmid stability and recombinat protein production in fed-batch processes (Hellmuth et al., 1994; Ramalingam et al., 2007). A feed rate (μset) of ~60% μmax should not result in the accumulation of additional acetate (Vidal et al., 2005). Others have reported that growth rates below 0.35 h−1 in minimal medium inhibit acetic acid formation (Choi et al., 2006). Increasing the μset from 0.15 to 0.25 h−1 (~60% of the μbatch) increased the maximum ΔOD600 from 30.8 ± 2.1 to 44.4 ± 4.0 (Figure 8). The concentration of recombinant protein improved by ~2.7 fold from 2.03 ± 0.23 mg L−1 to 5.25 ± 1.08 mg L−1. These findings are in line with earlier reports of improved product titers at higher growth rates (Sandén et al., 2003). Although the peptide chain elongation rate stays constant, the number of ribosomes per cell increases with increasing growth rate, which may explain the enhanced productivity at higher feed rates (Maaløe, 1979; Farewell and Neidhardt, 1998). In some reports, product concentrations increase with the growth rate up to a certain point and then decline (Siurkus et al., 2010). Although no glucose accumulated in the process with a μset of 0.15 h−1, glucose started to accumulate ~3 h after induction when μset was increased to 0.25 h−1 at ΔOD600 = 17. The premature termination of growth and production may reflect the use of a discontinuous pump in the Labfors3 bioreactor. Enhancing the feed rate in this system leads to higher oscillations in glucose availability and subsequently in DO levels. Such oscillating substrate availability (described as “feast-then-famine”) can promote the accumulation of acetate (Neubauer et al., 1995; Eiteman and Altman, 2006). The production of acetate is a loss in net carbon and therefore economically not desirable (Jensen and Carlsen, 1990). Even more so, acetate accumulation is inhibitory to E. coli growth (Luli and Strohl, 1990; Hahm et al., 1994) and recombinant protein production (Jensen and Carlsen, 1990; Koh et al., 1992). Earlier we hypothesized that E. coli Rosetta gami B(DE3)pLysS cells may contain higher levels of intracellular NAD(P)H (Joachim et al., 2018). A higher NADPH:NAD ratio can occur when approaching the threshold growth rate (Vemuri et al., 2006). A combination of these factors may explain the sensitivity of Rosetta gami B(DE3)pLysS cells to glucose fluctuation. After plotting the ΔOD600 against the cell dry weight (cX) of a dilution series and linear fitting with an adjusted R2 value of 0.9994, the cX[g L−1] was calculated using Equation (15), with a standard error of the slope of 0.00297 g L−1. Product yields (YP/X) [mg g−1] improved from 0.23 ± 0.001 mg g−1 to 0.42 ± 0.04 mg g−1 by increasing the feed growth rate from 0.15 h−1 to 0.25 h−1 (biomass calculated using correlation from Figure 9).
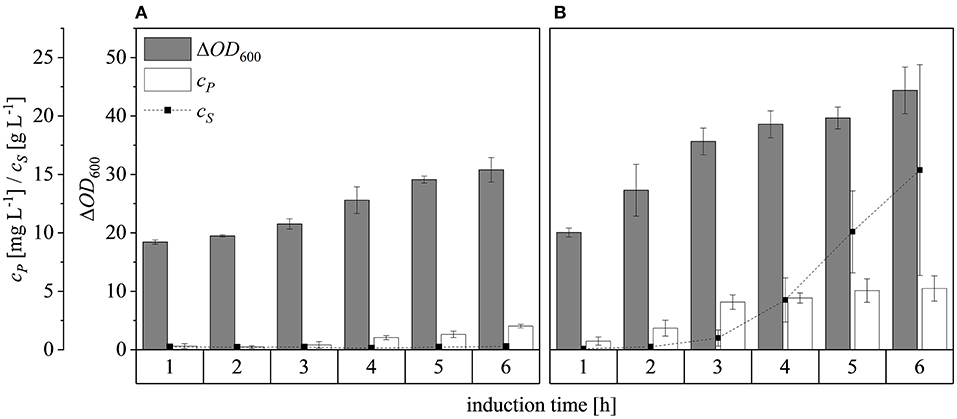
Figure 8. Optical densities (ΔOD600), product concentrations (cP) and substrate concentrations (cS) in the supernatant during induction at the 7.5 L scale. (A) Feed growth rate of 0.15 h−1 (B) Feed growth rate of 0.25 h−1. Hatched lines are provided to improve clarity.
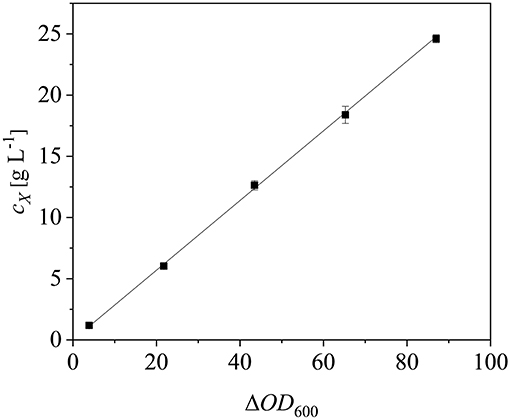
Figure 9. Correlation between cell dry weight (cX) and optical density (ΔOD600). Error bars show standard deviations of triplicates. The data were fitted linearly (R2 = 0.9994).
Changing the ΔOD600 at induction from 17 to 30 and then 50, and subsequently feeding at a rate of μset = 0.25 h−1, resulted in final ΔOD600 values after induction for 6 h of 44.4 ± 4.0, 73.7 ± 12.5, and 127.5 ± 13.1, respectively (Figure 10). Although glucose accumulated 3 h after induction at ΔOD600 = 17, only a small amount accumulated after induction at ΔOD600 = 30 and it started to accumulate ~5 h after induction at ΔOD600 = 50. For all cases, both growth and protein production stagnated once glucose accumulation was detected. Possible reasons for the sudden growth and production stagnation might be the inhibitory effect of formed by-products (Jensen and Carlsen, 1990) or the metabolic overload due to the IPTG induction (Cserjan-Puschmann et al., 1999). An abrupt growth stagnation, paired with stagnating recombinant protein production and a sudden rise in glucose levels, in induced glucose limited fed-batch operations, was also reported by Pinsach et al. (2008). An overload of the host cell due to the induction pulse was emphasized as the reason behind the systems collapse. The highest product titers were 5.3 ± 1.1 mg L−1, 13.0 ± 3.8 mg L−1, and 20.4 ± 1.8 mg L−1 at induction ΔOD600 values of 17, 30, and 50, respectively. The ability of high cell densities to significantly increase recombinant protein production in E. coli has been reported before (Choi et al., 2006; Sivashanmugam et al., 2009). In agreement with previous reports (Yee and Blanch, 1992; Galloway et al., 2003), we found that the point of induction showed a profound effect on the product yields. When the induction ΔOD600 was changed from 17 to 30, the product yield increased from 0.42 ± 0.04 to 0.72 ± 0.05 mg g−1, but it decreased to 0.61 ± 0.01 mg g−1 when the culture was induced at ΔOD600 = 50 (Figure 7D). The volumetric production yield was still highest when induced at ΔOD600 = 50, due to the greater quantity of biomass in the vessel.
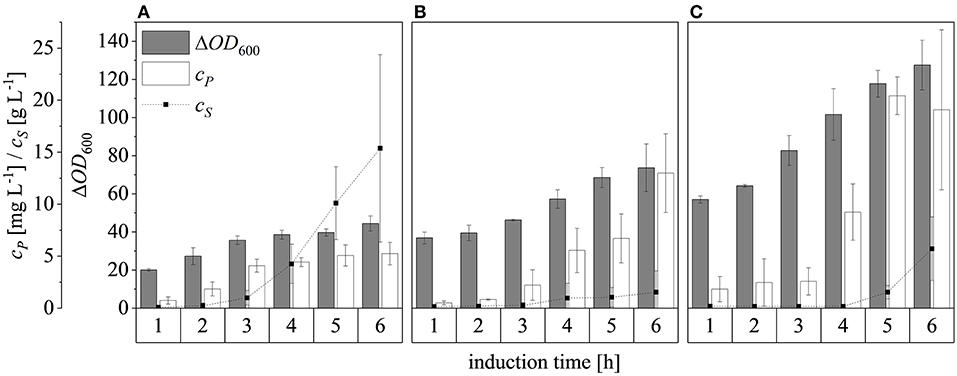
Figure 10. Optical densities (ΔOD600), product concentrations (cP) and substrate concentrations (cS) in the supernatant after induction at ΔOD600 values of 17 (A), 30 (B), and 50 (C). Experiments were performed at the 7.5 L scale with a μset of 0.25 h−1 after induction. Hatched lines are provided to improve clarity.
AMP Activity
The ELP-coupled IMPI(I38V) samples produced using the standard process (LB complex medium, induction at 37°C with 1.0 mM IPTG) and under the optimized conditions (M9i minimal medium, induction at 40°C with 1.1 mM IPTG) were each found to be active (Figure 11). Even though protein folding is known to be enhanced by reducing the induction temperature (Georgiou and Valax, 1996), we found that a higher temperature was beneficial for IMPI. This is supported by earlier reports in which a higher induction temperature did not result in a significant increase in the quantity of recombinant protein segregating into inclusion bodies (Larentis et al., 2011). Furthermore, higher temperatures can also improve the synthesis of some proteins in E. coli (Yamamori et al., 1978) potentially explaining the positive effect we observed when the temperature was increased at the time of induction.
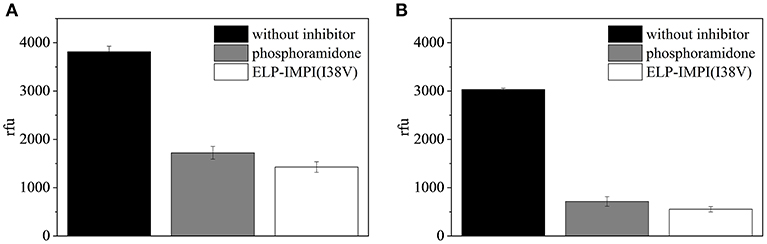
Figure 11. Fluorescence-based assay to test the activity of IMPI against thermolysin. A replicate assay lacking IMPI served as a negative control, and phosphoramidon was included as a positive control. Error bars represent the standard deviation of triplicates. (A) ELP-IMPI(I38V) produced using LB complex medium, induction at 37°C with 1.0 mM IPTG. (B) ELP-IMPI(I38V) produced using M9i minimal medium, induction at 40°C with 1.1 mM IPTG.
Conclusion
The minimal medium enriched with Fe(III)-citrate (M9i) was comparable in performance to LB complex medium when recombinant ELP-coupled IMPI was produced in the redox-engineered E. coli strain Rosetta gami B(DE3)pLysS. Optimal induction was achieved at 40°C with 1.1 mM IPTG. Suitable scale-up criteria for the multi-cascaded fed-batch process were found by combining a constant DO and matching volumetric power inputs at the borders of the stirrer cascade. Changes in the exponential feed rate and the time of induction improved the titers of the recombinant protein. The time of harvest was determined by growth depletion and subsequently glucose accumulation. In summary, process intensification resulted in a scalable bioprocess with enhanced productivity, allowing us to develop a simple and controllable process for the production of an active AMP in E. coli. The use of self-aggregating ELP tags simplifies the process by allowing the integration of upstream production and downstream processing. Furthermore, the proposed sensitivity of the E. coli strain to fluctuations in feed concentration and oxygen saturation is striking and should be investigated in more detail.
Data Availability
All datasets generated for this study are included in the manuscript.
Author Contributions
MJ designed and performed the experiments and wrote the paper. NM and JS assisted with the experiments. DG and PC helped to draft and revise the manuscript, and supervised the research. All authors contributed to manuscript revision, read, and approved the submitted version.
Funding
This work was financially supported by the Hessian Ministry of Education and Art within the Hessian initiative for supporting economic and scientific excellence (LOEWE). Part of the work was funded by the German Ministry of Education and Research (BMBF) via the project 4-IN.
Conflict of Interest Statement
The authors declare that the research was conducted in the absence of any commercial or financial relationships that could be construed as a potential conflict of interest.
Acknowledgments
The authors acknowledge Dr. Richard M. Twyman for editorial assistance.
Supplementary Material
The Supplementary Material for this article can be found online at: https://www.frontiersin.org/articles/10.3389/fbioe.2019.00150/full#supplementary-material
References
Banki, M. R., Feng, L., and Wood, D. W. (2005). Simple bioseparations using self-cleaving elastin-like polypeptide tags. Nat. Methods 2, 659–661. doi: 10.1038/nmeth787
Berkmen, M. (2012). Production of disulfide-bonded proteins in Escherichia coli. Protein Expr. Purif. 82, 240–251. doi: 10.1016/j.pep.2011.10.009
Bolouri Moghaddam, M. R., Tonk, M., Schreiber, C., Salzig, D., Czermak, P., Vilcinskas, A., et al. (2016). The potential of the Galleria mellonella innate immune system is maximized by the co-presentation of diverse antimicrobial peptides. Biol. Chem. 397, 939–945. doi: 10.1515/hsz-2016-0157
Castan, A., and Enfors, S.-O. (2000). Characteristics of a DO-controlled fed-batch culture of Escherichia coli. Bioprocess Eng. 22, 509–515. doi: 10.1007/s004499900094
Chamnongpol, S., Dodson, W., Cromie, M. J., Harris, Z. L., and Groisman, E. A. (2002). Fe(III)-mediated cellular toxicity. Mol. Microbiol. 45, 711–719. doi: 10.1046/j.1365-2958.2002.03041.x
Choi, J. H., Keum, K. C., and Lee, S. Y. (2006). Production of recombinant proteins by high cell density culture of Escherichia coli. Chem. Eng. Sci. 61, 876–885. doi: 10.1016/j.ces.2005.03.031
Collins, T., Azevedo-Silva, J., da Costa, A., Branca, F., Machado, R., and Casal, M. (2013). Batch production of a silk-elastin-like protein in E. coli BL21(DE3): Key parameters for optimisation. Microb. Cell Fact. 12:21. doi: 10.1186/1475-2859-12-21
Costelloe, C., Metcalfe, C., Lovering, A., Mant, D., and Hay, A. D. (2010). Effect of antibiotic prescribing in primary care on antimicrobial resistance in individual patients: systematic review and meta-analysis. BMJ. 340:c2096. doi: 10.1136/bmj.c2096
Cserjan-Puschmann, M., Kramer, W., Duerrschmid, E., Striedner, G., and Bayer, K. (1999). Metabolic approaches for the optimisation of recombinant fermentation processes. Appl. Microbiol. Biotechnol. 53, 43–50. doi: 10.1007/s002530051612
Eisenhardt, M., Dobler, D., Schlupp, P., Schmidts, T., Salzig, M., Vilcinskas, A., et al. (2015). Development of an insect metalloproteinase inhibitor drug carrier system for application in chronic wound infections. J. Pharm. Pharmacol. 67, 1481–1491. doi: 10.1111/jphp.12452
Eiteman, M. A., and Altman, E. (2006). Overcoming acetate in Escherichia coli recombinant protein fermentations. Trends Biotechnol. 24, 530–536. doi: 10.1016/j.tibtech.2006.09.001
Farewell, A., and Neidhardt, F. C. (1998). Effect of Temperature on in vivo protein synthetic capacity in andlt;emandgt;Escherichia coliandlt;/emandgt. J. Bacteriol. 180:4704.
Gaciarz, A., Khatri, N. K., Velez-Suberbie, M. L., Saaranen, M. J., Uchida, Y., Keshavarz-Moore, E., et al. (2017). Efficient soluble expression of disulfide bonded proteins in the cytoplasm of Escherichia coli in fed-batch fermentations on chemically defined minimal media. Microb. Cell Fact. 16:108. doi: 10.1186/s12934-017-0721-x
Galloway, C. A., Sowden, M. P., and Smith, H. C. (2003). Increasing the yield of soluble recombinant protein expressed in E. coli by induction during late log phase. BioTechniques 34, 524–530. doi: 10.2144/03343st04
Garcia-Ochoa, F., and Gomez, E. (2009). Bioreactor scale-up and oxygen transfer rate in microbial processes: an overview. Biotechnol. Adv. 27, 153–176. doi: 10.1016/j.biotechadv.2008.10.006
Gelvan, D. (1997). Enhancement of adriamycin toxicity by iron chelates is not a free radical mechanism. Biol. Trace Elem. Res. 56, 295–309. doi: 10.1007/BF02785301
Georgiou, G., and Valax, P. (1996). Expression of correctly folded proteins in Escherichia coli. Curr. Opin. Biotechnol. 7, 190–197. doi: 10.1016/S0958-1669(96)80012-7
Goossens, H., Ferech, M., Vander Stichele, R., and Elseviers, M. (2005). Outpatient antibiotic use in Europe and association with resistance: a cross-national database study. Lancet 365, 579–587. doi: 10.1016/S0140-6736(05)17907-0
Hahm, D. H., Pan, J., and Rhee, J. S. (1994). Characterization and evaluation of a pta (phosphotransacetylase) negative mutant of Escherichia coli HB101 as production host of foreign lipase. Appl. Microbiol. Biotechnol. 42, 100–107. doi: 10.1007/BF00170231
Hancock, R. E. W., and Sahl, H.-G. (2006). Antimicrobial and host-defense peptides as new anti-infective therapeutic strategies. Nat. Biotechnol. 24, 1551–1557. doi: 10.1038/nbt1267
Hassouneh, W., Christensen, T., and Chilkoti, A. (2010). Elastin-like polypeptides as a purification tag for recombinant proteins. Curr. Protoc. Protein Sci. Chapter 6:Unit 6.11. doi: 10.1002/0471140864.ps0611s61
Hellmuth, K., Korz, D. J., Sanders, E. A., and Deckwer, W.-D. (1994). Effect of growth rate on stability and gene expression of recombinant plasmids during continuous and high cell density cultivation of Escherichia coli TG1. J. Biotechnol. 32, 289–298. doi: 10.1016/0168-1656(94)90215-1
Henzler, H.-J. (1982). Verfahrenstechnische auslegungsunterlagen für rührbehälter als fermenter. Chem. Ingenieur Tech. 54, 461–476. doi: 10.1002/cite.330540510
Hoffmann, D., Eckhardt, D., Gerlach, D., Vilcinskas, A., and Czermak, P. (2019). Downstream processing of Cry4AaCter-induced inclusion bodies containing insect-derived antimicrobial peptides produced in Escherichia coli. Protein Expr. Purif. 155, 120–129. doi: 10.1016/j.pep.2018.12.002
Islam, R. S., Tisi, D., Levy, M. S., and Lye, G. J. (2008). Scale-up of Escherichia coli growth and recombinant protein expression conditions from microwell to laboratory and pilot scale based on matched k(L)a. Biotechnol. Bioeng. 99, 1128–1139. doi: 10.1002/bit.21697
Jensen, E. B., and Carlsen, S. (1990). Production of recombinant human growth hormone in Escherichia coli: expression of different precursors and physiological effects of glucose, acetate, and salts. Biotechnol. Bioeng. 36, 1–11.
Joachim, M., Schäfer, J. G., Gerlach, D., and Czermak, P. (2018). High cell density cultivation of Δ gor /Δ trxB E. coli in a chemically defined minimal medium with an enhanced iron concentration. Process Biochem. 73, 1–5. doi: 10.1016/j.procbio.2018.07.022
Joerger, R. D. (2003). Alternatives to antibiotics: bacteriocins, antimicrobial peptides and bacteriophages. Poult. Sci. 82, 640–647. doi: 10.1093/ps/82.4.640
Junker, B. H. (2004). Scale-up methodologies for Escherichia coli and yeast fermentation processes. J. Biosci. Bioeng. 97, 347–364. doi: 10.1016/S1389-1723(04)70218-2
Klein, E. Y., van Boeckel, T. P., Martinez, E. M., Pant, S., Gandra, S., Levin, S. A., et al. (2018). Global increase and geographic convergence in antibiotic consumption between 2000 and 2015. Proc. Natl. Acad. Sci. U.S.A. 5:201717295. doi: 10.1073/pnas.1717295115
Koh, B. T., Nakashimada, U., Pfeiffer, M., and Yap, M. G. S. (1992). Comparison of acetate inhibition on growth of host and recombinantE. coli K12 strains. Biotechnol. Lett. 14, 1115–1118.
Larentis, A. L., Argondizzo, A. P. C., Esteves, G. D. S., Jessouron, E., Galler, R., et al. (2011). Cloning and optimization of induction conditions for mature PsaA (pneumococcal surface adhesin A) expression in Escherichia coli and recombinant protein stability during long-term storage. Protein Expr. Purif. 78, 38–47. doi: 10.1016/j.pep.2011.02.013
Luli, G. W., and Strohl, W. R. (1990). Comparison of growth, acetate production, and acetate inhibition of Escherichia coli strains in batch and fed-batch fermentations. Appl. Environ. Microbiol. 56, 1004–1011.
Maaløe, O. (1979). “Regulation of the Protein-Synthesizing Machinery—Ribosomes, tRNA, Factors, and So On,” in Biological Regulation and Development: Gene Expression, ed R. F. Goldberger (Boston, MA: Springer US, 487–542.
Meyer, D. E., and Chilkoti, A. (1999). Purification of recombinant proteins by fusion with thermally-responsive polypeptides. Nat. Biotechnol. 17, 1112–1115. doi: 10.1038/15100
Mylonakis, E., Podsiadlowski, L., Muhammed, M., and Vilcinskas, A. (2016). Diversity, evolution and medical applications of insect antimicrobial peptides. Philos. Trans. R. Soc. Lond. B Biol. Sci. 371:20150290. doi: 10.1098/rstb.2015.0290
Neubauer, P., Häggström, L., and Enfors, S. O. (1995). Influence of substrate oscillations on acetate formation and growth yield in Escherichia coli glucose limited fed-batch cultivations. Biotechnol. Bioeng. 47, 139–146. doi: 10.1002/bit.260470204
Okada, S., and Iwamatu, S. (1997). Scale-up production of milbemycin by Streptomyces hygroscopicus subsp.aureolacrimosus with control of internal pressure, temperature, aeration and agitation. J. Chem. Technol. Biotechnol. 70, 179–187. doi: 10.1002/(SICI)1097-4660(199710)70:2<179:AID-JCTB741>3.0.CO2-A
Papaneophytou, C. P., and Kontopidis, G. (2014). Statistical approaches to maximize recombinant protein expression in Escherichia coli: a general review. Protein Expr. Purif. 94, 22–32. doi: 10.1016/j.pep.2013.10.016
Pinsach, J., Mas, C., and de López-Santín, J. (2008). Induction strategies in fed-batch cultures for recombinant protein production in Escherichia coli: application to rhamnulose 1-phosphate aldolase. Biochem. Eng. J. 41, 181–187. doi: 10.1016/j.bej.2008.04.013
Pöppel, A.-K., Vogel, H., Wiesner, J., and Vilcinskas, A. (2015). Antimicrobial peptides expressed in medicinal maggots of the blow fly Lucilia sericata show combinatorial activity against bacteria. Antimicrob. Agents Chemother. 59, 2508–2514. doi: 10.1128/AAC.05180-14
Ramalingam, S., Gautam, P., Mukherjee, K. J., and Jayaraman, G. (2007). Effects of post-induction feed strategies on secretory production of recombinant streptokinase in Escherichia coli. Biochem. Eng. J. 33, 34–41. doi: 10.1016/j.bej.2006.09.019
Sanchez-Garcia, L., Martin, L., Mangues, R., Ferrer-Miralles, N., Vazquez, E., and Villaverde, A. (2016). Recombinant pharmaceuticals from microbial cells: a 2015 update. Microb. Cell Fact. 15:33. doi: 10.1186/s12934-016-0437-3
Sandén, A. M., Prytz, I., Tubulekas, I., Förberg, C., Le, H., Hektor, A., et al. (2003). Limiting factors in Escherichia coli fed-batch production of recombinant proteins. Biotechnol. Bioeng. 81, 158–166. doi: 10.1002/bit.10457
Schmidt, F. R. (2005). Optimization and scale up of industrial fermentation processes. Appl. Microbiol. Biotechnol. 68, 425–435. doi: 10.1007/s00253-005-0003-0
Schreiber, C., Müller, H., Birrenbach, O., Klein, M., Heerd, D., Weidner, T., et al. (2017). A high-throughput expression screening platform to optimize the production of antimicrobial peptides. Microb. Cell Fact. 16:29. doi: 10.1186/s12934-017-0637-5
Schumpe, A., Adler, I., and Deckwer, W.-D. (1978). Solubility of oxygen in electrolyte solutions. Biotechnol. Bioeng. 20, 145–150. doi: 10.1002/bit.260200114
Shen, Y., Ai, H.-X., Song, R., Liang, Z.-N., Li, J.-F., and Zhang, S.-Q. (2010). Expression and purification of moricin CM4 and human β-defensins 4 in Escherichia coli using a new technology. Microbiol. Res. 165, 713–718. doi: 10.1016/j.micres.2010.01.002
Singh, S. M., and Panda, A. K. (2005). Solubilization and refolding of bacterial inclusion body proteins. J. Biosci. Bioeng. 99, 303–310. doi: 10.1263/jbb.99.303
Siurkus, J., Panula-Perälä, J., Horn, U., Kraft, M., Rimseliene, R., and Neubauer, P. (2010). Novel approach of high cell density recombinant bioprocess development: optimisation and scale-up from microliter to pilot scales while maintaining the fed-batch cultivation mode of E. coli cultures. Microb. Cell Fact. 9:35. doi: 10.1186/1475-2859-9-35
Sivashanmugam, A., Murray, V., Cui, C., Zhang, Y., Wang, J., and Li, Q. (2009). Practical protocols for production of very high yields of recombinant proteins using Escherichia coli. Protein Sci. 18, 936–948. doi: 10.1002/pro.102
Tonk, M., and Vilcinskas, A. (2016). The medical potential of antimicrobial peptides from insects. CTMC 17, 554–575. doi: 10.2174/1568026616666160713123654
Trabbic-Carlson, K., Liu, L., Kim, B., and Chilkoti, A. (2004). Expression and purification of recombinant proteins from Escherichia coli: comparison of an elastin-like polypeptide fusion with an oligohistidine fusion. Protein Sci. 13, 3274–3284. doi: 10.1110/ps.04931604
Vemuri, G. N., Altman, E., Sangurdekar, D. P., Khodursky, A. B., and Eiteman, M. A. (2006). Overflow metabolism in Escherichia coli during steady-state growth: transcriptional regulation and effect of the redox ratio. Appl. Environ. Microbiol. 72, 3653–3661. doi: 10.1128/AEM.72.5.3653-3661.2006
Vidal, L., Ferrer, P., Alvaro, G., Benaiges, M. D., and Caminal, G. (2005). Influence of induction and operation mode on recombinant rhamnulose 1-phosphate aldolase production by Escherichia coli using the T5 promoter. J. Biotechnol. 118, 75–87. doi: 10.1016/j.jbiotec.2005.02.012
Wang, Y. H., Jing, C. F., Yang, B., Mainda, G., Dong, M.-,l., and Xu, A.-,l. (2005). Production of a new sea anemone neurotoxin by recombinant Escherichia coli: optimization of culture conditions using response surface methodology. Process Biochem. 40, 2721–2728. doi: 10.1016/j.procbio.2004.12.024
Weber, D., Milkovic, L., Bennett, S. J., Griffiths, H. R., Zarkovic, N., and Grune, T. (2013). Measurement of HNE-protein adducts in human plasma and serum by ELISA-comparison of two primary antibodies. Redox Biol. 1, 226–233. doi: 10.1016/j.redox.2013.01.012
Wedde, M., Weise, C., Kopacek, P., Franke, P., and Vilcinskas, A. (1998). Purification and characterization of an inducible metalloprotease inhibitor from the hemolymph of greater wax moth larvae, Galleria mellonella. Eur. J. Biochem. 255, 535–543. doi: 10.1046/j.1432-1327.1998.2550535.x
Wood, D. W., Derbyshire, V., Wu, W., Chartrain, M., Belfort, M., and Belfort, G. (2000). Optimized single-step affinity purification with a self-cleaving intein applied to human acidic fibroblast growth factor. Biotechnol. Prog. 16, 1055–1063. doi: 10.1021/bp0000858
Wood, D. W., Wu, W., Belfort, G., Derbyshire, V., and Belfort, M. (1999). A genetic system yields self-cleaving inteins for bioseparations. Nat. Biotechnol. 17, 889–892. doi: 10.1038/12879
Yamamori, T., Ito, K., Nakamura, Y., and Yura, T. (1978). Transient regulation of protein synthesis in Escherichia coli upon shift-up of growth temperature. J. Bacteriol. 134:1133.
Yee, L., and Blanch, H. W. (1992). Recombinant protein expression in high cell density fed-batch cultures of Escherichia Coli. Nat. Biotechnol. 10, 1550–1556. doi: 10.1038/nbt1292-1550
Zhang, W., Zheng, W., Mao, M., and Yang, Y. (2014). Highly efficient folding of multi-disulfide proteins in superoxidizing Escherichia coli cytoplasm. Biotechnol. Bioeng. 111, 2520–2527. doi: 10.1002/bit.25309
Zhou, L., Lin, Q., Li, B., Li, N., and Zhang, S. (2009). Expression and purification the antimicrobial peptide CM4 in Escherichia coli. Biotechnol. Lett. 31, 437–441. doi: 10.1007/s10529-008-9893-0
Keywords: chemically defined minimal medium, disulfide bonds, rosetta gami, glutathione reductase, thioredoxin reductase, insect metalloproteinase inhibitor (IMPI)
Citation: Joachim M, Maguire N, Schäfer J, Gerlach D and Czermak P (2019) Process Intensification for an Insect Antimicrobial Peptide Elastin-Like Polypeptide Fusion Produced in Redox-Engineered Escherichia coli. Front. Bioeng. Biotechnol. 7:150. doi: 10.3389/fbioe.2019.00150
Received: 02 April 2019; Accepted: 06 June 2019;
Published: 27 June 2019.
Edited by:
Joseph Boudrant, Centre National de la Recherche Scientifique (CNRS), FranceReviewed by:
Jérémy Couturier, Université de Lorraine, FranceHui Wu, East China University of Science and Technology, China
Copyright © 2019 Joachim, Maguire, Schäfer, Gerlach and Czermak. This is an open-access article distributed under the terms of the Creative Commons Attribution License (CC BY). The use, distribution or reproduction in other forums is permitted, provided the original author(s) and the copyright owner(s) are credited and that the original publication in this journal is cited, in accordance with accepted academic practice. No use, distribution or reproduction is permitted which does not comply with these terms.
*Correspondence: Peter Czermak, cGV0ZXIuY3plcm1ha0Bsc2UudGhtLmRl