 Chaolu Meng
 Shunshan Jin3†
 Lei Wang
 Fei Guo
 Quan Zou
- 1College of Intelligence and Computing, Tianjin University, Tianjin, China
- 2College of Computer and Information Engineering, Inner Mongolia Agricultural University, Hohhot, China
- 3Department of Neurology, Heilongjiang Province Land Reclamation Headquarters General Hospital, Harbin, China
- 4College of Computer Engineering and Applied Mathematics, Changsha University, Changsha, China
- 5Institute of Fundamental and Frontier Sciences, University of Electronic Science and Technology of China, Chengdu, China
- 6Center for Informational Biology, University of Electronic Science and Technology of China, Chengdu, China
Antioxidant proteins play important roles in countering oxidative damage in organisms. Because it is time-consuming and has a high cost, the accurate identification of antioxidant proteins using biological experiments is a challenging task. For these reasons, we proposed a model using machine-learning algorithms that we named AOPs-SVM, which was developed based on sequence features and a support vector machine. Using a testing dataset, we conducted a jackknife cross-validation test with the proposed AOPs-SVM classifier and obtained 0.68 in sensitivity, 0.985 in specificity, 0.942 in average accuracy, 0.741 in MCC, and 0.832 in AUC. This outperformed existing classifiers. The experiment results demonstrate that the AOPs-SVM is an effective classifier and contributes to the research related to antioxidant proteins. A web server was built at http://server.malab.cn/AOPs-SVM/index.jsp to provide open access.
Introduction
The antioxidant system in organisms has the ability to prevent damage caused by reactive oxygen species (ROS) (Siswoyo et al., 2011). The ROS, which include hydrogen peroxide, singlet oxygen, superoxide anion radical, hydroxyl radical, and nitric oxide, are the product of the metabolism and influence fatty acids, proteins, and DNA (Sögüt et al., 2003). An excess of ROS or the depression of the antioxidant system can lead to oxidative stress (Zima et al., 2001; Krishnaiah et al., 2007). This oxidative stress may then go on to lead to a series of pathological conditions such as heart disease, malaria, neurodegenerative diseases, AIDS, cancer, and the aging process (Ames, 1983; GEY, 1990; Ames et al., 1993; Smith et al., 1996; Diaz et al., 1997; Yang et al., 2019a).
Natural antioxidants are regarded as the second antioxidant defense line in organisms (Yigit et al., 2014), and have recently attracted increasing attention from researchers. Such antioxidants are mainly extracted from dietary sources such as fruits, vegetables, and foods with carotenoids and vitamin A (Geetha et al., 2002; Podsedek, 2007; Tang et al., 2019a,b). When these antioxidants are consumed, they scavenge from the ROS and minimize the oxidative stress, thus reducing the risk to organisms (Yang et al., 2017). Many extracted or purified proteins are used as natural antioxidants, including soy proteins, lactoferrin, casein, β-lactoglobulin, canola proteins, yam dioscorin, egg albumen proteins, maize zein, egg yolk phosvitin, and potato patatin. In addition, proteins extracted from fertilized eggs, jellyfish, white beans, chickpeas, melinjo (gnetum gnemon) seeds, and ginkgo biloba seeds were also reported to have antioxidant properties (Rajalakshmi and Narasimhan, 1996; Chiue et al., 1997; Maheswari et al., 1997; Kouoh et al., 1999; Satué-Gracia et al., 2000; Hou et al., 2001; Liu et al., 2003; Cumby et al., 2008; Huang et al., 2010; Li et al., 2017). In vitro assay systems are commonly employed to identify the antioxidant activity of a new protein, including any scavenging effect on DPPH and ABTS, the inhibition of linoleic acid autoxidation, any chelating or strength-reducing capabilities, and protections against DNA damage caused by hydroxyl radical-mediation (Liu et al., 2003; Dastmalchi et al., 2008; Sachindra and Bhaskar, 2008; Huang et al., 2010; Fu et al., 2018). However, the in vitro experiment is time-consuming and inefficient. Therefore, to increase the success rate, it is desirable to develop a classifier to confirm antioxidant proteins prior to the in vitro experiment.
Recently, several researchers have used a computational approach to the identification of antioxidant proteins. Enrique Fernandez-Blanco et al. used star graph topological indices and random forests to develop a model for identifying antioxidant proteins (Fernández-Blanco et al., 2013). However, when analyzing the dataset, we found that the sequences used for the training model do not include the removal of redundant data. As a result, data similarity increases, which makes the results of the model untrustworthy. In 2013, Feng et al. developed a Naive Bayes model based on a sequence feature (Feng et al., 2013b), and in 2016, they constructed a model named AodPred based on the support vector machine using a 3-gap dipeptides feature (Feng et al., 2016). Xu et al. also used the support vector machine to construct a model to identify antioxidant proteins (Xu et al., 2018). The latter two models were built on the same training dataset and included a sequence to remove redundant data. The analysis of the results indicates that there is room to improve the identification accuracy. The training set for our model is the same as the two models mentioned above. In the bioinformatics field, applying computational methods to identify a particular protein mainly requires machine-learning techniques. The process can be divided into two main steps: (1) extracting features from protein sequences, and (2) constructing classifiers.
The first step is to extract discriminative features from a protein sequence. Sequence-order information or its combination with biochemical characteristics of proteins is a common approach. The most popular is the pseudo amino acid (PseAAC) method proposed by Shen and Chou (2006). Subsequently, many methods based on PseAAC have emerged (Liu et al., 2015, 2017; Zhu et al., 2015, 2018; Chen et al., 2016; Tang et al., 2016; Yang et al., 2016). In addition, there are also features to indicate the evolutionary and secondary structure information, primarily the PSI-BLAST (Altschul et al., 1997) and PSI-PRED (Jones, 1999) profiles. Then, a dimension-reduction algorithm is often applied to reduce the redundant information of extracting features (Liu, 2017; Tang et al., 2018; Xue et al., 2018; Tan et al., 2019; Zhu et al., 2019); these include ANOVA (Anderson, 2001; Ding and Li, 2015; Li et al., 2019b), mRMR (Peng et al., 2005), and MRMD (Zou et al., 2016b). These algorithms rank the features using certain criteria and then select the optimal feature. In the second step, classification algorithms have been applied to train on the optimal feature set and construct model. The support vector machine has been widely used and has obtained good results (Ding and Dubchak, 2001; Shamim et al., 2007; Yang and Chen, 2011; Feng et al., 2013a; Zou et al., 2016a; Ding et al., 2017; Chen et al., 2019). Furthermore, other classification methods, such as the hidden Markov mode (Bouchaffra and Tan, 2006), random forests (Dehzangi et al., 2010), and neural networks (Chen et al., 2007) have been used in this step. There are also ensemble classifiers. For example, Zou et al. proposed libD3C (Lin et al., 2014), which integrates multiple weak classifiers and voting for the final result.
Materials and Methods
Benchmark Dataset
We used the same dataset as Feng and Xu et al. The positive dataset was generated as follows. (1) The sequences marked as “antioxidant” in the Universal Protein Resource (Uniport) (2014_02 release) were selected. (2) Sequences that contained residues such as “B,” “X,” and “Z,” were eliminated because of their uncertain meaning. (3) The protein sequences labeled with “reviewed” were the only ones considered to ensure that the selected sequences had been verified through experiments. The negative dataset was constructed with a list of PISCES-culled PDB (Wang and Dunbrack, 2003) proteins with identification values <20%, in the same manner as Fernández-Blanco et al. (2013). These steps resulted in 710 positive samples and 1,567 negative samples. To avoid a low quality dataset that may incorrectly predict the result, the CD-HIT program (Fu et al., 2012) was applied with a 60% threshold to obtain a benchmark dataset. This final dataset included 253 antioxidant proteins and 1,552 non-antioxidant proteins, which can be expressed as follows:
Where Set+ represents the positive dataset (the 253 antioxidant proteins); Set− represents the negative dataset constructed from 1,552 non-antioxidant proteins; and the “∪” symbol indicates that the benchmark dataset consisted of positive and negative datasets. The proportion of positive and negative samples is ~1:6, which represents an unbalanced dataset.
Feature Extraction
In this study, we used the feature extraction algorithm (abbreviated as 473D) proposed by Wei et al. (2015). This algorithm generates 473 discrete features based on the PSI-BLAST (Altschul et al., 1997) and PSI-PRED (Jones, 1999) profiles. The former contains the evolutionary information and the latter contains the secondary structure information of the protein sequence. First, a protein with a number of amino acid residues is defined as:
where Ai means the ith amino acid residue of a protein sequence. Then, the 473D feature is extracted from the protein sequence in the following steps.
(1) Extract 20 features from a position-specific score matrix (PSSM) (Xiong et al., 2018). The PSSM is a matrix generated by running the PSI-BLAST program on a protein sequence of length, which is represented as (Wei et al., 2015)
where each PSSM matrix entry is equal to the muting score of the ith amino acid residue in protein sequence S and the nth amino acid residue in the amino acid alphabet. The value of entries in MPSSM are grouped by the same column and averaged to form 20 values. Then, they are combined to generate a vector Fpssm with a length of 20, which can be formulated as follows (Wei et al., 2015):
where fn equal to the average score of each residue in the sequence S, mutating to nth amino acid residue in the evolutionary process.
(2) Extract 20 one-gram and 400 two-gram features from the frequency matrix. Each entry in the PSSM matrix multiplied by the corresponding background frequency is taken as the exponent and two (2) is the base. Then, the frequency matrix is obtained by a power operation as follows (Wei et al., 2015):
where Mfrequency is the frequency matrix, pi,n is the PSSM ith row and nth column entry, and bfj is the background frequency of amino acid in the amino acid alphabet (The value of bfj is provided on the website http://server.malab.cn/AOPs-SVM/data.jsp). The consensus sequence is generated from the first row to Lth row of Mfrequency per the following criteria. To ith row of the Mfrequency, determine the largest entry according to its column order, and choose the jth amino acid in the amino acid alphabet. Repeat this step L times to generate a new consensus sequence Sc. From the analysis of the above process, it is concluded that Sc is the evolutionary result of S, because each amino acid residue in S is replaced by the most frequent amino acid to generate Sc. Then, a one-gram and two-gram algorithm are used to extract the frequency of occurrence features from the sequence Sc. The one-gram algorithm calculates the frequency of 20 amino acids residue in the sequence, and the two-gram algorithm calculates the frequency of 20 × 20 possible amino acid residue adjacent pairs in the sequence, which are represented by (Wei et al., 2015):
where O(x) means the occurrence time of x, Aj is the amino acid alphabet, which can be a single amino acid residue Ai or amino acid residue adjacent pair AiAj, and L is the sequence length. Then, by proportionally weighting F1−gram and F2−gram, the 420 features are obtained, which are represented as (Wei et al., 2015)
(3) Extract six features from the PSI-PRED secondary structure sequence. Program PSI-PRED can generate a secondary structure sequence Sstructure from protein sequence S, which is represented as (Wei et al., 2015):
where H, E, and C represent the secondary structure states of helix, strand, and coil, respectively. This means that the secondary structure sequence Sstructure is generated by each amino acid residue in protein sequence replaced by one of letter in H, E, and C. Then, from the sequence Sstructure, extract five features as follows (Wei et al., 2015):
Where Counth, Counte, and Countc are the total number of the H, E, and C in Sstructure; Posih, Posie, and Posic represent the position index of H, E, and C respectively; Max_Lengthe and Max_Lengthh are the largest numbers of continuous E and H. Then, transfer Sstructure to the segment sequence Ssegment by deleting coil states and continuous H and E are treated as segment H and segment E, and expressed in terms of α and β, respectively (Zhang et al., 2011). For instance, structure sequence EECCCHHHEEECHHHEECCEE can be transfer to segment sequence βαβαββ. Then, frequency of segment βαβ in Ssegment is defined as a feature and formulated as (Wei et al., 2015)
where Countβαβ is the total number of segment βαβ.
(4) Extract 3 global and 24 local structural features from the structure probability matrix. Structure probability matrix Mprobability also is the profile of PSI-PRED on sequence, which can be represented by (Wei et al., 2015)
where proi,1, proi,2, and proi,3 are the probability values of amino acid residue in sequence to predict as secondary structure states of “C,” “H,” and “E,” respectively. Thus, this matrix has L rows. Three global structural features are calculated by averaging each column value as follows (Wei et al., 2015)
Then Mprobability is divided into λ sub-matrices and three global structural features as Exp. (17) are calculated separately. Finally, obtain λ × 3 features. We chose the λ = 8 in this study, which are represented as (Wei et al., 2015)
where fpro_local_i express three values consisting of the average of each column value in the submatrix. Therefore, there are 8 × 3 elements in vector Fpro_local.
Finally, the above features are combined in the following order to form the 473D feature, which is represented as (Wei et al., 2015):
Feature Selection
Feature selection aims to select a subset of features to improve the generalization capacity of the learning models. The Max-Relevance-Max-Distance algorithms (MRMD) (Zou et al., 2016b) was utilized for feature selection. It has two steps—ranking features and selecting optimal feature sets.
First, calculate the MRMD score of each feature vector. The MRMD score of a feature vector consists of a relevant value and a distance value. The former indicates the relevant value of a feature and target class vector, and it equals the Pearson correlation coefficient (Xu and Deng, 2018) between the feature and target class vector, which is calculated using the following formula (Zou et al., 2016b):
where and similarly . fi is the ith feature vector and c is the target class vector, which consists of 0 and 1 in this study. RVi is relevant value of ith feature vector and equals to Pearson correlation coefficient between fi and c. N is the number of elements in a feature vector, and equals the total number of samples in the dataset. fi(k) denotes the kth element of feature fi.
The distance value is a measurement of feature redundancy and is calculated by the Euclidean distance function as follows (Zou et al., 2016b; Dong et al., 2019):
where DVi is the distance value of the ith feature vector. ED(fi, fj) denotes the Euclidean distance of ith and jth feature vector and is formulated by (Zou et al., 2016b):
Based on Equations (20) and (21), the MRMD score of feature fi is defined as (Zou et al., 2016b)
Inverse sorting of feature set (19) using MRMD score to obtain new feature set F′, which is represented as
Candidate subsets were constructed by adding from features in F′ one-by-one each time in ranking order, and can be expressed as: . Then, the above subsets were fed into random forest and construct models separately. Among them, a subset of the best performance is selected as the optimal feature set.
Support Vector Machine
Support Vector Machine (SVM) has been widely used in the bioinformatics fields and has performed excellently (Cao et al., 2014; Stephenson et al., 2019). SVM is a method based on the theory of Vapnik–Chervonenkis Dimension (Vapnik et al., 1994) (VC Dimension) and structural risk minimization. SVM maps low-dimensional data to high-dimensional space and uses hyperplane to segment different labeled data. In this study, we chose the toolbox LIBSVM 3.21 (Chang and Lin, 2011) to execute the SVM. It can be downloaded from https://www.csie.ntu.edu.tw/~cjlin/libsvm/. The default kernel function—the radial basis function (RBF) was adopted, and python program grid.py in the toolbox LIBSVM 3.21 was used to search the optimized value of the penalty constant C and the kernel width parameter γ. To correctively evaluate a model with an unbalanced data set, the official website provides a tool that enables LIBSVM to conduct cross-validation with respect to other criteria, including F-score, AUC (Area Under Curve), precision, recall, and more (this tool is available at https://www.csie.ntu.edu.tw/~cjlin/libsvmtools/eval/index.html).
Proposed Classifier Flowchart
We proposed a sequence-based classifier using a support vector machine named AOPs-SVM; a flowchart is presented in Figure 1. The AOPs-SVM procedure consists of three phases: (1) feature extraction, (2) feature selection, and (3) model generation. In phase (1), the input protein sequences are processed by the PSI-BLAST and the PSI-PRED programs. The resulting profiles generate 473-dimension (473D) discrete vectors, including evolutionary information and secondary structure information. Then, in phase (2), these 473D vectors were fed into the MRMD method to rank and select the optimal feature set by random forest. In the model generation phase, the SVM was applied to generate a model on the optimal feature set. Lastly, this model was optimized by selecting the optimal value for the penalty constant C and the kernel width parameter γ by grid search in terms of F1 score.
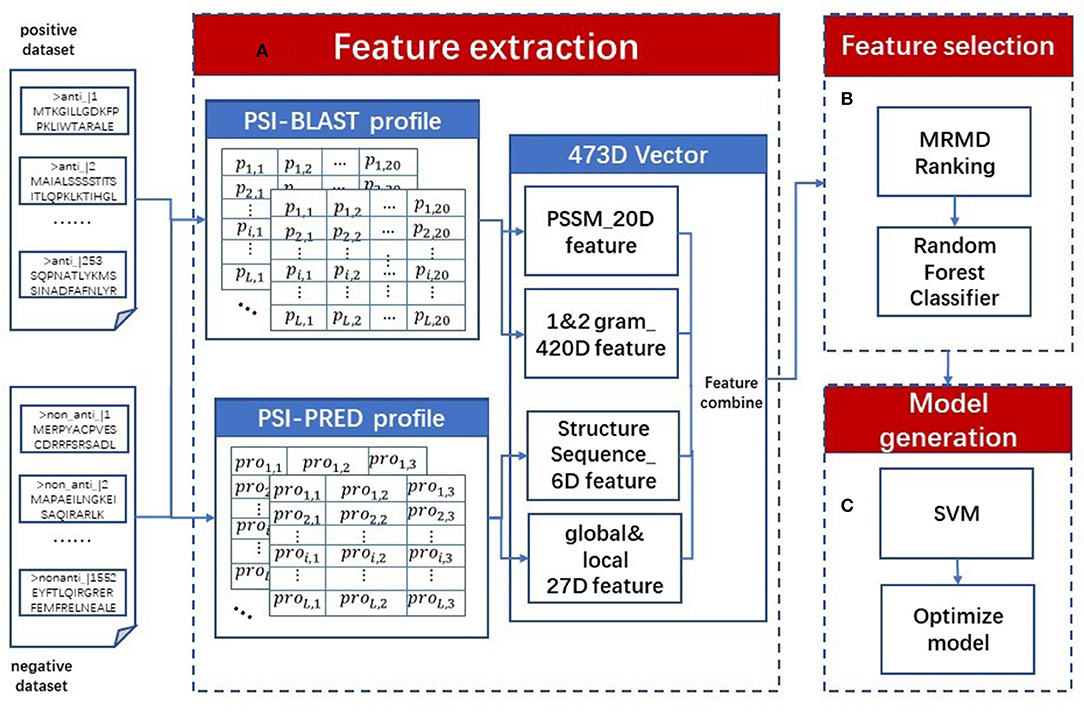
Figure 1. AOPs-SVM flowchart. The original dataset (positive and negative dataset) is processed in three phases. (A) In the feature extraction phase, two types of profiles are constructed using the PSI-BLAST and PSI-PRED programs. Then, 473D discrete vectors are generated by combining evolutionary information and secondary processing feature information, including 20D PSSM features, 20D 1-g, 400D 2-g features, 6D secondary structure sequence features and 27D global and local structural features. (B) In feature selection phase, ranking the 473D features by MRMD score and selecting optimal feature set by Random Forest. (C) At last, in model generation phase the optimal feature set is fed into SVM to generate the AOPs-SVM model and optimize it via a grid search.
Measurement
There are three kinds of evaluation methods commonly used in bioinformatics fields: an independent test, a k-fold cross validation and a jackknife test (Wei et al., 2017a,b, 2018; Chen et al., 2018; Liu et al., 2018a,b; Ding et al., 2019; Lv et al., 2019; Yang et al., 2019b). In a jackknife test, each sample is tested by the model, which is trained by all other samples. In this study, we applied the jackknife test, as it is the most rigorous and least arbitrary method. Considering the unbalanced dataset used, sensitivity (Sn), specificity (Sp), accuracy (Acc), and Mathew's correlation coefficient (MCC) were employed as the evaluation metrics. The F1 score was used as the criterion for optimizing the model.
where TP, FP, FN, and TN indicate true positive, false positive, false negative, and true negative, respectively. In addition, Area Under Curve (AUC) is an important metric and accurately measures the overall performance of the model. It is the value of the area enclosed by the receiver operating characteristic curve (ROC curve) and the two coordinate axes. The ROC curve is a continuous line plotted by (1 − Sp) as X-coordinate and Sn as the Y-coordinate. The larger the AUC value, the better the performance of the model.
Results and Discussion
Determination of Parameters
There are two groups of parameters that have to be determined in the proposed classifier: the parameters associated with the random forest in the feature selection phase, and the parameters associated with the optimizing SVM in the model generation phase. The random forest parameters were initialized as follows: the number of trees was set to 100; the number of features to use in random selection was set to 0; the seed for the random number generator was set to 1; and the maximum depth of the tree was 0 for unlimited. The grid.py parameter selection tool was applied to evaluate the SVM in the model generation phase with F1 criteria under jackknife test. It involved searching the optimized value to penalty constant parameter C and the kernel width parameter γ. logarithmic function was adopted and set the searching range of as {−5,15} with step of 0.5, similarly, searching range of is {3,−15} with a step of −0.5.
Performance of the Proposed Classifier
The 473D features were extracted in the feature extraction phase and ranked by MRMD score. The random forest method was applied and a 176D optimal feature set was selected. Then, this optimal feature set was fed into the SVM model and optimized to generate the proposed AOPs-SVM classifier. To evaluate the performance of the proposed classifier, we conducted a series of comparisons, the results of which are presented in Figure 2.
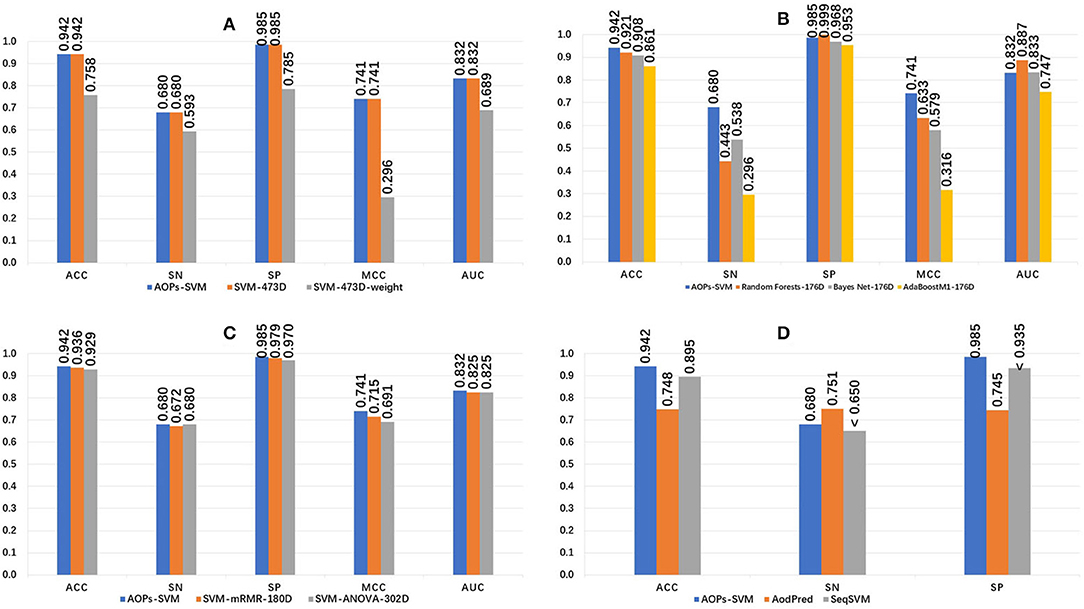
Figure 2. Performance comparison of the AOPs-SVM and other classifiers. (A) Compares other SVM models generated on the original feature set (473D). SVM-473D and SVM-473D-weight are the classifiers that the SVM trained on the original feature set in straight and weighted manner (negative: positive = 1: 6). (B) Comparing with three other traditional classifiers on optimal feature set (176D). RandomForest-176D, BayesNet-176D, and AdaBoostM1-176D are RandomForest, BayesNet and AdoBoostM1 on optimal feature set, respectively. (C) Comparing with other SVM models based on optimal feature set generated by ANOVA and mRMR respectively. ANOVA, mRMR generated 302D and 180D optimal feature set, respectively. (D) Comparing with state-of-the art methods. “ < ” denotes that Sn and SP of SeqSVM are <0.65 and 0.935, respectively.
The proposed AOPs-SVM classifier achieved 94.2% in ACC, 0.68 in sensitivity, 0.985 in specificity, 0.741 in MCC, and 0.832 in AUC. As seen in Figure 2A, the AOPs-SVM achieves the same performance with the SVM-473D, which is much better than the SVM-473D-weight. This demonstrates that the feature selection phase effectively solves for data redundancy when the feature set shrinks from 473D to 176D. In Figure 2B, although the random forest, Bayes Net, and AdoBoostM1 all achieve high specificity scores, they are inefficient in sensitivity, while two are even lower than random classification. This shows that the SVM produces a more balanced result on an optimal feature set compared to three other candidate classifiers. Figure 2C shows that AOPs-SVM is superior to SVM-mRMR-180D and SVM-ANOVA-302D. This result demonstrates that the MRMD algorithm not only results in a lower dimension (176D), but also retains the important features in the optimal feature set. In Figure 2D, the performance of the proposed classifier is compared to the AodPred (Feng et al., 2016) and SeqSVM (Xu et al., 2018) in term of sensitivity, specificity, and accuracy. The AOPs-SVM is slightly lower than AodPred for sensitivity. However, it outperforms the other two classifiers in specificity and accuracy.
Feature Contribution and Importance Analysis
Section Performance of the Proposed Classifier noted that the proposed AOPs-SVM classifier was trained on the optimal feature set (176D), and achieved the same performance as the SVM trained on the original feature set (473D). This demonstrates that the optimal feature set retained the important features. The MRMD score and feature composition of the optimal feature set (176D) are shown in Figure 3.
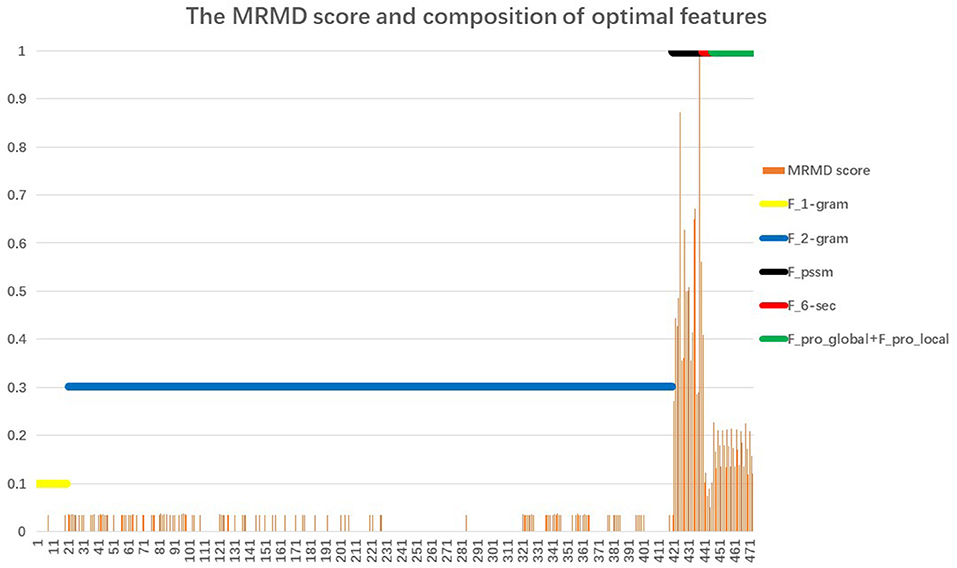
Figure 3. The MRMD score and composition of the optimal feature set. The X-coordinate corresponds to 473 features; the Y-coordinate is the value of the MRMD score and participation rate. The orange vertical line represents the MRMD score of the 176 optimal feature set. Just as with the original feature set, the optimal feature set also consists of 6 feature types. The six horizontal lines represent the participation rates of each feature: 20D 1-gram feature (yellow); 400D 2-g feature (blue); 20D feature from PSSM (black); 6D secondary structure feature (red); and 27D global and local feature (green). We defined the participation rate as equal to the number of each feature type in the 176 feature set divided by the total number of corresponding features. For example, the 6D secondary structure feature (red) are all selected for inclusion in the optimal feature set, so the participation rate is 1.
When comparing the six horizontal lines, the 20D feature from the PSSM, the 6D secondary structure features, and the 27D global and local features corresponding to Fpssm, {FH, FC, FE, FMaxH, FMaxE, Ffrequencyβαβ} and {Fprolocal, Fproglobal} of Equation (19), respectively, achieve the highest participation rate with reaching 100%. The latter two features come from PSI-PRED profile. It indicates that secondary structure information extracted from PSI-PRED profiles highly contributes to the antioxidant protein identification task. Analysis from the view of combining MRMD score and participation rate, the 20D feature from matrix PSSM, that is Fpssm in Equation (4), obtains the highest 20 MRMD scores and all of them appear in the 176D optimal feature set. It indicates that 20 evolutionary features in Fpssm have the most relevance to the target classification, but have the least redundant information. Therefore, we can conclude from a bioinformatics perspective that Fpssm can be selected as an important marker for identifying antioxidant proteins. These 20 Fpssm features' MRMD scores are shown in Table 1, where the odd-numbered rows are the order number of features slashed by the corresponding mutating residue. The even-numbered rows are the MRMD scores.
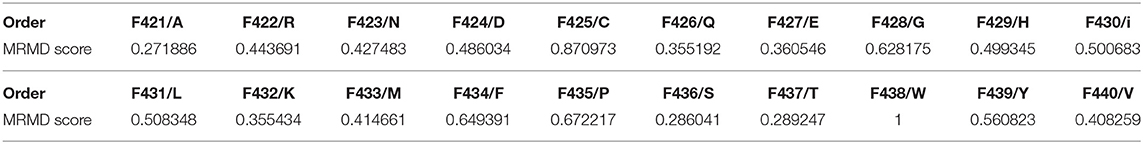
Table 1. MRMD score of Fpssm.
Conclusions
In this paper, we proposed a novel approach for identifying antioxidant proteins, and constructed a classifier called AOPs-SVM. The 473D discrete features, including evolutionary information and secondary structure information, were extracted from the training set. To eliminate redundant data, the MRMD algorithm was applied and the 176D optimal feature set was obtained. Then, the AOPs-SVM was generated by an SVM model based on the optimal feature set. Experimental results show that the proposed classifier is superior to other classifiers, including state-of-the art methods. In addition, we analyzed the contribution and composition of the optimal feature set using bioinformatics techniques. In the future, we will attempt to improve the performance achieved in this study by (1) searching and combining potential and significant features, as well as by using a more effective feature selection approach (Yu et al., 2018); and (2) adopting other classifying algorithms, such as extreme learning (Li et al., 2019a) and deep learning (Cao et al., 2017; Long et al., 2017; Conover et al., 2019; Hou et al., 2019; Zhang et al., 2019; Zou et al., 2019), etc.
Data Availability
Publicly available datasets were analyzed in this study. This data can be found here: http://server.malab.cn/AOPs-SVM/data.jsp.
Author Contributions
CM, QZ, and SJ wrote the paper, participated in the research design, and developed the web server. LW and FG participated in preparation of the manuscript. CM, SJ, LW, FG, and QZ read and approved the final manuscript.
Funding
This work was supported by the National Key R&D Program of China (No. 2018YFC0910405), and the Natural Science Foundation of China (No. 61771331).
Conflict of Interest Statement
The authors declare that the research was conducted in the absence of any commercial or financial relationships that could be construed as a potential conflict of interest.
References
Altschul, S. F., Madden, T. L., Schäffer, A. A., Zhang, J., Zhang, Z., Miller, W., et al. (1997). Gapped BLAST and PSI-BLAST: a new generation of protein database search programs. Nucl. Acids Res. 25, 3389–3402. doi: 10.1093/nar/25.17.3389
Ames, B. N. (1983). Dietary carcinogens and anticarcinogens: oxygen radicals and degenerative diseases. Science 221, 1256–1264. doi: 10.1126/science.6351251
Ames, B. N., Shigenaga, M. K., and Hagen, T. M. (1993). Oxidants, antioxidants, and the degenerative diseases of aging. Proc. Natl. Acad. Sci. U.S.A. 90, 7915–7922. doi: 10.1073/pnas.90.17.7915
Anderson, M. J. (2001). A new method for non-parametric multivariate analysis of variance. Austral. Ecol. 26, 32–46. doi: 10.1111/j.1442-9993.2001.01070.pp.x
Bouchaffra, D., and Tan, J. (2006). “Protein fold recognition using a structural Hidden Markov Model,” in 18th International Conference on Pattern Recognition (ICPR'06) (Hong Kong: IEEE), 186–189. doi: 10.1109/ICPR.2006.949
Cao, R., Freitas, C., Chan, L., Sun, M., Jiang, H., and Chen, Z. (2017). ProLanGO: protein function prediction using neural machine translation based on a recurrent neural network. Molecules 22:1732. doi: 10.3390/molecules22101732
Cao, R., Wang, Z., Wang, Y., and Cheng, J. (2014). SMOQ: a tool for predicting the absolute residue-specific quality of a single protein model with support vector machines. BMC Bioinformatics 15:120. doi: 10.1186/1471-2105-15-120
Chang, C.-C., and Lin, C.-J. (2011). LIBSVM: A library for support vector machines. ACM Trans. Intell. Syst. Technol. 2:27. doi: 10.1145/1961189.1961199
Chen, W., Feng, P., Liu, T., and Jin, D. (2018). Recent advances in machine learning methods for predicting heat shock proteins. Curr Drug Metab. 20, 224–228. doi: 10.2174/1389200219666181031105916
Chen, W., Lv, H., Nie, F., and Lin, H. (2019). i6mA-Pred: Identifying DNA N6-methyladenine sites in the rice genome. Bioinformatics. 35, 2796–2800. doi: 10.1093/bioinformatics/btz015
Chen, X. X., Tang, H., Li, W. C., Wu, H., Chen, W., Ding, H., et al. (2016). Identification of bacterial cell wall lyases via pseudo amino acid composition. Biomed Res Int. 2016:1654623. doi: 10.1155/2016/1654623
Chen, Y., Zhang, X., Yang, M. Q., and Yang, J. Y. (2007). “Ensemble of probabilistic neural networks for protein fold recognition,” in 2007 IEEE 7th International Symposium on BioInformatics and BioEngineering (IEEE), 66–70. doi: 10.1109/BIBE.2007.4375546
Chiue, H., Kusano, T., and Iwami, K. (1997). Deamidation-induced fragmentation of maize zein, and its linked reduction in fatty acid-binding capacity as well as antioxidative effect. Food Chem. 58, 111–117. doi: 10.1016/S0308-8146(96)00224-5
Conover, M., Staples, M., Si, D., Sun, M., and Cao, R. (2019). AngularQA: protein model quality assessment with LSTM networks. Comput. Math. Biophys. 7, 1–9. doi: 10.1515/cmb-2019-0001
Cumby, N., Zhong, Y., Naczk, M., and Shahidi, F. (2008). Antioxidant activity and water-holding capacity of canola protein hydrolysates. Food Chem. 109, 144–148. doi: 10.1016/j.foodchem.2007.12.039
Dastmalchi, K., Dorman, H. D., Oinonen, P. P., Darwis, Y., Laakso, I., and Hiltunen, R. (2008). Chemical composition and in vitro antioxidative activity of a lemon balm (Melissa officinalis L.) extract. LWT Food Sci. Technol. 41, 391–400. doi: 10.1016/j.lwt.2007.03.007
Dehzangi, A., Phon-Amnuaisuk, S., and Dehzangi, O. (2010). Using random forest for protein fold prediction problem: an empirical study. J. Inf. Sci. Eng. 26, 1941–1956. doi: 10.1007/978-3-642-12211-8_19
Diaz, M. N., Frei, B., Vita, J. A., and Keaney, J. F Jr. (1997). Antioxidants and atherosclerotic heart disease. N. Engl. J. Med. 337, 408–416. doi: 10.1056/NEJM199708073370607
Ding, C. H., and Dubchak, I. (2001). Multi-class protein fold recognition using support vector machines and neural networks. Bioinformatics 17, 349–358. doi: 10.1093/bioinformatics/17.4.349
Ding, H., and Li, D. (2015). Identification of mitochondrial proteins of malaria parasite using analysis of variance. Amino Acids 47, 329–333. doi: 10.1007/s00726-014-1862-4
Ding, Y., Tang, J., and Guo, F. (2017). Identification of drug-target interactions via multiple information integration. Inf. Sci. 418–419, 546–560. doi: 10.1016/j.ins.2017.08.045
Ding, Y., Tang, J., and Guo, F. (2019). Identification of drug-side effect association via multiple information integration with centered kernel alignment. Neurocomputing 325, 211–224. doi: 10.1016/j.neucom.2018.10.028
Dong, Y., Zhang, J., Li, Z., Hu, Y., and Deng, Y. (2019). Combination of evidential sensor reports with distance function and belief entropy in fault diagnosis. Int. J. Comput. Commun. Control 14, 329–343. doi: 10.15837/ijccc.2019.3.3589
Feng, P., Chen, W., and Lin, H. (2016). Identifying antioxidant proteins by using optimal dipeptide compositions. Interdiscipli. Sci. 8, 186–191. doi: 10.1007/s12539-015-0124-9
Feng, P.-M., Chen, W., Lin, H., and Chou, K.-C. (2013a). iHSP-PseRAAAC: identifying the heat shock protein families using pseudo reduced amino acid alphabet composition. Anal. Biochem. 442, 118–125. doi: 10.1016/j.ab.2013.05.024
Feng, P.-M., Lin, H., and Chen, W. (2013b). Identification of antioxidants from sequence information using Naive Bayes. Comput. Math. Methods Med. 2013:567529. doi: 10.1155/2013/567529
Fernández-Blanco, E., Aguiar-Pulido, V., Munteanu, C. R., and Dorado, J. (2013). Random forest classification based on star graph topological indices for antioxidant proteins. J. Theor. Biol. 317, 331–337. doi: 10.1016/j.jtbi.2012.10.006
Fu, J., Tang, J., Wang, Y., Cui, X., Yang, Q., Hong, J., et al. (2018). Discovery of the consistently well-performed analysis chain for SWATH-MS based pharmacoproteomic quantification. Front. Pharmacol. 9:681. doi: 10.3389/fphar.2018.00681
Fu, L., Niu, B., Zhu, Z., Wu, S., and Li, W. (2012). CD-HIT: accelerated for clustering the next-generation sequencing data. Bioinformatics 28, 3150–3152. doi: 10.1093/bioinformatics/bts565
Geetha, S., Ram, M. S., Singh, V., Ilavazhagan, G., and Sawhney, R. C. (2002). Anti-oxidant and immunomodulatory properties of seabuckthorn (Hippophae rhamnoides)—an in vitro study. J. Ethnopharmacol. 79, 373–378. doi: 10.1016/S0378-8741(01)00406-8
GEY, K. F. (1990). The antioxidant hypothesis of cardiovascular disease:epidemiology and mechanisms. Biochem. Soc. Trans. 18, 1041–1045. doi: 10.1042/bst0181041
Hou, J., Wu, T., Cao, R., and Cheng, J. (2019). Protein tertiary structure modeling driven by deep learning and contact distance prediction in CASP13. Proteins Struct. Funct. Bioinformatics. doi: 10.1101/552422
Hou, W.-C., Lee, M.-H., Chen, H.-J., Liang, W.-L., Han, C.-H., Liu, Y.-W., et al. (2001). Antioxidant activities of dioscorin, the storage protein of yam (Dioscorea batatas Decne) tuber. J. Agric. Food Chem. 49, 4956–4960. doi: 10.1021/jf010606m
Huang, W., Deng, Q., Xie, B., Shi, J., Huang, F., Tian, B., et al. (2010). Purification and characterization of an antioxidant protein from Ginkgo biloba seeds. Food Res. Int. 43, 86–94. doi: 10.1016/j.foodres.2009.08.015
Jones, D. T. (1999). Protein secondary structure prediction based on position-specific scoring matrices. J. Mol. Biol. 292, 195–202. doi: 10.1006/jmbi.1999.3091
Kouoh, F., Gressier, B., Luyckx, M., Brunet, C., Dine, T., Cazin, M., et al. (1999). Antioxidant properties of albumin: effect on oxidative metabolism of human neutrophil granulocytes. Il Farmaco 54, 695–699. doi: 10.1016/S0014-827X(99)00082-8
Krishnaiah, D., Sarbatly, R., and Bono, A. (2007). Phytochemical antioxidants for health and medicine a move towards nature. Biotechnol. Mol. Biol. Rev. 2, 97–104.
Li, B., Tang, J., Yang, Q., Li, S., Cui, X., Li, Y., et al. (2017). NOREVA: normalization and evaluation of MS-based metabolomics data. Nucleic Acids Res. 45, W162–W170. doi: 10.1093/nar/gkx449
Li, Y., Niu, M., and Zou, Q. (2019a). ELM-MHC: an improved MHC identification method with extreme learning machine algorithm. J. Proteome Res. 18, 1392–1401. doi: 10.1021/acs.jproteome.9b00012
Li, Y. H., Li, X. X., Hong, J. J., Wang, Y. X., Fu, J. B., Yang, H., et al. (2019b). Clinical trials, progression-speed differentiating features and swiftness rule of the innovative targets of first-in-class drugs. Brief Bioinform. doi: 10.1093/bib/bby130
Lin, C., Chen, W., Qiu, C., Wu, Y., Krishnan, S., and Zou, Q. (2014). LibD3C: Ensemble classifiers with a clustering and dynamic selection strategy. Neurocomputing 123, 424–435. doi: 10.1016/j.neucom.2013.08.004
Liu, B. (2017). BioSeq-Analysis: a platform for DNA, RNA, and protein sequence analysis based on machine learning approaches. Brief. Bioinformatics. doi: 10.1093/bib/bbx165
Liu, B., Jiang, S., and Zou, Q. (2018a). HITS-PR-HHblits: protein remote homology detection by combining pagerank and hyperlink-induced topic search. Brief. Bioinformatics. doi: 10.1093/bib/bby104
Liu, B., Liu, F., Wang, X., Chen, J., Fang, L., and Chou, K.-C. (2015). Pse-in-One: a web server for generating various modes of pseudo components of DNA, RNA, and protein sequences. Nucleic Acids Res. 43, W65–W71. doi: 10.1093/nar/gkv458
Liu, B., Weng, F., Huang, D.-S., and Chou, K.-C. (2018b). iRO-3wPseKNC: Identify DNA replication origins by three-window-based PseKNC. Bioinformatics 34, 3086–3093. doi: 10.1093/bioinformatics/bty312
Liu, B., Wu, H., Wang, X., and Chou, K.-C. (2017). Pse-Analysis: a python package for DNA, RNA and protein peptide sequence analysis based on pseudo components and kernel methods. Oncotarget 8, 13338–13343. doi: 10.18632/oncotarget.14524
Liu, Y.-W., Han, C.-H., Lee, M.-H., Hsu, F.-L., and Hou, W.-C. (2003). Patatin, the tuber storage protein of potato (Solanum tuberosum L.), exhibits antioxidant activity in vitro. J. Agric. Food Chem. 51, 4389–4393. doi: 10.1021/jf030016j
Long, H. X., Wang, M., and Fu, H. Y. (2017). Deep convolutional neural networks for predicting hydroxyproline in proteins. Curr. Bioinformatics 12, 233–238. doi: 10.2174/1574893612666170221152848
Lv, H., Zhang, Z. M., Li, S. H., Tan, J. X., Chen, W., and Lin, H. (2019). Evaluation of different computational methods on 5-methylcytosine sites identification. Brief. Bioinformatics. doi: 10.1093/bib/bbz048
Maheswari, S. U., Ramadoss, C. S., and Krishnaswamy, P. (1997). Inhibition of Fe (II) catalyzed linoleic acid oxidation and DNA damage by phosvitin. Mol. Cell. Biochem. 177, 47–51. doi: 10.1023/A:1006865129856
Peng, H., Long, F., and Ding, C. (2005). Feature selection based on mutual information: criteria of max-dependency, max-relevance, and min-redundancy. IEEE Trans. Pattern Anal. Mach. Intell. 27, 1226–1238. doi: 10.1109/TPAMI.2005.159
Podsedek, A. (2007). Natural antioxidants and antioxidant capacity of Brassica vegetables: a review. LWT Food Sci. Technol. 40, 1–11. doi: 10.1016/j.lwt.2005.07.023
Rajalakshmi, D., and Narasimhan, S. (1996). “Food antioxidants: sources and methods of evaluation,” in Food Antioxidants, eds D. L. Madhavi, S. S. Deshpande, and D. K. Salunkhe (New York, NY: Marcel Decker), 65–157.
Sachindra, N. M., and Bhaskar, N. (2008). In vitro antioxidant activity of liquor from fermented shrimp biowaste. Bioresource Technol. 99, 9013–9016. doi: 10.1016/j.biortech.2008.04.036
Satué-Gracia, M. T., Frankel, E. N., Rangavajhyala, N., and German, J. B. (2000). Lactoferrin in infant formulas: effect on oxidation. J. Agri. Food Chem. 48, 4984–4990. doi: 10.1021/jf0002490
Shamim, M. T. A., Anwaruddin, M., and Nagarajaram, H. A. (2007). Support vector machine-based classification of protein folds using the structural properties of amino acid residues and amino acid residue pairs. Bioinformatics 23, 3320–3327. doi: 10.1093/bioinformatics/btm527
Shen, H.-B., and Chou, K.-C. (2006). Ensemble classifier for protein fold pattern recognition. Bioinformatics 22, 1717–1722. doi: 10.1093/bioinformatics/btl170
Siswoyo, T. A., Mardiana, E., Lee, K. O., and Hoshokawa, K. (2011). Isolation and characterization of antioxidant protein fractions from melinjo (Gnetum gnemon) seeds. J. Agric. Food Chem. 59, 5648–5656. doi: 10.1021/jf2000647
Smith, M., Richey, G., Sayre, L., Anderson, V., Beal, M., and Kowal, N. (1996). Test for oxidative damage in Alzheimer's. Nature 382, 120–121. doi: 10.1038/382120b0
Sögüt, S., Zoroglu, S. S., Özyurt, H., and Yilmaz, H. R., Özugurlu, F., Sivasli, E., et al. (2003). Changes in nitric oxide levels and antioxidant enzyme activities may have a role in the pathophysiological mechanisms involved in autism. Clin. Chim. Acta 331, 111–117. doi: 10.1016/S0009-8981(03)00119-0
Stephenson, N., Shane, E., Chase, J., Rowland, J., Ries, D., Justice, N., et al. (2019). Survey of machine learning techniques in drug discovery. Curr. Drug Metab. doi: 10.2174/1389200219666180820112457
Tan, J. X., Li, S. H., Zhang, Z. M., Chen, C. X., Chen, W., Tang, H., et al. (2019). Identification of hormone binding proteins based on machine learning methods. Math. Biosci. Eng. 16, 2466–2480. doi: 10.3934/mbe.2019123
Tang, H., Chen, W., and Lin, H. (2016). Identification of immunoglobulins using Chou's pseudo amino acid composition with feature selection technique. Mol. Biosyst. 12, 1269–1275. doi: 10.1039/C5MB00883B
Tang, H., Zhao, Y. W., Zou, P., Zhang, C. M., Chen, R., Huang, P., et al. (2018). HBPred: a tool to identify growth hormone-binding proteins. Int. J. Biol. Sci. 14, 957–964. doi: 10.7150/ijbs.24174
Tang, J., Fu, J., Wang, Y., Li, B., Li, Y., Yang, Q., et al. (2019a). ANPELA: analysis and performance assessment of the label-free quantification workflow for metaproteomic studies. Brief. Bioinform. doi: 10.1093/bib/bby127
Tang, J., Fu, J., Wang, Y., Luo, Y., Yang, Q., Li, B., et al. (2019b). Simultaneous improvement in the precision, accuracy and robustness of label-free proteome quantification by optimizing data manipulation chains. Mol. Cell Proteomics. 18, 1683–1699. doi: 10.1074/mcp.RA118.001169
Vapnik, V., Levin, E., and Cun, Y. L. (1994). Measuring the VC-dimension of a learning machine. Neural Comput. 6, 851–876. doi: 10.1162/neco.1994.6.5.851
Wang, G., and Dunbrack, R. L. Jr. (2003). PISCES: a protein sequence culling server. Bioinformatics 19, 1589–1591. doi: 10.1093/bioinformatics/btg224
Wei, L., Chen, H., and Su, R. (2018). M6APred-EL: a sequence-based predictor for identifying N6-methyladenosine sites using ensemble learning. Mol. Ther. Nucleic Acids 12, 635–644. doi: 10.1016/j.omtn.2018.07.004
Wei, L., Liao, M., Gao, X., and Zou, Q. (2015). Enhanced protein fold prediction method through a novel feature extraction technique. IEEE Trans. Nanobiosci. 14, 649–659. doi: 10.1109/TNB.2015.2450233
Wei, L., Tang, J., and Zou, Q. (2017a). Local-DPP: an improved DNA-binding protein prediction method by exploring local evolutionary information. Inf. Sci. 384, 135–144. doi: 10.1016/j.ins.2016.06.026
Wei, L., Wan, S., Guo, J., and Wong, K. K. (2017b). A novel hierarchical selective ensemble classifier with bioinformatics application. Artif. Intell. Med. 83, 82–90. doi: 10.1016/j.artmed.2017.02.005
Xiong, Y., Wang, Q., Yang, J., Zhu, X., and Wei, D. Q. (2018). PredT4SE-stack: prediction of bacterial type IV secreted effectors from protein sequences using a stacked ensemble method. Front. Microbiol. 9:2571. doi: 10.3389/fmicb.2018.02571
Xu, H. H., and Deng, Y. (2018). Dependent evidence combination based on shearman coefficient and pearson coefficient. IEEE Access 6, 11634–11640. doi: 10.1109/ACCESS.2017.2783320
Xu, L., Liang, G., Shi, S., and Liao, C. (2018). SeqSVM: a sequence-based support vector machine method for identifying antioxidant proteins. Int. J. Mol. Sci. 19:1773. doi: 10.3390/ijms19061773
Xue, W., Yang, F., Wang, P., Zheng, G., Chen, Y., Yao, X., et al. (2018). What contributes to serotonin-norepinephrine reuptake inhibitors' dual-targeting mechanism? The key role of transmembrane domain 6 in human serotonin and norepinephrine transporters revealed by molecular dynamics simulation. ACS Chem. Neurosci. 9, 1128–1140. doi: 10.1021/acschemneuro.7b00490
Yang, H., Tang, H., Chen, X. X., Zhang, C. J., Zhu, P. P., Ding, H., et al. (2016). Identification of secretory proteins in Mycobacterium tuberculosis using pseudo amino acid composition. Biomed. Res. Int. 2016:5413903. doi: 10.1155/2016/5413903
Yang, J. Y., and Chen, X. (2011). Improving taxonomy-based protein fold recognition by using global and local features. Proteins Struct. Funct. Bioinformatics 79, 2053–2064. doi: 10.1002/prot.23025
Yang, Q., Li, B., Tang, J., Cui, X., Wang, Y., Li, X., et al. (2019a). Consistent gene signature of schizophrenia identified by a novel feature selection strategy from comprehensive sets of transcriptomic data. Brief Bioinform. doi: 10.1093/bib/bbz049
Yang, S., Wang, L., Wang, Y., Ou, X., Shi, Z., Lu, C., et al. (2017). Purification and identification of a natural antioxidant protein from fertilized eggs. Korean J. Food Sci. Anim. Resources 37:764. doi: 10.5851/kosfa.2017.37.5.764
Yang, W., Zhu, X. J., Huang, J., Ding, H., and Lin, H. (2019b). A brief survey of machine learning methods in protein sub-Golgi localization. Curr. Bioinformatics 14, 234–240. doi: 10.2174/1574893613666181113131415
Yigit, A., Panda, A., and Cherian, G. (2014). The avian embryo and its antioxidant defence system. World's Poultry Sci. J. 70, 563–574. doi: 10.1017/S0043933914000610
Yu, L., Sun, X., Tian, S. W., Shi, X. Y., and Yan, Y. L. (2018). Drug and nondrug classification based on deep learning with various feature selection strategies. Curr. Bioinformatics 13, 253–259. doi: 10.2174/1574893612666170125124538
Zhang, S., Ding, S., and Wang, T. (2011). High-accuracy prediction of protein structural class for low-similarity sequences based on predicted secondary structure. Biochimie 93, 710–714. doi: 10.1016/j.biochi.2011.01.001
Zhang, Z., Zhao, Y., Liao, X., Shi, W., Li, K., Zou, Q., et al. (2019). Deep learning in omics: a survey and guideline. Brief. Funct. Genomics 18, 41–57. doi: 10.1093/bfgp/ely030
Zhu, F., Li, X. X., Yang, S. Y., and Chen, Y. Z. (2018). Clinical success of drug targets prospectively predicted by in silico study. Trends Pharmacol. Sci. 39, 229–231. doi: 10.1016/j.tips.2017.12.002
Zhu, P. P., Li, W. C., Zhong, Z. J., Deng, E. Z., Ding, H., Chen, W., et al. (2015). Predicting the subcellular localization of mycobacterial proteins by incorporating the optimal tripeptides into the general form of pseudo amino acid composition. Mol. Biosyst. 11, 558–563. doi: 10.1039/C4MB00645C
Zhu, X. J., Feng, C. Q., Lai, H. Y., Chen, W., and Lin, H. (2019). Predicting protein structural classes for low-similarity sequences by evaluating different features. Knowl. Based Syst. 163, 787–793. doi: 10.1016/j.knosys.2018.10.007
Zima, T., Fialová, L., Mestek, O., Janebová, M., Crkovsk,á, J., Malbohan, I., et al. (2001). Oxidative stress, metabolism of ethanol and alcohol-related diseases. J. Biomed. Sci. 8, 59–70. doi: 10.1007/BF02255972
Zou, Q., Wan, S., Ju, Y., Tang, J., and Zeng, X. (2016a). Pretata: predicting TATA binding proteins with novel features and dimensionality reduction strategy. BMC Syst. Biol. 10:114. doi: 10.1186/s12918-016-0353-5
Zou, Q., Xing, P., Wei, L., and Liu, B. (2019). Gene2vec: gene subsequence embedding for prediction of mammalian N6-methyladenosine sites from mRNA. RNA 25, 205–218. doi: 10.1261/rna.069112.118
Keywords: antioxidant proteins, machine-learning, sequence features, support vector machine, classifier
Citation: Meng C, Jin S, Wang L, Guo F and Zou Q (2019) AOPs-SVM: A Sequence-Based Classifier of Antioxidant Proteins Using a Support Vector Machine. Front. Bioeng. Biotechnol. 7:224. doi: 10.3389/fbioe.2019.00224
Received: 21 July 2019; Accepted: 03 September 2019;
Published: 18 September 2019.
Edited by:
Wen Zhang, Huazhong Agricultural University, ChinaReviewed by:
Xiaofeng Song, Nanjing University of Aeronautics and Astronautics, ChinaXiucai Ye, University of Tsukuba, Japan
Yen-Wei Chu, National Chung Hsing University, Taiwan
Copyright © 2019 Meng, Jin, Wang, Guo and Zou. This is an open-access article distributed under the terms of the Creative Commons Attribution License (CC BY). The use, distribution or reproduction in other forums is permitted, provided the original author(s) and the copyright owner(s) are credited and that the original publication in this journal is cited, in accordance with accepted academic practice. No use, distribution or reproduction is permitted which does not comply with these terms.
*Correspondence: Fei Guo, Zmd1b0B0anUuZWR1LmNu; Quan Zou, em91cXVhbkBuY2xhYi5uZXQ=
†These authors have contributed equally to this work