 Lei Chen
 XiaoYong Pan
 Tao Zeng
 Yu-Hang Zhang
 YunHua Zhang
 Tao Huang
 Yu-Dong Cai
- 1School of Life Sciences, Shanghai University, Shanghai, China
- 2College of Information Engineering, Shanghai Maritime University, Shanghai, China
- 3Shanghai Key Laboratory of Pure Mathematics and Mathematical Practice (PMMP), East China Normal University, Shanghai, China
- 4Key Laboratory of System Control and Information Processing, Ministry of Education of China, Institute of Image Processing and Pattern Recognition, Shanghai Jiao Tong University, Shanghai, China
- 5IDLab, Department for Electronics and Information Systems, Ghent University, Ghent, Belgium
- 6Key Laboratory of Systems Biology, Institute of Biochemistry and Cell Biology, Chinese Academy of Sciences, Shanghai, China
- 7Shanghai Institute of Nutrition and Health, Shanghai Institutes for Biological Sciences, Chinese Academy of Sciences, Shanghai, China
- 8Anhui Province Key Laboratory of Farmland Ecological Conservation and Pollution Prevention, School of Resources and Environment, Anhui Agricultural University, Hefei, China
Liquid biopsy (i.e., fluid biopsy) involves a series of clinical examination approaches. Monitoring of cancer immunological status by the “immunosignature” of patients presents a novel method for tumor-associated liquid biopsy. The major work content and the core technological difficulties for the monitoring of cancer immunosignature are the recognition of cancer-related immune-activating antigens by high-throughput screening approaches. Currently, one key task of immunosignature-based liquid biopsy is the qualitative and quantitative identification of typical tumor-specific antigens. In this study, we reused two sets of peptide microarray data that detected the expression level of potential antigenic peptides derived from tumor tissues to avoid the detection differences induced by chip platforms. Several machine learning algorithms were applied on these two sets. First, the Monte Carlo Feature Selection (MCFS) method was used to analyze features in two sets. A feature list was obtained according to the MCFS results on each set. Second, incremental feature selection method incorporating one classification algorithm (support vector machine or random forest) followed to extract optimal features and construct optimal classifiers. On the other hand, the repeated incremental pruning to produce error reduction, a rule learning algorithm, was applied on key features yielded by the MCFS method to extract quantitative rules for accurate cancer immune monitoring and pathologic diagnosis. Finally, obtained key features and quantitative rules were extensively analyzed.
Introduction
Liquid biopsy (i.e., fluid biopsy) involves a series of clinical examination approaches, including sampling and analysis, on non-solid suspected pathogenic tissues, such as blood (Crowley et al., 2013), amniotic fluid (Ilas et al., 2000), and cerebrospinal fluid (Hiemcke-Jiwa et al., 2018). At present, liquid biopsy is applied in three main fields: cancer studies (Condello et al., 2018; Mithraprabhu and Spencer, 2018), heart attack diagnosis (Ogawa et al., 1983), and prenatal diagnosis (Sun et al., 2015). For heart attack diagnosis, the circulating endothelial cells are usually the inspected targets, reflecting the extent of damage on the integrity and permeability of heart, and related vessels (Ogawa et al., 1983). As for prenatal diagnosis, cell-free fetal DNA reflects the genomic characteristics of the infant, applicable for the development of monitoring, and diagnosis of genetic disorders (Sun et al., 2015). In cancer studies, liquid biopsy has been used for the identification of cancer biomarkers to monitor the progression of tumorigenesis and predict the prognosis. In 2014, a specific study (Stafford et al., 2014) on the evaluation of immune status of cancer presented a novel method for tumor-associated liquid biopsy, i.e., monitoring of cancer immunological status by the “immunosignature” of patients.
Immunosignature describes a typical reductionist biomarker paradigm assay that contributes to the representation of patients' immune responses but not the direct cancer status (Reiman et al., 2007; Stafford et al., 2014). Similar to traditional liquid biopsy on the basis of tumor-associated biomarkers, the identification of immunosignature in clinical examinations aims at the evaluation of the pathogenic conditions of cancer patients and the prediction of personalized cancer prognosis. However, such approach focuses on the immune elimination capacity on tumor cells of each patient so as to provide an auxiliary diagnosis rather than the direct tumor progression, invasion, and metastasis conditions. Thus, the major work content and the core technological difficulties for the monitoring of cancer immunosignature would be the recognition of cancer-related immune-activating antigens by random sequence peptide microarray screening (Reiman et al., 2007). Peptides in such microarray that can be bound by patient peripheral blood-derived antibodies share the same epitopes as endogenous antigens, which are probably derived from tumor tissues (Stafford et al., 2014). Such high-throughput screening approaches are efficient and accurate to identify tumor-associated antigens.
According to Stafford et al. (2014), patients with different tumor subtypes have different antigen spectrum responses to the peripheral isolated antibodies, validating that immunosignature may be a novel monitoring parameter for cancer liquid biopsy. However, the wide clinical application of immunosignature-based cancer liquid biopsy has three major obstacles. First, the identified potential antigens of each patient are outnumbered. Thus, the tumor-derived antigens, even the specific immune evaluation biomarkers, are hard to identify. Second, screening the whole randomized antigen assay of all the potential antibodies for each patient is impractical because of expensive and time-consuming burden. Third, the qualitative recognition and analysis of antigens are not accurate and efficient enough for personalized cancer monitoring, which requires quantitative standards to be established. Therefore, one key task of immunosignature-based liquid biopsy is the identification of shared cancer immune evaluation biomarkers together with their absolute quantity ranges. For instance, the identification of typical tumor specific antigens should be in a qualitative and quantitative manner.
To solve such problem from clinics, in this study, we reused the peptide microarray data that detected the expression level of potential antigenic peptides derived from the tumor tissues. To remove the detection differences induced by chip platforms, we independently analyzed the potential antigen distribution data from two datasets obtained from different chip platforms. Several machine learning algorithms were used in this study. The Monte Carlo Feature Selection (MCFS) (Draminski et al., 2008) was adopted to evaluate the importance of features in two datasets, respectively, resulting in a feature list. The incremental feature selection (IFS) (Liu and Setiono, 1998) was applied on the feature list to extract optimal features and build an optimal classifier based on a given classification algorithm. In addition, the repeated incremental pruning to produce error reduction (RIPPER) algorithm (Cohen, 1995) was performed on essential features that were produced by the MCFS method to construct quantitative classification rules. Altogether, we not only identified the common distributed cancer-associated antigen patterns but also established a series of quantitative rules for accurate cancer immune monitoring and pathologic diagnosis. Obtained patterns and rules were analyzed in the end of this paper.
Methods and Materials
Datasets
We downloaded the peptide microarray data from Gene Expression Omnibus under Accession Number GSE52582 (Stafford et al., 2014). It included two datasets. Dataset-1 (from GSE52580) was measured with 10K immunosignaturing peptide microarray version 2 and included 240 samples from six groups (Brain cancer, Breast cancer, Esophageal cancer, Multiple myeloma, Pancreatic cancer, and Healthy control). Each group had 40 samples. Dataset-2 (from GSE52581) was measured with ASU_random-sequence peptide microarray and included 1,516 samples from 15 groups of various diseases. Additional information of the samples can be found in Stafford et al. (2014). Dataset-1 contained 9,786 peptides, whereas dataset-2 contained 10,371. However, dataset-2 had missing values. To infer the missing values, we adopted the K-Nearest Neighbor (K = 10) method from R package.
Feature Selection
The purpose of feature selection is to distinguish important features from unimportant ones in datasets for a certain machine learning task. In this study, we used MCFS (Draminski et al., 2008) to capture key genes (features) for classifying samples from different diseases and to determine interpretable rules. We obtained the optimal genes with strong distinctions between different types of diseases through IFS method (Liu and Setiono, 1998).
Monte Carlo Feature Selection
In this study, MCFS (Draminski et al., 2008) was applied to select important genes. MCFS is a random sampling multivariate feature selection method based on original features. Assuming there are M original features, we randomly select some feature subsets, each of which includes randomly selected m features (m<<M) in original M ones. Then, multiple decision trees are generated and evaluated in the bootstrapping datasets from the original dataset, where the number of generated decision trees is p. After repeating the above process t times, t feature subsets and p × t decision trees are obtained.
The relative importance (RI) provides a score of each feature for its performance in the above decision trees. The RI score of a feature g is calculated by
where wAcc is the weighted accuracy, and ng(τ) is a node of feature g in decision tree τ. The information gain of ng(τ) is expressed as IG(ng(τ)), and no.in ng(τ) is the number of training samples in ng(τ), where u and v are different weighting factors with a default value of 1.
Rule Learning
In this study, we adopt the MCFS method to analyze two peptide microarray data from GEO. Each feature is assigned a RI value. Some informative features are further extracted by the MCFS method with a permutation test on class labels and one-sided student's t-test. These informative features are used to construct interpretable rules, which can clearly display the classification procedures for a given sample. In detail, these features are first reduced by Johnson Reducer algorithm (Johnson, 1974; Ohrn, 1999), such that remaining features have similar classification ability to all informative features. Then, remaining features are fed into the RIPPER algorithm (Cohen, 1995), which is a set-based rule learning algorithm, to determine simple, and interpretable rules for classifying samples from different disease types. The procedures of RIPPER algorithm for constructing rules can be found in our one previous study (Wang et al., 2018). Each rule describes the relationship between conditions and outcomes. Here, the rules are expressed as IF-THEN relationships based on detailed expression values. For example, IF Peptide 1<=0.7 AND Peptide 2>=1.02, THEN type = “Brain cancer.”
Incremental Feature Selection
IFS (Liu and Setiono, 1998) is an ideal feature ranking method with a supervised classifier. It filters the input and result in a set of optimal features for distinguishing different sample sets/classes with the best performance. Features in the feature list are ranked in descending order according to their RI values, and IFS is performed on such feature list. The combination of high-ranked features should help the classification model perform well because high-ranked features are important for classification. Here, we perform IFS in two steps.
First, we constructed a series of feature subsets with a large step size 10 to create feature subsets with high performance. In feature subsets F = [], the i-th feature subset contains 10 × i features, that is, . A classifier with a certain prediction engine is built to evaluate samples composed of each feature subset by 10-fold cross-validation (Kohavi, 1995). After all feature subsets have been tested, we can obtain a feature interval [min, max], which helps the classifier provide a good prediction performance. Based on the interval [min, max] from the first stage, a series of feature subsets is built to further accurately extract the optimal features. The final optimal feature subset with the optimal performance can be obtained finally. The classifier with such optimal feature subset is called optimal classifier.
Random Forest
A random forest is a meta-classifier that contains a large number of tree classifiers (Breiman, 2001). For classification, its output categories are determined by aggregating votes from different decision trees. The main idea of building a random forest, which is widely used in computational biology, is to ensemble a large number of decision trees (Pan et al., 2010; Zhao et al., 2018; Zhao R. et al., 2019; Zhao X. et al., 2019). Some differences always exist between each decision tree and other decision trees in the decision tree set. To avoid over-fitting, the random forest averages the prediction results of all decision trees to reduce the prediction variance. Although causing a small increase in bias and some loss of interpretability, the ensemble model usually has improved performance.
Support Vector Machine
Support vector machine (SVM) (Cortes and Vapnik, 1995) is a supervised learning algorithm based on statistical learning theory and is suitable for dealing with many biological problems (Pan and Shen, 2009; Mirza et al., 2015; Chen et al., 2017b, 2018a; Cai et al., 2018; Cui and Chen, 2019; Zhou et al., 2019). It can build models for linear and non-linear classification problems. The SVM model represents the samples as points in data space such that the samples of the individual categories can be separated after data mapping, and then the categories can be determined based on which side of the interval samples fall. The basic principle is to infer the hyperplane with the maximum margin between two types/classes of samples. In addition, SVM can be extended to multi-class problems based on its basic binary-class problem. For multi-class problems, SVM generally adopts the strategy of “One vs. the Rest.” In this study, we use the sequence minimum optimization algorithm (Platt, 1998), which is widely adopted for SVM learning.
Performance Measurement
This study employed the Matthew's correlation coefficient (MCC) (Matthews, 1975; Gorodkin, 2004) as the key measurement for evaluating the performance of classifiers because it is deemed as a balanced measurement even if sizes of classes are of great differences. The original MCC was proposed by Matthews (1975), which was designed for binary classification and has wide applications (Chen et al., 2017a, 2018b; Li et al., 2019). Here, two datasets (Dataset-1 and Dataset-2) contain more than two classes. Thus, the multi-class version of MCC was used, which was proposed by Gorodkin (2004). To calculate such MCC, two matrices are first constructed, say X and Y, where X is a 0-1 matrix representing the predicted class of each sample and Y is also a 0-1 matrix indicating the true classes of all samples. Then, such MCC is defined as
where cov(·, ·) stands for the covariance of two matrices. To date, such MCC has been applied to evaluate performance of different multi-class classifiers (Salari et al., 2014; Schmuker et al., 2014; Zhang et al., 2019). For convenience, such MCC is also called MCC in the following text.
Results
In this study, we applied machine learning methods to classify samples from different types of diseases, which mainly cover two datasets. One consists of five cancers and heath control (called Dataset-1), and the other one consists of 15 diseases (called Dataset-2). We use the same computational pipeline for analyzing these two datasets separately. Entire procedures are shown in Figure 1.
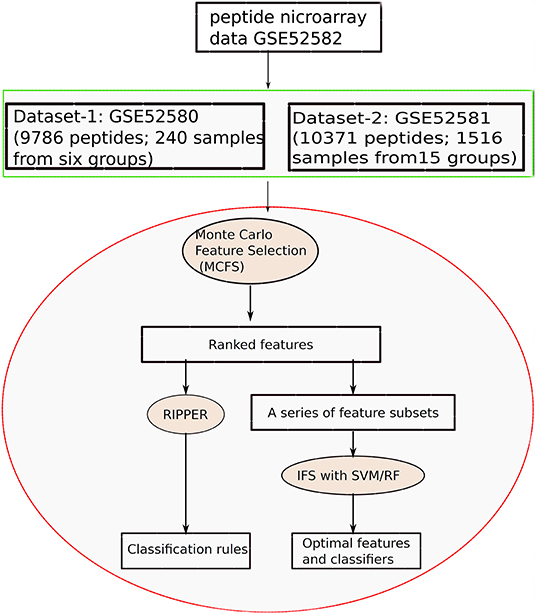
Figure 1. Entire procedures to investigate the peptide microarray data from Gene Expression Omnibus with advanced machine learning algorithms.
Results on Dataset-1
We first run the feature selection method to detect potential antigenic peptides associated with six classes. The RI scores for all peptides are given in Table S1. In general, using all available features may not yield the best performance. To identify the optimum number of features with the best performance for classifying samples from the six classes in this dataset, we run the IFS with an integrated RF classifier. We first run the RF on the series of feature subsets with a step 10. The performance of RF corresponding to different numbers of features is given in Table S2. For an easy observation, the MCCs on different feature subsets is illustrated in Figure 2A, from which we can see that the highest MCC is obtained when top 50 features are used. Thus, we determine an interval range [40, 60] for further investigation. Then, on a series of feature subsets with a step 1 between the range [40, 60]. The performance of RF on these feature subsets is shown in Figure 2B. We obtain the best MCC value of 0.985 when top 46 features are used (Table 1). These 46 features are deemed to be optimal features for RF and a RF classifier with these features are called optimal RF classifier. The detailed performance, including accuracies on six classes and overall accuracy, is illustrated in Figure 3. Such classifier gives perfect performance on four classes and overall accuracy is 0.988, suggesting the high performance of the optimal RF classifier. Of note, we also have an in-house assessment that RF can outperform SVM on Dataset-1.
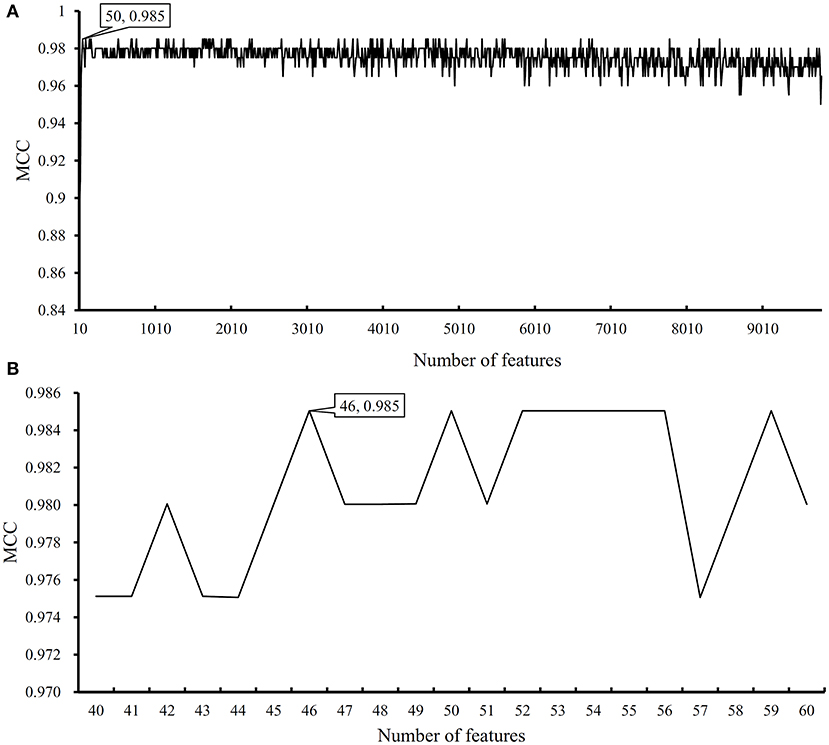
Figure 2. Performance of random forest (RF) on different feature subsets. (A) Performance of RF on feature subsets with step 10; (B) Performance of RF on feature subsets with top 40–60 features.
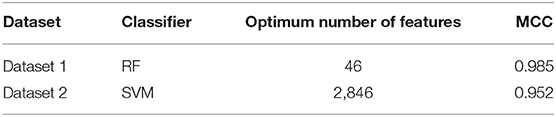
Table 1. The classification performance on two datasets.
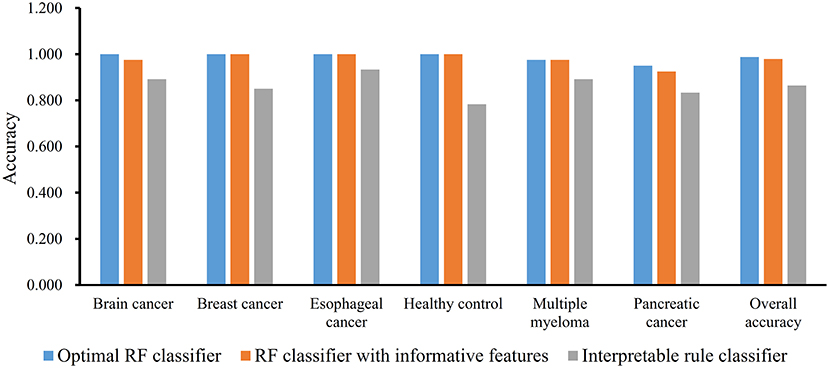
Figure 3. Performance of three classifiers on six groups in dataset-1 and overall accuracy.
The MCFS method can output some informative features for any input dataset. For Dataset-1, 517 informative features are extracted, which are the first 517 features in Table S1. It is interesting to investigate the performance of RF on these features. By 10-fold cross-validation, we obtain the MCC of 0.975, which is lower than that yielded by above-mentioned optimal RF classifier. Its detailed performance is displayed in Figure 3. The overall accuracy is 0.979. On individual accuracies of six classes, none of them can exceed corresponding accuracy yielded by the optimal RF classifier. Thus, the IFS method can actual find out the optimal feature subspace for RF, thereby providing higher performance.
Furthermore, we also employ the Johnson Reducer and RIPPER algorithms to construct interpretable rules based on 517 informative features. To test the performance of rules yielded by these two algorithms, 10-fold cross-validation is performed thrice. We yield the MCC of 0.837. The confusion map (Figure 4) shows the misclassification among six classes. Accordingly, the accuracies on six classes are counted and illustrated in Figure 3. They are all much lower than those of the optimal RF classifier. Although the rule classifier provided much lower performance, they can provide a clear classification procedure and indicate the differences between different classes, thereby giving more biology insights. Accordingly, we further applied Johnson Reducer and RIPPER algorithms on all samples in Dataset-1, obtaining seven classification rules, which are listed in Table 2.
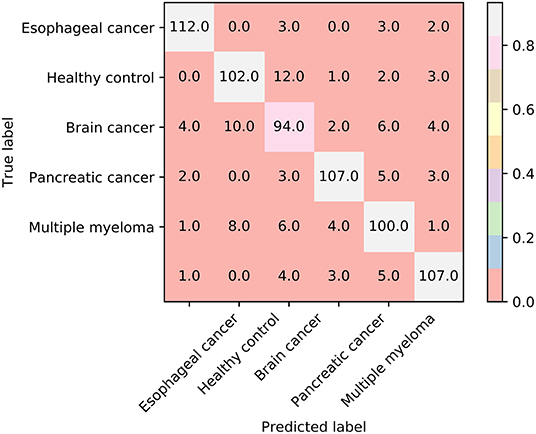
Figure 4. The confusion map of seven classification rules on dataset-1.
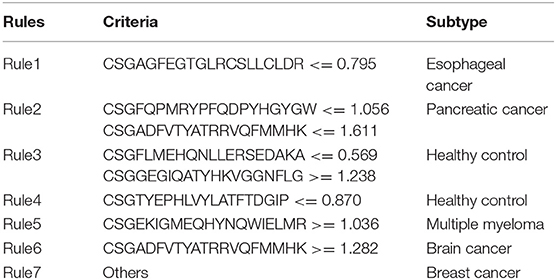
Table 2. Seven detected rules for classifying different diseases in dataset-1.
Results on Dataset-2
We performed the same analysis as above on Dataset-2. We first use MCFS to rank the input features, whose RI scores are given in Table S3. Then, we run IFS with an integrated SVM on the samples consisting of features from the generated feature subsets with a step 10. The performance of SVM corresponding to different numbers of features is provided in Table S4. Figure 5A shows the performance of SVM, evaluated by MCC, on above-constructed feature subsets. The highest MCC is 0.951 when top 2,860 features are adopted. Then, we obtain an interval [2,800, 2,900] for further investigation. To further extract the optimum number of features, we run the SVM on the samples consisting of the features from a series of feature subsets generated from the interval with a step 1. The performance of SVM on these feature subsets is shown in Figure 5B. We obtain the best MCC value of 0.952 when the top 2,846 features are used (Table 1). Thus, these top 2,846 features are termed as optimal features for SVM and the SVM classifier with these features are called optimal SVM classifier. The individual accuracies on 15 classes and overall accuracy are illustrated in Figure 6. The overall accuracy is 0.956, two classes receive the highest accuracy of 1.000, other 10 classes receive the accuracy higher than 0.900. All these suggest the high performance of the optimal SVM classifier. Of note, we also have an in-house assessment that SVM can outperform RF on Dataset-2.
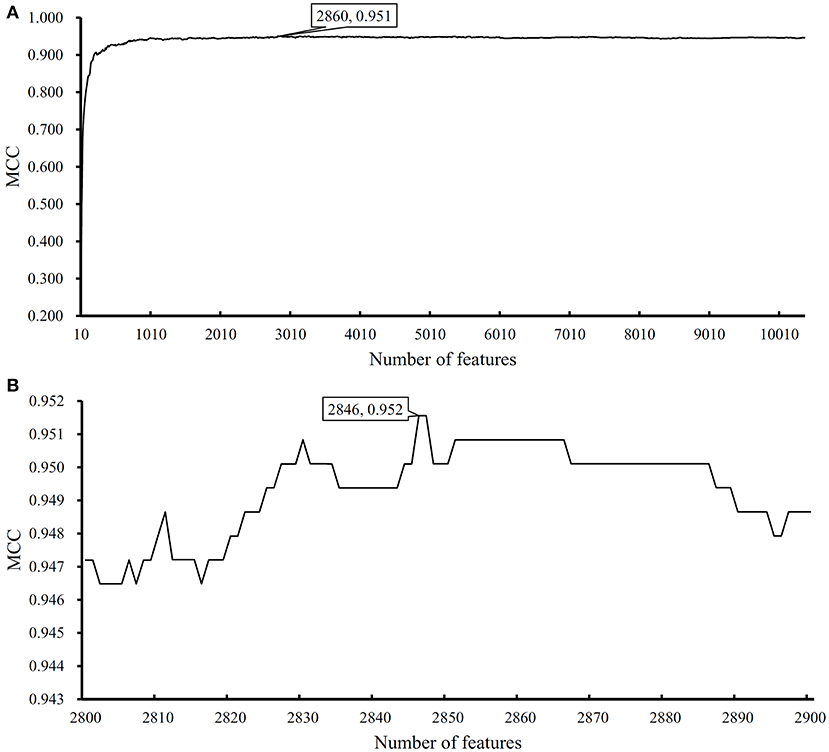
Figure 5. Performance of support vector machine (SVM) on different feature subsets. (A) Performance of SVM on feature subsets with step 10; (B) Performance of SVM on feature subsets with top 2,800–2,900 features.
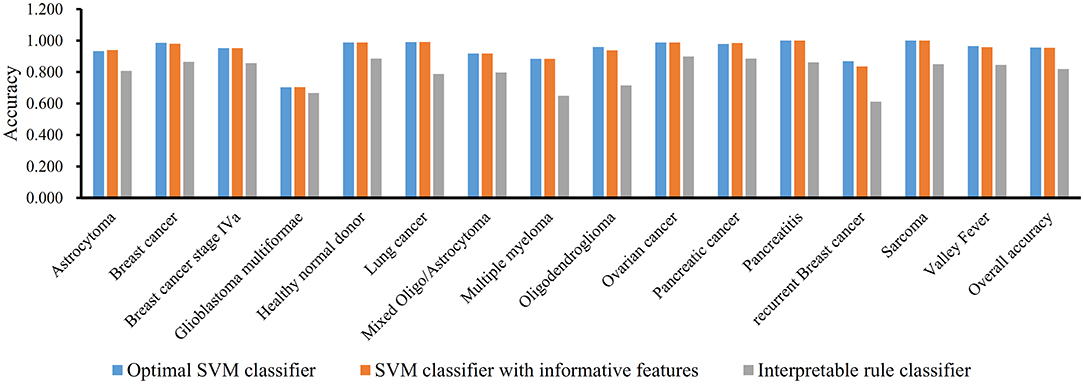
Figure 6. Performance of three classifiers on 15 groups in dataset-2 and overall accuracy.
Similar to Dataset-1, the MCFS method extracts 3,264 informative features. With these 3,264 features, an SVM classifier on Dataset-2 is built and evaluated by 10-fold cross-validation. the MCC is 0.949, which is slightly lower than that of the optimal SVM classifier. Figure 6 shows the accuracies on 15 groups and overall accuracy. The overall accuracy is 0.954. For 15 individual accuracies, such classifier generated higher accuracies on two classes than the optimal SVM classifier, while on four classes, it yields lower accuracies. Altogether, the optimal SVM classifier gives higher performance.
In addition, we also adopt Johnson Reducer and RIPPER algorithms to construct classification rules based on 3,264 informative features. Ten-fold cross-validation is used to evaluate the performance of rules yielded by these two algorithms and such procedures are executed thrice, producing the MCC of 0.801, which is much lower than that of the optimal SVM classifier. The corresponding confusion map is shown in Figure 7. The accuracies of 15 classes and overall accuracy are illustrated in Figure 6. The rule classifier yields lower accuracies on all 15 classes compared with those of optimal SVM classifier. Likewise, 42 classification rules are constructed by applying Johnson Reducer and RIPPER algorithms on all samples in Dataset-2, which are listed in Table 3.
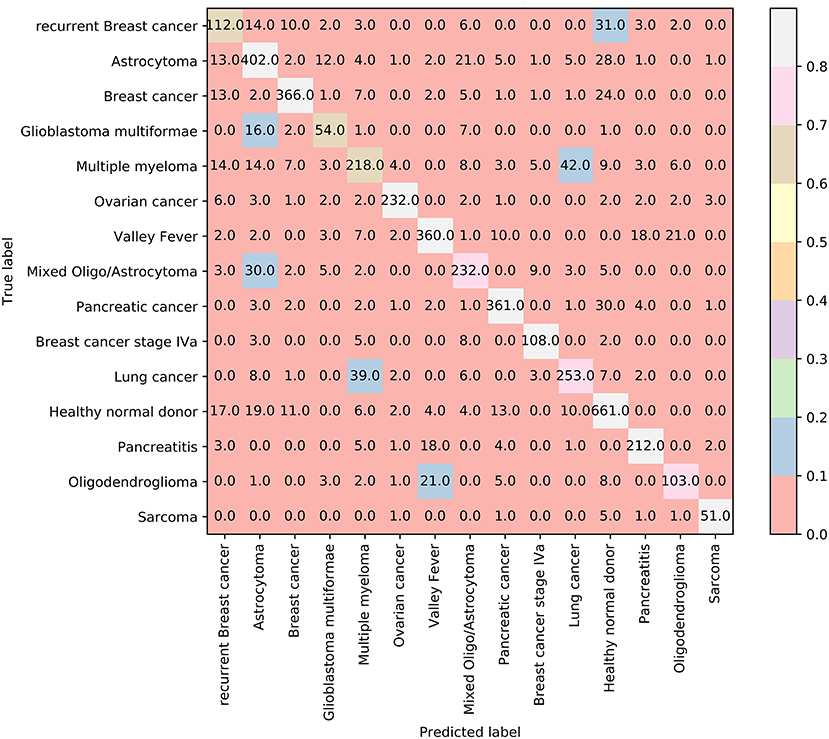
Figure 7. The confusion map of 42 classification rules on dataset-2.
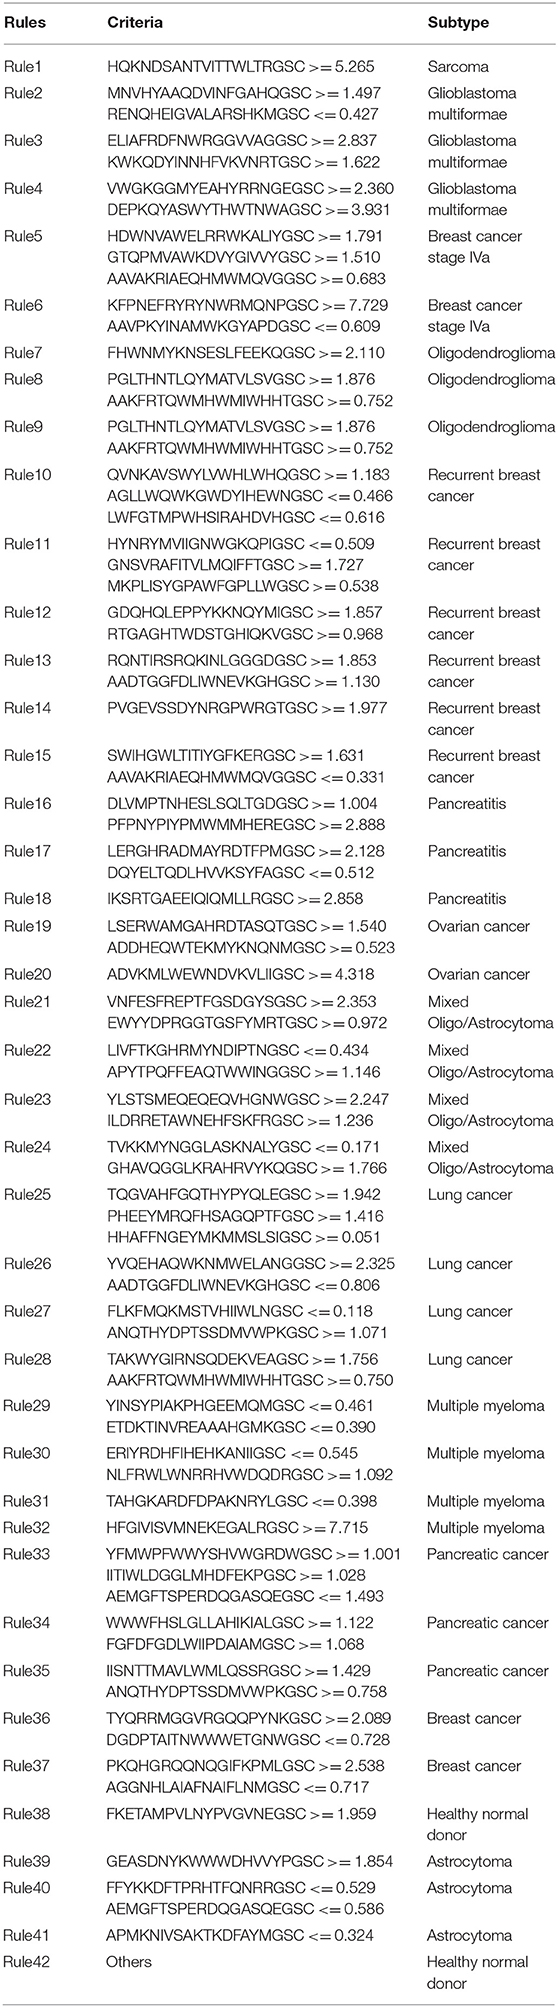
Table 3. Forty-two detected rules for classifying different diseases in dataset-2.
Discussion
As described above, we screened and identified the core potential antigens that can be recognized by the free antibodies in the peripheral blood of patients with different diseases. All the identified peptides have been further mapped to their respective original proteins and corresponding encoding genes. Tumor-specific or tumor subtype-specific biomarkers shall be derived from tumor-associated genes or variations. Recent publications have confirmed that all the genes, which such peptides can be mapped to, are functionally related to tumorigenesis, validating the efficacy and accuracy of our prediction. Further, based on the abundance of each identified peptide, we set up a quantitative recognition standard for the accurate identification, accomplishing the quantitative analysis. The detailed analysis on each identified peptide and settled up rules is provided below.
Immunosignature-Associated Genes
As mentioned in Section Results, some key features were extracted for each dataset. Their related genes are extracted and analyzed in this section.
Immunosignature-Associated Genes Derived From Dataset-1
In the first dataset, we screened and identified the candidate immunosignature antigens for six groups of samples: brain cancer, breast cancer, esophageal cancer, multiple myeloma, pancreatic cancer, and healthy controls.
The first identified peptide in dataset-1 is CSGHPFWHMKHESIYHIYYT, aligning to be a part of proteins (Altschul et al., 1990; Mount, 2007; Pruitt et al., 2014) prickle-like protein 1 and prickle-like protein 2 (Altschul et al., 1997). Encoded by functional genes PRICKLE1 and PRICKLE2, such two proteins participate in the regulation of the Wnt/beta-catenin signaling pathway (Daulat et al., 2012; Mermejo et al., 2014). As for its differential expression pattern in multiple tumor subtypes, the two proteins have been identified in multiple tumor subtypes, including brain cancer (Katoh and Katoh, 2003), breast cancer (Jaeger and Delacretaz, 1953), esophageal cancer (Shimo et al., 2004), and pancreatic cancer (Katoh and Katoh, 2003), but are rarely detected in multiple myeloma and normal controls, validating the distinctive capacity of such PRICKLE1- or PRICKLE2-derived antigen on distinguishing different tumor subtypes.
The second peptide CSGSAIKVMIEIFVMHPYIK can also be aligned to multiple reference proteins, such as protein orai-2 isoform b, angiopoietin-2 isoform a precursor, and zinc finger protein 462 isoform 2 (Altschul et al., 1990; Mount, 2007; Pruitt et al., 2014), indicating that such peptide may have multiple releasing sources (Altschul et al., 1997). The three mentioned sources of our identified peptides have all been confirmed to contribute to the clustering and recognition of each effective disease subtype. Take angiopoietin-2 isoform a precursor as an example. As a precursor of effective angiopoietin-2, such protein is a potential biomarker in brain cancer (Seifert et al., 2015), breast cancer (Han et al., 2016), multiple myeloma (Nowicki et al., 2017), and pancreatic cancer (Chou et al., 2016), but not esophageal cancer and normal controls, together with ANGPT2. Therefore, such protein-derived peptide may also contribute to the detailed distinction of multiple cancer subtypes.
The third identified peptide CSGTMNSEFQNTTRHVYIMS can be aligned to alstrom syndrome protein 1 (Altschul et al., 1990; Mount, 2007; Pruitt et al., 2014) with individual amino acid mismatches induced by tumor-derived genomic instability (Altschul et al., 1997). Encoded by gene ALMS1, such peptide loading protein has been only identified in multiple myeloma but not in other tumor subtypes and normal controls (Rajasagi et al., 2014; Braune et al., 2017). Therefore, such peptide may also be potential biomarkers for immunosignature recognition-based cancer diagnosis and prognosis in real-time because of its potential relationship with ALMS1, distinguishing unique cancer subtypes.
The following peptide CSGKSPRFHKGGIQYKVDWY can also be traced back to two effective tumor-associated proteins, namely, E3 ubiquitin-protein ligase NHLRC1 and gamma-tubulin complex component6, which participate in tumorigenesis (Altschul et al., 1997; Orlic et al., 2006; Martin et al., 2014) and contribute to the distinction of different tumor subtypes in our candidate tumor subgroups (Orlic et al., 2006; Martin et al., 2014). Therefore, based on dataset-1, all the identified qualitative immunosignature-associated peptides can be traced back to cancer immune antigens, validating the efficacy and accuracy of our prediction.
Immunosignature-Associated Genes Derived From Dataset-2
Apart from such analyzed optimal peptides identified on the first platform, we also tried to identify the core distinctive peptides derived from other platforms by the same computational approach, hoping to represent the comprehensive distinction capacity of immunosignature. In such dataset of samples (dataset-2), we screened out the candidate immunosignature antigens for 15 types of diseases, also including the normal controls.
The first identified peptide is FKETAMPVLNYPVGVNEGSC, aligning to three effective proteins succinate-semialdehyde dehydrogenase, mitochondrial isoform 1; succinate-semialdehyde dehydrogenase, mitochondrial isoform 2; and exosome complex component MTR3 (Altschul et al., 1990; Mount, 2007; Pruitt et al., 2014). These proteins have differential expression patterns in 15 sample subgroups. Considering the length limitation, we chose exosome complex component MTR3 as an example for detailed discussion. Mediating mRNA degradation (Houseley et al., 2007; Sandler et al., 2013), such protein participates in the pathogenesis of some disease subtypes, including some candidate subgroups such as breast cancer (Rosedale and Fu, 2010), but not other subtypes such as astrocytoma, glioblastoma multiforme, and lung cancer. Therefore, with specific expression pattern on proteomic level, the identified antigen may be differentially expressed in distinct diseases subtypes, validating the efficacy, and accuracy of our prediction.
The second identified peptide is SESTLAKIGVLGNLYDIGSC, derived from caspase-8, glutamate receptor ionotropic, and Kv channel interacting protein. Three proteins have been functionally connected to tumorigenesis. Taking Kv channel-interacting proteins (KCNIPs) as an example, members of the KCNIP family contribute to the inactivation of A-type potassium channels (Pruunsild and Timmusk, 2005; Moreau et al., 2016). Comparing with our candidate diseases list, such peptide can distinguish neural system-associated diseases from others because of the specific regulatory role of the KCNIP family in the nervous system (Néant et al., 2015; Moreau et al., 2016), validating the efficacy and accuracy of our approach.
The third identified peptide has a specific sequence of AQNADELEEYSASKHDGGSC, which can be realigned to multiple tumor-associated proteins, such as mediator of RNA polymerase II transcription subunit 1, protein FAM45A, and protein SETSIP (Altschul et al., 1990; Mount, 2007; Pruitt et al., 2014). All three proteins have differential expression patterns on the proteomic level in our 15 candidate disease subtypes (including health control). As a chromatin binding protein SETSIP, such gene participates in somatic cell reprogramming and cell differentiation (Margariti et al., 2012). Such protein is not expressed nor functioning in multiple tissue subtypes. Such identified protein only acts as a reprogramming regulator in vascular fibroblasts (Margariti et al., 2012) and human gastric epithelial cells (Fazeli et al., 2017). This finding reflects its specific tissue-restricted expression pattern and confirms that such protein is effective in distinguishing candidate 15 diseases by its specific tissue-restricted expression pattern.
As analyzed above, all identified peptides are derived from disease-associated genes/proteins, reflecting the abnormal expression pattern of certain genes/proteins under certain pathogenic conditions. Due to the limitation of the article length, all optimal peptides cannot be analyzed one by one. Peptides such as PMDEGFAQIAHQALINAGSC and VNHKPLLSGHSGVEWPSGSC also present their distinctive capacity for the candidate disease subgroups, validating the efficacy and accuracy of our prediction. Therefore, from one sight of qualitative analysis, immunosignature-based cancer liquid biopsy may be effective.
Immunosignature-Associated Rules
In addition to the above analysis, we also applied two groups of quantitative analysis, recognizing a group of effective rules for the detailed distinction of each disease subtype. Due to the limitation of page length, we only focus the top-ranked three optimal rules of each datasets for following detailed data mining and discussion.
Immunosignature-Associated Rules From Dataset-1
The first rule of dataset-1 contributes to the recognition of samples derived from esophageal cancer by only one quantitative parameter, the low expression level of peptide CSGAGFEGTGLRCSLLCLDR. Recent publications have reported that such peptide is aligned to a group of specific proteins named phosphoinositide 3-kinase regulatory subunit 5 isoform 1/2 and sortilin-related receptor preproprotein (Altschul et al., 1990; Mount, 2007; Pruitt et al., 2014). Not all such identified proteins are lowly expressed in esophageal cancer, except for protein phosphoinositide 3-kinase regulatory subunit 5 (Zhang et al., 2018), validating the efficacy, and accuracy of our prediction. On the basis of the detailed expression level of such protein in serum provided by the Proteomics Database (Wilhelm et al., 2014; Schmidt et al., 2018) and the Cancer Proteomic Database (Arntzen et al., 2015), such protein has relatively high expression patterns in multiple tissue subtypes. As for its expression level in the serum of esophageal cancer patients, recent publications (Zhu et al., 2015; Peng et al., 2017) have also confirmed its low expression pattern, validating the prediction tendency of our quantitative rules.
As for the second rule, candidate peptides CSGFQPMRYPFQDPYHGYGW and CSGADFVTYATRRVQFMMHK derived from uracil-DNA glycosylase isoform UNG2, T-cell surface glycoprotein CD5 isoform 2, and transmembrane protein 33, N-acetylgalactosamine kinase isoform X10 contribute to the identification of pancreatic cancer. We chose T-cell surface glycoprotein CD5 isoform 2 and transmembrane protein 33 as two major peptide sources for detailed quantitative discussion. According to recent publications (Chu et al., 2003; Wörmann et al., 2014; Lu et al., 2015), these two proteins are lowly expressed in pancreatic cancer. Considering the detailed expression level in the Proteomics Database (Wilhelm et al., 2014; Schmidt et al., 2018) and the Cancer Proteomic Database (Arntzen et al., 2015), we further validated the low expression patterns of these genes.
As for the third quantitative rules, parameters CSGFLMEHQNLLERSEDAKA and CSGGEGIQATYHKVGGNFLG have been selected for the identification of healthy controls. By realigning to the Refseq protein database (Altschul et al., 1990; Mount, 2007; Pruitt et al., 2014), the two peptides have been confirmed to be derived from proteins 6-phosphofructo-2-kinase/fructose-2,6-bisphosphatase 3 (Clem et al., 2013) and zinc finger protein 296 (Fischedick et al., 2012), respectively. These identified proteins participate in specific pathogenesis with abnormal expression patterns (Fischedick et al., 2012; Clem et al., 2013). On the basis of the Proteomics Database (Wilhelm et al., 2014; Schmidt et al., 2018), the expression level of such two genes in blood is corresponding with our predicted threshold, validating our method's efficacy and accuracy.
Immunosignature-Associated Rules From Dataset-2
The first rule of our identified quantitative rule based on dataset-2 involves a unique peptide, HQKNDSANTVITTWLTRGSC, which can be further realigned to the protein interleukin-1 receptor type 2 with acceptable mismatches that contribute to the identification of sarcoma (Altschul et al., 1990; Mount, 2007; Pruitt et al., 2014). Different from other cancer subtypes, the overexpression of our identified peptide-derived protein interleukin-1 receptor type 2 promotes the initiation and progression of sarcoma (Boddul et al., 2014; Liu et al., 2015). As for the expression parameter we screened, such detailed expression level has also been confirmed based on the Cancer Proteomic Database (Arntzen et al., 2015).
In the second rule, MNVHYAAQDVINFGAHQGSC and RENQHEIGVALARSHKMGSC have been picked up as quantitative parameters for the identification of samples from glioblastoma multiforme patients. Re-aligning (Altschul et al., 1990; Mount, 2007; Pruitt et al., 2014) to effective proteins hydrocephalus-inducing protein and laminin subunit gamma-3 precursor, such rule corresponds to recent publications and related databases. On the basis of our quantitative rules, hydrocephalus-inducing protein has a relatively high expression level (>1.47) and laminin subunit gamma-3 precursor has a relatively low expression level (<0.42) at the proteomic level. Such two expression tendencies have already been confirmed by recent publications (Peles et al., 2004; Lathia et al., 2012). Considering that few reports focused on the expression in serum in multiple patient conditions, we referred to the Cancer Proteomic Database (Arntzen et al., 2015) for proper blood expression pattern under specific pathogenic conditions, which is also correspondent with our prediction.
The third rule derived from dataset-2 also involves two parameters ELIAFRDFNWRGGVVAGGSC and KWKQDYINNHFVKVNRTGSC with their respective expression tendencies in patient samples. Based on BLAST, such two peptides have be accurately realigned to two specific proteins, namely, transmembrane protein 39B (Altschul et al., 1990; Mount, 2007; Kim et al., 2013; Pruitt et al., 2014) and fructosamine-3-kinase, contributing to the identification of glioblastoma multiforme patients. According to such rules, both identified proteins are upregulated during tumorigenesis. Recent publications (Delplanque et al., 2004; Kim et al., 2013; Nass et al., 2014) have validated that the specific expression patterns of such two proteins during the initiation and progression of glioblastoma multiforme turn out to be up-regulation, corresponding with our prediction rules. Due to the lack of serum-based proteomic studies for multiple diseases subtypes, the unique expression patterns of such two genes in blood/serum have been partially verified by referring to the data released from the Cancer Proteomic Database (Arntzen et al., 2015).
All the identified genes in this work are the source of identified immunogenic antigens and are functionally related to tumorigenesis. All the quantitative rules have been validated by recent proteomic analysis, confirming the efficacy and accuracy of our prediction. Therefore, our study settles up a systematic computational workflow for the identification of potential immunosignature in multiple cancer subtypes at the proteomics level, providing new insights into the immunogenic characteristics of tumorigenesis.
Data Availability Statement
Publicly available datasets were analyzed in this study. This data can be found here: https://www.ncbi.nlm.nih.gov/geo/query/acc.cgi?acc=GSE52582.
Author Contributions
TH and Y-DC designed the study. XP and LC performed the experiments. TZ, Y-HZ, and YZ analyzed the results. LC, XP, and TZ wrote the manuscript. All authors contributed to the research and reviewed the manuscript.
Funding
This study was supported by the Shanghai Municipal Science and Technology Major Project [2017SHZDZX01], National Key R&D Program of China [2018YFC0910403], National Natural Science Foundation of China [31701151, 31872418], Natural Science Foundation of Shanghai [17ZR1412500], Shanghai Sailing Program [16YF1413800], the Youth Innovation Promotion Association of Chinese Academy of Sciences (CAS) [2016245], the fund of the key Laboratory of Stem Cell Biology of Chinese Academy of Sciences [201703], Science and Technology Commission of Shanghai Municipality (STCSM) [18dz2271000].
Conflict of Interest
The authors declare that the research was conducted in the absence of any commercial or financial relationships that could be construed as a potential conflict of interest.
Supplementary Material
The Supplementary Material for this article can be found online at: https://www.frontiersin.org/articles/10.3389/fbioe.2019.00370/full#supplementary-material
References
Altschul, S. F., Gish, W., Miller, W., Myers, E. W., and Lipman, D. J. (1990). Basic local alignment search tool. J. Mol. Biol. 215, 403–410. doi: 10.1016/S0022-2836(05)80360-2
Altschul, S. F., Madden, T. L., Schäffer, A. A., Zhang, J., Zhang, Z., Miller, W., et al. (1997). Gapped BLAST and PSI-BLAST: a new generation of protein database search programs. Nucleic Acids Res. 25, 3389–3402. doi: 10.1093/nar/25.17.3389
Arntzen, M. O., Boddie, P., Frick, R., Koehler, C. J., and Thiede, B. (2015). Consolidation of proteomics data in the Cancer Proteomics database. Proteomics 15, 3765–3771. doi: 10.1002/pmic.201500144
Boddul, S. V., Meng, J., Dolly, J. O., and Wang, J. (2014). SNAP-23 and VAMP-3 contribute to the release of IL-6 and TNFalpha from a human synovial sarcoma cell line. FEBS J. 281, 750–765. doi: 10.1111/febs.12620
Braune, K., Volkmer, I., and Staege, M. S. (2017). Characterization of alstrom syndrome 1 (ALMS1) transcript variants in hodgkin lymphoma cells. PLoS ONE 12:e0170694. doi: 10.1371/journal.pone.0170694
Cai, Y.-D., Zhang, S., Zhang, Y.-H., Pan, X., Feng, K., Chen, L., et al. (2018). Identification of the gene expression rules that define the subtypes in glioma. J. Clin. Med. 7:350. doi: 10.3390/jcm7100350
Chen, L., Chu, C., Zhang, Y.-H., Zheng, M.-Y., Zhu, L., Kong, X., et al. (2017a). Identification of drug-drug interactions using chemical interactions. Curr. Bioinform. 12, 526–534. doi: 10.2174/1574893611666160618094219
Chen, L., Pan, X., Hu, X., Zhang, Y. H., Wang, S., Huang, T., et al. (2018a). Gene expression differences among different MSI statuses in colorectal cancer. Int. J. Cancer 143, 1731–1740. doi: 10.1002/ijc.31554
Chen, L., Wang, S., Zhang, Y.-H., Li, J., Xing, Z.-H., Yang, J., et al. (2017b). Identify key sequence features to improve CRISPR sgRNA efficacy. IEEE Access 5, 26582–26590. doi: 10.1109/ACCESS.2017.2775703
Chen, L., Zhang, Y.-H., Pan, X., Liu, M., Wang, S., Huang, T., et al. (2018b). Tissue expression difference between mRNAs and lncRNAs. Int. J. Mol. Sci. 19:3416. doi: 10.3390/ijms19113416
Chou, W. C., Lin, P. H., Yeh, Y. C., Shyr, Y. M., Fang, W. L., Wang, S. E., et al. (2016). Genes involved in angiogenesis and mTOR pathways are frequently mutated in Asian patients with pancreatic neuroendocrine tumors. Int. J. Biol. Sci. 12, 1523–1532. doi: 10.7150/ijbs.16233
Chu, P. G., Arber, D. A., and Weiss, L. M. (2003). Expression of T/NK-cell and plasma cell antigens in nonhematopoietic epithelioid neoplasms. An immunohistochemical study of 447 cases. Am. J. Clin. Pathol. 120, 64–70. doi: 10.1309/48KC17WAU69BTBXQ
Clem, B. F., O'neal, J., Tapolsky, G., Clem, A. L., Imbert-Fernandez, Y., Kerr, D. A II, Klarer, A. C., et al. (2013). Targeting 6-phosphofructo-2-kinase (PFKFB3) as a therapeutic strategy against cancer. Mol. Cancer Ther. 12, 1461–1470. doi: 10.1158/1535-7163.MCT-13-0097
Cohen, W. W. (1995). “Fast effective rule induction”, in The Twelfth International Conference on Machine Learning (Tahoe City, CA), 115–123. doi: 10.1016/B978-1-55860-377-6.50023-2
Condello, V., Macerola, E., Ugolini, C., De Napoli, L., Romei, C., Materazzi, G., et al. (2018). Analysis of circulating tumor DNA does not improve the clinical management of patients with locally advanced and metastatic papillary thyroid carcinoma. Head Neck. 40, 1752–1758. doi: 10.1002/hed.25155
Cortes, C., and Vapnik, V. (1995). Support-vector networks. Mach. Learn. 20, 273–297. doi: 10.1007/BF00994018
Crowley, E., Di Nicolantonio, F., Loupakis, F., and Bardelli, A. (2013). Liquid biopsy: monitoring cancer-genetics in the blood. Nat. Rev. Clin. Oncol. 10, 472–484. doi: 10.1038/nrclinonc.2013.110
Cui, H., and Chen, L. (2019). A binary classifier for the prediction of EC numbers of enzymes. Curr. Proteomics 16, 381–389. doi: 10.2174/1570164616666190126103036
Daulat, A. M., Luu, O., Sing, A., Zhang, L., Wrana, J. L., Mcneill, H., et al. (2012). Mink1 regulates beta-catenin-independent Wnt signaling via Prickle phosphorylation. Mol. Cell. Biol. 32, 173–185. doi: 10.1128/MCB.06320-11
Delplanque, J., Delpierre, G., Opperdoes, F. R., and Van Schaftingen, E. (2004). Tissue distribution and evolution of fructosamine 3-kinase and fructosamine 3-kinase-related protein. J. Biol. Chem. 279, 46606–46613. doi: 10.1074/jbc.M407678200
Draminski, M., Rada-Iglesias, A., Enroth, S., Wadelius, C., Koronacki, J., and Komorowski, J. (2008). Monte Carlo feature selection for supervised classification. Bioinformatics 24, 110–117. doi: 10.1093/bioinformatics/btm486
Fazeli, Z., Alebouyeh, M., Mansouri, V., and Malekpour, H. (2017). Protein profiling of infected human gastric epithelial cells with an Iranian Helicobacter pylori clinical isolate. Gastroenterol. Hepatol. Bed Bench 10, S139–S145. doi: 10.22037/ghfbb.v0i0.1277
Fischedick, G., Klein, D. C., Wu, G., Esch, D., Höing, S., Han, D. W., et al. (2012). Zfp296 is a novel, pluripotent-specific reprogramming factor. PLoS ONE 7:e34645. doi: 10.1371/journal.pone.0034645
Gorodkin, J. (2004). Comparing two K-category assignments by a K-category correlation coefficient. Comput. Biol. Chem. 28, 367–374. doi: 10.1016/j.compbiolchem.2004.09.006
Han, H. H., Kim, B. G., Lee, J. H., Kang, S., Kim, J. E., and Cho, N. H. (2016). Angiopoietin-2 promotes ER+ breast cancer cell survival in bone marrow niche. Endocr. Relat. Cancer 23, 609–623. doi: 10.1530/ERC-16-0086
Hiemcke-Jiwa, L. S., Leguit, R. J., Snijders, T. J., Jiwa, N. M., Kuiper, J. J. W., De Weger, R. A., et al. (2018). Molecular analysis in liquid biopsies for diagnostics of primary central nervous system lymphoma: review of literature and future opportunities. Crit. Rev. Oncol. Hematol. 127, 56–65. doi: 10.1016/j.critrevonc.2018.05.010
Houseley, J., Kotovic, K., El Hage, A., and Tollervey, D. (2007). Trf4 targets ncRNAs from telomeric and rDNA spacer regions and functions in rDNA copy number control. EMBO J. 26, 4996–5006. doi: 10.1038/sj.emboj.7601921
Ilas, J., Mühl, A., and Stöckler-Ipsiroglu, S. (2000). Guanidinoacetate methyltransferase (GAMT) deficiency: non-invasive enzymatic diagnosis of a newly recognized inborn error of metabolism. Clin. Chim. Acta 290, 179–188. doi: 10.1016/S0009-8981(99)00182-5
Jaeger, H., and Delacretaz, J. (1953). [Carcinoma en cuirasse of the breast and prickle cell epithelioma of the vulva]. Dermatologica 107, 257–259. doi: 10.1159/000256802
Johnson, D. S. (1974). Approximation algorithms for combinatorial problems. J. Comp. Syst. Sci. 9, 256–278. doi: 10.1016/S0022-0000(74)80044-9
Katoh, M., and Katoh, M. (2003). Identification and characterization of human PRICKLE1 and PRICKLE2 genes as well as mouse Prickle1 and Prickle2 genes homologous to Drosophila tissue polarity gene prickle. Int. J. Mol. Med. 11, 249–256. doi: 10.3892/ijmm.11.2.249
Kim, G. D., Oh, J., Park, H. J., Bae, K., and Lee, S. K. (2013). Magnolol inhibits angiogenesis by regulating ROS-mediated apoptosis and the PI3K/AKT/mTOR signaling pathway in mES/EB-derived endothelial-like cells. Int. J. Oncol. 43, 600–610. doi: 10.3892/ijo.2013.1959
Kohavi, R. (1995). “A study of cross-validation and bootstrap for accuracy estimation and model selection,” in International Joint Conference on Artificial Intelligence: Lawrence Erlbaum Associates Ltd. (Montreal, QC), 1137–1145.
Lathia, J. D., Li, M., Hall, P. E., Gallagher, J., Hale, J. S., Wu, Q., et al. (2012). Laminin alpha 2 enables glioblastoma stem cell growth. Ann. Neurol. 72, 766–778. doi: 10.1002/ana.23674
Li, J., Lu, L., Zhang, Y., Liu, M., Chen, L., Huang, T., et al. (2019). Identification of synthetic lethality based on a functional network by using machine learning algorithms. J. Cell. Biochem. 120, 405–416. doi: 10.1002/jcb.27395
Liu, H. A., and Setiono, R. (1998). Incremental feature selection. Appl. Intellig. 9, 217–230. doi: 10.1023/A:1008363719778
Liu, X., Min, L., Duan, H., Shi, R., Zhang, W., Hong, S., et al. (2015). Short hairpin RNA (shRNA) of type 2 interleukin-1 receptor (IL1R2) inhibits the proliferation of human osteosarcoma U-2 OS cells. Med. Oncol. 32:364. doi: 10.1007/s12032-014-0364-2
Lu, Y., Guan, G. F., Chen, J., Hu, B., Sun, C., Ma, Q., et al. (2015). Aberrant CXCR4 and beta-catenin expression in osteosarcoma correlates with patient survival. Oncol. Lett. 10, 2123–2129. doi: 10.3892/ol.2015.3535
Margariti, A., Winkler, B., Karamariti, E., Zampetaki, A., Tsai, T. N., Baban, D., et al. (2012). Direct reprogramming of fibroblasts into endothelial cells capable of angiogenesis and reendothelialization in tissue-engineered vessels. Proc. Natl. Acad. Sci. U.S.A. 109, 13793–13798. doi: 10.1073/pnas.1205526109
Martin, C. A., Ahmad, I., Klingseisen, A., Hussain, M. S., Bicknell, L. S., Leitch, A., et al. (2014). Mutations in PLK4, encoding a master regulator of centriole biogenesis, cause microcephaly, growth failure and retinopathy. Nat. Genet. 46, 1283–1292. doi: 10.1038/ng.3122
Matthews, B. W. (1975). Comparison of the predicted and observed secondary structure of T4 phage lysozyme. Biochim. Biophys. Acta 405, 442–451. doi: 10.1016/0005-2795(75)90109-9
Mermejo, L. M., Leal, L. F., Colli, L. M., Fragoso, M. C., Latronico, A. C., Tone, L. G., et al. (2014). Altered expression of non-canonical Wnt pathway genes in paediatric and adult adrenocortical tumours. Clin. Endocrinol. 81, 503–510. doi: 10.1111/cen.12462
Mirza, A. H., Berthelsen, C. H., Seemann, S. E., Pan, X., Frederiksen, K. S., Vilien, M., et al. (2015). Transcriptomic landscape of lncRNAs in inflammatory bowel disease. Genome Med. 7:39. doi: 10.1186/s13073-015-0162-2
Mithraprabhu, S., and Spencer, A. (2018). Analysis of circulating tumor DNA. Methods Mol. Biol. 1792, 129–145. doi: 10.1007/978-1-4939-7865-6_9
Moreau, M., Néant, I., Webb, S. E., Miller, A. L., Riou, J. F., and Leclerc, C. (2016). Ca(2+) coding and decoding strategies for the specification of neural and renal precursor cells during development. Cell Calcium 59, 75–83. doi: 10.1016/j.ceca.2015.12.003
Mount, D. W. (2007). Using the basic local alignment search tool (BLAST). CSH Protoc 2007:pdb top17. doi: 10.1101/pdb.top17
Nass, N., Brömme, H. J., Hartig, R., Korkmaz, S., Sel, S., Hirche, F., et al. (2014). Differential response to alpha-oxoaldehydes in tamoxifen resistant MCF-7 breast cancer cells. PLoS ONE 9:e101473. doi: 10.1371/journal.pone.0101473
Néant, I., Mellström, B., Gonzalez, P., Naranjo, J. R., Moreau, M., and Leclerc, C. (2015). Kcnip1 a Ca(2)(+)-dependent transcriptional repressor regulates the size of the neural plate in Xenopus. Biochim. Biophys. Acta 1853, 2077–2085. doi: 10.1016/j.bbamcr.2014.12.007
Nowicki, M., Wierzbowska, A., Małachowski, R., Robak, T., Grzybowska-Izydorczyk, O., Pluta, A., et al. (2017). VEGF, ANGPT1, ANGPT2, and MMP-9 expression in the autologous hematopoietic stem cell transplantation and its impact on the time to engraftment. Ann. Hematol. 96, 2103–2112. doi: 10.1007/s00277-017-3133-4
Ogawa, K., Ban, M., Kanayama, H., and Ukai, M. (1983). Myocardial norepinephrine and cyclic amp concentration following myocardial ischemia–relation to ventricular fibrillation and sudden death. Jpn. Circ. J. 47, 608–613. doi: 10.1253/jcj.47.608
Ohrn, A. (1999). Discernibility and Rough Sets in Medicine: Tools and Applications (Ph.D.), Norwegian University of Science and Technology, Trondheim, Norway.
Orlic, M., Spencer, C. E., Wang, L., and Gallie, B. L. (2006). Expression analysis of 6p22 genomic gain in retinoblastoma. Genes Chromosomes Cancer 45, 72–82. doi: 10.1002/gcc.20263
Pan, X. Y., and Shen, H. B. (2009). Robust prediction of B-factor profile from sequence using two-stage svr based on random forest feature selection. Protein Pept. Lett. 16, 1447–1454. doi: 10.2174/092986609789839250
Pan, X. Y., Zhang, Y. N., and Shen, H. B. (2010). Large-scale prediction of human protein-protein interactions from amino acid sequence based on latent topic features. J. Proteome Res. 9, 4992–5001. doi: 10.1021/pr100618t
Peles, E., Lidar, Z., Simon, A. J., Grossman, R., Nass, D., and Ram, Z. (2004). Angiogenic factors in the cerebrospinal fluid of patients with astrocytic brain tumors. Neurosurgery 55, 562–567; discussion 567–568. doi: 10.1227/01.NEU.0000134383.27713.9A
Peng, X., Xue, H., Lü, L., Shi, P., Wang, J., and Wang, J. (2017). Accumulated promoter methylation as a potential biomarker for esophageal cancer. Oncotarget 8, 679–691. doi: 10.18632/oncotarget.13510
Platt, J. (1998). Sequential Minimal Optimizaton: A Fast Algorithm for Training Support Vector Machines. Technical Report MSR-TR-98–R-14.
Pruitt, K. D., Brown, G. R., Hiatt, S. M., Thibaud-Nissen, F., Astashyn, A., Ermolaeva, O., et al. (2014). RefSeq: an update on mammalian reference sequences. Nucleic Acids Res. 42, D756–763. doi: 10.1093/nar/gkt1114
Pruunsild, P., and Timmusk, T. (2005). Structure, alternative splicing, and expression of the human and mouse KCNIP gene family. Genomics 86, 581–593. doi: 10.1016/j.ygeno.2005.07.001
Rajasagi, M., Shukla, S. A., Fritsch, E. F., Keskin, D. B., Deluca, D., Carmona, E., et al. (2014). Systematic identification of personal tumor-specific neoantigens in chronic lymphocytic leukemia. Blood 124, 453–462. doi: 10.1182/blood-2014-04-567933
Reiman, J. M., Kmieciak, M., Manjili, M. H., and Knutson, K. L. (2007). Tumor immunoediting and immunosculpting pathways to cancer progression. Semin. Cancer Biol. 17, 275–287. doi: 10.1016/j.semcancer.2007.06.009
Rosedale, M., and Fu, M. R. (2010). Confronting the unexpected: temporal, situational, and attributive dimensions of distressing symptom experience for breast cancer survivors. Oncol. Nurs. Forum 37, E28–33. doi: 10.1188/10.ONF.E28-E33
Salari, N., Shohaimi, S., Najafi, F., Nallappan, M., and Karishnarajah, I. (2014). A novel hybrid classification model of genetic algorithms, modified k-nearest neighbor and developed backpropagation neural network. PLoS ONE 9:e112987. doi: 10.1371/journal.pone.0112987
Sandler, I., Medalia, O., and Aharoni, A. (2013). Experimental analysis of co-evolution within protein complexes: the yeast exosome as a model. Proteins 81, 1997–2006. doi: 10.1002/prot.24360
Schmidt, T., Samaras, P., Frejno, M., Gessulat, S., Barnert, M., Kienegger, H., et al. (2018). ProteomicsDB. Nucleic Acids Res. 46, D1271–D1281. doi: 10.1093/nar/gkx1029
Schmuker, M., Pfeil, T., and Nawrot, M. P. (2014). A neuromorphic network for generic multivariate data classification. Proc. Natl. Acad. Sci. U.S.A. 111, 2081–2086. doi: 10.1073/pnas.1303053111
Seifert, M., Garbe, M., Friedrich, B., Mittelbronn, M., and Klink, B. (2015). Comparative transcriptomics reveals similarities and differences between astrocytoma grades. BMC Cancer 15:952. doi: 10.1186/s12885-015-1939-9
Shimo, K., Mizuno, M., Nasu, J., Hiraoka, S., Makidono, C., Okazaki, H., et al. (2004). Complement regulatory proteins in normal human esophagus and esophageal squamous cell carcinoma. J. Gastroenterol. Hepatol. 19, 643–647. doi: 10.1111/j.1440-1746.2003.03328.x
Stafford, P., Cichacz, Z., Woodbury, N. W., and Johnston, S. A. (2014). Immunosignature system for diagnosis of cancer. Proc. Natl. Acad. Sci. U.S.A. 111, E3072–3080. doi: 10.1073/pnas.1409432111
Sun, K., Jiang, P., Chan, K. C., Wong, J., Cheng, Y. K., Liang, R. H., et al. (2015). Plasma DNA tissue mapping by genome-wide methylation sequencing for non-invasive prenatal, cancer, and transplantation assessments. Proc. Natl. Acad. Sci. U.S.A. 112, E5503–5512. doi: 10.1073/pnas.1508736112
Wang, D., Li, J.-R., Zhang, Y.-H., Chen, L., Huang, T., and Cai, Y.-D. (2018). Identification of differentially expressed genes between original breast cancer and xenograft using machine learning algorithms. Genes 9:155. doi: 10.3390/genes9030155
Wilhelm, M., Schlegl, J., Hahne, H., Gholami, A. M., Lieberenz, M., Savitski, M. M., et al. (2014). Mass-spectrometry-based draft of the human proteome. Nature 509, 582–587. doi: 10.1038/nature13319
Wörmann, S. M., Diakopoulos, K. N., Lesina, M., and Algül, H. (2014). The immune network in pancreatic cancer development and progression. Oncogene 33, 2956–2967. doi: 10.1038/onc.2013.257
Zhang, X., Chen, L., Guo, Z.-H., and Liang, H. (2019). Identification of human membrane protein types by incorporating network embedding methods. IEEE Access 7, 140794–140805. doi: 10.1109/ACCESS.2019.2944177
Zhang, Z., Ma, M., Hu, R., Xu, B., Zong, L., Wei, H., et al. (2018). RasGRP3, a Ras guanyl releasing protein 3 that contributes to malignant proliferation and aggressiveness in human esophageal squamous cell carcinoma. Clin. Exp. Pharmacol. Physiol. 45, 720–728. doi: 10.1111/1440-1681.12926
Zhao, R., Chen, L., Zhou, B., Guo, Z., Wang, S., and Aorigele. (2019). Recognizing novel tumor suppressor genes using a network machine learning strategy. IEEE Access 7, 155002–155013. doi: 10.1109/ACCESS.2019.2949415
Zhao, X., Chen, L., Guo, Z.-H., and Liu, T. (2019). Predicting drug side effects with compact integration of heterogeneous networks. Curr. Bioinform. doi: 10.2174/1574893614666190220114644. [Epub ahead of print].
Zhao, X., Chen, L., and Lu, J. (2018). A similarity-based method for prediction of drug side effects with heterogeneous information. Math. Biosci. 306, 136–144. doi: 10.1016/j.mbs.2018.09.010
Zhou, J.-P., Chen, L., and Guo, Z.-H. (2019). iATC-NRAKEL: an efficient multi-label classifier for recognizing anatomical therapeutic chemical (ATC) classes of drugs. Bioinformatics. btz757. doi: 10.1093/bioinformatics/btz757
Keywords: cancer subtype, expression rule, immunosignature, multi-class classification, feature selection
Citation: Chen L, Pan X, Zeng T, Zhang Y-H, Zhang Y, Huang T and Cai Y-D (2019) Immunosignature Screening for Multiple Cancer Subtypes Based on Expression Rule. Front. Bioeng. Biotechnol. 7:370. doi: 10.3389/fbioe.2019.00370
Received: 04 October 2019; Accepted: 13 November 2019;
Published: 29 November 2019.
Edited by:
Ping Zhang, The Ohio State University, United StatesReviewed by:
Hao Lin, University of Electronic Science and Technology of China, ChinaFei Guo, Tianjin University, China
Copyright © 2019 Chen, Pan, Zeng, Zhang, Zhang, Huang and Cai. This is an open-access article distributed under the terms of the Creative Commons Attribution License (CC BY). The use, distribution or reproduction in other forums is permitted, provided the original author(s) and the copyright owner(s) are credited and that the original publication in this journal is cited, in accordance with accepted academic practice. No use, distribution or reproduction is permitted which does not comply with these terms.
*Correspondence: Tao Huang, dG9odWFuZ3Rhb0AxMjYuY29t; Yu-Dong Cai, Y2FpX3l1ZEAxMjYuY29t
†These authors have contributed equally to this work