 Chen-Kai Liao1,2
 Jaw-Shiun Tsai3Liang-Yu Lin4,5Si-Chen Lee1,6Chun-Fu Lai7
 Te-Wei Ho8,9
 Feipei Lai1,6,10*
- 1Graduate Institute of Biomedical Electronics and Bioinformatics, National Taiwan University, Taipei, Taiwan
- 2Lao De Yan Traditional Chinese Medicine Clinic, New Taipei City, Taiwan
- 3Department of Family Medicine, National Taiwan University Hospital, Taipei, Taiwan
- 4Division of Endocrinology and Metabolism, Department of Medicine, Taipei Veterans General Hospital, Taipei, Taiwan
- 5Faculty of Medicine, National Yang-Ming University, Taipei, Taiwan
- 6Department of Electrical Engineering, National Taiwan University, Taipei, Taiwan
- 7Department of Internal Medicine, National Taiwan University Hospital, Taipei, Taiwan
- 8Department of Surgery, National Taiwan University Hospital, Taipei, Taiwan
- 9College of Medicine, National Taiwan University, Taipei, Taiwan
- 10Department of Computer Science and Information Engineering, National Taiwan University, Taipei, Taiwan
Type 2 diabetes mellitus (T2DM) is an important public health issue worldwide. T2DM correlates with cardiovascular disease. Arterial stiffness is also a key factor that can be thought of as a surrogate marker. Nevertheless, it was unclear which harmonic indexes of blood pressure waveforms (BPWs) from subjects' radial artery pulses would be affected by T2DM. Therefore, the objective of this study was to investigate whether and how harmonic indexes can be used to discriminate hemodynamic differences between patients with T2DM and non-T2DM. This helps us to build objective results no matter who conducts the examination instead of pulse diagnosis in traditional way. We enrolled T2DM and non-T2DM patients as experimental and control groups, respectively, from the Department of Family Medicine in the National Taiwan University Hospital and the Department of Internal Medicine in Taipei's Veterans General Hospital from December 2017 to January 2019. ANSWatch® Model TS-0411 was used to capture the BPWs. Amplitude proportions (Cn values) were calculated from harmonics 1–10 of the BPW using fast Fourier transform. Thirty-two T2DM and 15 non-T2DM patients were enrolled. T2DM patients had significant differences in C1 (p = 0.031) and C5 (p = 0.041). The study suggests that analyzing the harmonic characteristics of non-invasively measured BPW of radial artery may be a potential and easy-to-perform approach to discriminate T2DM-induced hemodynamic changes.
Introduction
Diabetes mellitus (DM) is one of the most important public health issues worldwide. The vast majority of diabetes patients have type 2 diabetes mellitus (T2DM). In 2014, it was estimated that 422 million adults above 18 years of age suffered from DM worldwide (WHO, 2016). The global prevalence of DM in 1980 was 4.7%, but it had risen to 8.5% by 2014. Being overweight or obese is strongly linked to diabetes occurrence (WHO, 2016). The trends in the complications of diabetes are cardiovascular disease, chronic kidney disease, loss of vision and lower extremity amputations (Wolf and Ritz, 2003; Radbill et al., 2008; Tripathi and Yadav, 2013; WHO, 2016). DM is a serious threat to a person's health and quality of life.
T2DM patients have higher aortic stiffness (Taniwaki et al., 1999; Kimoto et al., 2003; De Angelis et al., 2004) and higher risk for cardiovascular morbidity and mortality. Large artery stiffness is increased in patients with DM (Cameron et al., 2003; Kimoto et al., 2006; Prenner and Chirinos, 2015). Macrovascular complications in patients with DM involve coronary arteries (Haffner et al., 1998), cerebrovascular vessels (Sarwar et al., 2010), and peripheral arteries (Lange et al., 2004). Kimoto et al. (2006) demonstrated that DM was correlated to pulse wave velocity of the central arteries-heart-carotid and heart-femoral segments significantly. Palombo and Kozakova (2016) showed that stiffness can be considered a surrogate marker of cardiovascular risk. Sarwar et al. (2010) also showed that DM confers about two times the excess risk for vascular diseases, independently from other conventional risk factors.
The pulse examination of traditional Chinese medicine is a unique diagnostic technique absent in Western medicine. It has been implemented for thousands of years throughout the eastern world. Nowadays, some studies in how to digitalize pulse objectively had been proposed (Wang et al., 2010). Physicians can use modern devices instead of traditional pulse examination to collect body internal information from patients' radial artery pulses. This helps us to build objective results no matter who conducts the examination.
Because the transmission of arterial pressure pulse and therefore pulse contour can be affected by changes in vascular conditions along vessels and in vascular beds, blood pressure waveform (BPW) indexes may provide information regarding changes in vascular properties and blood flow (Hsu et al., 2014). Time-domain BPW indexes, including the augmentation index and pulse wave velocity, have been used to detect vascular changes in various cardiovascular diseases (Safar et al., 2003; Avolio et al., 2010; Tuttolomondo et al., 2011). BPW frequency-domain analysis is another way to describe pulse contour (Milnor, 1989). Variation in spectral parameters of BPW has also been proposed to help monitor these properties of blood vessels in basic studies (Taylor, 1966; Li et al., 1981; Wang, 1986; Milnor, 1989; Ming-Yie et al., 2003; Wang et al., 2010) and diseases (e.g., breast cancer, polycystic ovary syndrome, and stroke) in humans (Hsiu et al., 2013; Hsu et al., 2014; Chen et al., 2017). Among the various frequency-domain analysis methods, harmonic analysis is particularly appropriate for measuring BPW signals (Wei and Chow, 1985), because heartbeats are quasiperiodic. Nevertheless, it is unknown as to whether and how harmonic indexes can be used to discriminate between patients with T2DM and those without T2DM. Therefore, the objective of this study was to investigate whether and how harmonic indexes can be used to discriminate hemodynamic differences between patients with T2DM and non-T2DM.
Methods
Subjects
Forty-seven subjects over 40 years old were recruited from the Department of Family Medicine in National Taiwan University Hospital and the Department of Internal Medicine in Taipei Veterans General Hospital from December 2017 to January 2019. Patients with and without T2DM were enrolled. Those with coronary artery disease, hypertensive heart disease, heart failure, valvular heart disease, carditis, any type of cancer, and cerebrovascular accident were excluded, because they might have influenced the aspect of arterial waveform and led to extreme deviations.
The T2DM group included 32 patients with T2DM who were diagnosed by their attending physicians and had a HbA1c ≧ 6.5%. Fifteen subjects who were not diagnosed with T2DM and had a HbA1c <6.0% were classified as the non-T2DM group. After receiving approval from the Research Ethics Committee, National Taiwan University Hospital (REC permit No. 1063704895) and the Institutional Review Board, Taipei Veterans General Hospital (IRB permit No. 1064903562), all subjects signed consent forms before the study. All subjects were voluntarily recruited, were Taiwanese, and most lived in the greater Taipei area.
Study Procedures
We ensured that the subjects from the outpatient department met our selection criteria before enrolment. The subjects were recruited during outpatient department time that was 9 a.m.−12:30 p.m. and 2–6 p.m. The measurement was conducted in a room maintained at 23–25°C. We used the ANSWatch® Model TS-0411 (Taiwan Scientific Corporation, medical device product registration number 001525, permitted by the Department of Health, Taiwan) to collect pulse information from patients after they took a break for at least 10 min and signed the consent form. All participants were measured at sitting position and were asked to relax during the measurement to avoid big motions. The flow chart of this study is shown in Figure 1.
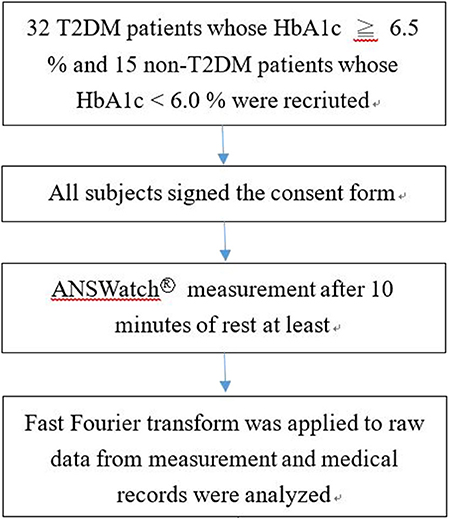
Figure 1. Flow chart of the study.
Apparatus and Harmonic Analysis
Radial artery pulse pressure were recorded on the left wrist using a pulse wave analyzer ANSWatch® Model TS-0411 that has demonstrated accuracy and repeatability (Sun et al., 2011) (Figure 2). ANSWatch® includes a contact-type piezoelectric sensor that measures the pressure index of the radial artery pulse at a 500 Hz sampling frequency for 5 min and obtains 150,000 raw data points per test. Raw data measured by ANSWatch® can be used to calculate several parameters, including systolic blood pressure, diastolic blood pressure, heart rate, low frequency, high frequency, irregular heartbeats, and heart rate variability (Liang et al., 2009; Wu et al., 2009; Chang and Shen, 2011; Lin, 2013; Wang et al., 2013; Lee et al., 2016). Measurement data were downloaded to a notebook and ANSWatch® Manager Pro software (Taiwan Scientific Corporation, Taipei, Taiwan) was used to obtain raw data.
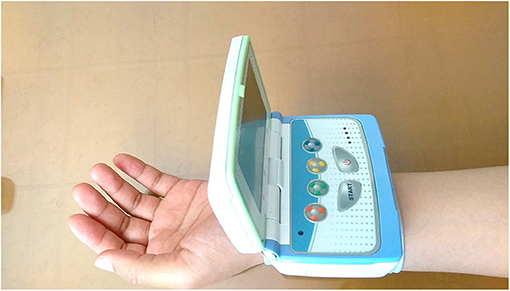
Figure 2. ANSWatch®.
In this study, each 5-min raw data was divided into subset of around 300–500 single waves (Figure 3). In each subset, mean value of each single wave data was subtracted from corresponding single wave data to retrieve the alternating signal of pressure pulse (Figure 4). After that, every single wave was repeated one hundred times independently to generate periodic waves applicable to Fourier transform (Figure 5). Fast Fourier transform function of the software MATLAB (MathWorks, Natick, MA, US) was then applied to each periodic waves data to retrieve values of ten harmonic coefficients, Hn, of the Fourier series. The first harmonic coefficients, H1, are defined as the maximum coefficient in the frequency domains, while the other nth harmonic coefficients were at the frequencies of n times the frequency of corresponding first harmonic coefficient (Figure 6). Coefficient-wise average values of these harmonic coefficients of repeated waves from raw data of the same measurement were calculated, and named An, where n = 1–10. These An values were then transformed into amplitude proportions (Cn). Cn was defined by the following equation:
n = 1–10, which contained more than 95% of the energy of the alternating signal of pressure pulse (Milnor, 1989), A0 is the average value of pulse wave raw data in time domain and An is the average of nth harmonic coefficient of the Fourier series of the repeated single wave from original pulse wave data.
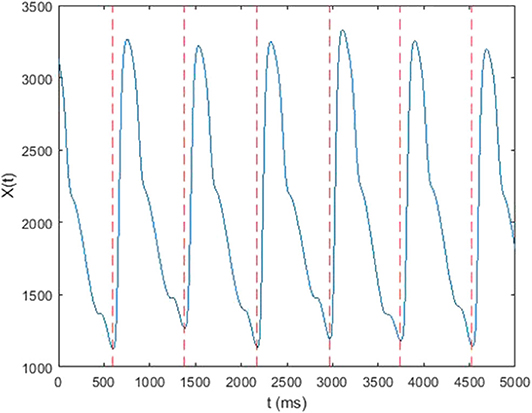
Figure 3. Raw data cut vs. time.
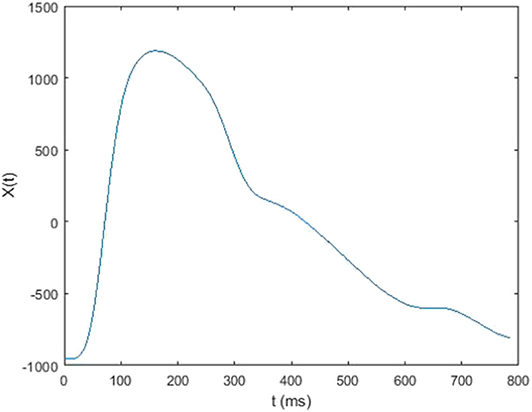
Figure 4. A single wave data (alternating signal) vs. time.
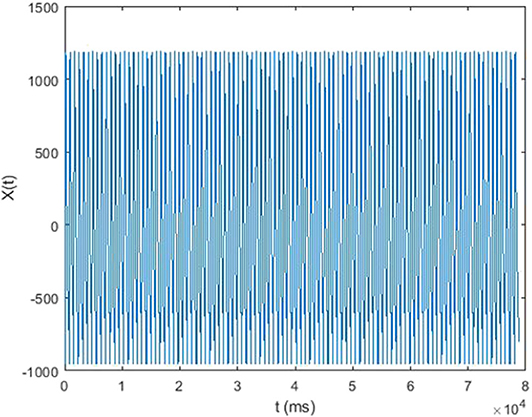
Figure 5. Repeated single wave (alternating signal) vs. time.
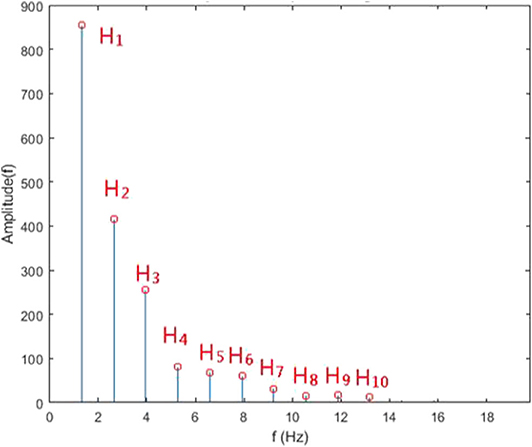
Figure 6. FFT amplitude of repeated single wave.
Statistical Analysis
We used SPSS 18 (SPSS Inc., Chicago, IL, US) to carry out all statistical analyses. Variables were expressed as means with associated standard deviations. Statistical significance was set at p < 0.05 using two-tailed Student's t-test or chi-square test.
Results
Table 1 shows patients' clinical and demographic characteristics. There were no differences in terms of sex, age, diastolic blood pressure, systolic blood pressure, heart rate or smoke habits between the experimental and control groups. However, body mass index was higher in T2DM patients (p = 0.032). Any increase in body mass index above normal weight levels is associated with an increased risk of being diagnosed with DM-related complications (Gray et al., 2015); this is aligned with our findings in this study.
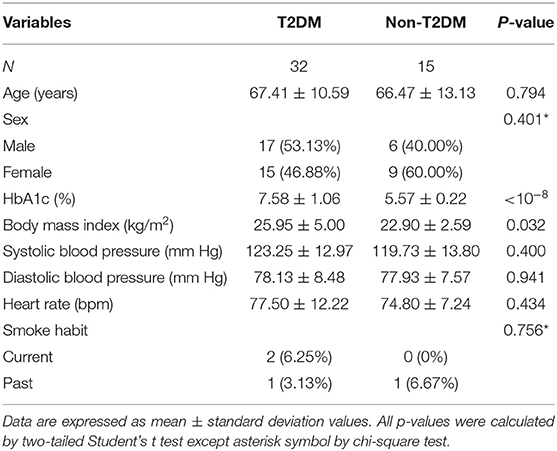
Table 1. Clinical and demographic characteristics of T2DM and non-T2DM.
The BPWs of non-T2DM and T2DM patients in the time domain are shown in Figure 7.
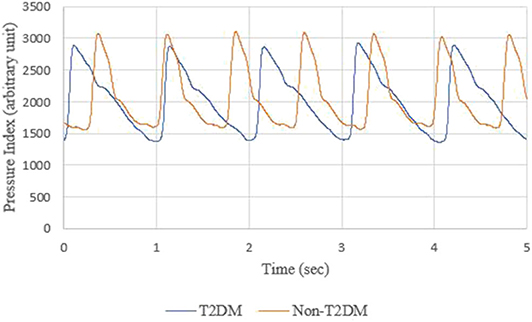
Figure 7. BPWs of non-T2DM and T2DM patients in time domain.
Figure 8 shows the comparison of harmonic amplitude proportions of radial pressure waves in T2DM and non-T2DM patients. All Cn in the T2DM group were lower than non-T2DM group. Among Cn, the C1 and C5 in the T2DM group were significantly lower than non-T2DM group (C1, p = 0.031, C5, p = 0.041).
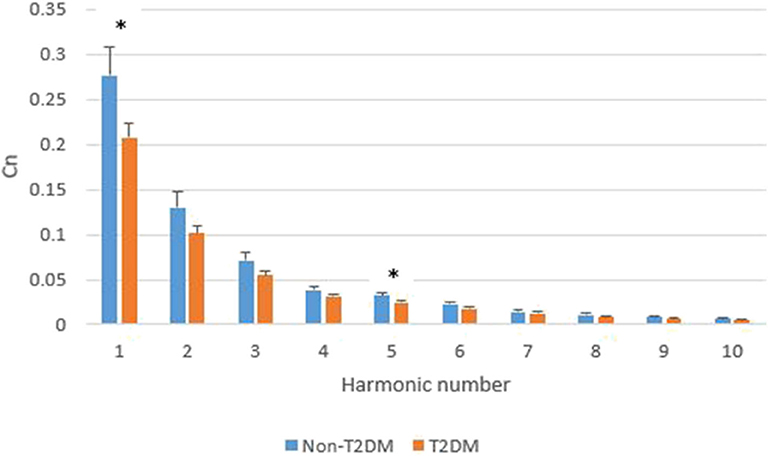
Figure 8. Comparison of Cn in T2DM and non-T2DM patients. The data are represented as mean and standard error values for each harmonic. The asterisk indicates the means of Cn in the two groups differ significantly (p < 0.05) using the two-tailed Student's t-test.
Discussion
In our study, T2DM patients had different harmonic characteristics from non-T2DM patients. Within the scope of our knowledge, this is the first research study showing the characteristics of harmonic indexes of arterial BPWs in T2DM patients.
Table 2 shows the correlation analysis between harmonics of BPW and other physiological parameters to see whether there were any inter-relationships between them. There was no high correlation (>0.7) between each other except a part of Cn. Since features of biomedical signals usually can be represented in several sub-bands, we found higher correlation values located in the diagonal direction in Table 2.
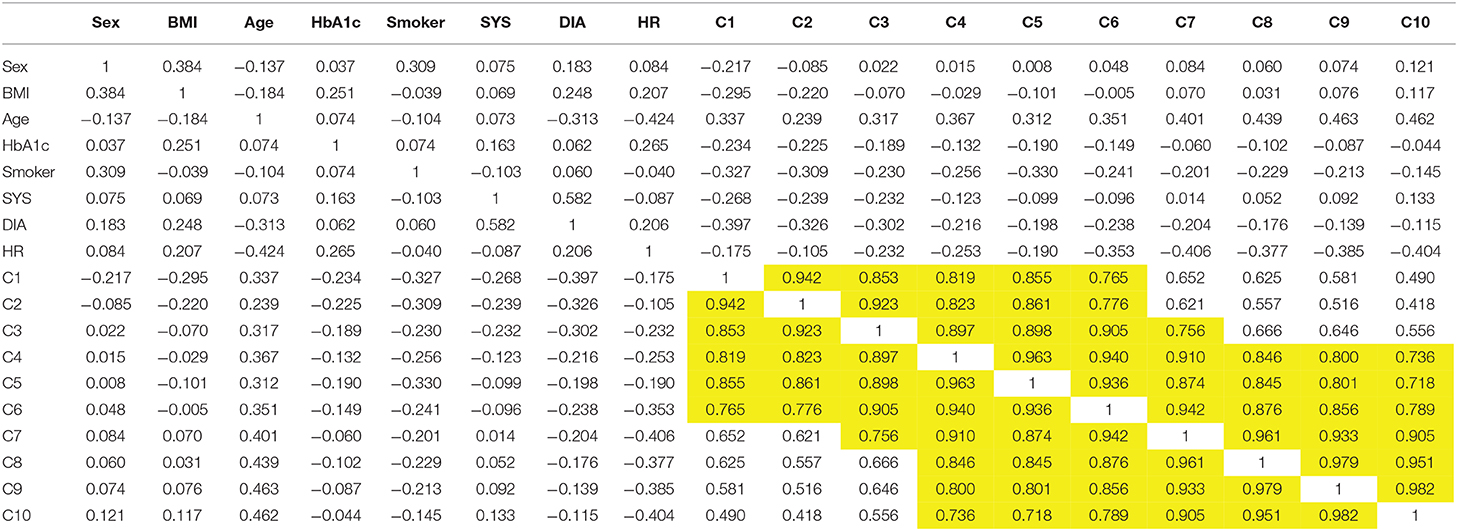
Table 2. The correlation analysis between harmonics of BPW and other physiological parameters (yellow marks represent high correlation which is >0.7).
The BPWs in time domain cannot be digitized to get the difference from Figure 7, but harmonic analysis does not have this problem. Furthermore, although BPW indexes in time domains can help monitor transmission conditions of arterial pressure pulses, these indexes can be interfered by noise, body movement and other factors, resulting in lower accuracy. The shapes of time-domain BPWs were influenced due to parts of these factors in Figures 9A,B.
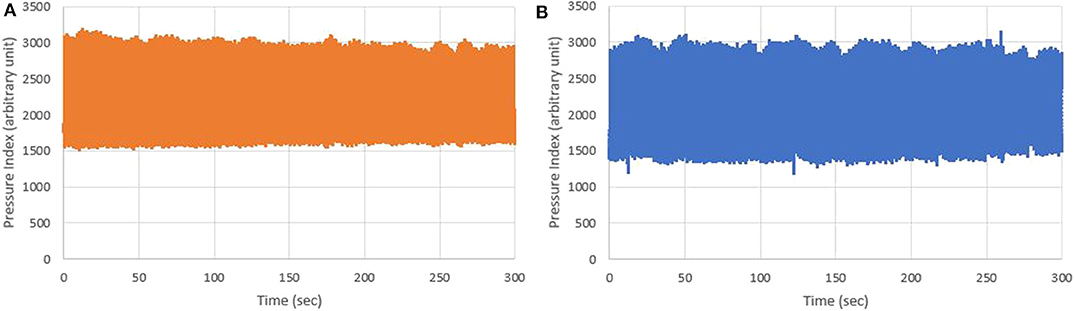
Figure 9. (A) Five-minute BPWs of non-T2DM patients; and (B) Five-minute BPWs of T2DM patients measured by ANSWatch®.
Harmonic analysis of BPW provides another way to monitor changes in vascular properties including detecting changes in arterial elasticity by monitoring changes in harmonic amplitudes (Latham et al., 1985; Hsiu et al., 2012). The present study showed that the harmonic amplitude proportions of BPWs in T2DM patients differ from those in non-T2DM patients. It implies that harmonic analysis could be used to develop non-invasive indexes to discriminate hemodynamic differences in arterial elasticity induced by T2DM.
Several studies have shown that DM results in early arterial stiffness because it is an independent risk factor for structural and functional damage to the arterial wall (van der Meer et al., 2007; Naka et al., 2012; Smulyan et al., 2016). Vascular stiffening results in higher arterial pulse pressure and pulsatile shear, exacerbating endothelial dysfunction (Zieman et al., 2005), a key antecedent and modulator of atherosclerosis that has been displayed in prediabetes (Su et al., 2008). DM is one of the major risk factors of atherosclerosis1. Plaque of the arteries leads to higher resistance of blood flow because it narrows the cross-sectional area of vessels. Since the elasticity of arterials and resistance of blood flow change, pulse transmission changes and then results in different BPWs and harmonic indexes. The relationships are shown in Figure 10. The high frequency of harmonic components transmitted smoother because artery stiffness was increased in patients with DM. The decay of high frequency of harmonic components was less, then the proportion of low frequency of harmonic components decreased. It was supposed that it was the reason why T2DM group had significant lower value in C1 (Figure 8). The elasticity of arterials and resistance of blood flow are correlated with C1 and C5 in this study. These factors are independent of other cardiovascular diseases since subjects with other cardiovascular disease were excluded as mentioned in the method of this study. Besides, it needs further research to know whether there are other determinant factors of C1 and C5. A change in the index could be partly attributed to T2DM-induced hemodynamic change. This implies that change in the index could represent change in arterial stiffness and resistance of blood flow, which is in line with T2DM arterial stiffening. The current study might be developed to provide an easier screening tool for measuring these indexes in T2DM patients instead of measuring patients' arterial stiffness in the future.
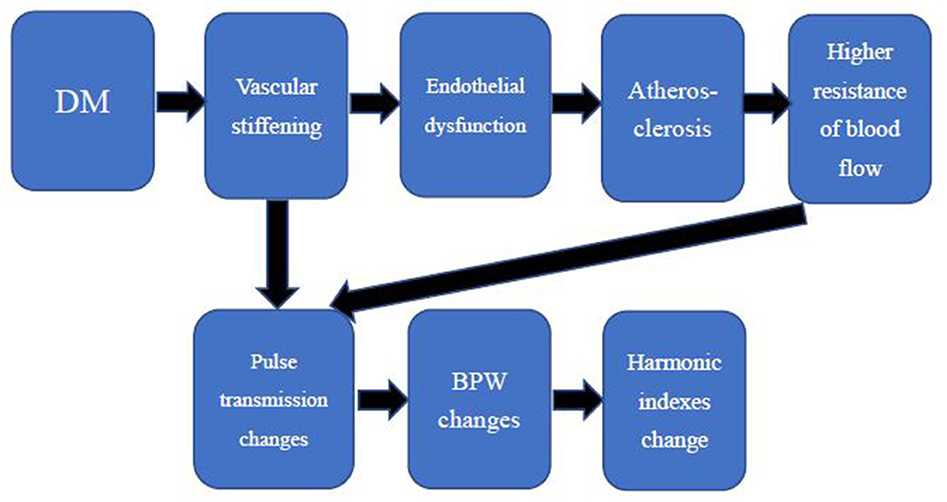
Figure 10. The changing process of harmonic indexes in diabetic patients.
Different diseases can lead to different harmonic distributions in hemodynamics. In previous studies, stroke patients had significant amplitude changes in the 2nd, 5th, 6th, and 7th harmonics (Chen et al., 2011). Patients with liver cirrhosis had significant changes in the 1st, 3rd, and 6th harmonics (Lu et al., 1999). Patients with polycystic ovary syndrome had significant changes in the 1st and 4th harmonics (Hsu et al., 2014). The 1st and 2nd harmonics were significantly larger in patients with breast cancer (Chen et al., 2017). The 1st and 5th harmonic were significantly smaller in T2DM patients in this study. Those different harmonic characteristics further imply that the harmonic distribution of the BPW might help distinguish patients with different diseases.
Young et al. (1989, 1992) showed that the second harmonic component of BPW was prominently lower while ligating the renal artery and the third harmonic component of BPW was significantly different while ligating the artery toward to the spleen in rats. Analysis of harmonics of BPW revealed that different organs might have their own natural frequency. It needs further studies to identify the relationship between individual organs and the harmonics so that we can interpret more from this present study.
There were some limitations to the study. Beside the inclusion and exclusion criteria, subjects without DM concern had low willingness to have blood tests that led to less amount of recruitment in control group. Furthermore, in addition to T2DM, some subjects also suffered from chronic diseases, such as chronic kidney disease, hypertension, hyperlipidemia, and others, because we enrolled the subjects from the outpatient department. We could not assess the effect of these chronic diseases in our current study. Further research can be done to clarify this question in the future. Even though we did not take these factors of chronic diseases into consideration, we were however still able to discriminate between T2DM and non-T2DM patients in the study.
Conclusions
The study showed that the first and fifth harmonics (C1 and C5) differed significantly between the two patient groups, suggesting that analyzing the harmonic characteristics of non-invasively measured peripheral arterial pressure waveform may be a potential and easy-to-perform approach to discriminate T2DM-induced hemodynamic changes.
Data Availability Statement
The datasets generated for this study are available on request to the corresponding author.
Ethics Statement
The study involving human participants was reviewed and approved by the Research Ethics Committee, National Taiwan University Hospital (REC permit No. 1063704895) and the Institutional Review Board, Taipei Veterans General Hospital (IRB permit No. 1064903562). All participants provided their written informed consent before the study.
Author Contributions
FL, J-ST, and S-CL contributed the conception and design of the study. J-ST, L-YL, and C-FL recruited the subjects. C-KL wrote the draft of the manuscript. C-KL, L-YL, C-FL, and T-WH organized the database and performed the statistical analysis. All authors contributed to the article and approved the submitted version.
Conflict of Interest
The authors declare that the research was conducted in the absence of any commercial or financial relationships that could be construed as a potential conflict of interest.
Acknowledgments
The authors acknowledge the statistical assistance provided by the Center of Statistical Consultation and Research in the Department of Medical Research, National Taiwan University Hospital.
Abbreviations
T2DM, type 2 diabetes mellitus; BPW, blood pressure waveform; DM, diabetes mellitus.
Footnotes
1. ^NIH. Who Is at Risk for Atherosclerosis? Available online at: https://www.nhlbi.nih.gov/health-topics/atherosclerosis (accessed April 19, 2020).
References
Avolio, A. P., Butlin, M., and Walsh, A. (2010). Arterial blood pressure measurement and pulse wave analysis–their role in enhancing cardiovascular assessment. Physiol. Meas. 31, R1–47. doi: 10.1088/0967-3334/31/1/R01
Cameron, J. D., Bulpitt, C. J., Pinto, E. S., and Rajkumar, C. (2003). The aging of elastic and muscular arteries: a comparison of diabetic and nondiabetic subjects. Diabetes Care 26, 2133–2138. doi: 10.2337/diacare.26.7.2133
Chang, K. M., and Shen, C. W. (2011). Aromatherapy benefits autonomic nervous system regulation for elementary school faculty in taiwan. Evid. Based Complement. Alternat. Med. 2011:946537. doi: 10.1155/2011/946537
Chen, C. T., Hsiu, H., Hung, S. H., Chen, G. Z., and Huang, Y. L. (2017). Characteristics of spectral indexes of the blood pressure waveform in patients with breast cancer. Blood Press. Monit. 22, 217–220. doi: 10.1097/MBP.0000000000000260
Chen, C. T., Huang, S. M., Hsiu, H., Hsu, W. C., Lin, F. C., and Lin, H. W. (2011). Using a blood pressure harmonic variability index to monitor the cerebral blood flow condition in stroke patients. Biorheology 48, 219–228. doi: 10.3233/BIR-2011-0593
De Angelis, L., Millasseau, S. C., Smith, A., Viberti, G., Jones, R. H., Ritter, J. M., et al. (2004). Sex differences in age-related stiffening of the aorta in subjects with type 2 diabetes. Hypertension 44, 67–71. doi: 10.1161/01.HYP.0000130482.81883.fd
Gray, N., Picone, G., Sloan, F., and Yashkin, A. (2015). Relation between BMI and diabetes mellitus and its complications among US older adults. South. Med. J. 108, 29–36. doi: 10.14423/SMJ.0000000000000214
Haffner, S. M., Lehto, S., Ronnemaa, T., Pyorala, K., and Laakso, M. (1998). Mortality from coronary heart disease in subjects with type 2 diabetes and in nondiabetic subjects with and without prior myocardial infarction. N. Engl. J. Med. 339, 229–234. doi: 10.1056/NEJM199807233390404
Hsiu, H., Hsu, C. L., Chen, C. T., Hsu, W. C., and Lin, F. C. (2013). Effects of acupuncture on the harmonic components of the radial arterial blood-pressure waveform in stroke patients. Biorheology 50, 69–81. doi: 10.3233/BIR-130629
Hsiu, H., Huang, S. M., Hsu, C. L., Hu, S. F., and Lin, H. W. (2012). Effects of cold stimulation on the harmonic structure of the blood pressure and photoplethysmography waveforms. Photomed. Laser Surg. 30, 77–84. doi: 10.1089/pho.2011.3124
Hsu, C. L., Hsiu, H., Hsu, W. C., and Chen, C. Y. (2014). Characteristics of harmonic indexes of the arterial blood pressure waveform in polycystic ovary syndrome. Blood Press. Monit. 19, 226–232. doi: 10.1097/MBP.0000000000000044
Kimoto, E., Shoji, T., Shinohara, K., Hatsuda, S., Mori, K., Fukumoto, S., et al. (2006). Regional arterial stiffness in patients with type 2 diabetes and chronic kidney disease. J. Am. Soc. Nephrol. 17, 2245–2252. doi: 10.1681/ASN.2005101038
Kimoto, E., Shoji, T., Shinohara, K., Inaba, M., Okuno, Y., Miki, T., et al. (2003). Preferential stiffening of central over peripheral arteries in type 2 diabetes. Diabetes 52, 448–452. doi: 10.2337/diabetes.52.2.448
Lange, S., Diehm, C., Darius, H., Haberl, R., Allenberg, J. R., Pittrow, D., et al. (2004). High prevalence of peripheral arterial disease and low treatment rates in elderly primary care patients with diabetes. Exp. Clin. Endocrinol. Diabetes 112, 566–573. doi: 10.1055/s-2004-830408
Latham, R. D., Westerhof, N., Sipkema, P., Rubal, B. J., Reuderink, P., and Murgo, J. P. (1985). Regional wave travel and reflections along the human aorta: a study with six simultaneous micromanometric pressures. Circulation 72, 1257–1269. doi: 10.1161/01.CIR.72.6.1257
Lee, T. C., Lo, L. C., and Wu, F. C. (2016). Traditional chinese medicine for metabolic syndrome via TCM pattern differentiation: tongue diagnosis for predictor. Evid. Based Complement. Alternat. Med. 2016:1971295. doi: 10.1155/2016/1971295
Li, J. K., Melbin, J., Riffle, R. A., and Noordergraaf, A. (1981). Pulse wave propagation. Circ. Res. 49, 442–452. doi: 10.1161/01.RES.49.2.442
Liang, W. C., Yuan, J., Sun, D. C., and Lin, M. H. (2009). Changes in physiological parameters induced by indoor simulated driving: effect of lower body exercise at mid-term break. Sensors (Basel) 9, 6913–6933. doi: 10.3390/s90906913
Lin, T. C. (2013). Effects of gender and game type on autonomic nervous system physiological parameters in long-hour online game players. Cyberpsychol. Behav. Soc. Netw. 16, 820–827. doi: 10.1089/cyber.2012.0230
Lu, W. A., Wang, Y. Y., and Wang, W. K. (1999). Pulse analysis of patients with severe liver problems. Studying pulse spectrums to determine the effects on other organs. IEEE Eng. Med. Biol. Mag. 18, 73–75. doi: 10.1109/51.740985
Ming-Yie, J., Hsiu, H., Tse-Lin, H., Wei-Kung, W., and Wang, Y. Y. L. (2003). The Physical conditions of different organs are reflected specifically in the pressure pulse spectrum of the peripheral artery. Cardiovasc. Eng. 3, 21–29. doi: 10.1023/A:1024794802070
Naka, K. K., Papathanassiou, K., Bechlioulis, A., Kazakos, N., Pappas, K., Tigas, S., et al. (2012). Determinants of vascular function in patients with type 2 diabetes. Cardiovasc. Diabetol. 11:127. doi: 10.1186/1475-2840-11-127
Palombo, C., and Kozakova, M. (2016). Arterial stiffness, atherosclerosis and cardiovascular risk: pathophysiologic mechanisms and emerging clinical indications. Vascul. Pharmacol. 77, 1–7. doi: 10.1016/j.vph.2015.11.083
Prenner, S. B., and Chirinos, J. A. (2015). Arterial stiffness in diabetes mellitus. Atherosclerosis 238, 370–379. doi: 10.1016/j.atherosclerosis.2014.12.023
Radbill, B., Murphy, B., and LeRoith, D. (2008). Rationale and strategies for early detection and management of diabetic kidney disease. Mayo Clin. Proc. 83, 1373–1381. doi: 10.4065/83.12.1373
Safar, M. E., Levy, B. I., and Struijker-Boudier, H. (2003). Current perspectives on arterial stiffness and pulse pressure in hypertension and cardiovascular diseases. Circulation 107, 2864–2869. doi: 10.1161/01.CIR.0000069826.36125.B4
Sarwar, N., Gao, P., Seshasai, S. R., Gobin, R., Kaptoge, S., Di Angelantonio, E., et al. (2010). Diabetes mellitus, fasting blood glucose concentration, and risk of vascular disease: a collaborative meta-analysis of 102 prospective studies. Lancet 375, 2215–2222. doi: 10.1016/S0140-6736(10)60484-9
Smulyan, H., Lieber, A., and Safar, M. E. (2016). Hypertension, diabetes type II, and their association: role of arterial stiffness. Am. J. Hypertens 29, 5–13. doi: 10.1093/ajh/hpv107
Su, Y., Liu, X. M., Sun, Y. M., Wang, Y. Y., Luan, Y., and Wu, Y. (2008). Endothelial dysfunction in impaired fasting glycemia, impaired glucose tolerance, and type 2 diabetes mellitus. Am. J. Cardiol. 102, 497–498. doi: 10.1016/j.amjcard.2008.03.087
Sun, D.C., Chang, Y.H., Chen, A., and Clark, J. (2011). “ANSWatch–a novel portable multi-functional wrist monitor system for clinical applications in integrated and preventive medicine,” in 5th International Meeting on Natural Medicine (Kuala Lumpur), 116–126.
Taniwaki, H., Kawagishi, T., Emoto, M., Shoji, T., Kanda, H., Maekawa, K., et al. (1999). Correlation between the intima-media thickness of the carotid artery and aortic pulse-wave velocity in patients with type 2 diabetes. Vessel wall properties in type 2 diabetes. Diabetes Care 22, 1851–1857. doi: 10.2337/diacare.22.11.1851
Taylor, M. G. (1966). Use of random excitation and spectral analysis in the study of frequency-dependent parameters of the cardiovascular system. Circ. Res 18, 585–595. doi: 10.1161/01.RES.18.5.585
Tripathi, Y., and Yadav, D. (2013). Diabetic nephropathy: causes and managements. Recent Pat. Endocr. Metab. Immune Drug Discov. 7, 57–64. doi: 10.2174/187221413804660971
Tuttolomondo, A., Di Sciacca, R., Di Raimondo, D., Pedone, C., La Placa, S., Pinto, A., et al. (2011). Effects of clinical and laboratory variables and of pretreatment with cardiovascular drugs in acute ischaemic stroke: a retrospective chart review from the GIFA study. Int. J. Cardiol. 151, 318–322. doi: 10.1016/j.ijcard.2010.06.005
van der Meer, R. W., Diamant, M., Westenberg, J. J., Doornbos, J., Bax, J. J., de Roos, A., et al. (2007). Magnetic resonance assessment of aortic pulse wave velocity, aortic distensibility, and cardiac function in uncomplicated type 2 diabetes mellitus. J. Cardiovasc. Magn. Reson. 9, 645–651. doi: 10.1080/10976640601093703
Wang, Y. J., Hsu, C. C., Yeh, M. L., and Lin, J. G. (2013). Auricular acupressure to improve menstrual pain and menstrual distress and heart rate variability for primary dysmenorrhea in youth with stress. Evid. Based Complement. Alternat. Med. 2013:138537. doi: 10.1155/2013/138537
Wang, Y. Y. L., Hsu, T. L., Jan, M. Y., and Wang, W. K. (2010). Review: theory and applications of the harmonic analysis of arterial pressure pulse waves. J. Med. Biol. Eng. 30, 125–131.
Wei, L. Y., and Chow, P. (1985). Frequency distribution of human pulse spectra. IEEE Trans. Biomed. Eng. 32, 245–246. doi: 10.1109/TBME.1985.325537
WHO (2016). Global Report on Diabetes, WHO 2016. Available online at: https://apps.who.int/iris/bitstream/handle/10665/204871/9789241565257_eng.pdf (accessed March 1, 2019).
Wolf, G., and Ritz, E. (2003). Diabetic nephropathy in type 2 diabetes prevention and patient management. J. Am. Soc. Nephrol. 14, 1396–1405. doi: 10.1097/01.ASN.0000065639.19190.CF
Wu, J. H., Chen, H. Y., Chang, Y. J., Wu, H. C., Chang, W. D., Chu, Y. J., et al. (2009). Study of autonomic nervous activity of night shift workers treated with laser acupuncture. Photomed. Laser Surg. 27, 273–279. doi: 10.1089/pho.2007.2235
Young, S. T., Wang, W. K., Chang, L. S., and Kuo, T. S. (1989). Specific frequency properties of renal and superior mesenteric arterial beds in rats. Cardiovasc. Res. 23, 465–467. doi: 10.1093/cvr/23.6.465
Young, S. T., Wang, W. K., Chang, L. S., and Kuo, T. S. (1992). The filter properties of the arterial beds of organs in rats. Acta Physiol. Scand. 145, 401–406. doi: 10.1111/j.1748-1716.1992.tb09381.x
Keywords: diabetes mellitus, blood pressure, hemodynamic, stiffness, harmonic, fast Fourier transform
Citation: Liao C-K, Tsai J-S, Lin L-Y, Lee S-C, Lai C-F, Ho T-W and Lai F (2020) Characteristics of Harmonic Indexes of the Arterial Blood Pressure Waveform in Type 2 Diabetes Mellitus. Front. Bioeng. Biotechnol. 8:638. doi: 10.3389/fbioe.2020.00638
Received: 27 February 2020; Accepted: 26 May 2020;
Published: 08 July 2020.
Edited by:
Yih-Kuen Jan, University of Illinois at Urbana-Champaign, United StatesReviewed by:
José Antonio De La O Serna, Autonomous University of Nuevo León, MexicoFuyou Liang, Shanghai Jiao Tong University, China
Copyright © 2020 Liao, Tsai, Lin, Lee, Lai, Ho and Lai. This is an open-access article distributed under the terms of the Creative Commons Attribution License (CC BY). The use, distribution or reproduction in other forums is permitted, provided the original author(s) and the copyright owner(s) are credited and that the original publication in this journal is cited, in accordance with accepted academic practice. No use, distribution or reproduction is permitted which does not comply with these terms.
*Correspondence: Feipei Lai, ZmxhaUBudHUuZWR1LnR3