 Ana Camila Alves de Araújo1
 Enzo Gabriel da Rocha Santos2Karina Santos Guedes de Sá3Viviane Kharine Teixeira Furtado4
 Felipe Augusto Santos3Ramon Costa de Lima5Lane Viana Krejcová6
 Bruno Lopes Santos-Lobato3
 Gustavo Henrique Lima Pinto2
 André dos Santos Cabral7
 Anderson Belgamo8
 Bianca Callegari3
 Ana Francisca Rozin Kleiner9,10
 Anselmo de Athayde Costa e Silva3
 Givago da Silva Souza4,5*
- 1Núcleo de Teoria e Pesquisa do Comportamento, Universidade Federal do Pará, Belém, Brazil
- 2Instituto de Ciências Exatas e Naturais, Universidade Federal do Pará, Belém, Brazil
- 3Instituto de Ciências da Saúde, Universidade Federal do Pará, Belém, Brazil
- 4Núcleo de Medicina Tropical, Universidade Federal do Pará, Belém, Brazil
- 5Instituto de Ciências Biológicas, Universidade Federal do Pará, Belém, Brazil
- 6Instituto de Ciências da Arte, Universidade Federal do Pará, Belém, Brazil
- 7Centro de Ciências Biológicas e da Saúde, Universidade do Estado do Pará, Belém, Brazil
- 8Departamento de Ciência da Computação, Instituto Federal de São Paulo, Piracicaba, Brazil
- 9Laboratório Rainha Sílvia de Análise do Movimento, Rio Claro, Brazil
- 10Departamento de Fisioterapia, Universidade Federal de São Carlos, São Carlos, Brazil
The aim of this study is comparing the accuracies of machine learning algorithms to classify data concerning healthy subjects and patients with Parkinson’s Disease (PD), toward different time window lengths and a number of features. Thirty-two healthy subjects and eighteen patients with PD took part on this study. The study obtained inertial recordings by using an accelerometer and a gyroscope assessing both hands of the subjects during hand resting state. We extracted time and temporal frequency domain features to feed seven machine learning algorithms: k-nearest-neighbors (kNN); logistic regression; support vector classifier (SVC); linear discriminant analysis; random forest; decision tree; and gaussian Naïve Bayes. The accuracy of the classifiers was compared using different numbers of extracted features (i.e., 272, 190, 136, 82, and 27) from different time window lengths (i.e., 1, 5, 10, and 15 s). The inertial recordings were characterized by oscillatory waveforms that, especially in patients with PD, peaked in a frequency range between 3 and 8 Hz. Outcomes showed that the most important features were the mean frequency, linear prediction coefficients, power ratio, power density skew, and kurtosis. We observed that accuracies calculated in the testing phase were higher than in the training phase. Comparing the testing accuracies, we found significant interactions among time window length and the type of classifier (p < 0.05). The study found significant effects on estimated accuracies, according to their type of algorithm, time window length, and their interaction. kNN presented the highest accuracy, while SVC showed the worst results. kNN feeding by features extracted from 1 and 5 s were the combination with more frequently highest accuracies. Classification using few features led to similar decision of the algorithms. Moreover, performance increased significantly according to the number of features used, reaching a plateau around 136. Finally, the results of this study suggested that kNN was the best algorithm to classify hand resting tremor in patients with PD.
Introduction
More than 6.1 million people worldwide are affected by Parkinson’s disease (PD) (Gbd 2016 Parkinson’s Disease Collaborators, 2018) – this number is expected to rise with the increasing of the population life expectancy (Wanneveich et al., 2018). PD has very heterogeneous clinical features, but tremor at rest, akinesia, and rigidity are considered the clinical cardinal motor signatures of this disease (Kalia and Lang, 2015; Poewe et al., 2017). It is hard to diagnose PD, both in its early stages and during its progression. Its diagnosis is usually carried out by clinical observation or by using scales such as the Unified Parkinson’s Disease Rating Scale (UPDRS) or the Hoehn and Yahr scale (H-Y) (Hoehn and Yahr, 1967; Rizek et al., 2016; Holden et al., 2018).
Literature has proposed alternative ways to quantify PD symptoms in order to assist its diagnosis and progression (Jilbab et al., 2017). Inertial measures of the hand resting tremor associated to machine learning algorithms have been extensively investigated to distinct data from healthy people and patients with PD (Jeon et al., 2017a, b), to quantify the progression of the disease (Pedrosa et al., 2018), and to evaluate the effect of therapeutics on hands’ tremor (LeMoyne et al., 2019).
Although many investigations have evaluated the machine learning classifier performance to precisely categorize the inertial measurements from patients with PD, there are few methodological studies concerning the influence of the technical parameters of this kind of approach. Parameters like the time interval of the inertial sensor readings, type of features extracted from the inertial sensor readings, the number of features used, the type of machine learning classifier, and the type of inertial sensor used have potential to increase or decrease the accuracy of the algorithm (Jeon et al., 2017a; Rovini et al., 2017; Ramdhani et al., 2018; Wang et al., 2018; Nurwulan and Jiang, 2020). Table 1 lists examples of studies that associated inertial measurements with machine learning approaches and their methodological choices. It displays a large variability of methodological settings and few explanations justifying such choices.
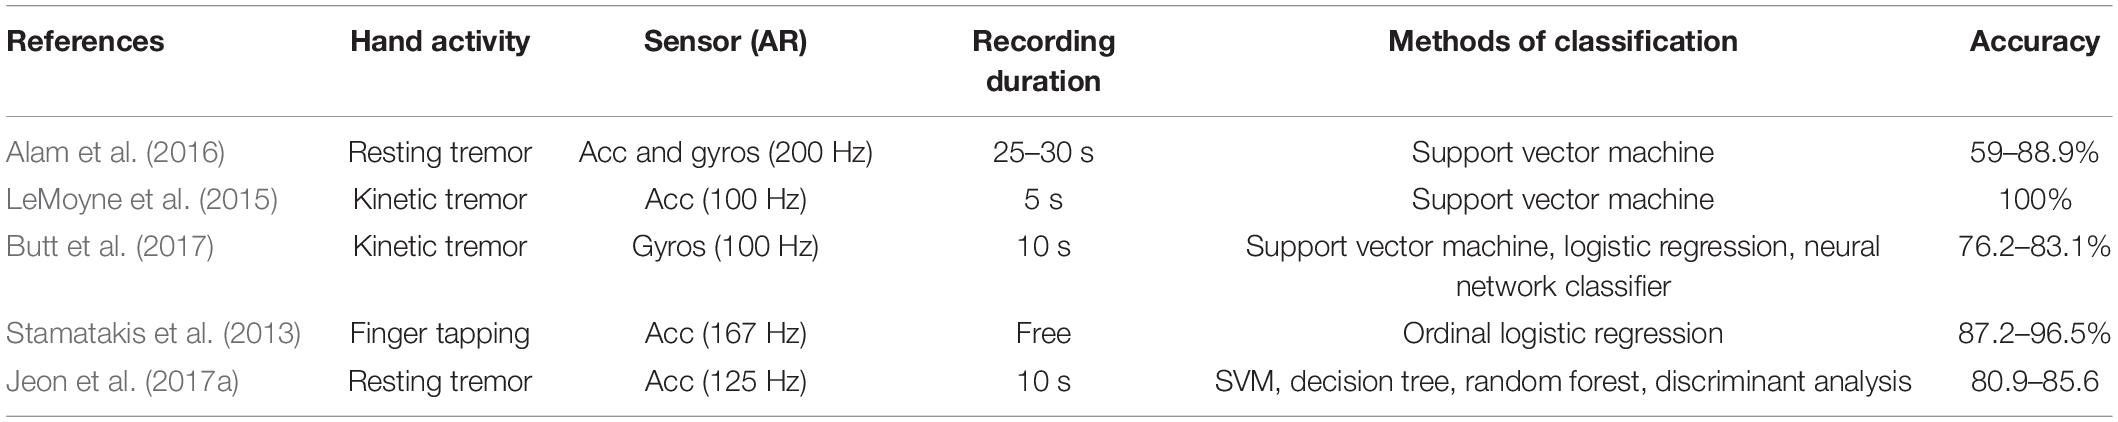
Table 1. References that used inertial sensors features to feed machine learning to evaluate the hand tremor of PD patients.
Several investigations have used a number of machine learning algorithms to classify and/or to quantify the resting hand tremor of patients with PD, obtaining high accuracy levels (Kostikis et al., 2015: 78–94%; Jeon et al., 2017a: 80–85%; Pedrosa et al., 2018: 92.8%). There is no consensus about what machine learning algorithms are preferable to classify features of inertial readings or what are the optimal conditions to use any of the algorithms.
Several studies have segmented inertial recordings in different window size durations to extract dozens or hundreds of features that fed a machine learning algorithm (Jeon et al., 2017a). Short-term inertial readings could be good to get a fast evaluation, but they lead to high false positive detection. On the other hand, long-term recordings may potentially prolong the recording process, adding redundant information (Nurwulan and Jiang, 2020). In the same way, using a few features may not be enough to bring clear information about the differences among patients with PD; and an excessive number of features may overload the computing process. It is important to select the best set of features in order to potentialize algorithm classification and to avoid collinearity among data.
The present study aimed to compare the performance of machine learning algorithms to classify recordings of inertial sensors as healthy people or patients with PD considering different numbers of features extracted from a variety of window length duration of inertial recordings. Those results may contribute in the decision making of the best parameter for the classification of inertial sensor measures analyzed by machine learning algorithms.
Materials and Methods
Ethical Considerations
All individual participants included in this study gave us their informed and written consent. Every procedure carried out in the present study was in accordance with the ethical standards of the Ethics Committee in Research with Humans from the University Hospital João de Barros Barreto (report #1.338.241) and with the 1964 Helsinki Declaration and its later amendments or comparable ethical standards.
Subjects
Our sample comprised of 50 right-handed participants grouped into healthy control participants (n = 32 individuals, 16 females and 16 males) and participants with PD (n = 18 individuals, 8 females and 10 males). Participants’ handedness was established according to the hand they use to handwrite. Healthy participants ranged from 41 to 79 years (mean ± standard deviation: 64.3 ± 11.1 years), while patients with PD ranged from 48 to 73 years (mean ± standard deviation: 60.2 ± 8.4 years). Control participants were recruited by convenience. They had no history of neurological or systemic diseases, no self-reported tremor of the hands nor difficulties in carrying out daily activities. All patients with PD were diagnosed by a neurologist in the Neurology Department of the University Hospital João de Barros Barreto, Brazil, according to the clinical diagnostic criteria of the United Kingdom Parkinson’s Disease Society Brain Bank (Hughes et al., 1992). For each patient, the severity of PD was scored by using the Hoehn and Yahr (H-Y) scale. All patients with PD had disease diagnosed within the less 6 years; except by one subject (H-Y 3), all other patients were staged as functionally independent (H-Y 1 or 2). All patients were using levodopa or dopamine agonist therapy for over a year.
Inertial Measurement Unit Recordings
We used a wearable device MetaMotionC (mbientlab, San Francisco, United States), with on-board sensors, such as a triple-axis gyroscope and an accelerometer (16 bits, ± 2000°/s, ± 16 g). Researchers positioned a wearable device over each patient’s third metacarpal bone at their midway between the carpal and the digital extremities of their metacarpal (Figure 1) – with their forearm supported on a table, and their hand relaxed over its edge. Researchers recorded the patients in resting state with the acquisition rate at 100 Hz and 16-bit analog to digital conversion resolution. An Android app (MetaBase, mbientlab, United States) controlled the sensors via Bluetooth. Bluetooth also transmitted their signals to an ordinary computer. The study delivered 2-min recordings. One trial was carried out for each one of the hands of all participants.
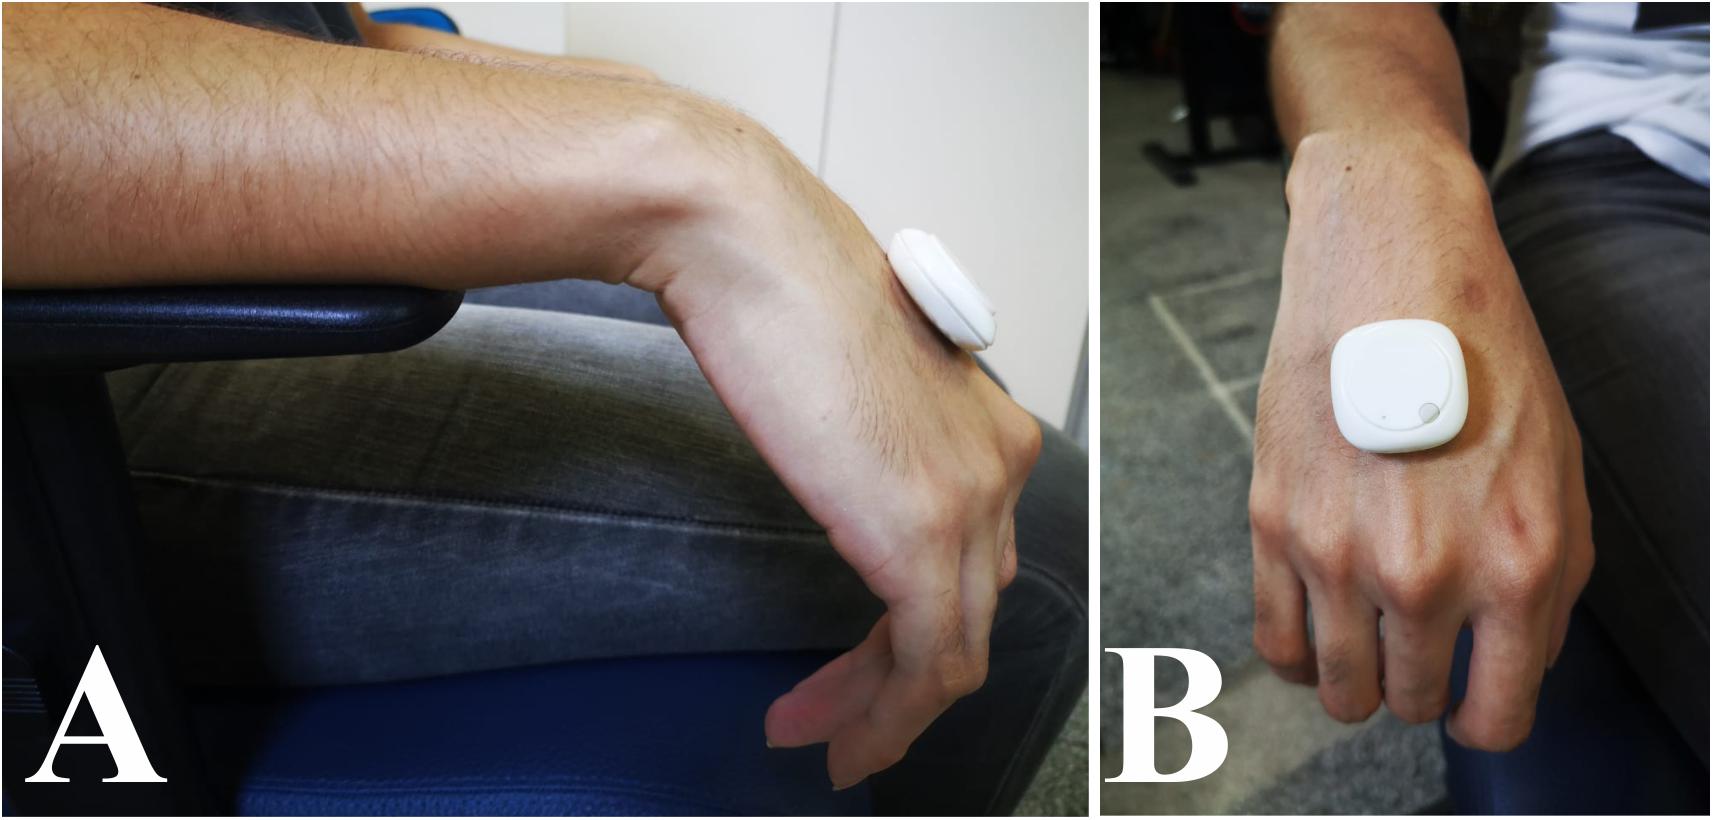
Figure 1. IMU Positioning in the hand of the participant. (A) Lateral view. (B) Frontal view. The patient was instructed to keep the hand in rest for 120 s, while the experimenter controlled the recording using a mobile app.
Data Analysis
To carry out data analysis, researchers programmed Python scripts (Python v3.7.4) by using SciPy (version 1.3.1), NumPy (version 1.17.2), PyWavelets (version 1.0.3), and LibROSA (version 0.7.2) tools. SciPy is a Python-based ecosystem of open-source software for mathematics, science, and engineering; NumPy is a library for the Python programming used to operate on arrays; LibROSA is a Python package that provides the building blocks necessary to create music information retrieval systems; and PyWavelets is an open source wavelet that transforms software for Python.
Our sequence of analysis consisted of: (1) inertial recordings; (2) raw data filtering; (3) segmentation of the time series in different sets of waveform lengths; (4) data normalization; (5) extraction of features; (6) selection of the best features; (7–8) performing machine learning algorithms with training and test phases; and (9) measuring machine learning performance. Figure 2 illustrates data analysis summary.
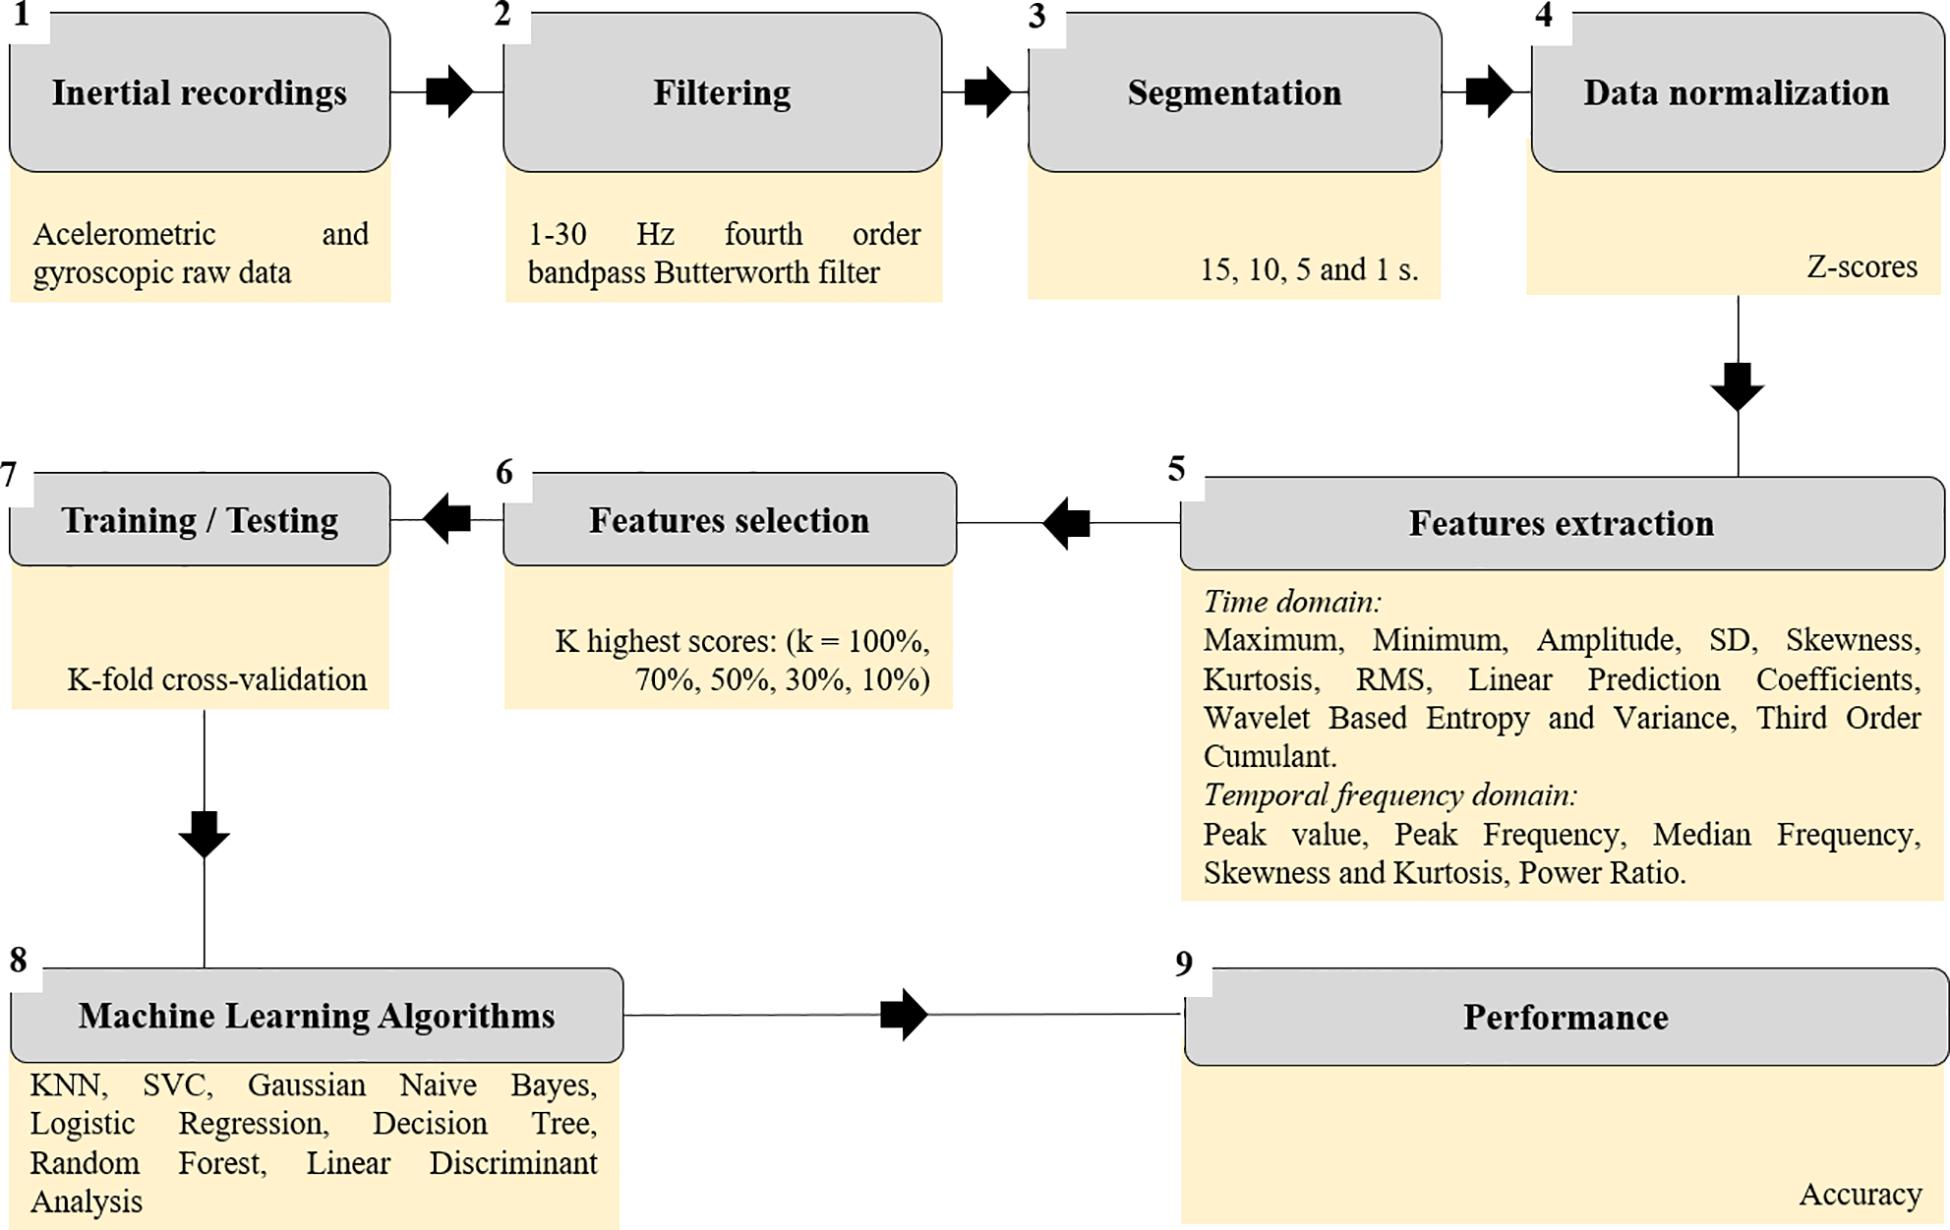
Figure 2. Flow chart of the data analysis steps.
Raw Data Filtering
We computed a magnitude vector from each sensor dimension (x, y, and z) using Eq. (1), which is less sensitive to orientation changes (Janidarmian et al., 2017). The recordings were filtered by a fourth-order bandpass digital Butterworth filter between 1 and 30 Hz to exclude low and high frequency artifacts.
where vis the magnitude vector, x,y, and z represented the 3-D readings of the inertial sensor.
After this, we applied the scipy.signal.detrend function using its linear list squared fit to detrend the inertial readings.
Segmentation of the Time Series
We segmented the inertial recordings in fixed sized windows, with no inter-window gaps and non-overlapping between adjacent windows. We also segmented these time series in sets of waveforms with 1, 5, 10, and 15 s window sizes.
Extraction of Features
We extracted features from time and temporal domains for each sensor dimension. Table 2 presents a list of features extracted from inertial data, as well as Python main codes related to them.
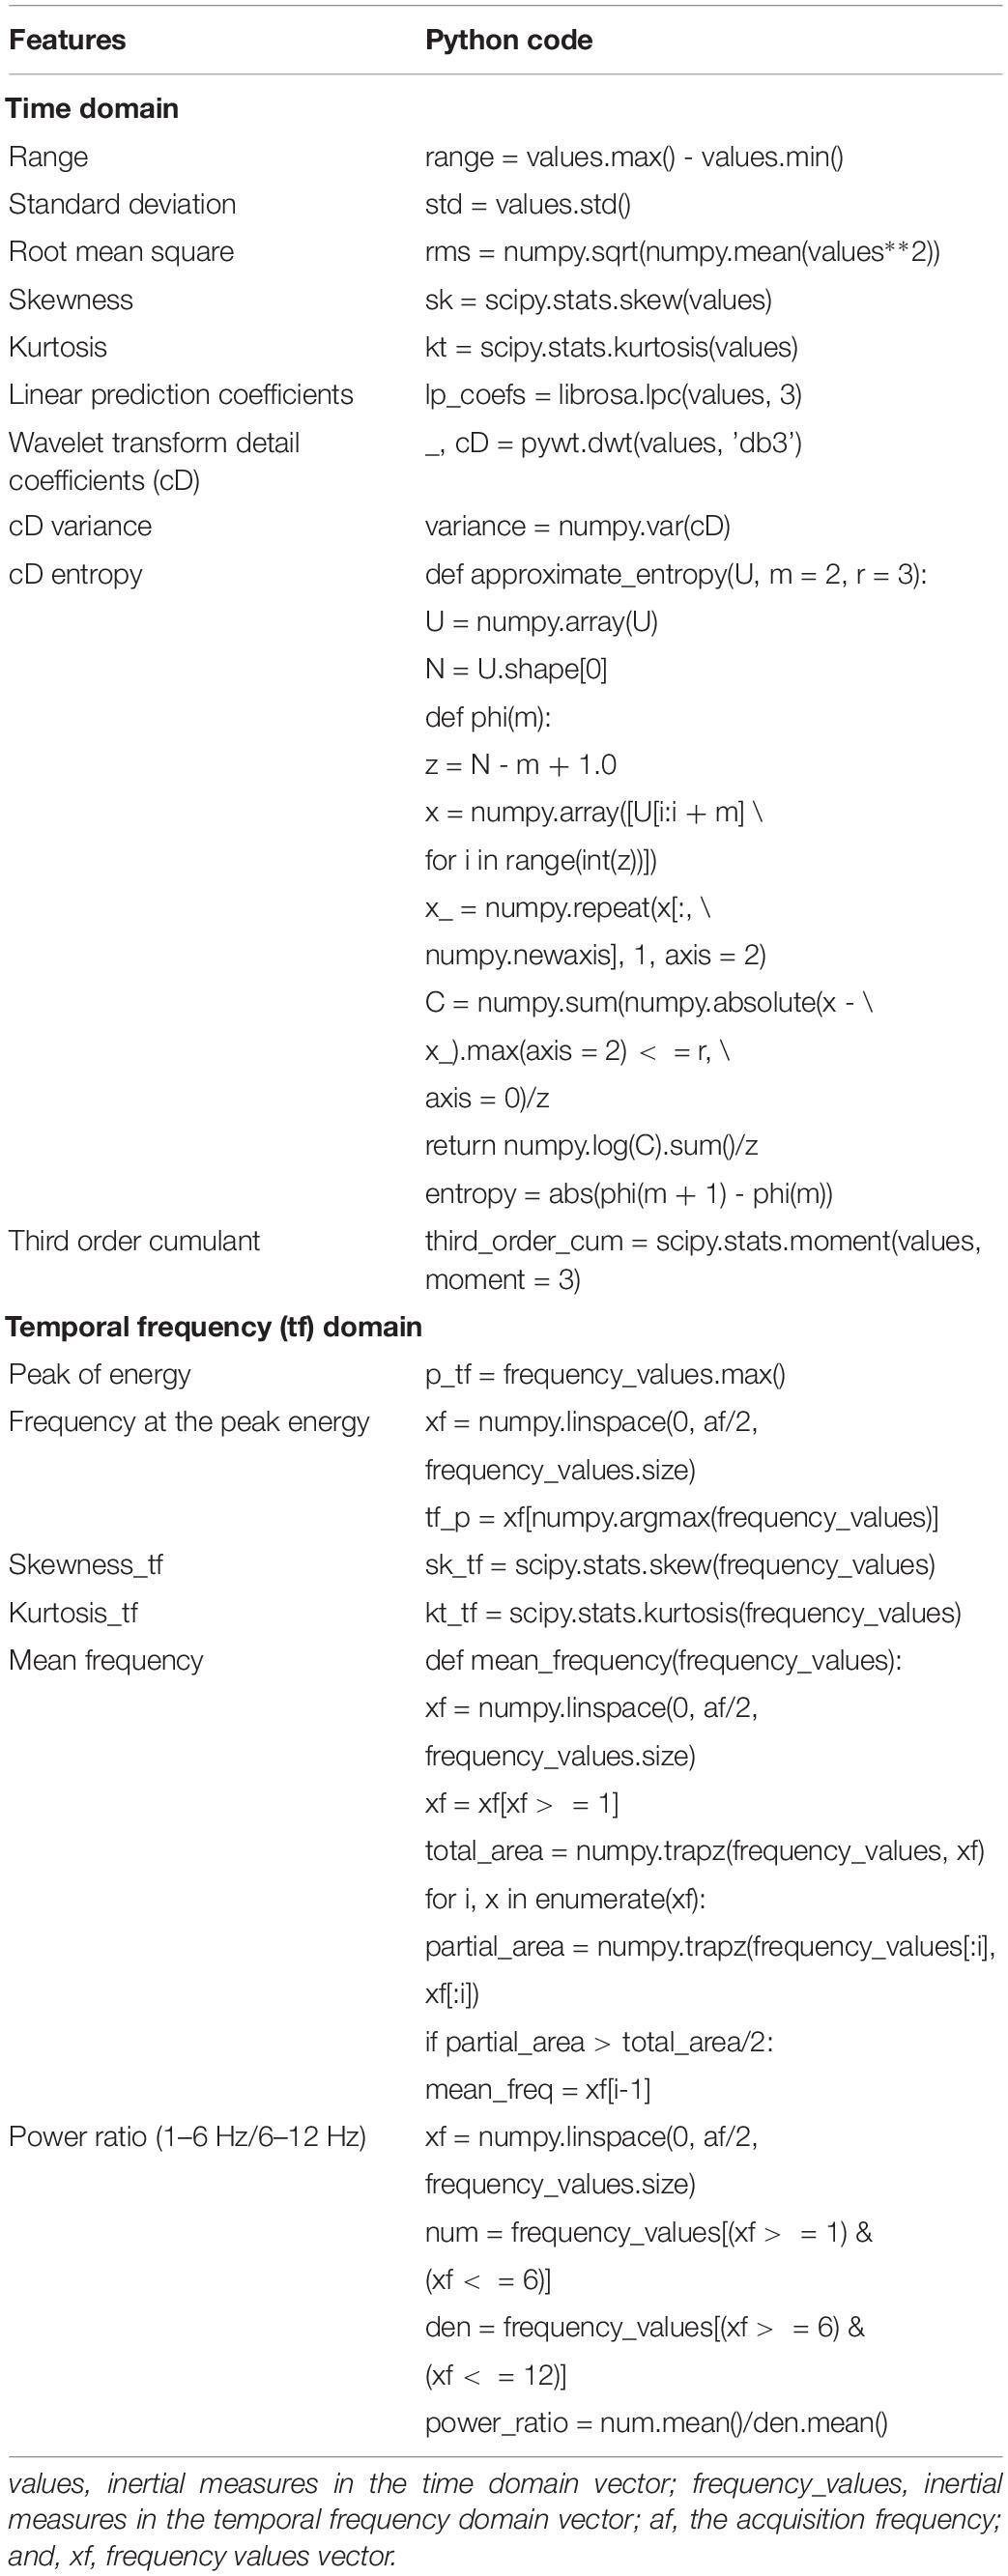
Table 2. Features extracted from the inertial readings.
The study extracted 272 features from each one of our participants, considering data extracted: (a) from each one of their hands (dominant and non-dominant); (b) from each inertial sensor parameter (accelerometer and gyroscope); and, (c) from the four dimensions of each sensor (x, y, z, and magnitude).
Data Normalization
The study applied sklearn.preprocessing package and its StandardScaler function to standardize features by removing their mean and scaling them to unit variance, as shown in Eq. (2).
Selection of Features
The study used algorithm SelectKBest to select the k most important features based in a score which was the ANOVA F-value. The chosen selection of the most important features to feed the machine learning algorithms in this study where: 272 features (100%), 190 features (70%), 136 features (50%), 82 features (30%), and 27 features (10%).
Splitting Data
To validate the predictive models, we applied the tenfold cross-validation method by using the Scikit-learn library (version 0.21.3) and ShuffleSplit function. The study randomly split data into 80% for model training and 20% for model testing.
Machine Learning Algorithms
We applied seven types of machine learning algorithms to classify the data from both healthy and PD groups. The algorithms were: k-nearest-neighbor (kNN); support vector classifier (SVC); logistic regression (LR); linear discriminant analysis (LDA); random forest (RF); decision tree (DT); and Gaussian Naïve Bayes (GNB).
The next sentences describe the Python functions used to proceed the machine learning algorithms, as well as the parameters that differed from default values. These parameters were changed to protect the model from overfitting.
(a) k-Nearest-Neighbor (kNN): the function sklearn.neighbors.KNeighborsClassifier was applied to proceed an kNN algorithm considering the Minkowski distance metrics, k-value ranging from 5 to 10. We applied a grid search using the GridSearchCV function to find which k-nearest-neighbor would deliver the best accuracy, then chosen as the best k-value.
(b) Support Vector Classifier (SVC): were applied an SVC algorithm (sklearn.svm.SVC function) with radial basis function kernel with gamma parameter equal to 1 and the C penalty parameter equal to 10.
(c) Logistic Regression (LR): a binary logistic regression algorithm sklearn.linear_model.LogisticRegression function was used considering the parameter penalty equal to “l1,” and solver equal to “liblinear.”
(d) Linear Discriminant Analysis (LDA): the study applied the function sklearn.discriminant_analysis.LinearDiscriminantAnalysis to proceed the LDA algorithm considering the parameter solver equal to “svd,” and store_covariance as true.
(e) Random Forest (RF): we used the function sklearn.ensemble.RandomForestClassifier to implement random forest algorithm considering the parameter “criterion” the value “gini impurity” as a measure of the split quality, the parameters n_estimators equal to 50, and max_depth equal to 6.
(f) Decision Tree (DT): similarly to the random forest classifiers, the tree algorithm was proceed using the sklearn.tree.DecisionTreeClassifier function considering “gini impurity” to the parameter “criterion,” and the parameters n_estimators were set to 50, and max_depth equal to 6.
(g) Gaussian Naïve Bayes (GNB): the function to proceed a Gaussian Naïve Bayes algorithm was the sklearn.naive_bayes.GaussianNB.
Measuring Machine Learning Performances
Equation (3) calculated accuracy in order to measure the success levels of the classifiers, as follows:
where TP is the true positive value; TN is the true negative value; FP is the false positive value; and, FN is the false negative value.
Statistics
The study applied the unpaired t-test with Welch’s correction to compare the accuracies obtained from training and testing phases for each classifier using features extracted from different time window lengths. For each percentage of features feeding the algorithms, we conducted a two-way ANOVA on the influence of the classifier type and the time window length of the accuracy of such classifier. The classifier type includes seven levels (SVC, GNB, RF, kNN, LR, LDA, and DT) and the time window length consisted of five levels (1, 5, 10, and 15 s). As the two-way ANOVA test was significant, we computed the Tukey HSD for performing multiple pairwise-comparison between mean accuracies of both groups. We counted the number of times in which an algorithm presented a better performance when compared to the others (here named victory), by means of significant multiple comparisons at the different time window lengths and number of features. Thus, we used the chi-square goodness of fit (equal proportions) to compare the observed distribution of significant comparisons to the expected distribution considering the number of algorithms or of time window length. All the statistical tests were carried out by using R software (version 3.6) and considering the level of significance of 5%.
Results
Selection of Recordings and Features
Figure 3 shows examples of the accelerometric and gyroscopic recordings for the 5-s time windows as a function of time and temporal frequency from representative subjects from both groups. The results for the 5 s time windows were qualitatively similar to the other time windows the study investigated. We characterized the inertial recordings by oscillatory waveforms that, especially in participants with PD, defined their peak in frequencies ranging between 3 and 8 Hz.
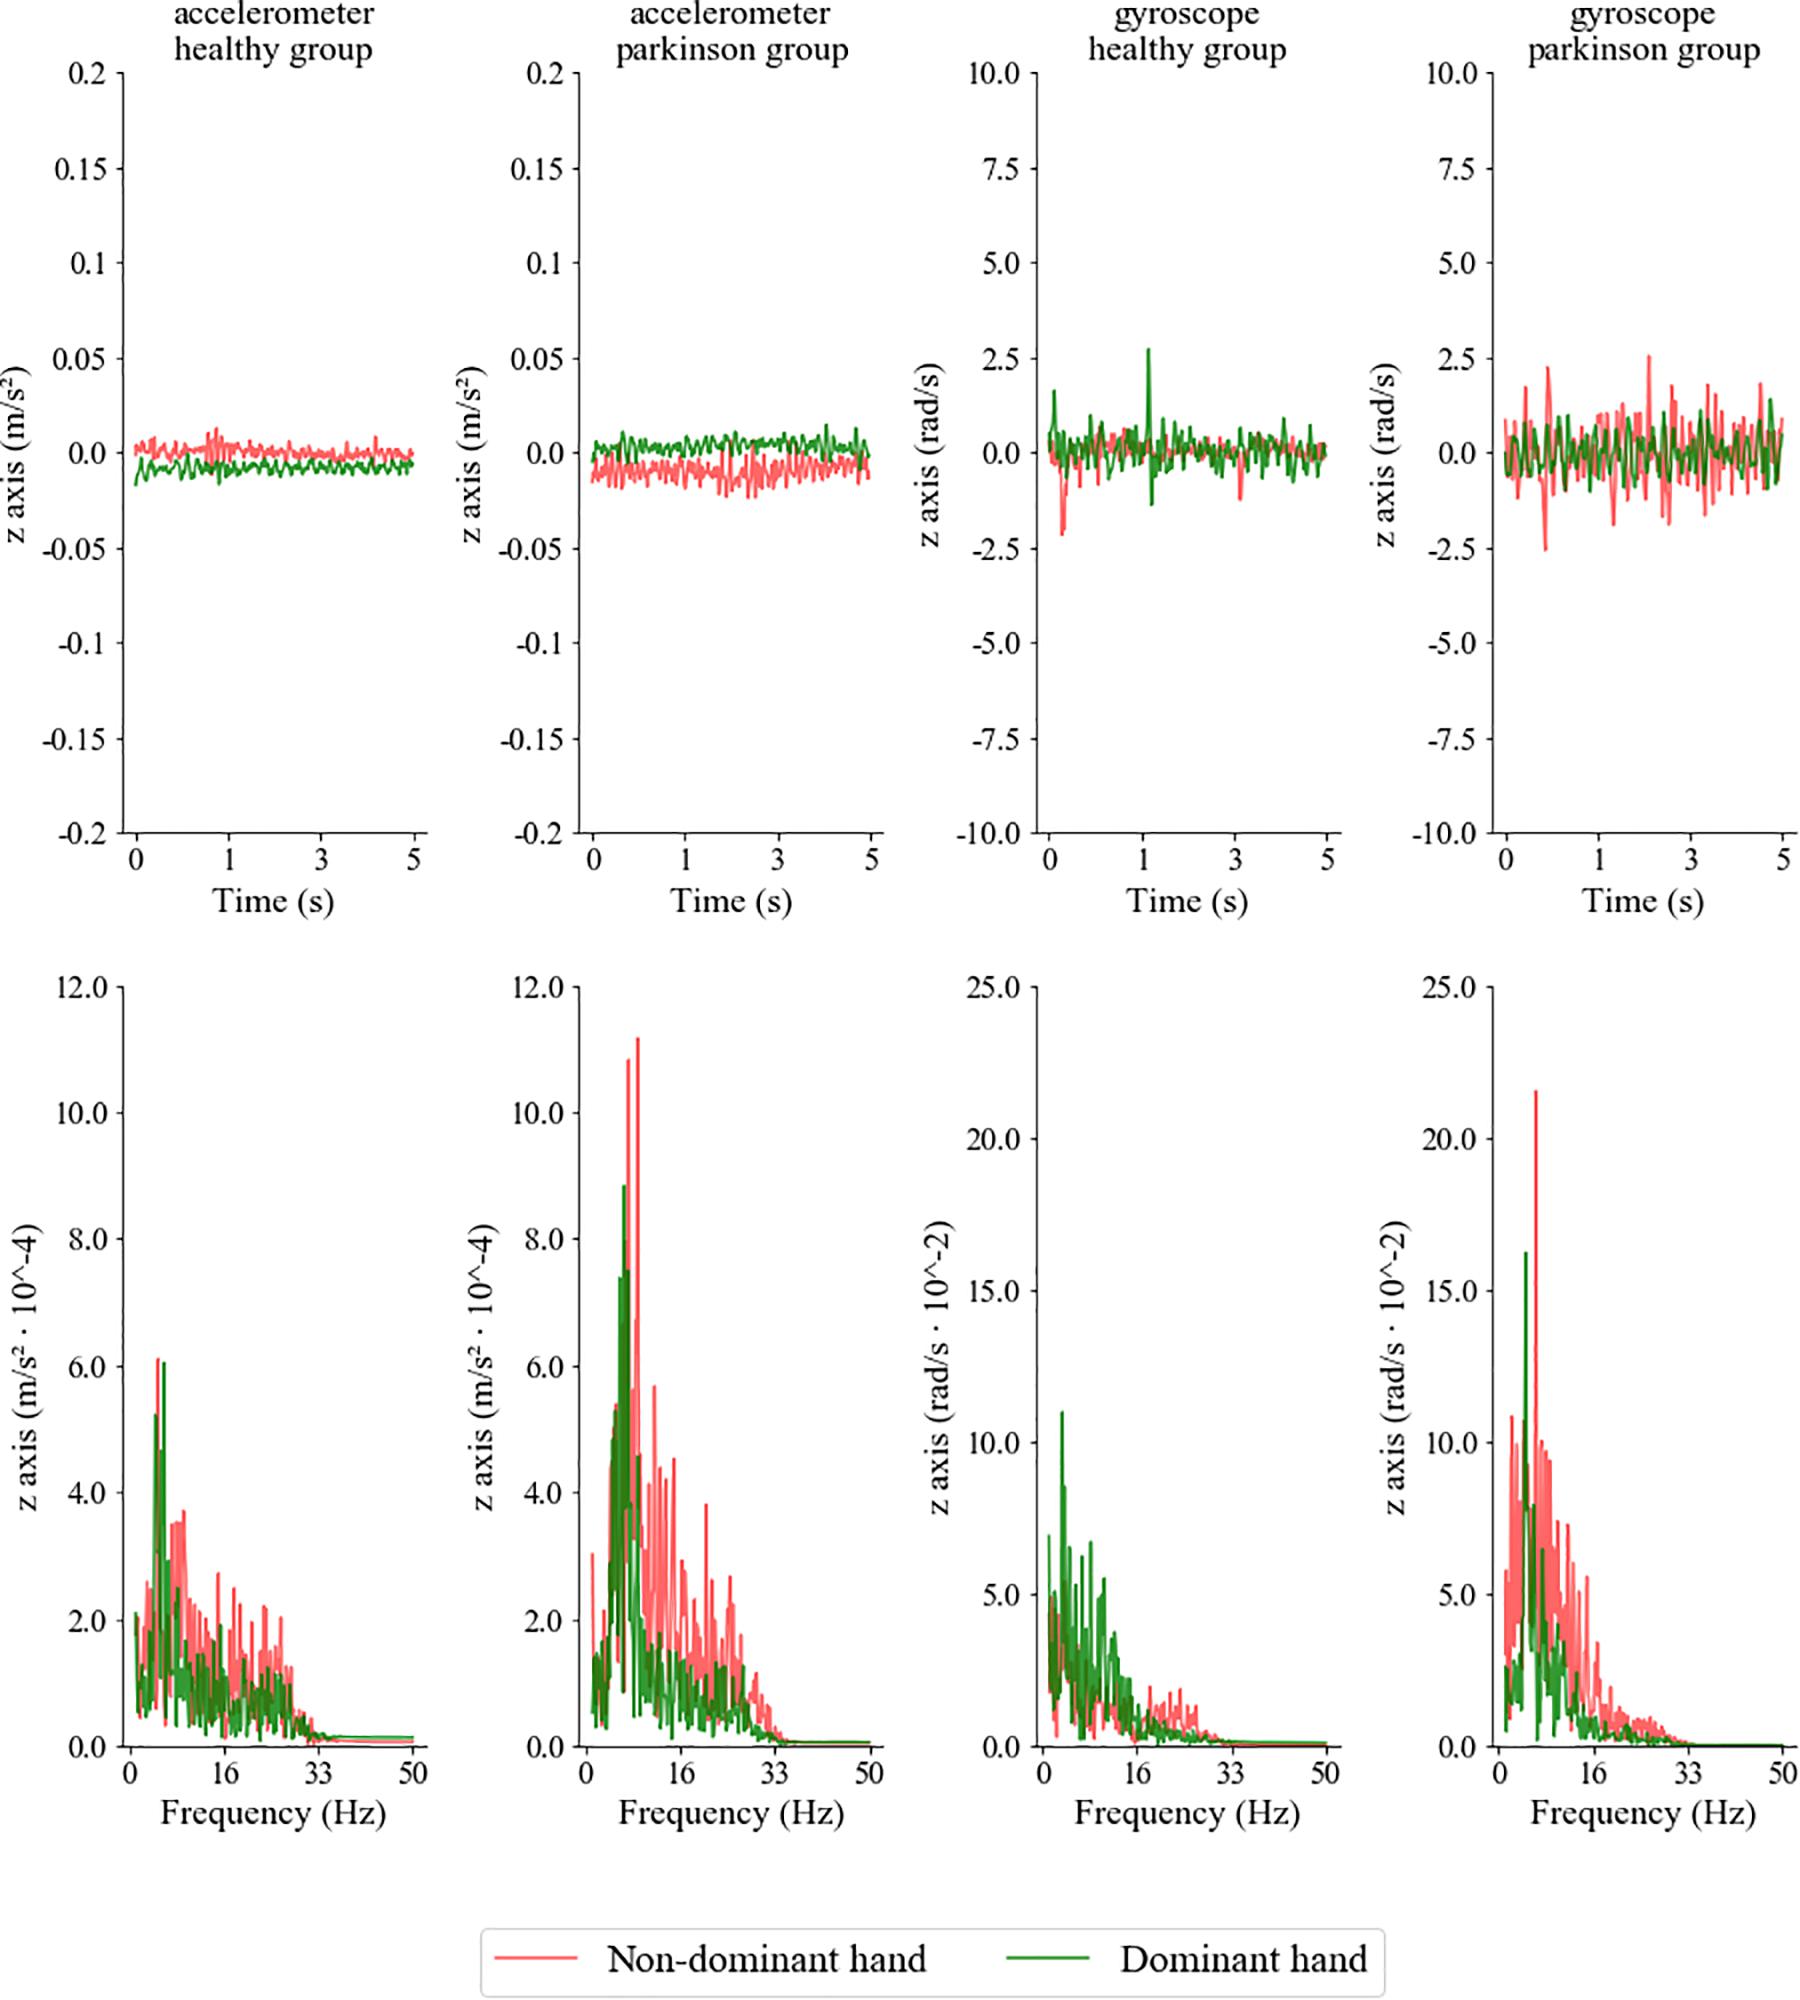
Figure 3. Accelerometric and gyroscopic recordings as a function of the time (upper rows) and temporal frequency (lower row) from representative participants of the control and PD groups, using the time window of 5 s. Recordings were carried out on the non-dominant and dominant hands (red and green lines, respectively).
Regardless time window length, the most important features detected were mean frequency, linear prediction coefficients, power ratio, and the power density skew and kurtosis. Figure 4 shows the 15 most important features selected from extracted data concerning time windows of 15 s (Figure 4A), 10 s (Figure 4B), 5 s (Figure 4C), and 1 s (Figure 4D).
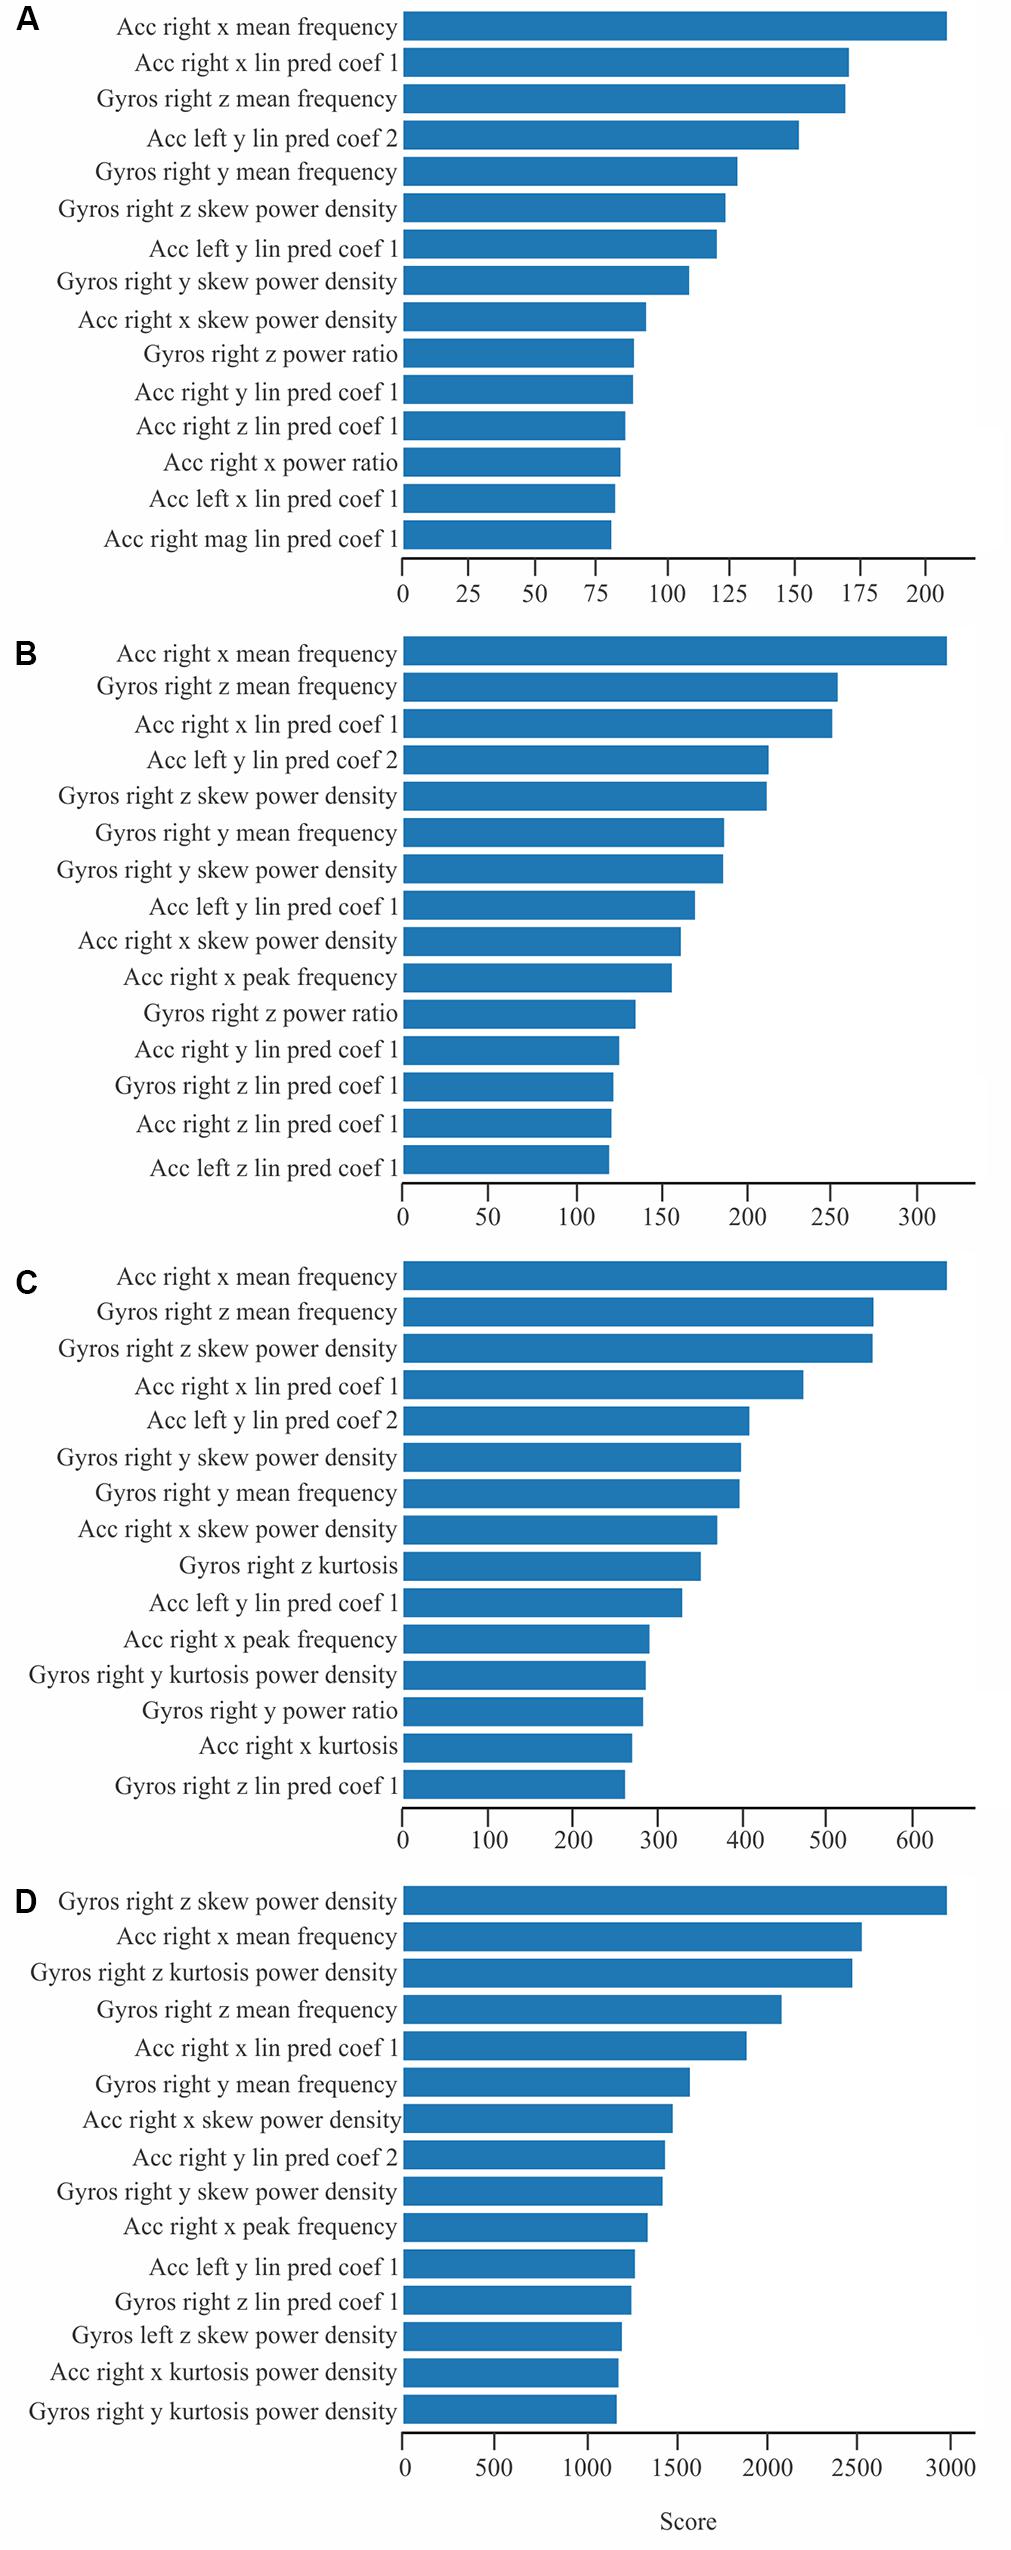
Figure 4. Most important features extracted from recordings lasting 1 s (A), 5 s (B), 10 s (C), and 15 s (D).
Machine Learning Classifiers
Comparison Between Training and Testing Accuracies
Most of the comparisons had significant differences between training and testing phases. Whenever statistical significance (p < 0.05) was reached, testing accuracy was higher than training accuracy – except in two comparisons (random forest and kNN algorithms) – when using 30% of the features in the 1 s time window. Supplementary Files 1–5 present tables with the training and testing phases of the machine learning.
The comparisons with no statistical significance were in time windows of:
(i) 1 s: random forest algorithm using all features and 70% of them, GNB using 50 and 10%;
(ii) 5 s: GNB with all features, 70 and 50% of them, kNN and LR using 30% of the features;
(iii) 10 s: GNB using 30 and 10% of the features;
(iv) 15 s: GNB using all features, 70, 50, and 10% of them, SVC using all features, 70 and 50% of them, LDA using all features and 70% of them, LR using 50% of the features, and RF using 30% of the features.
Figure 5 illustrates the comparisons between the accuracies obtained by the different classifiers using extracted features in different time windows considering 70, 50, 30, and 10% of the features, respectively.
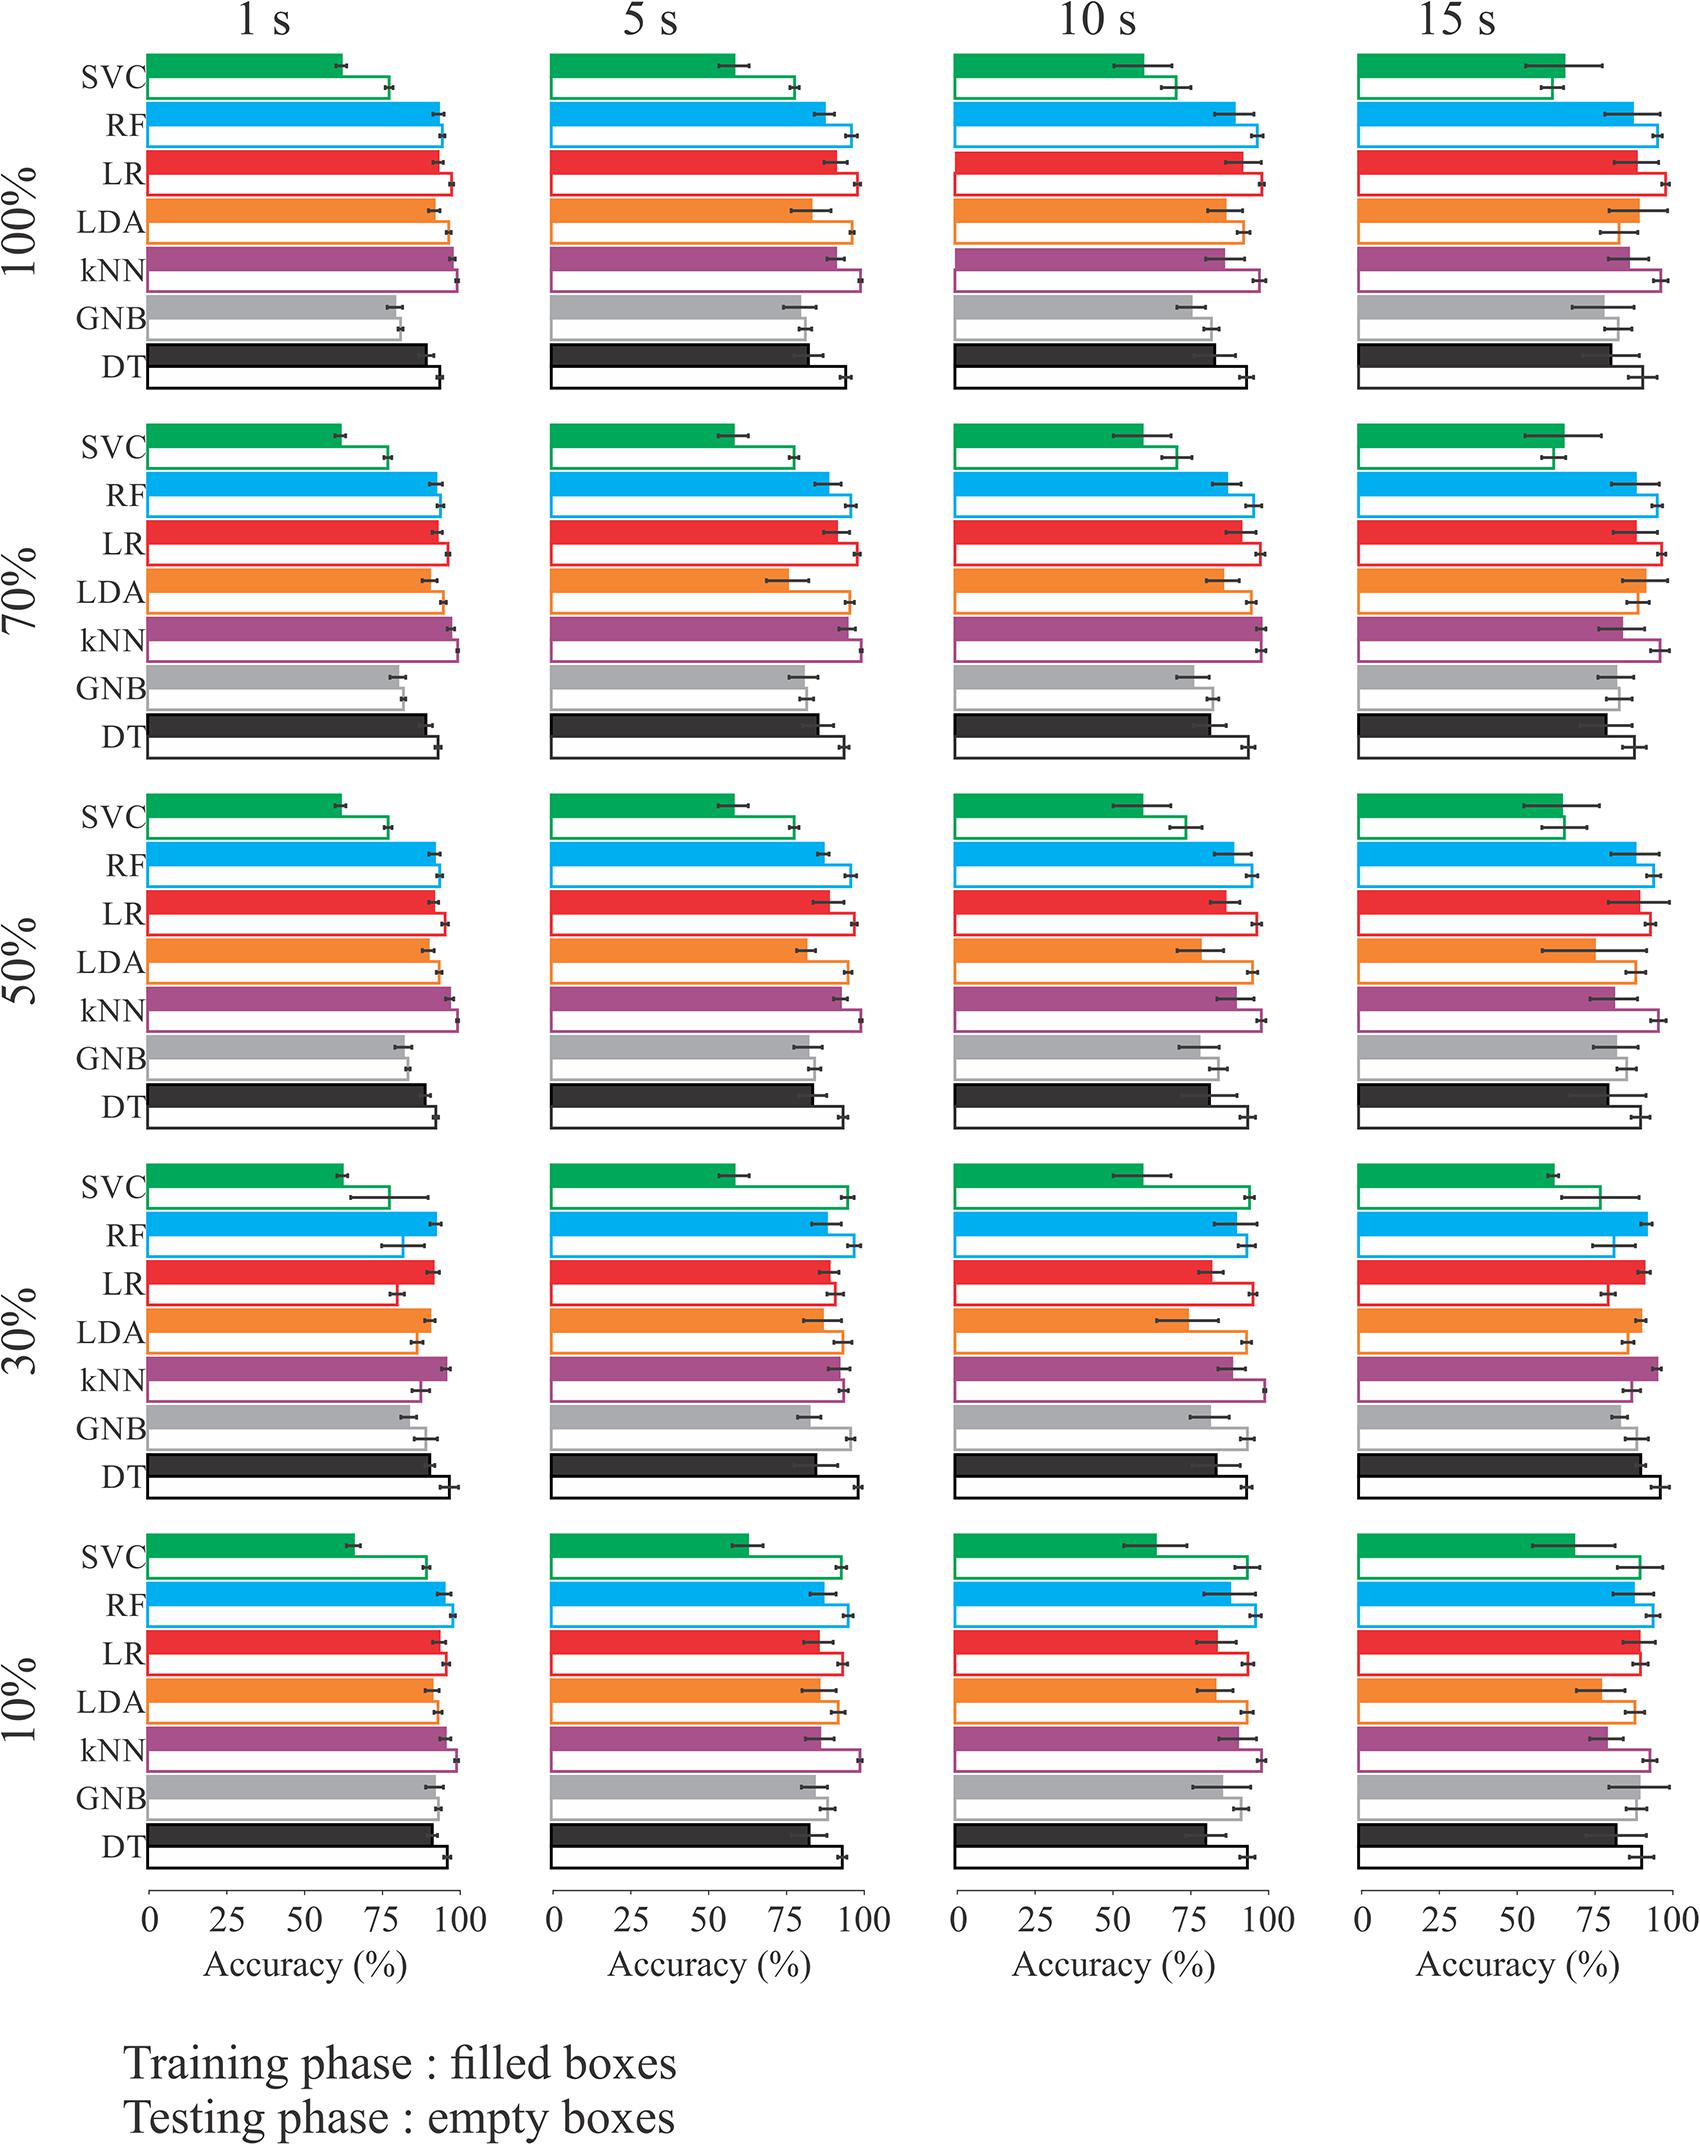
Figure 5. Comparison of the classifiers’ performance in the training (solid bars) and testing (empty bars) phase according the number of features and time window length.
Comparing Test Accuracies Obtained From the Different Supervised Machine Learning Algorithms
In general, the effects of the machine learning phases on the accuracies were statistically significant. The main effect for classifier type yielded an F ratio of F(6, 252) = 639.14, p < 0.0001 for all the features; F(6, 252) = 727.74, p < 0.0001 for 70% of the features; F(6, 252) = 478.15, p < 0.0001 for 50% of the features; F(6, 252) = 171.41, p < 0.0001 for 30% of the features; and F(6, 252) = 36.8, p < 0.0001 for 10% of the features. The proportion of victories in the multiple comparisons significantly differed by algorithm for all numbers of features conditions. kNN was the algorithm that more frequently delivered high accuracy when compared to the others algorithms. SVC delivered the lowest frequency of victories among all tested algorithms. Table 3 shows the number of “victories” of each algorithm in the significant multiple comparisons for each number of feature condition.
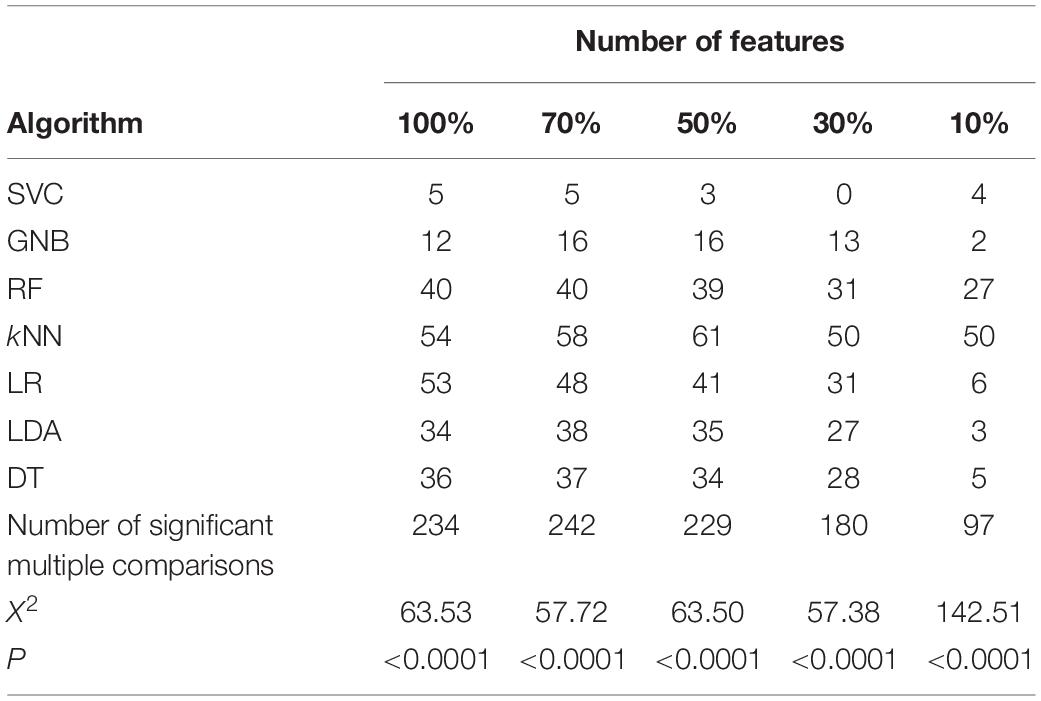
Table 3. Number of victories of each classifier in the significant multiple comparisons for each number of feature condition.
The main effect for time window length yielded an F ratio of F(3, 252) = 51.7, p < 0.0001 for all the features; F(3, 252) = 47.4, p < 0.0001 for 70% of the features; F(3, 252) = 25.5, p < 0.0001 for 50% of the features; F(3, 252) = 5.5, p < 0.0001 for 30% of the features; and F(3, 252) = 14.8, p < 0.0001 for 10% of the features. The proportion of victories in the multiple comparisons was similar by time window length for all numbers of feature conditions, except for 10% of the features. Table 4 displays the number of “victories” from time window length in the significant multiple comparisons for each number of feature condition.
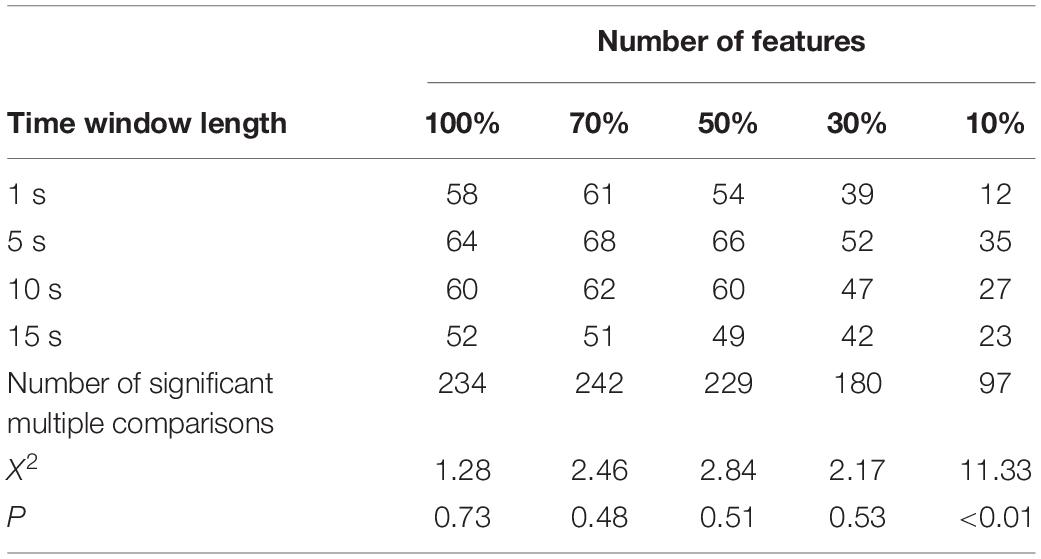
Table 4. Number of victories per time window length in the significant multiple comparisons for each number of feature condition.
The interaction effect was significant for all numbers of features conditions (for all the features: F(18, 252) = 19.04, p < 0.001; for 70% of the features: F(18, 252) = 15.23, p < 0.001; For 50% of the features: F(18, 252) = 7.61, p < 0.001; and for 10% of the features: F(18, 252) = 2.959, p < 0.001), except for 30% of the features condition that yielded in a F ratio of F(18, 252) = 2.959, and p = 0.29.
Figures 6A–E shows tile plots representing the statistical significance of the post hoc multiple comparisons between the testing accuracies from any two classifiers. White tiles represent comparisons with significant differences, while dark tiles represent non-significant differences. The red line indicates the orientation of the significant difference. Horizontal lines represent higher accuracies for the classifiers in the row when compared to the classifiers in the column, while vertical lines represent the opposite situation. We observed that the number of significant differences between two classifiers (number of white tiles) was dependent of the number of features. For a low number of features (10% of the features we extracted, 27 features) the number of significant differences between two classifiers was also low and increased linearly up to reach a plateau level of 70% of the features (136 features). The combinations between classifier and time window length with highest accuracies were kNN and time windows of 1 and 5s.
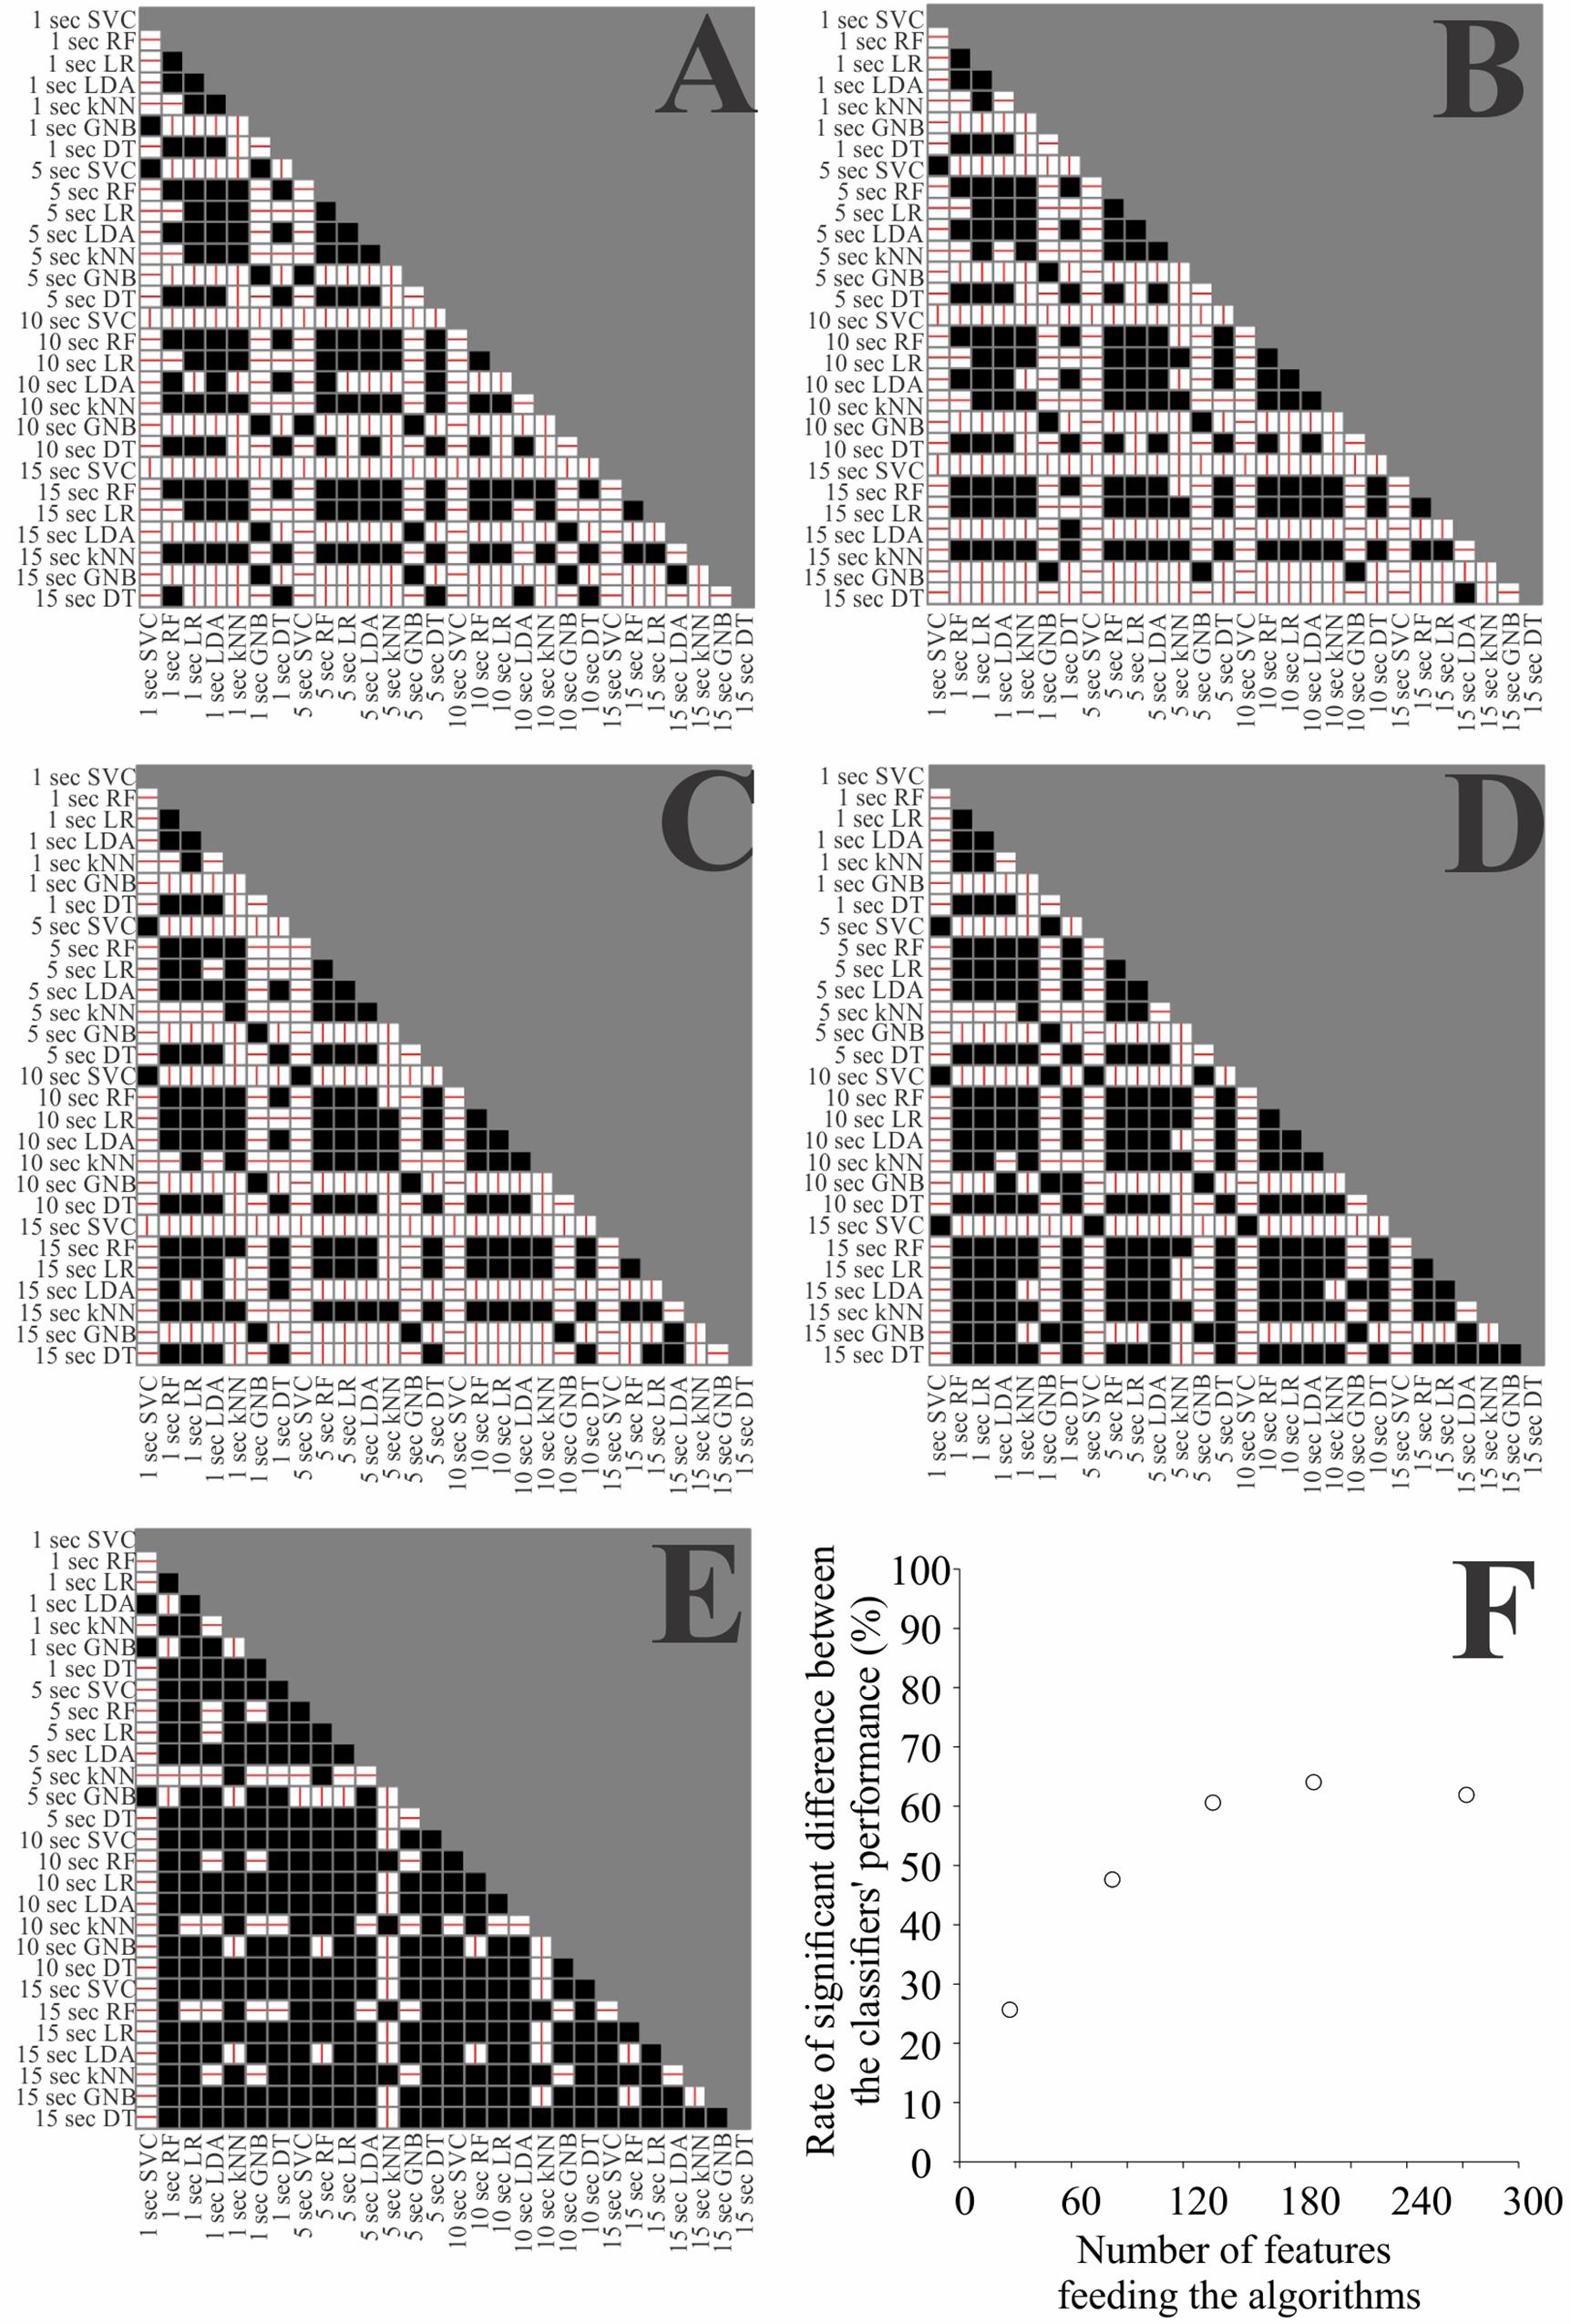
Figure 6. Comparison of the classifier’s performance in the testing phase when using all the features (A), 70% (B), 50% (C), 30% (D), and 10% (E) of the features. White squares represent the significant difference between the classifiers on the respective row and column, while black squares represent non-significance for the comparison. The line in the white squares represent the direction of the difference, horizontal lines indicates that the classifier on the row had higher accuracy than the classifier on the column, and vertical lines represent the opposite. (F) Number of significant differences between two classifiers as a function of number of features.
Discussion
This paper assessed the hand tremor in individuals with PD and healthy controls by using machine learning algorithms based on inertial sensor recordings. Our objectives were: (i) identifying the best machine learning algorithms to classify hand tremor by using inertial data; (ii) describing the best recording duration to be used by classification methods; (iii) stablishing the number of features necessary to the best performance of the algorithms.
Concerning these objectives, the results of this study showed that the kNN algorithm as the best classifier, followed by LR, and RF algorithms respectively. On the other hand, research pointed out that SVC and GNB delivered the worst performances among all classifiers. Also, some classifiers had better performances with short time windows, while others needed long recordings to deliver more accurate performances. Our results also showed that the performance of the classifiers became more similar when using less features; and, with more features, differences between classifiers increased linearly until a maximum value (using around 136 features), reaching a plateau. Regardless the most important feature selected, the time window length was similar across tested conditions. Whereas, the more common features selected were mean frequency for both accelerometer and gyroscope sensors; linear prediction coefficients for the accelerometer; skewness, power ratio, and the power density skewness and kurtosis for the gyroscope.
Many types of machine learning classifiers have been used to analyze PD tremor (Bind et al., 2015). We used 7 out of the most common algorithms used in the field. kNN was the best classifier across multiple comparisons, together with LR and RF algorithms, which had accuracy level above 90%.
The kNN algorithm groups similar classes of data based in the value of k nearest neighbors. Low values of k increase the accuracy of the classifier in the training phase, but difficult the generalization of the model for a new data (Li and Zhang, 2011). The k was used between 5 and 10 to facilitate the generalization of the model during test phase. Previous investigations – such as Jeon et al. (2017b) – have also found high accuracies using kNN algorithms. They assessed 85 PD patients to predict UPDRS results by using a wrist-watch-type wearable device for measuring tremors and found an accuracy level close to 84% for kNN and RF algorithms. Also, kNN algorithm delivered performance improvement as we decreased the number of features, while other algorithms delivered impaired outcomes.
Random Forest is a combination of multiple tree predictors that make decisions based in random vectors of features. The RF decision is the more common decision of the collection of tree classifiers (Breiman, 2001). Previous studies have demonstrated the ability of RF models to detect freezing in the gait of patients with PD or the switching on and off state of deep brain stimulation in these patients (Tripoliti et al., 2013; Kuhner et al., 2017).
Logistic Regression is a classification algorithm that uses a logistic sigmoid function to transform observations in two or more classes. LeMoyne et al. (2019) used LR algorithms to distinguish inertial readings associated with on and off modes from deep brain stimulation in PD patients, getting an accuracy level of 95%.
Both GNB and SVC with the worst outcomes. When compared with other algorithms, the GNB classifier delivered lower (Susi et al., 2011) and higher (Bazgir et al., 2018) accuracies to detect human motion. GNB is an algorithm that evaluates the probability of events within different classes (Theodoridis et al., 2010; Bazgir et al., 2018). SVC aims to find an optimal separation hyperplane in order to minimize misclassifications (Vapnik, 1979). SVC has been widely used to detect tremor in PD patients. The accuracy level of its classifiers has ranged between 80 and 90% to quantify PD tremor (Alam et al., 2016; Jeon et al., 2017b). We used a radial compared to the best SVC used by Jeon et al. (2017b) finding similar results.
It is important to highlight that directly comparing the performance of the classifiers in different studies must be careful. Each study implements different parameters in the algorithms, which are not always fully described. Furthermore, the number and type of features may influence the classifier accuracies. The present study observed that few features make classifiers’ decisions more similar, while an increased number of features enable the classifiers’ performance to be distinguished, reaching a plateau around 176 features. One must find a trade-off between the number of features and the cost of computational processing for each algorithm especially when trying to implement such method with wearable or mobile devices.
The use of machine learning algorithms to recognize patterns of human motion requires the segmentation of motion recording time series. Previous studies have segmented time series in different lengths for pattern recognition tasks (Bussmann et al., 2001; Dehghani et al., 2019). Although, short lengths accelerate the duration of the recordings, their random nature can present negative influence on the classifiers’ performance (Mannini et al., 2013). Short duration recordings in the scale of 100 ms have been successfully used to recognize human motion. At the same time, long-term recordings also returned high accuracy when detecting PD tremor as we can observe in Table 1.
This study evaluated the accuracy of classifiers by using different time window lengths. We observed that recordings lasting 5s or 1s delivered the highest accuracy levels. The study also noticed some interaction between the window time length and classifiers, indicating that some classifiers were better to analyze short recordings (i.e., kNN algorithm), while others showed higher accuracies when using long recordings (i.e., GNB). There is no rule concerning the length of inertial readings for the predictive modeling problem. Banos et al. (2014) investigated the effects of the windowing procedures on the activity recognition process using inertial data. They observed that intervals between 1 and 2 s offered the best trade-off between recognition speed and accuracy.
The more common features extracted from inertial readings express amplitude of oscillatory series, their spectral content, regularity, and coherence (Meigal et al., 2012; Twomey et al., 2018). The present study observed that mean frequency for both accelerometer and gyroscope sensors, linear prediction coefficients for the accelerometer, and skew power ratio, and the power density skew and kurtosis for the gyroscope frequently figure among the fifteen top features. Frequency domain features have been successfully employed in the machine learning algorithms by other researchers (Bazgir et al., 2018; Pedrosa et al., 2018).
We based our approach exclusively on accelerometer and gyroscope sensors, though other sensors are reported in the literature to quantify PD hand tremor using machine learning algorithms. For example, Lonini et al. (2018) used the MC10 BioStampRC sensor, a sensor tape that records electromyographic signals to accelerometers and gyroscopes in 6 body positions. Even considering that additional sensors can contribute to increase the accuracy of a classifier, there is a high cost in its implementation that can reduce the applicability of the proposal. Inertial sensors are inexpensive instruments that are available in a wide variety of wearable equipment.
This study has some potential limitations that deserve further comments. To date, research on this topic has been exploratory. There are no guidelines regarding the use of machine learning approach to quantify hand tremor in PD patients, as well as no established parameters for the choice of inertial sensors. A larger sample size and longitudinal follow-up could reinforce the present interpretations.
Conclusion
The present study suggested kNN using hundreds of features extracted from short-term inertial recordings as the best settings for machine learning configuration to classify hand tremor in PD patients. Our results can be used to assist the diagnosis and follow up of PD patients. We consider that our results are robust, because (i) of the high accuracy level obtained with the classifiers, (ii) the study could separate patients in the early stage of the PD (low H-Y score) from healthy people.
Data Availability Statement
All datasets generated for this study are included in the article/Supplementary Material.
Ethics Statement
The studies involving human participants were reviewed and approved by the Ethics Committee in Research with Humans from the University Hospital João de Barros Barreto. The patients/participants provided their written informed consent to participate in this study.
Author Contributions
GS, AK, GP, and AAC conceived of the presented idea. ES and GP performed the computations. AA, KS, VF, FS, and RL collected the inertial recordings. LK and BS-L collected the clinical data. AA, ES, GS, AAC, and BC verified the analytical methods. ASC and AB contributed to the interpretation of the results. GS and AAC drafted the manuscript. All authors discussed the results and contributed to the final manuscript.
Funding
This research received funding from the Amazon Paraense Foundation of Studies (FAPESPA, No. 2019/589349) and the Research Funding and the National Council of Research Development (CNPq/Brazil, No. 431748/2016-0). GS was CNPq Productivity Fellow (No. 310845/2018-1).
Conflict of Interest
The authors declare that the research was conducted in the absence of any commercial or financial relationships that could be construed as a potential conflict of interest.
Supplementary Material
The Supplementary Material for this article can be found online at: https://www.frontiersin.org/articles/10.3389/fbioe.2020.00778/full#supplementary-material
References
Alam, M. N., Johnson, B., Gendreau, J., Tavakolian, K., Combs, C., and Fazel-Rezai, R. (2016). “Tremor quantification of Parkinson’s disease - a pilot study,” in proceedings of the 2016 IEEE International Conference on Electro Information Technology (EIT). (Piscataway, NJ: IEEE) doi: 10.1109/eit.2016.7535334
Banos, O., Galvez, J. M., Damas, M., Pomares, H., and Rojas, I. (2014). Window size impact in human activity recognition. Sensors (Basel) 14, 6474–6499. doi: 10.3390/s140406474
Bazgir, O., Habibi, S., Palma, L., Pierleoni, P., and Nafees, S. (2018). A classification system for assessment and home monitoring of tremor in patients with Parkinson’s Disease. J. Med. Sci. Sensors 8, 65–72.
Bind, S., Tiwari, A. K., and Sahani, A. K. (2015). A survey of machine learning based approaches for Parkinson disease prediction. Int. J. Comp. Sci. Info. Techn. 6, 1648–1655.
Bussmann, J. B., Martens, W. L., Tulen, J. H., Schasfoort, F. C., van den Berg-Emons, H. J., and Stam, H. J. (2001). Measuring daily behavior using ambulatory accelerometry: the activity monitor. Behav. Res. Methods Instrum. Comput. 33, 349–356. doi: 10.3758/bf03195388
Butt, A. H., Rovini, E., Esposito, D., Rossi, G., Maremmani, C., and Cavallo, F. (2017). Biomechanical parameter assessment for classification of Parkinson’s disease on clinical scale. Int. J. Dist. Sensor Netw. 13, 1–15. doi: 10.1177/1550147717707417
Dehghani, A., Sarbishei, O., Glatard, T., and Shihab, E. (2019). A quantitative comparison of overlapping and non-overlapping sliding windows for human activity recognition using inertial sensors. Sensors 19:5026. doi: 10.3390/s19225026
Gbd 2016 Parkinson’s Disease Collaborators (2018). Global, regional, and national burden of Parkinson’s disease, 1990-2016: a systematic analysis for the Global Burden of Disease Study 2016. Lancet Neurol. 17, 939–953. doi: 10.1016/S1474-4422(18)30295-3
Hoehn, M. M., and Yahr, M. D. (1967). Parkinsonism: onset, progression and mortality. Neurology 17, 427–442. doi: 10.1212/wnl.17.5.427
Holden, S. K., Finseth, T., Sillau, S. H., and Berman, B. D. (2018). Progression of MDS-UPDRS scores over five years in de novo Parkinson disease from the Parkinson’s progression markers initiative cohort. Mov. Disord. Clin. Pract. 5, 47–53. doi: 10.1002/mdc3.12553
Hughes, A. J., Daniel, S. E., Kilford, L., and Lees, A. J. (1992). Accuracy of clinical diagnosis of idiopathic Parkinson’s disease: a clinic-pathological study of 100 cases. J. Neurol. Neurosurg. Psychiat. 55, 181–184. doi: 10.1136/jnnp.55.3.181
Mannini, A., Intille, S. S., Rosenberger, M., Sabatini, A. M., and Haskell, W. (2013). Activity recognition using a single accelerometer placed at the wrist or ankle. Med. Sci. Sports Exerc. 45, 2193–2203. doi: 10.1249/MSS.0b013e31829736d6
Janidarmian, M., Roshan Fekr, A., Radecka, K., and Zilic, Z. (2017). A comprehensive analysis on wearable acceleration sensors in human activity recognition. Sensors (Basel) 17:529. doi: 10.3390/s17030529
Jeon, H., Lee, W., Park, H., Lee, H. J., Kim, S. K., Kim, H. B., et al. (2017a). Automatic classification of tremor severity in Parkinson’s disease using a wearable device. Sensors (Basel) 17:2067. doi: 10.3390/s17092067
Jeon, H., Lee, W., Park, H., Lee, H. J., Kim, S. K., Kim, H. B., et al. (2017b). High-accuracy automatic classification of Parkinsonian tremor severity using machine learning method. Physiol. Meas. 38, 1980–1999. doi: 10.1088/1361-6579/aa8e1f
Jilbab, A., Benba, A., and Hammouch, A. (2017). Quantification system of Parkinson’s disease. Int. J. Speech Technol. 20, 143–150. doi: 10.1007/s10772-016-9394-9
Kalia, L. V., and Lang, A. E. (2015). Parkinson’s disease. Lancet 386, 896–912. doi: 10.1016/S0140-6736(14)61393-3
Kostikis, N., Hristu-Varsakelis, D., Arnaoutoglou, M., and Kotsavasiloglou, C. A. (2015). Smartphone-based tool for assessing parkinsonian hand tremor. IEEE J. Biomed. Health. Inform. 19, 1835–1842. doi: 10.1109/JBHI.2015.2471093
Kuhner, A., Schubert, T., Cenciarini, M., Wiesmeier, I. K., Coenen, V. A., Burgard, W., et al. (2017). Correlations between motor symptoms across different motor tasks, quantified via random forest feature classification in Parkinson’s disease. Front. Neurol. 8:607. doi: 10.3389/fneur.2017.00607
LeMoyne, R., Tomycz, N., Mastroianni, T., McCandless, C., Cozza, M., and Peduto, D. (2015). Implementation of a smartphone wireless accelerometer platform for establishing deep brain stimulation treatment efficacy of essential tremor with machine learning. Conf. Proc. IEEE Eng. Med. Biol. Soc. 2015, 6772–6775. doi: 10.1109/EMBC.2015.7319948
LeMoyne, R., Mastroianni, T., Whiting, D., and Tomycz, N. (2019). “Assessment of machine learning classification strategies for the differentiation of deep brain stimulation “On” and “Off” status for Parkinson’s disease using a smartphone as a wearable and wireless inertial sensor for quantified feedback,” in Wearable Wireless Sys. Healthcare II (New York, NY: Springer) 113–126. doi: 10.1007/978-981-13-5808-1-9
Li, Y., and Zhang, X. (2011). “Improving k nearest neighbor with exemplar generalization for imbalanced classification,” in Advances in Knowledge Discovery and Data Mining. PAKDD 2011. Lecture Notes in Computer Science Vol. 6635, eds J. Z. Huang, L. Cao, and J. Srivastava (Heidelberg: Springer), 321–332.
Lonini, L., Dai, A., Shawen, N., Simuni, T., Poon, C., Shimanovic, L., et al. (2018). Wearable sensors for Parkinson’s disease: which data are worth collecting for training symptom detection models. NPJ Digit. Med. 1:64. doi: 10.1038/s41746-018-0071-z
Meigal, A. Y., Rissanen, S. M., Tarvainen, M. P., Georgiadis, S. D., Karjalainen, P. A., Airakisinen, O., et al. (2012). Linear and nonlinear tremor acceleration characteristics in patients with Parkinson’s disease. Physiol. Meas. 33, 395–412. doi: 10.1088/0967-3334/33/3/395
Nurwulan, N. R., and Jiang, B. C. (2020). Window selection impact in human activity recognition. Int. J. Innov. Techn Interdisc. Sci. 3, 381–394. doi: 10.15157/IJITIS.2020.3.1.381-394
Pedrosa, T. I., Vasconcelos, F. F., Medeiros, L., and Silva, L. D. (2018). Machine learning application to quantify the tremor level for parkinson’s disease patients. Procedia Comp. Sci. 138, 215–220. doi: 10.1016/j.procs.2018.10.031
Poewe, W., Seppi, K., Tanner, C. M., Halliday, G. M., Brundin, P., Volkmann, J., et al. (2017). Parkinson disease. Nat. Rev. Dis. Primers 3:17013. doi: 10.1038/nrdp.2017.13
Ramdhani, R. A., Khojandi, A., Shylo, O., and Kopell, B. H. (2018). Optimizing clinical assessments in Parkinson’s disease through the use of wearable sensors and data driven modeling. Front. Comput. Neurosci. 12:72. doi: 10.3389/fncom.2018.00072
Rizek, P., Kumar, N., and Jog, M. S. (2016). An update on the diagnosis and treatment of Parkinson disease. CMAJ 188, 1157–1165. doi: 10.1503/cmaj.151179
Rovini, E., Maremmani, C., and Cavallo, F. (2017). How wearable sensors can support Parkinson’s disease diagnosis and treatment: a systematic review. Front. Neurosci. 11:555. doi: 10.3389/fnins.2017.00555
Stamatakis, J., Ambroise, J., Crémers, J., Sharei, H., Delvaux, V., Macq, B., et al. (2013). Finger tapping clinimetric score prediction in Parkinson’s disease using low-cost accelerometers. Comput. Intell. Neurosci. 2013, 717853. doi: 10.1155/2013/717853
Susi, M., Borio, D., and Lachapelle, G. (2011). “Accelerometer signal features and classification algorithms for positioning applications,” Proceedings of the 2011 International Technical Meeting of The Institute of Navigation, San Diego, CA, 158-169.
Theodoridis, S., Pikrakis, A., Koutroumbas, A., and Cavouras, D. (2010). Introduction to pattern recognition. A Matlab Approach. Cambridge, MA: Academic Press, 231.
Tripoliti, E. E., Tzallas, A. T., Tsipouras, M. G., Rigas, G., Bougia, P., Leontiou, M., et al. (2013). Automatic detection of freezing of gait events in patients with Parkinson’s disease. Comput. Methods Programs Biomed. 110, 12–26. doi: 10.1016/j.cmpb.2012.10.016
Twomey, N., Diethe, T., Fafoutis, X., Elsts, A., McConville, R., Flach, P., et al. (2018). A comprehensive study of activity recognition using accelerometers. Informatics 5:27. doi: 10.3390/informatics5020027
Vapnik, V. (1979). Estimation of Dependences Based on Empirical Data [in Russian]. Moscow: Nauka (English translation: Springer Verlag, New York, 1982).
Wang, G., Li, Q., Wang, L., Wang, W., Wu, M., and Liu, T. (2018). Impact of sliding window length in indoor human motion modes and pose pattern recognition based on smartphone sensors. Sensors (Basel) 18:1965. doi: 10.3390/s18061965
Keywords: Parkinson’s disease, inertial sensors, accelerometer, gyroscope, hand resting tremor, machine learning
Citation: de Araújo ACA, Santos EGR, de Sá KSG, Furtado VKT, Santos FA, de Lima RC, Krejcová LV, Santos-Lobato BL, Pinto GHL, Cabral AS, Belgamo A, Callegari B, Kleiner AFR, Costa e Silva AA and Souza GS (2020) Hand Resting Tremor Assessment of Healthy and Patients With Parkinson’s Disease: An Exploratory Machine Learning Study. Front. Bioeng. Biotechnol. 8:778. doi: 10.3389/fbioe.2020.00778
Received: 12 December 2019; Accepted: 18 June 2020;
Published: 14 July 2020.
Edited by:
Fabio Galbusera, Galeazzi Orthopedic Institute (IRCCS), ItalyReviewed by:
Tito Bassani, Galeazzi Orthopedic Institute (IRCCS), ItalyNicola Francesco Lopomo, University of Brescia, Italy
Copyright © 2020 de Araújo, Santos, de Sá, Furtado, Santos, de Lima, Krejcová, Santos-Lobato, Pinto, Cabral, Belgamo, Callegari, Kleiner, Costa e Silva and Souza. This is an open-access article distributed under the terms of the Creative Commons Attribution License (CC BY). The use, distribution or reproduction in other forums is permitted, provided the original author(s) and the copyright owner(s) are credited and that the original publication in this journal is cited, in accordance with accepted academic practice. No use, distribution or reproduction is permitted which does not comply with these terms.
*Correspondence: Givago da Silva Souza, Z2l2YWdvc291emFAdWZwYS5icg==; Z2l2YWdvc291emFAeWFob28uY29tLmJy