 Carolin Riesenberg1,2†
 Christian Alejandro Iriarte-Valdez1,2†Annegret Becker3
 Maria Dienerowitz4Alexander Heisterkamp1,2
 Anaclet Ngezahayo3
 Maria Leilani Torres-Mapa1,2*
- 1Institute of Quantum Optics, Leibniz University Hannover, Hannover, Germany
- 2Lower Saxony Centre for Biomedical Engineering, Implant Research and Development (NIFE), Hannover, Germany
- 3Institute of Cell Biology and Biophysics, Leibniz University Hannover, Hannover, Germany
- 4Single-Molecule Microscopy Group, Jena University Hospital, Jena, Germany
This work probes the binding kinetics of COOH-terminus of Clostridium perfringens enterotoxin (c-CPE) and claudin expressing MCF-7 cells using force spectroscopy with optical tweezers. c-CPE is of high biomedical interest due to its ability to specifically bind to claudin with high affinity as well as reversibly disrupt tight junctions whilst maintaining cell viability. We observed single-step rupture events between silica particles functionalized with c-CPE and MCF-7 cells. Extensive calibration of the optical tweezers’ trap stiffness and displacement of the particle from trap center extracted a probable bond rupture force of ≈ 18 pN. The probability of rupture events with c-CPE functionalized silica particles increased by 50% compared to unfunctionalized particles. Additionally, rupture events were not observed when probing cells not expressing claudin with c-CPE coated particles. Overall, this work demonstrates that optical tweezers are invaluable tools to probe ligand-receptor interactions and their potential to study dynamic molecular events in drug-binding scenarios.
Introduction
Dynamic force spectroscopy is a technique which measures the distribution of rupture forces between molecular bonds as a function of loading rate (Capitanio and Pavone, 2013). Along with biomembrane force probe, atomic force microscopy and magnetic tweezers, optical tweezers are one of the few known tools that can be implemented to probe the binding strength of molecular bonds such as cell membrane receptors and ligands (Merkel et al., 1999; Neuman and Nagy, 2008). In optical tweezers, a tightly focused laser beam traps and manipulates microscopic particles with nanometer precision. The optically trapped particle can be additionally functionalized by ligands in order to bind them to receptor proteins present on the membrane of living cells. By monitoring the displacement of the particle from the trap center, the rupture force required to dissociate the bond formed between the ligand and their receptor can be obtained and measured.
A family of membrane proteins, claudins, has been a major interest in cancer community. Claudin proteins are considered the most important component of tight junctions (TJs), structures which form a seal between epithelial cells to limit and regulate paracellular transport (Veshnyakova et al., 2010; Alberts et al., 2002). TJs are essential for the formation of the epithelial barrier in order to prevent uncontrolled flux of substances such as bacterial toxins from the gut lumen into the body (Gunzel and Yu, 2013; Van Itallie and Anderson, 2013). Furthermore, they play a crucial role in the regulation of epithelial cell polarity and the delivery of components to their destination within the plasma membrane (Alberts et al., 2002). TJs are made up of several proteins within both of the two interacting adjacent cells, the majority of which are claudins and occludins (Alberts et al., 2002). Claudins cross the plasma membrane four times with two extracellular loops and C- and N-termini oriented toward the cytoplasm (Mitchell and Koval, 2010). Expression and abundance of claudin subtypes vary depending on the cell and tissue. Since specific claudins such as -3 and -4 are upregulated in some types of cancer cells in prostate, breast, pancreatic and ovary, claudin-targeted therapy is currently under investigation for tumor treatment (Mitchell and Koval, 2010; Gao et al., 2011).
As a potential claudin-targeting ligand, Clostridium perfringens enterotoxin (CPE) is a well-known toxin that binds to certain claudins in tight junctions and induces cell death. Understanding of the specific interaction between CPE and receptor claudins could lead to several pharmaceutical applications. A particular interest is the recombinant produced COOH-terminal half of CPE (c-CPE), because it binds to receptor claudins and disrupts tight junctions in a reversible manner, but is not cytotoxic (Gao and McClane, 2011; Shrestha et al., 2016). For example, c-CPE has been shown to sensitize ovarian cancer cells to low dose Taxol, a conventional chemotherapy medication. Fluorescently labeled c-CPE could also be used for tumor imaging (Mitchell and Koval, 2010; Shrestha et al., 2016). Additionally, by inducing TJ disruption, c-CPE enables paracellular transport and thus allows drug delivery beyond physiological barriers (Shrestha et al., 2016). For this reason, it has also been used to transiently open the blood brain barrier and allow diffusion of drugs into non-accessible tissue such as brain parenchyma (Neuhaus et al., 2018). Recently, we have shown that c-CPE functionalized to gold nanoparticles can be used to kill cancer cells upon laser illumination (Becker et al., 2018, 2019).
Although various studies on the interaction of c-CPE to claudins have been conducted in recent years, single molecule binding investigation between this ligand-receptor pair is currently lacking. Insights into the molecular dynamics of the binding event can be obtained using dynamic force spectroscopy methods where increasing force applied to the bond facilitates dissociation (Hinterdorfer and Dufrêne, 2006). Compared to traditional assays, which specify information on dissociation constants based on equilibrium conditions, single molecule studies provide information on the molecular heterogeneity of the complexes formed in real-time, as well as thermodynamic bond parameters such as Gibbs free energy of activation, characteristic length and bond lifetime without force (Stangner et al., 2013).
In this work, we investigate the interaction of claudin and c-CPE by performing force spectroscopy measurements using optical tweezers. In combination with a sensitive back-focal plane interferometric method, we measure the rupture force required to break the claudin and c-CPE bond. Based on the work of Litvinov et al. (2002) and Shergill et al. (2012) we develop a protocol wherein claudin-expressing cells attached to a coverslip are brought into contact with optically trapped particles functionalized with c-CPE and then subsequently retracted. Upon binding, the weak molecular bonds between c-CPE and claudin will exert a force-dependent load on the optically trapped particle until the bond breaks. We describe the calibration process of the trap stiffness and lateral position in order to perform the experiments. Additionally, we detailed the signal processing steps in order to quantify the rupture forces. Overall, this work shows that optical tweezers in combination with back-focal plane detection offer a versatile and precise non-contact method to probe the interaction of ligands with membrane receptors in living cells.
Materials and Methods
Experimental Setup
The experimental setup is shown in Figure 1A. The optical tweezers system (OTKB/M, Thorlabs, Newton, NJ, United States) with a back-focal plane detection module (OTKBFM) and a force acquisition (OTKBFM-CAL, Thorlabs, Newton, NJ, United States) were used for the experiments. The trapping laser was a laser diode (BL976-SAG300, Thorlabs) controlled with a laser diode/TEC controller (CLD1015, Thorlabs, Newton, NJ, United States) providing a continuous light emission at wavelength 975.7 nm and a maximum output power of 300 mW. The beam was coupled to a single mode optical fiber (SM980-5.8-125) and the output beam was collimated with a triplet collimator (TC06APC-980, Thorlabs, Newton, NJ, United States) and expanded by lenses (f = −50 mm and f = 150 mm). A shortpass dichroic mirror (DMSP805R, Thorlabs, Newton, NJ, United States) reflected the trapping beam into a high numerical aperture objective (E Plan 100x/1.25 Oil, Nikon) which focused the trapping beam into the sample. A condenser objective (Nikon, E Plan 10x/0.25) collected the light from the sample and along with a biconvex lens (f = 40 mm) projects the condenser’s back focal plane onto the quadrant photodiode (PDQ80A, Thorlabs, Newton, NJ, United States) connected to a quadrant detector reader (TPA101, Thorlabs, Newton, NJ, United States). Two neutral density filters (ND) with OD = 0.6 and OD = 0.1 were used to avoid detector saturation. A data acquisition card (USB6212, National Instruments) converted the analog voltage signals to digital values.
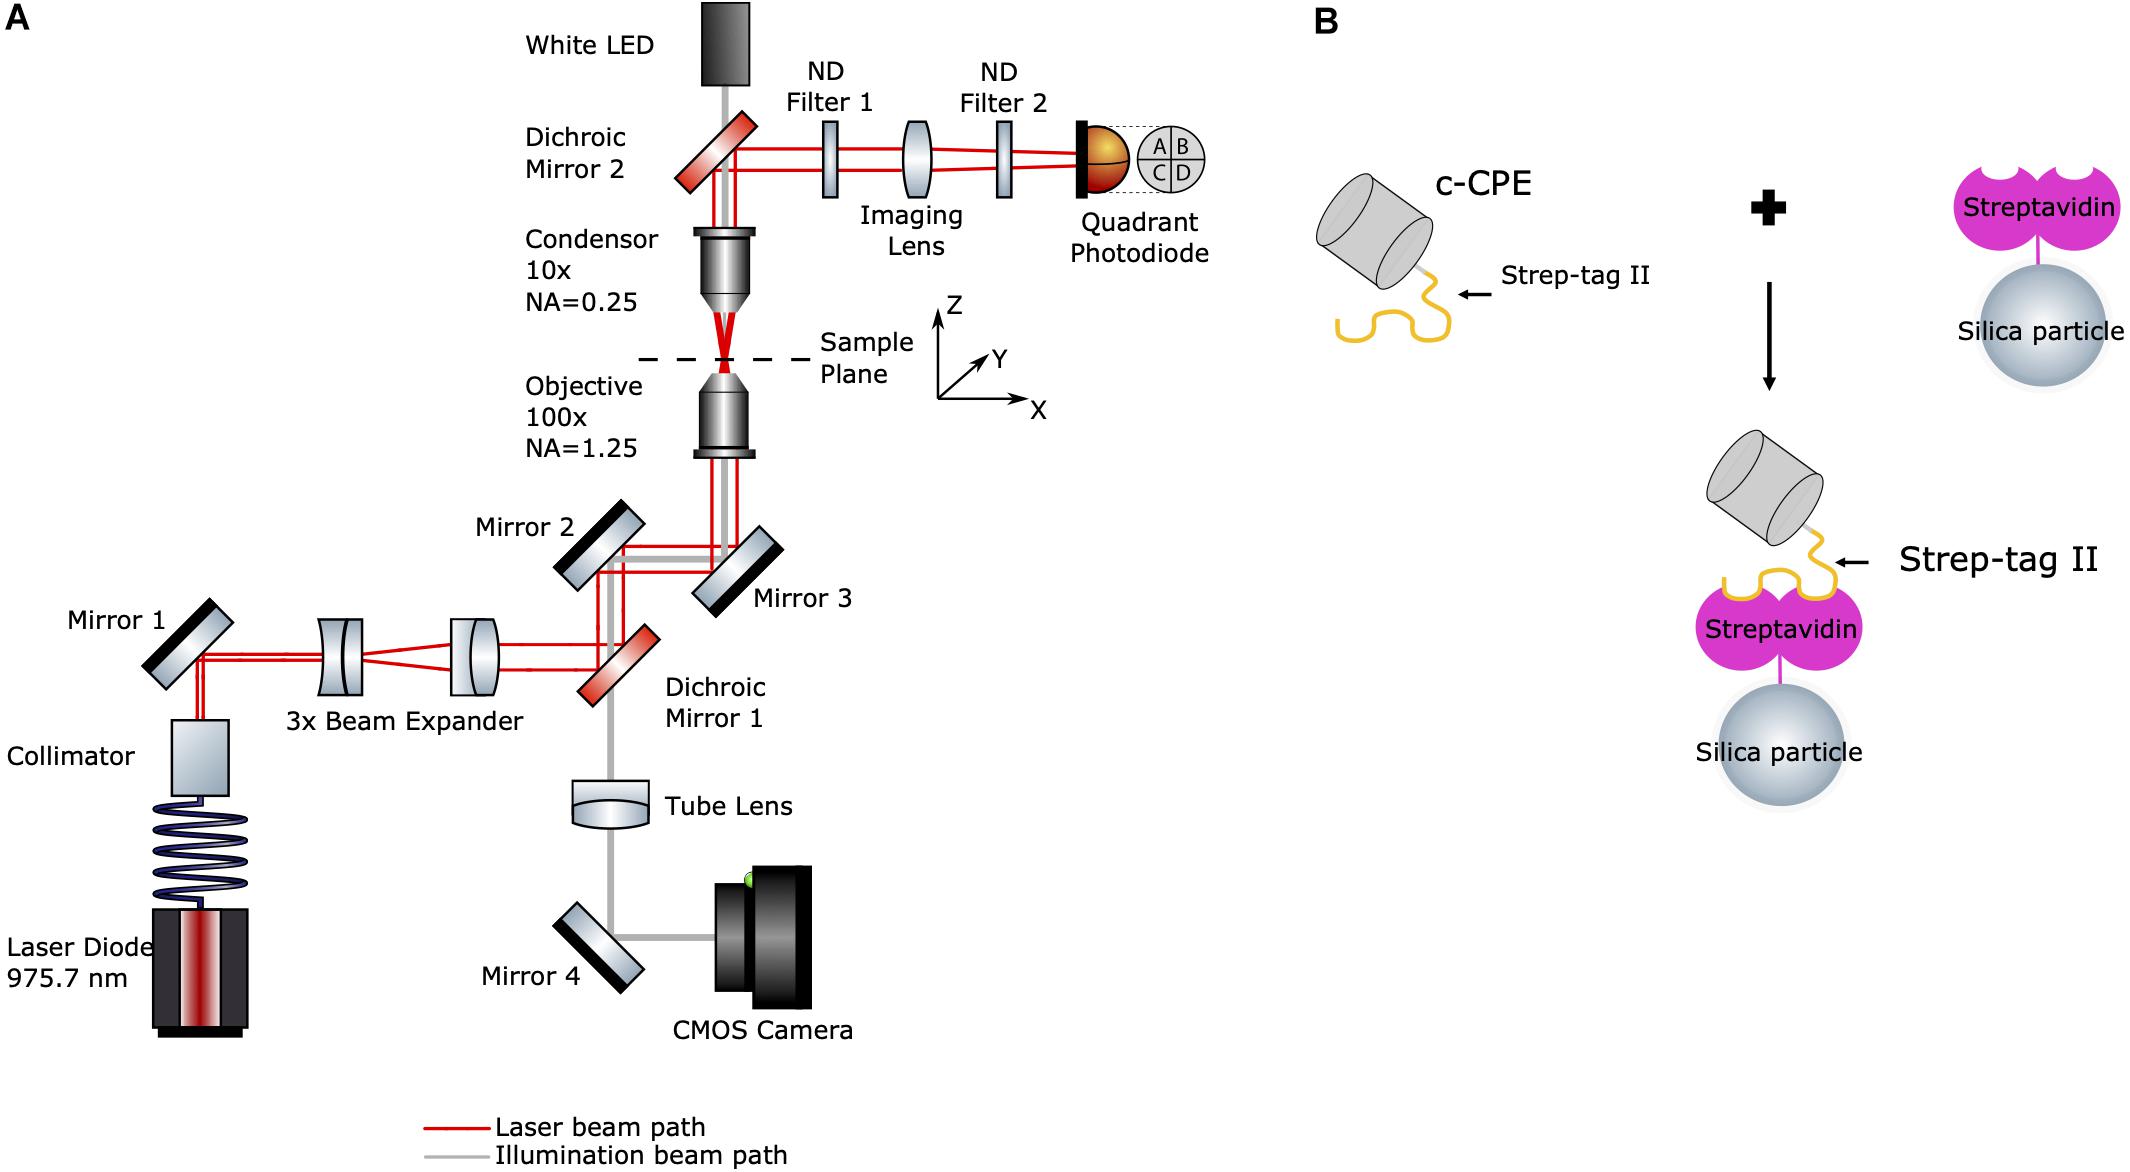
Figure 1. (A) Schematic diagram of the optical tweezers setup. Red line indicates the laser beam path starting at the fiber-coupled laser diode (bottom left). Gray line indicates the path of the white LED’s illumination (top). (B) Illustration of c-CPE functionalized streptavidin-coated silica particles used in the experiments (drawing not to scale).
For imaging, a white light LED and the condenser objective were used to illuminate the sample. The trapping objective was also used simultaneously to image the sample. An achromatic doublet lens (f = 200 mm) acted as a tube lens which projected the image onto a CCD camera (Thorlabs, Thorlabs, Newton, NJ, United States). The trapping events were monitored and recorded with the camera software (ThorCam, Thorlabs, Newton, NJ, United States). Power measurements at the sample plane were performed by a power meter (S121C, Standard Photodiode Power Sensor, Thorlabs, Newton, NJ, United States) by measuring the laser before it enters the objective. After subtraction of the losses due to the objective (according to the manufacturer, 25.5% at 975 nm), a maximum optical power of 168.28 ± 2.49 mW at 450 mA and a lasing threshold current of approximately 45 mA were determined.
The sample was placed on a piezo-driven 3-axis sample stage (MAX311D/M, Thorlabs, Newton, NJ, United States) controlled by 3 piezo controller cubes (KPZ101, Thorlabs, Newton, NJ, United States). Position feedback from two strain gauge readers (TSG001, Thorlabs, Newton, NJ, United States) enabled a step size of 5 nm for lateral movements.
Back Focal Plane Interferometry
Back focal plane interferometry was used as the position detection scheme. The quadrant photodiode (QPD) in the setup was placed in a plane that is conjugated to the back focal plane of the condenser, where it detected a light pattern caused by interference between light scattered by the trapped particle and the unscattered light (Pralle et al., 1999; Neuman and Block, 2004). The signals Xvnorm, Yvnorm, and Zv, which correspond to displacements in lateral X- and Y-direction and in the axial Z-direction, respectively, can be calculated from the raw QPD signals.
The displacements Xm, Ym, and Zm, can be acquired by applying conversion factors to Xvnorm, Yvnorm, and Zv (Neuman and Block, 2004; Nicholas et al., 2014). Both position calibration and power spectral density method can be carried out to determine these conversion factors. Since Xvnorm and Yvnorm were normalized by total voltage, their values are given in arbitrary units (A.U.).
Cell Culture
The epithelial-like human breast adenocarcinoma cell line Michigan Cancer Foundation-7 (MCF- 7, DSMZ no. ACC 115), known to express claudin-3, -4, and -7 (Kominsky et al., 2003; Todd et al., 2015) was used as claudin positive cells. For controls, we used a breast cancer cell line, MDA-MB-231 with minimal expression of claudin -3, -4, and -7 (Becker et al., 2018). Between experiments, the cells were kept in an incubator at 37°C with 5% CO2. Cells were cultured in DMEM/F12 (F4815, Biochrom) supplemented with 10% fetal calf serum (S0615, Biochrom) and 1% penicillin/streptomycin (P06-07050, PAN-Biotech). The confluent culture was split every 3 to 6 days. Cells were detached from the culture plate with trypsin/EDTA (PAN-Biotech) for 3 min at 37°C. Trypsin was subsequently deactivated in the solution by adding a double amount of cell culture medium. An aliquot was then transferred into a new tissue culture dish with fresh culture medium. The remaining cells could be used for experiments.
Media Properties
The characteristics of the cell culture medium in which particles are suspended influences the performance of the optical trap. In particular, its density and viscosity need to be determined to enable the calibration. We measured the dynamic viscosity, ηcm and the density, ρcm of the medium specified in section “Cell Culture.” The dynamic viscosity of the cell culture medium was measured with a Rheometer Fluids Spectrometer (RFSII, TA Instruments) at room temperature. Using the software RSI Orchestrator, the shear stress was measured for different shear rates. The dynamic viscosity is the slope of the linear fit given by ηcm = (1.050 ± 0.194) mPa s. Meanwhile the density of the cell culture medium was determined by weighing 1 ml cell culture medium with an analytical balance (M-Pact AX244, Sartorius). Repeating the measurements ten times yielded an average density of ρcm = (1.011 ± 0.006) g/cm3.
Preparation of the C. perfringens Enterotoxin C-Terminal Fragment (c-CPE)
c-CPE was prepared as previously described (Becker et al., 2018). In brief, from the genomic C. perfringens DNA the c-CPE194-319 gene fragment was PCR amplified and cloned into the pet22b expression vector allowing an N-terminal fusion to the Strep II-Tag. E. coli Rosetta pLysSRARE2 transformants expressing the c-CPE Strep Tag-II fusion protein were lysed and the fusion protein was purified using the Strep-Tactin XT Superflow column system (IBA, Göttingen, Germany). After validation, c-CPE was applied at indicated concentration for following experiments. Based on the previously published data (Becker et al., 2018), 5 μg/ml c-CPE was conjugated to Strep-Tactin Chromeo 488 to visualize its binding to MCF7 and MDA-MB-231 cells adhered on a cover slip 2 h after trypsinization.
c-CPE Functionalized Streptavidin-Coated Silica Particles
A schematic diagram of the particle functionalization is shown in Figure 1B. Streptavidin-coated silica particles (PSI-1.0 SA, Kisker Biotech) with diameter of 955.2 ± 179.3 nm were further coated with c-CPE, which binds to streptavidin via Strep-tag II. 250 μg/ml c-CPE were mixed with 41.5 μg/ml suspended particles in Dulbecco’s phosphate-buffered saline (P04-36500, PAN-Biotech) solution and incubated at 4°C overnight. The day of the experiments, the particles were centrifuged at 12500 g for 10 min to remove the unbound c-CPE supernatant and particles were resuspended in fresh cell culture medium.
Sample Preparation
20 μl solution containing trypsinized cells were transferred onto a 0.17 mm thick glass cover slip (24 mm × 60 mm). Sample was incubated for 30 min at 37°C with 5% CO2 to ensure cell attachment to the cover slip surface. Afterward, two pieces of double-sided tape were used to create a small chamber around the sample. Right before the start of the experiment, 10 μl of the particle suspension in cell culture medium (50 μg/ml) were added to the sample. The chamber was closed with a small cover slip (∅ 18 mm) on top.
Visualization of Binding via Immunofluorescence
5 μg/ml c-CPE was mixed with 5 μg/ml Strep-Tactin Chromeo 488 fluorescent dye and incubated at 4 °C overnight to facilitate binding of Strep-Tactin to Strep-tag II. The following day, the mixture was added to trypsinized cells and incubated for 2 h on coverslips at 37°C with 5% CO2. Subsequently, cells were fixed with 4% formaldehyde and stained with nuclear fluorescent dye, Hoechst. As a control, only Strep-Tactin Chromeo 488 without c-CPE was added to the cells. Fluorescence was detected with a inverted microscope (Nikon Eclipse TE2000-E). Chromeo 488 and Hoechst were visualized using light sources with wavelengths, λ = 488 nm and 400 nm, respectively.
Results
Calibration of Optical Tweezers
The rupture force, F was calculated by multiplying the trap stiffness, k and the particle displacement, xm according to Hooke’s law, F = kxm. Therefore, an accurate calibration to determine the trap stiffness and particle displacement is crucial for force measurements. The displacement of the particle from the center of the optical trap was determined by applying a conversion factor, β to the respective QPD signals. One way to determine β is to attach a particle to a coverslip and record the QPD signals while the particle is swept through the trap center using a piezo-controlled positioning stage. The normalized QPD signals, Xvnorm and Yvnorm were recorded and a linear curve can be fitted to the signal for small displacements from the trap center as shown in Figure 2A. The slope of this linear fit is the detector sensitivity or the inverse of the conversion factor, 1/β. Position calibration was averaged over 5 different particles. By fitting a linear curve to the signal, the average conversion factors βx = (3.05 ± 0.37) μm/A.U. and βy = (5.04 ± 0.48) μm/A.U. for P = (168 ± 2.49) mW were obtained. This corresponds to a displacement range of ≈ ± 180 nm in the x-axis and ≈ ± 306 nm in the y-axis. We attributed the differences in conversion factors for the two axes to the asymmetry of the beam shape at the focus. Detectable position range can be expanded by fitting a third-degree polynomial from the signal maximum to the signal minimum (Nicholas et al., 2014). This method enabled displacement measurements of up to ≈±250 nm and ≈±406 nm for x and y-axis, respectively.
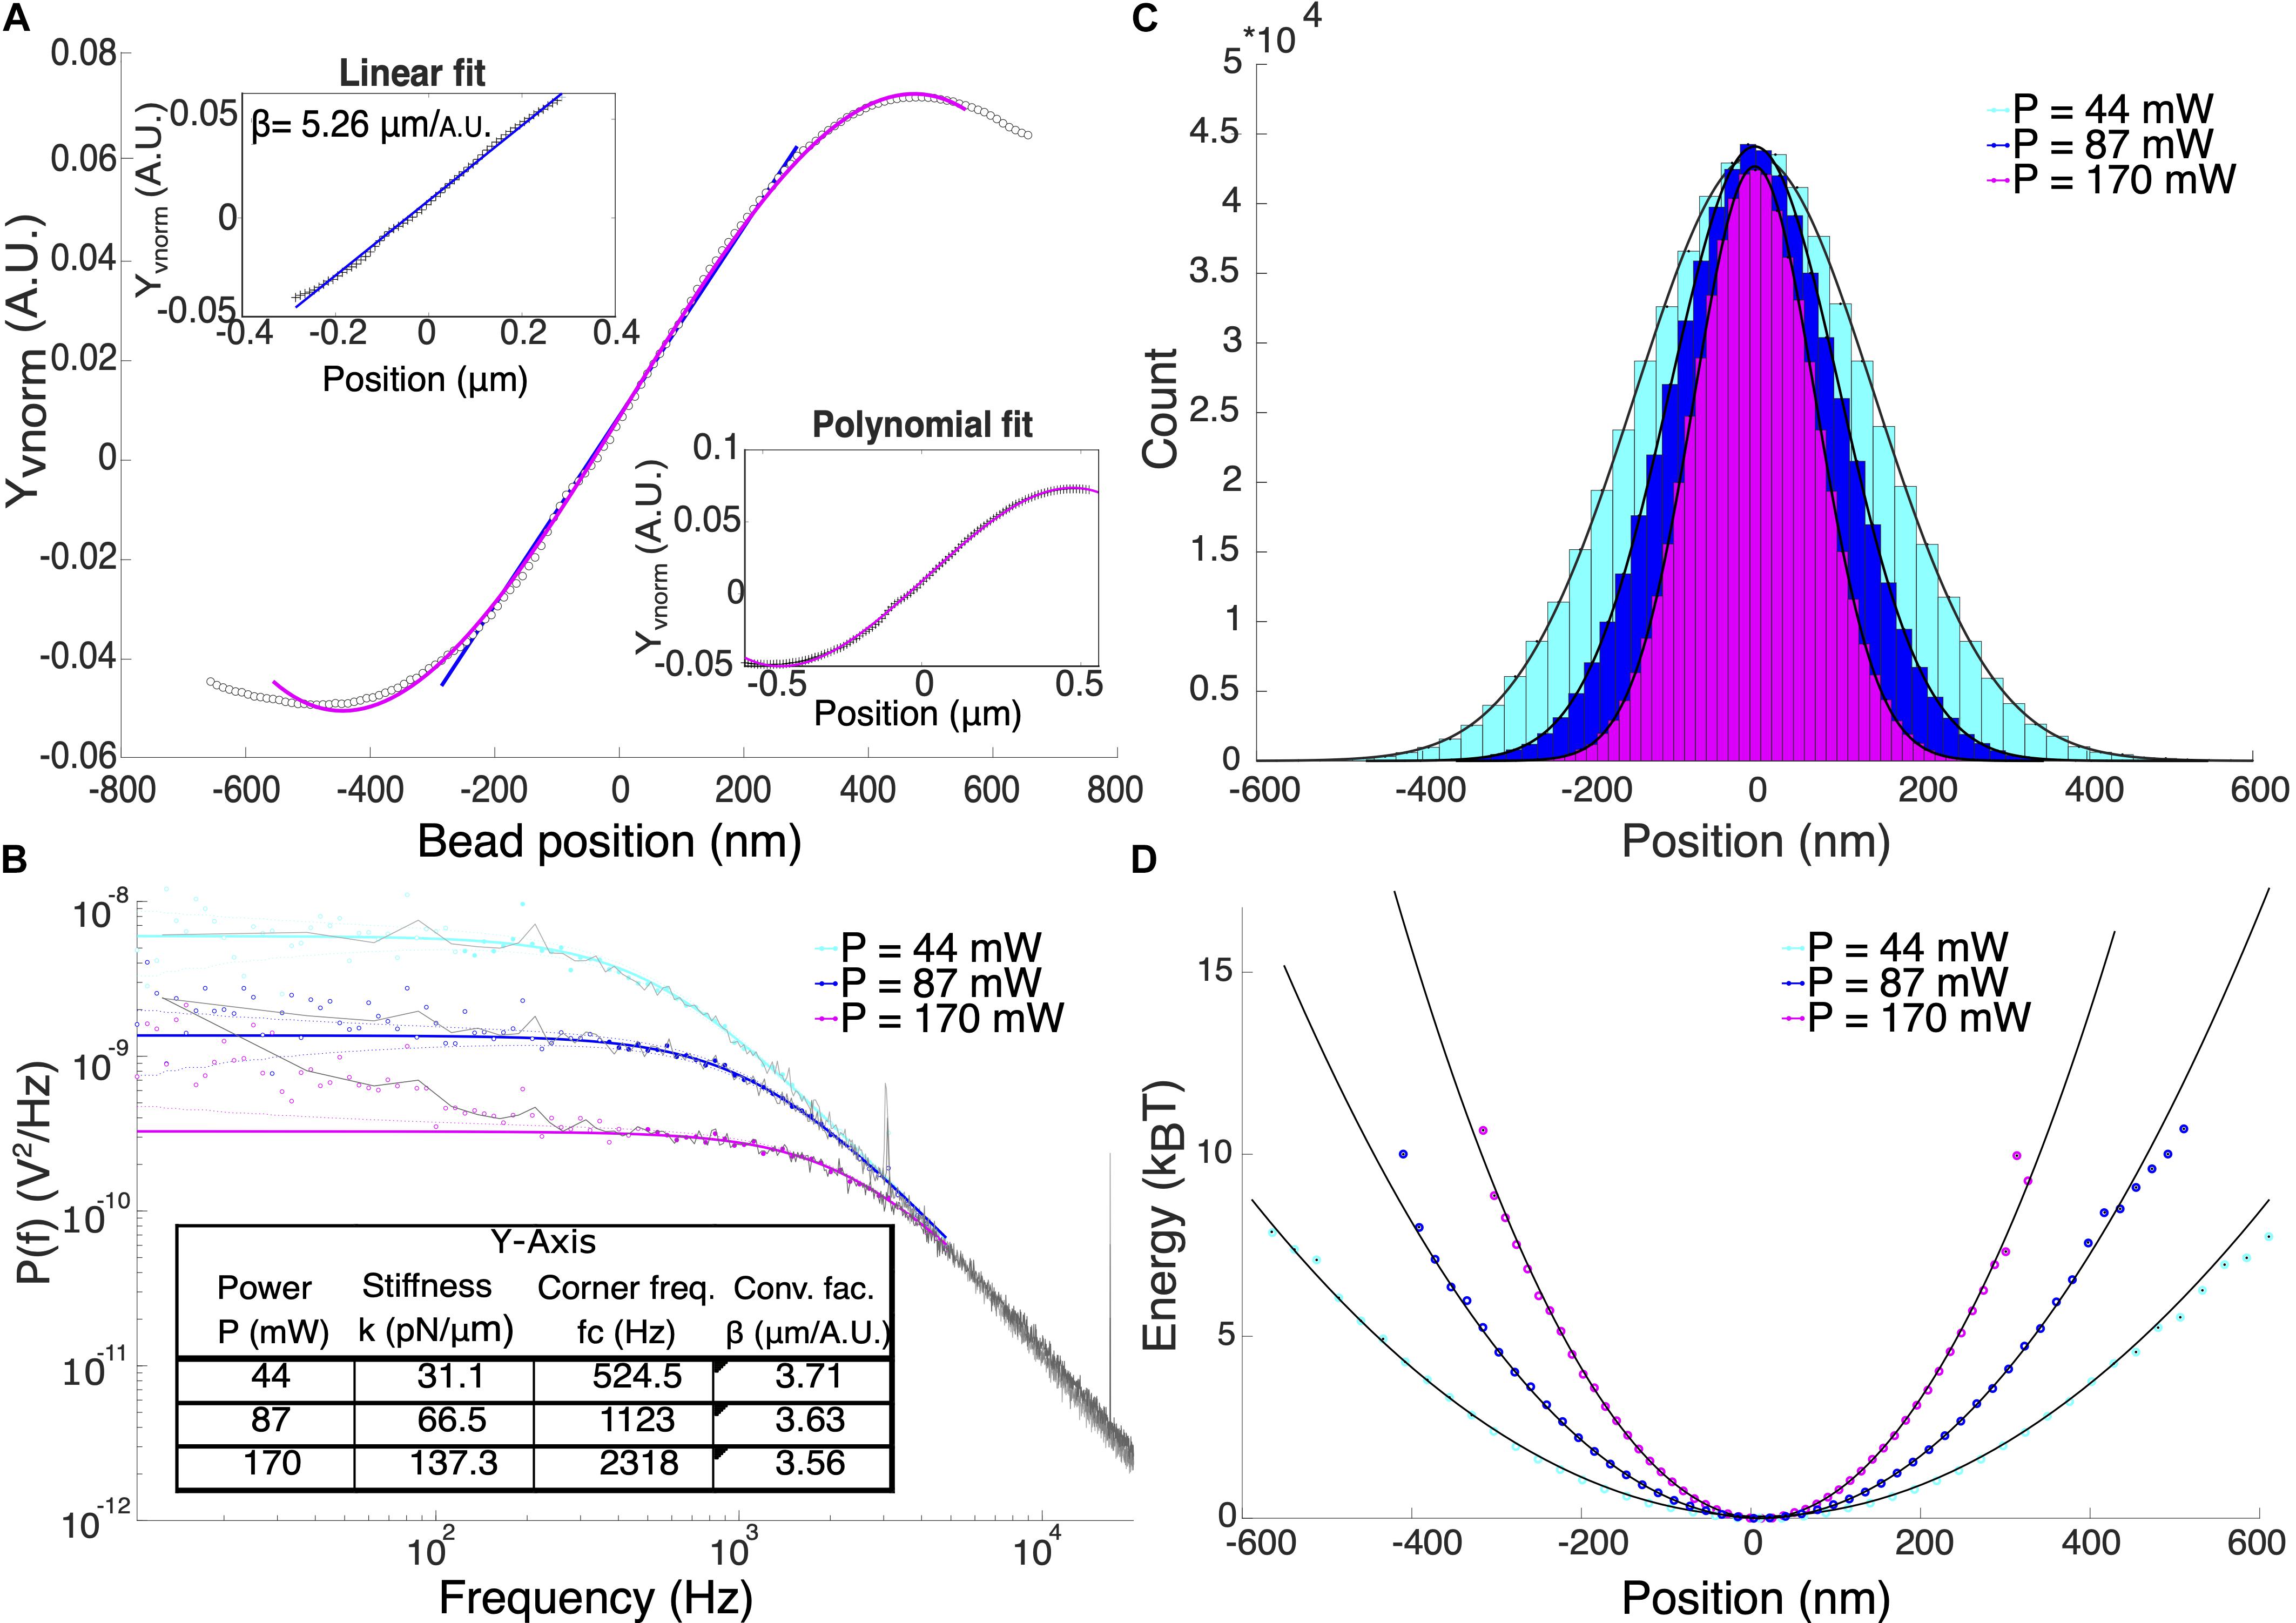
Figure 2. (A) Typical position calibration for Y-axis of our system. Upper inset shows the linear fit and the lower inset shows the polynomial fit. (B) Power spectral density analysis of 1 μm optically trapped particles at different laser power. Colored solid lines are the theoretical Lorentzian spectrum within the range of 10–5000 Hz overlayed to the experimental data (black lines). Filled and hollow symbols are the included and excluded data for the Lorentzian fitting, respectively. Using power spectral density method, both β and trap stiffness can be directly obtained. (C) Position histogram of the trapped particles at different laser powers. (D) The potential energy in units of kBT shows that at P = 170 mW, the potential is harmonic for displacement range of ±300 nm.
Power Spectral Density Method
Power spectral density method (PSD) was used to measure the trap stiffness of the optical trap by analyzing the frequency content of a trapped particle’s Brownian motion. In this method, both the trap stiffness, k and the signal to displacement conversion factor, β can be determined simultaneously. PSD method is only valid within the linear range of the QPD which limits the maximum displacement that can be measured with the system. A LabVIEW code was used to record the QPD signals for a trapped particle with an acquisition rate of 100 kHz. The Matlab program tweezercalib2.1 (Hansen et al., 2006) was used to fit a Lorentzian curve to the signal’s power spectral density. The one-sided power spectrum of a trapped particle can be described as a Lorentzian function (Berg-Sørensen and Flyvbjerg, 2004),
where kB is the Boltzmann constant, T is the absolute temperature, f is frequency and fc is corner frequency, γ is the particle’s hydrodynamic drag coefficient given by the Stoke’s law:
where η is the medium’s dynamic viscosity and rp is the particle’s radius. Therefore, the medium’s viscosity and the particle radius need to be known. The corner frequency, fc is related to the trap stiffness, k using the following equation,
Tweezercalib2.1 accounts for the frequency dependence of the hydrodynamic drag, hydrodynamic interaction with the coverslip, aliasing effects as well as crosstalk between channels. The program computes the corner frequency, from which the trap stiffness [Equation (3)] and a second parameter Dfit in units of A.U.2/s for both Xvnorm and Yvnorm. This is related to the signal to displacement factor, β given by the following equation,
wherein, D= is the diffusion constant in units of m2/s.
Figure 2B shows the comparison of the trapped particle’s power spectral density at powers, P = 44, 87, 170 mW which corresponds to corner frequencies (fc) = 524.5, 1123, and 2318 Hz, respectively. Calculated trap stiffnesses are 31.1, 66.5, and 137.5 pN/μm. All measurements were performed in trapped particles suspended in Milli-Q water using the known values of dynamic viscosity, ηH_2 O = 1.000 mPa s and density ρH_2 O = 0.998 g/cm3. Deviations of the signal from the Lorentzian fit at low frequencies could be due to beam pointing stability and mechanical noise in the system (Berg-Sørensen and Flyvbjerg, 2004). High electronic frequency spikes were observed at 3.06, 16.76, and 33.54 kHz (not shown) that were carried over into the calibration data. These spikes only affect the fitting process when the corner frequency and therefore the trap stiffness is very high (k > 150 pN/μm).
Potential Analysis
Although the displacement of the trapped particle is linear only at a small region where the QPD signal is linear with displacement, it has been shown that the linear range of force is larger. In our case, we validate the range in position at which the trap potential is harmonic, therefore, F = kxm is valid. We obtained the position probability density function (Figure 2C) and calculated the potential energy given by the function: U(x) = −ln(ρ(x)). Fitting a parabola, y = ax2 + b inform us about the range of position where the optical potential is harmonic as shown in Figure 2D. For P = (168 ± 2.49) mW, the potential is harmonic up to at least 10 kBT within the displacement range ±300 nm for y-axis of our system.
Trap Stiffness Measurements
Figure 3A shows the trap stiffness for different optical powers at 10 μm trapping depth. Here, trapping depth is defined as the average height of the trapped particle from the upper surface of the cover slip. Average stiffness values were obtained for 10 different silica particles in cell culture medium using measured values of dynamic viscosity, ηcm = (1.050 ± 0.194) mPa s and density, ρcm = (1.011 ± 0.006) g/cm3, slightly higher than for water. As expected, the trap stiffness has a linear dependence on the optical power. It can be observed that the trap stiffness ky for the Y-axis is larger than the trap stiffness for the X-axis by an approximate factor of 1.4. Maximum average lateral trap stiffnesses measured are kx = (89.81 ± 2.64) pN/μm and ky = (129.28 ± 3.27) pN/μm in cell culture medium. The trapped particle’s lateral position shows a broader distribution in X-axis which confirms the higher trap stiffness in Y-axis (inset Figure 3A). This difference in the trap stiffness in X and Y can be attributed to the combined effects of laser polarization (Madadi et al., 2012) as well as to aberrations leading to ellipticity of the focus. We also calibrated the lateral stiffness as a function of trapping depth, averaged for 5 different trapped particles (Figure 3B). The lateral stiffness is approximately constant for trapping depths between 4 and 16 μm. In order to avoid the huge standard deviation in trap stiffness when trapping at shallow trapping depths due to surface effects, all cell experiments were performed at a trapping depth of 10 μm.
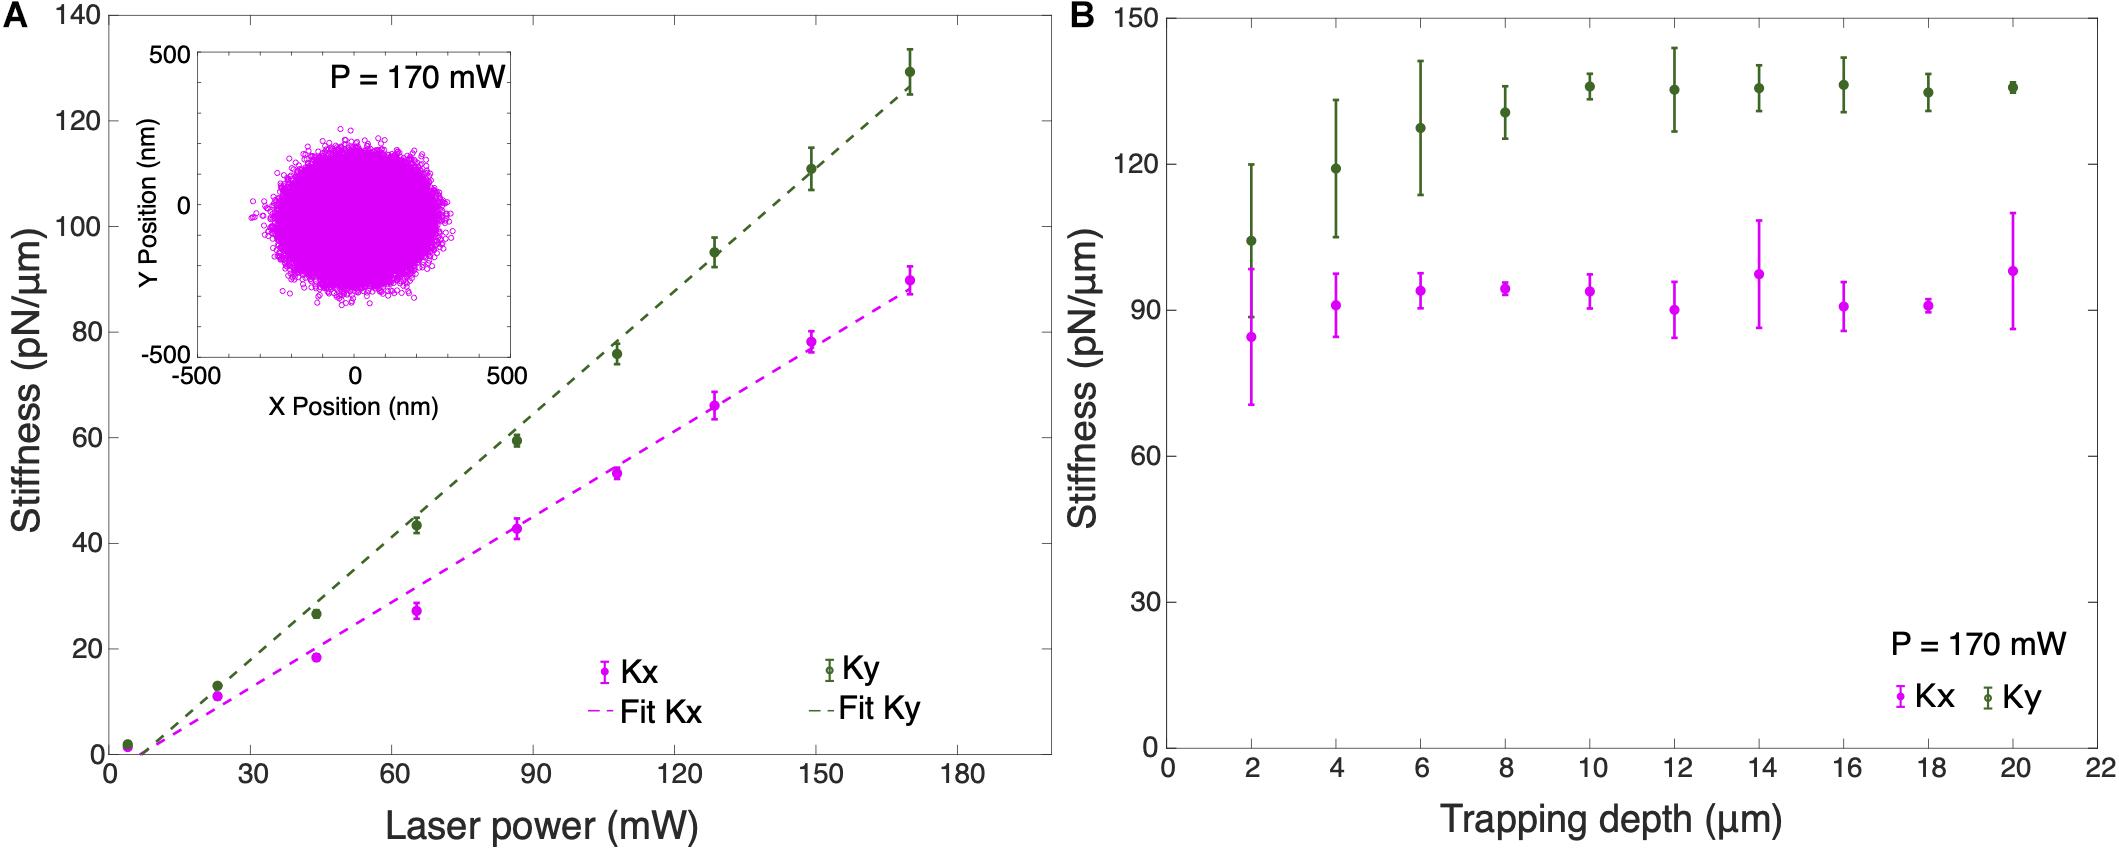
Figure 3. (A) Average trap stiffness of 10 optically trapped 1 μm particles for different laser powers. Inset shows the X-Y position plot of the trapped particle at P = 170 mW. (B) Average trap stiffness as a function of trapped particle height for 5 optically trapped 1 μm particles from the surface of the coverslip at P = 170 mW. Error bars are the ±1 standard deviation of the data. All measurements were performed in cell culture medium.
Evidence of c-CPE Binding to Claudin
The recombinant protein c-CPE, consisting of c-CPE194–319 and Strep-tag II was mixed with the fluorescent dye Strep-Tactin Chromeo 488 as indicated in the methods. Figure 4A shows the fluorescence detected in MCF-7 cells. Same treatment was performed on MDA-MB-231 which is shown in Figure 4B. To check for unspecific binding between the Strep-Tactin Chromeo 488 and the cells, both MCF-7 and MDA-MB-231 were also incubated with Strep-Tactin Chromeo 488 without c-CPE as shown in Figures 4C,D, respectively. Green punctate signals indicate the presence of Chromeo 488, and thus c-CPE, whereas the blue corresponds to the cell nuclei. As green dots are clearly visible in the membrane region of the MCF-7 cells but not of MDA-MB-231 cells, as well as in control samples treated with Strep-Tactin Chromeo 488 only, it can be concluded that c-CPE binds specifically to claudin in the membrane of MCF-7 cells.
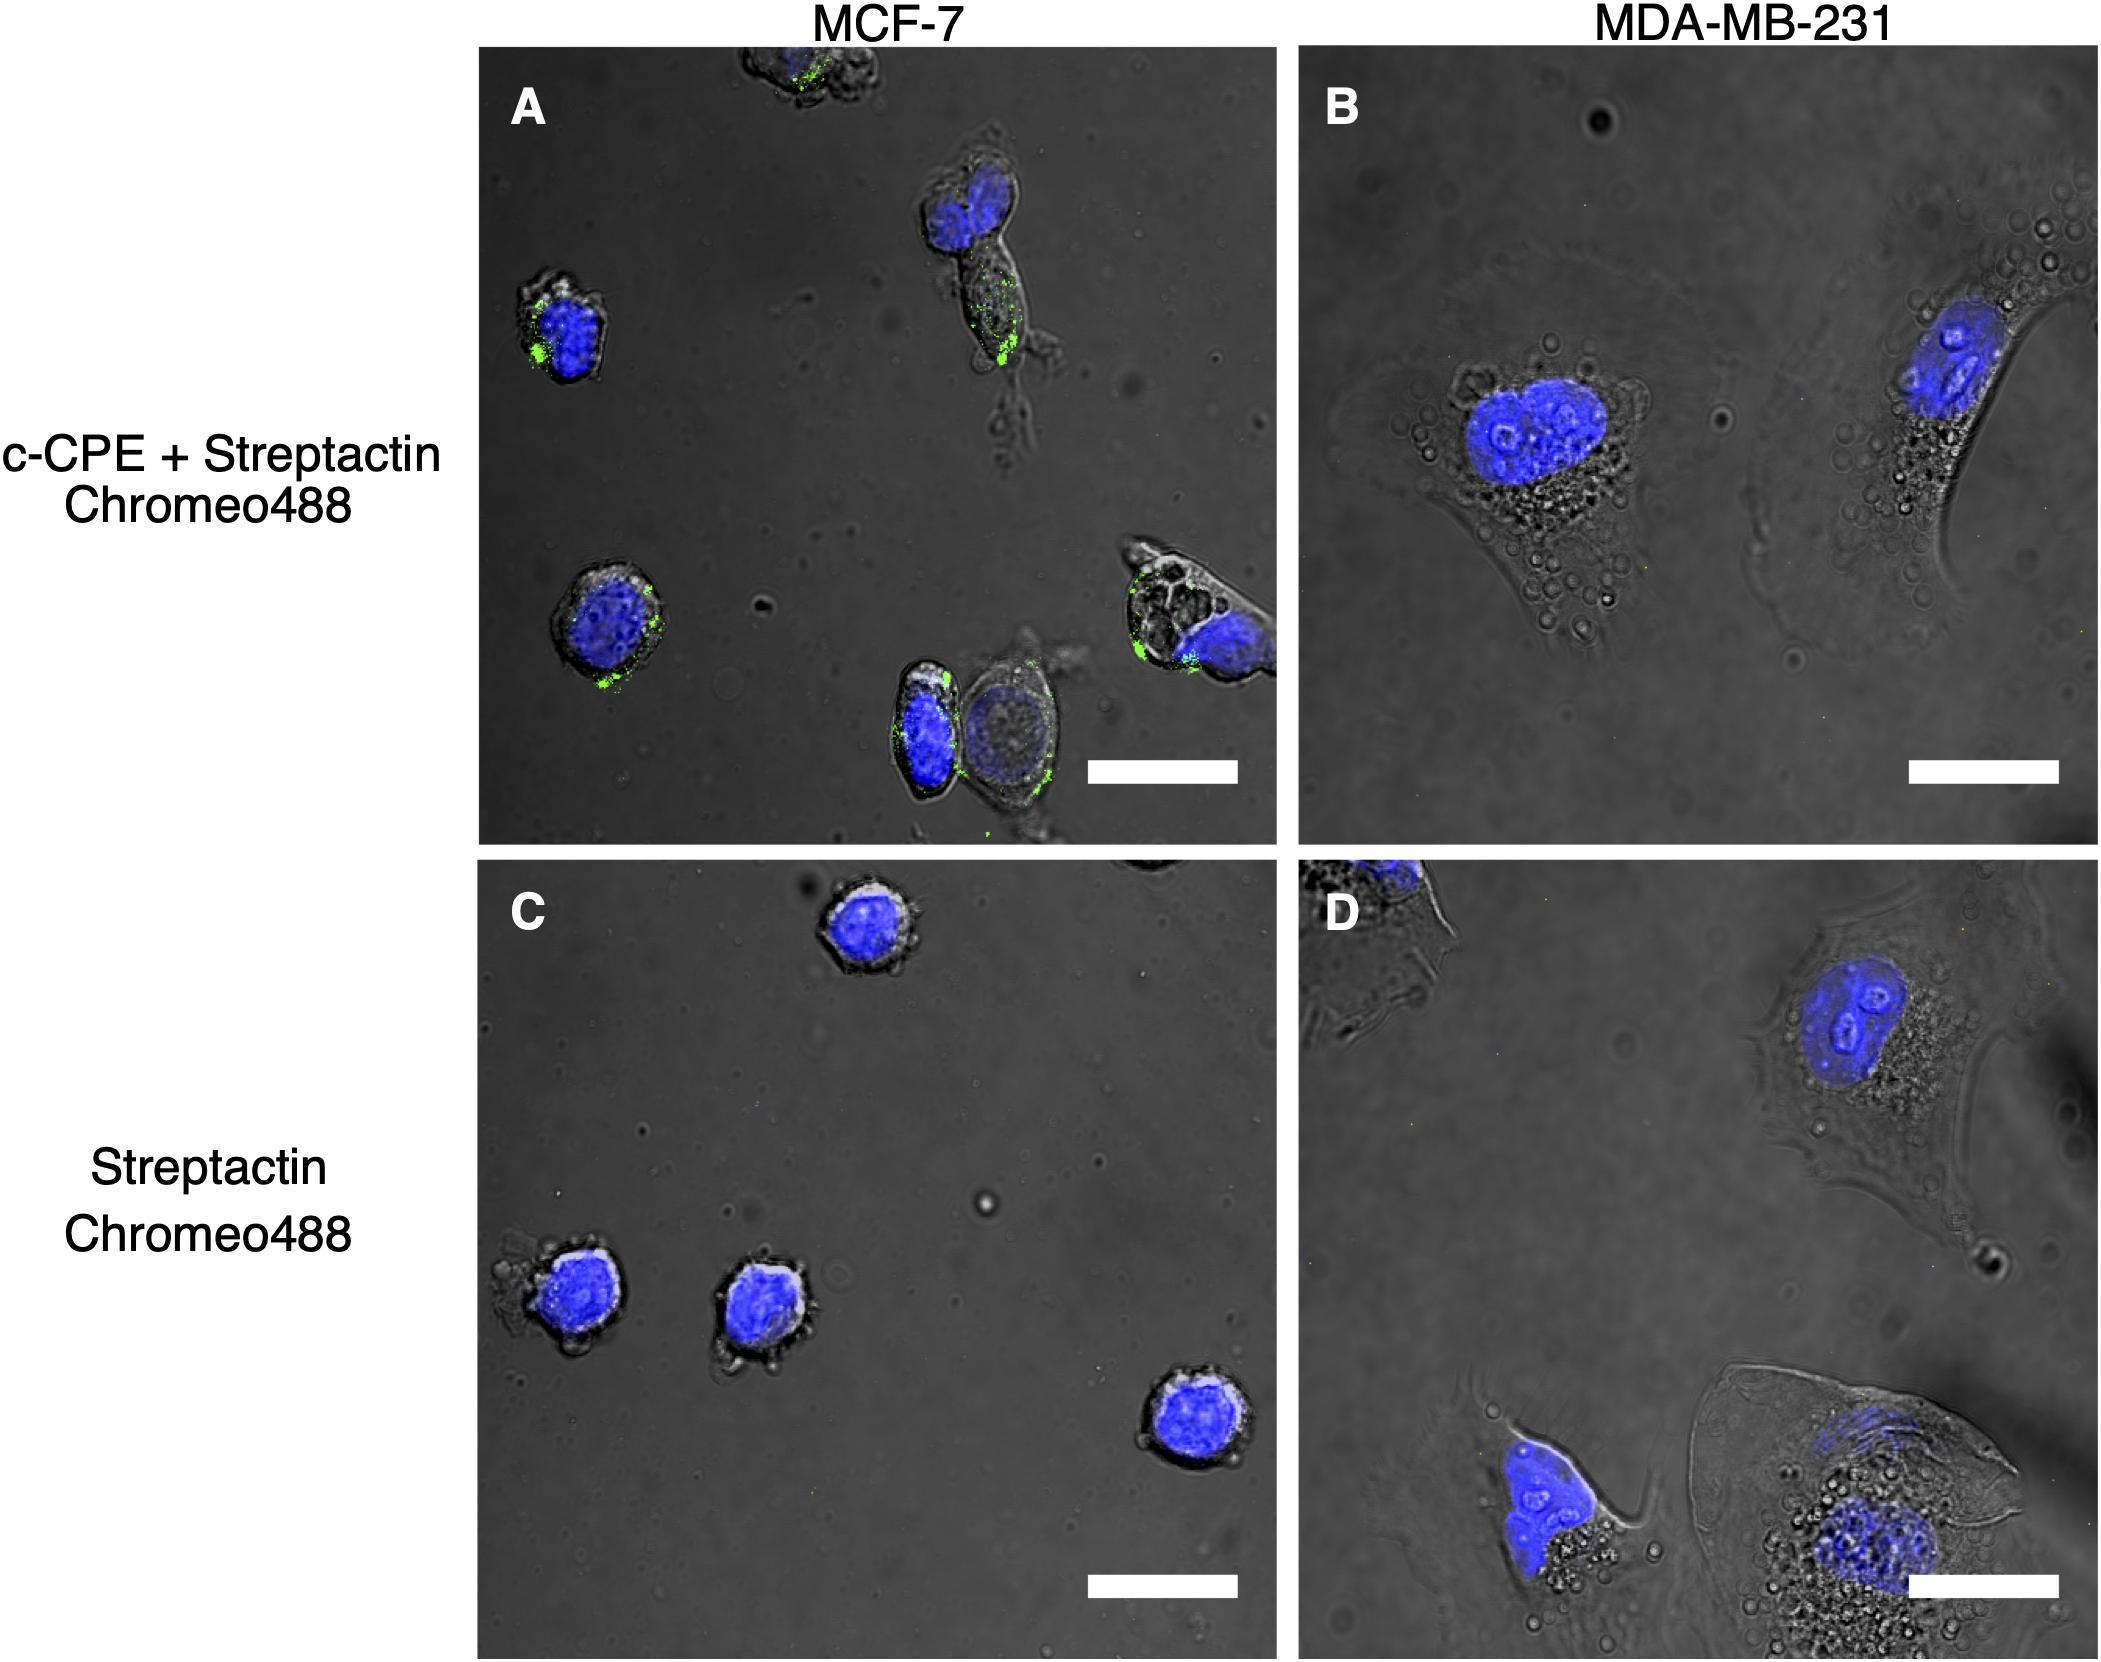
Figure 4. (A,C) Specific binding of c-CPE Strep-Tactin Chromeo 488 complex (c-CPE+ StrepTactin Chromeo 488) on claudin-3 and -4 expressing MCF-7 cells (green) 2 h after trypsinization. (B,D) No binding of c-CPE on MDA-MB-231 cells were observed. 5 μg/ml c-CPE was conjugated to Strep-Tactin Chromeo 488. Nuclei are stained with Hoechst (blue). Scale bar is 20 μm.
Calculation of Force
In order to calculate the total lateral force, a Matlab code was used to convert the recorded voltage signals from QPD, Xv Yv, to displacements. The conversion factors in both axes, βx,y were obtained from the PSD measurements and Vsum is the total voltage from the QPD. The displacements, Xm and Ym were calculated as follows:
where Xvnorm and Yvnorm are the normalized voltage signals. The forces Fx and Fy, in X and Y direction are given by the expression,
where kx and ky are the trap stiffness in X and Y direction, respectively.
As the cell surface is not necessarily perpendicular to the move direction, the total lateral force, takes into account the contribution of forces from both axes. Finally, the magnitude of the lateral force can be obtained using the following relation,
Therefore, the accuracy and precision of the total force depend largely on the displacement and trap stiffness calibration.
Measurement of Ligand Binding Strength
The previously characterized system was used to investigate the binding of c-CPE with claudins. Rupture force experiments consist of two parts, calibration and oscillation. An MCF-7 cell firmly attached to the coverslip was first located and a nearby freely floating particle was trapped at 10 μm trapping depth. The optically trapped particle was then calibrated using sampling rate 100 kHz and sampling time of 6 s. The signal’s power spectral density is automatically displayed after calibration to check for presence of debris or mechanical noise in the system. If the calibration was successful, then force measurements were started. The sample stage and therefore the cell was positioned close to the trapped particle by monitoring the external force on the particle as it was automatically step-wised positioned toward the cell. Upon reaching a force of 5 pN, an automatic oscillation procedure was implemented. The cell stays in contact with the trapped particle for 1.5 s and then retracted with an oscillation amplitude of 5 μm. Since the piezo-driven stage can only be moved in minimum step size of 5 nm, its speed is controlled indirectly via the step size and the time between these steps, 5 ms. All measurements were performed under fixed speed of 1 nm/ms. The movement toward the particle and retraction was repeated for a set number of oscillations, usually 10 for each contact position or until the sequence is terminated manually. Figures 5A,B show exemplary images of the trapping and the corresponding schematic diagram of claudin and c-CPE interaction. When binding between c-CPE and claudin receptor has occurred, upon retraction, the trapped particle is displaced from its equilibrium position. The particle snaps back to the optical trap when the bond dissociates. Figure 5C shows the lateral position distribution of the trapped particle during approach, upon contact and immediately after retraction, including the rupture event. During contact, the position distribution is displaced from the trap center due to the force of the cell membrane on the particle. Directly after retraction, the distribution shifts toward the opposite direction.
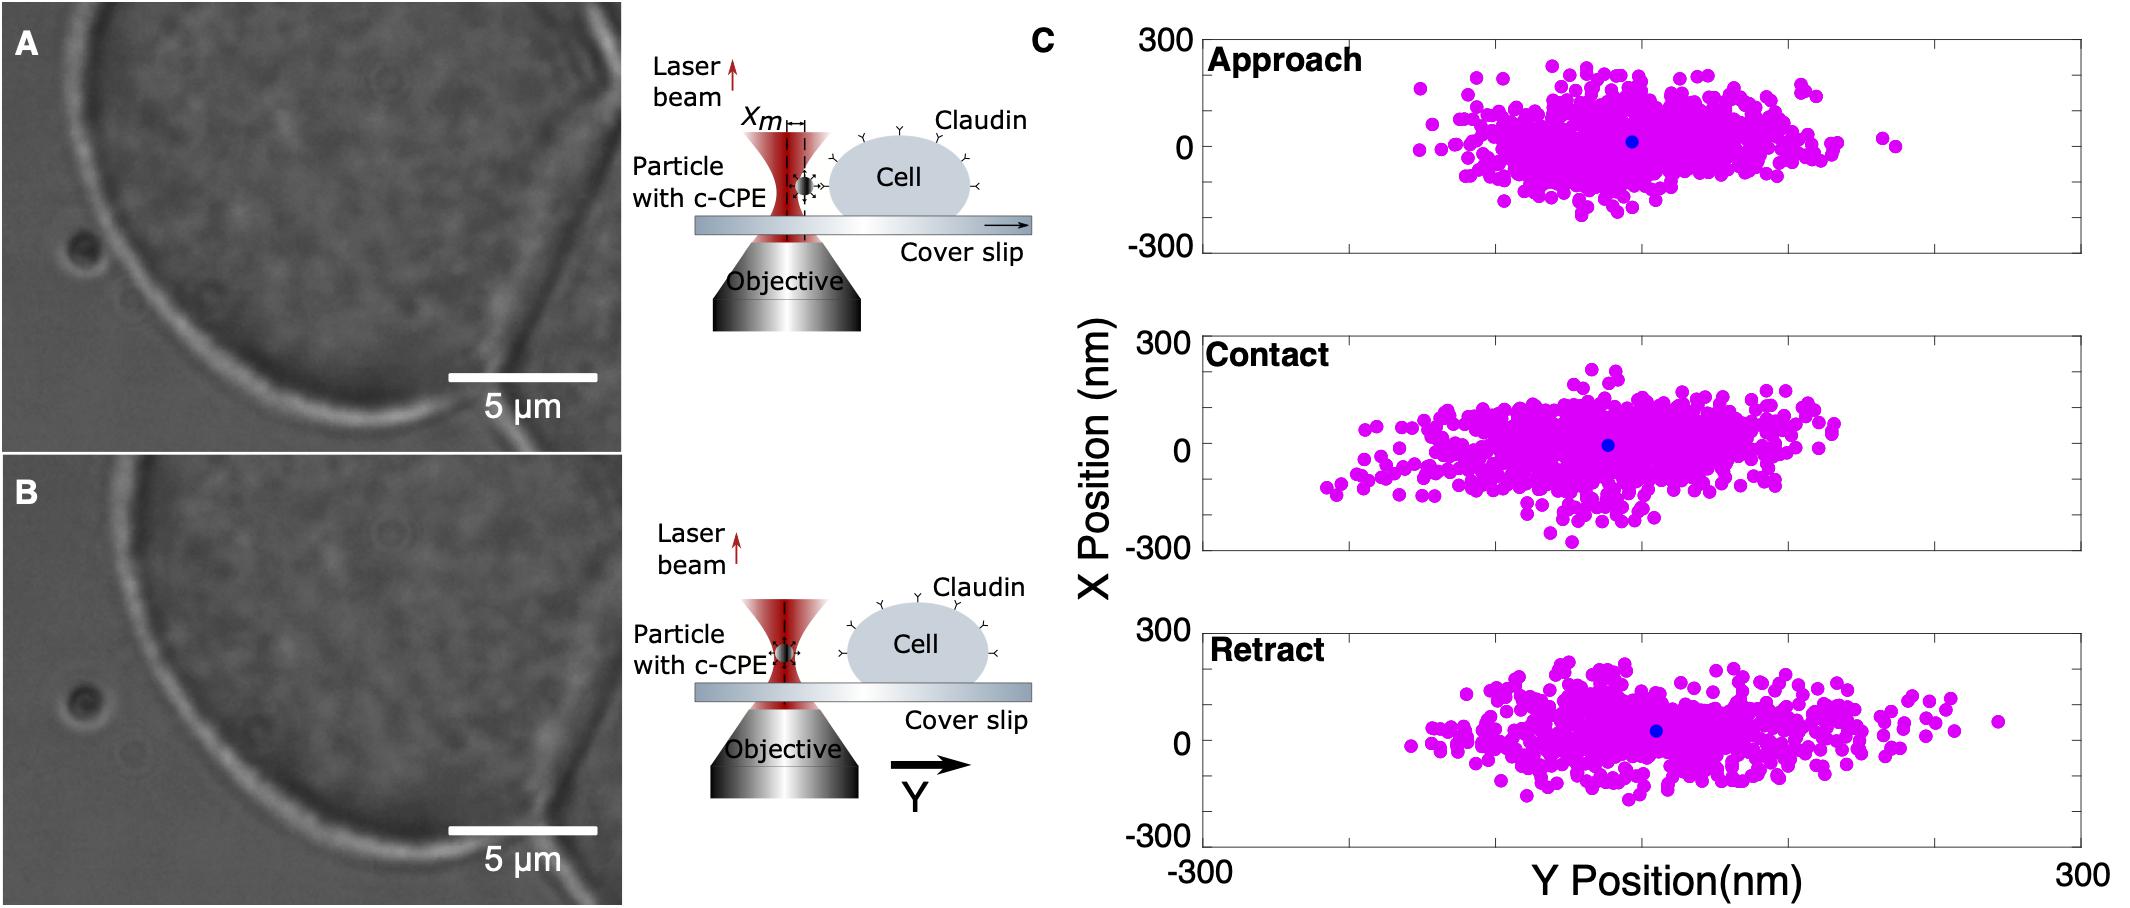
Figure 5. Experimental protocol of ligand binding strength measurement. (A) A 1 μm silica particle coated with c-CPE is held in the optical trap. The sample stage is moved to bring an MCF-7 cell into contact with the particle. (B) After 1.5 s, the cell is retracted. (C) Representative lateral position distribution of the trapped particle during approach (far from the cell), upon contact and immediately after retraction. The black circle shows the mean of the position distribution.
A typical force signal is illustrated in Figures 6A–C. In this example, the cell was moved along the stage’s Y-axis toward the c-CPE coated particle. Figures 6A,B shows that shortly before the cell contact, the particle experiences an attractive force toward the cell, depicted by a negative force value. As it approaches the cell, this changes into a strong repulsive force. During particle-cell contact, force on the particle becomes constant. While the cell is being retracted, the force reverts into an attractive force resulting in an overall force profile that appears symmetrical. As the cell surface was not perfectly perpendicular to the Y-axis, the particle was also slightly displaced in the X-direction (Figure 6A). Absolute values for the total lateral force shown in Figure 6C were computed using Equation (7). Noise was suppressed with a 100th degree median filter.
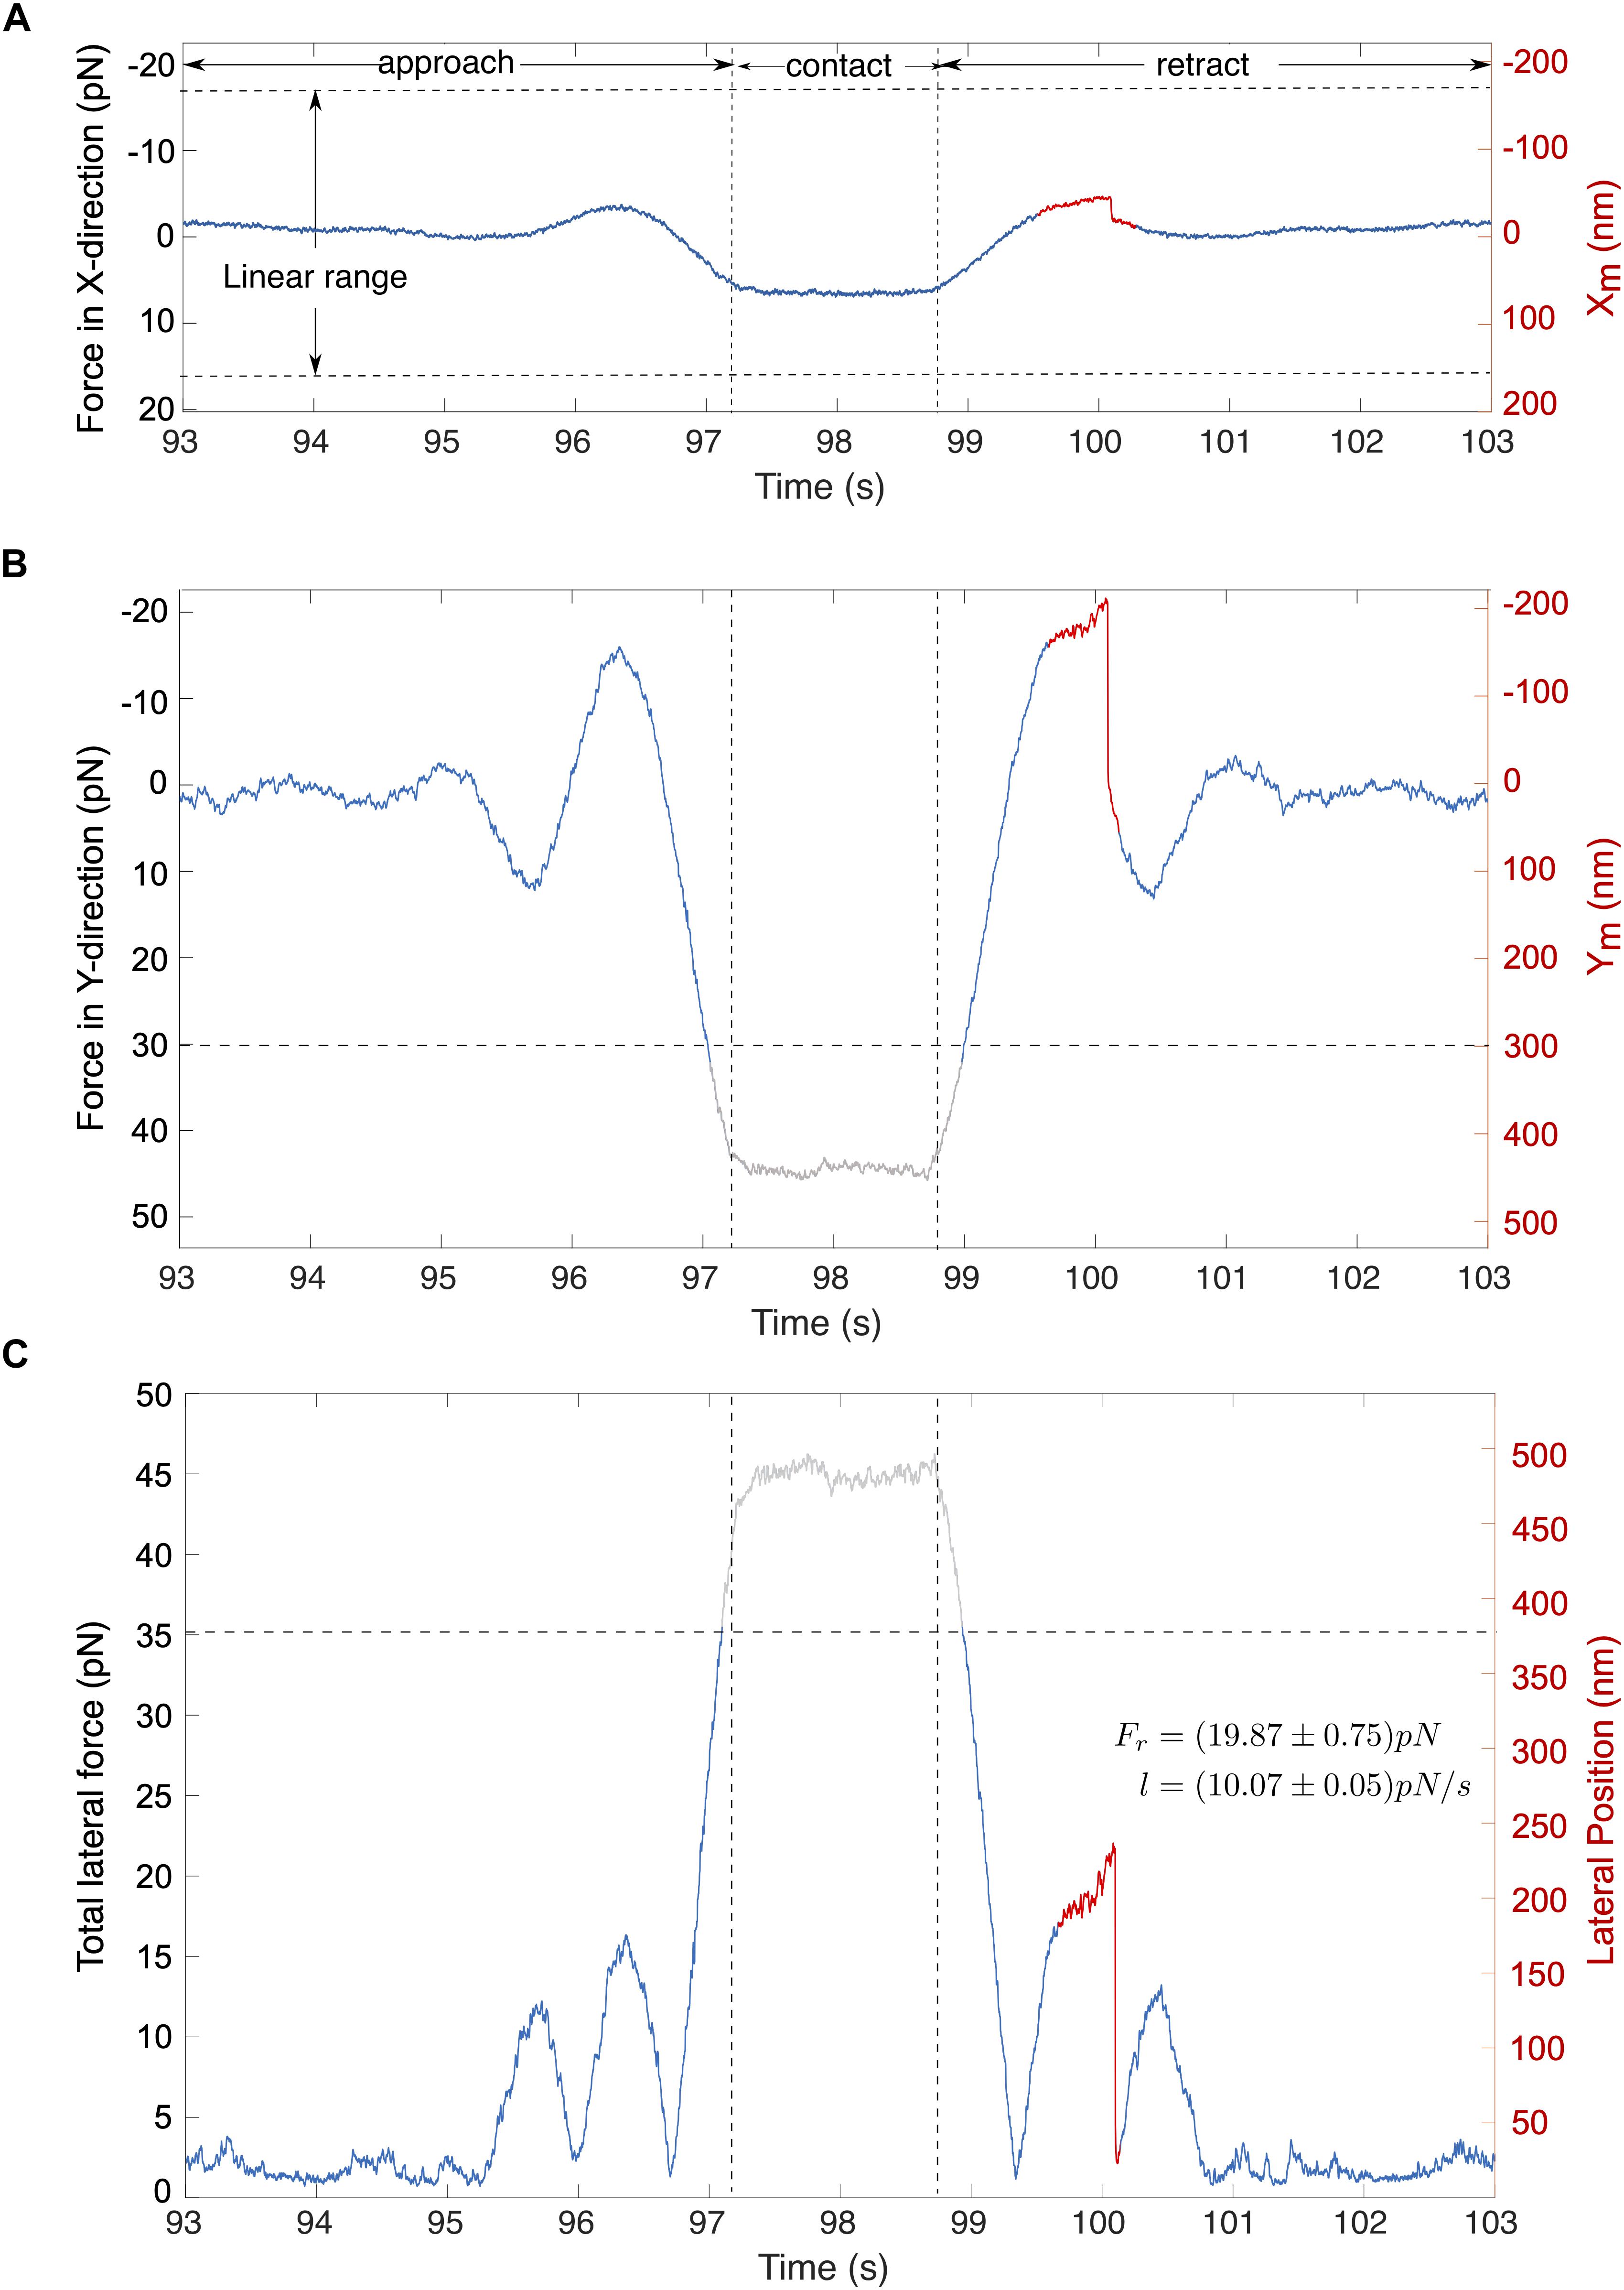
Figure 6. Typical signals for cell-particle contact. The stage oscillates in the direction of the stage’s Y-axis. (A,B) Traces show the corresponding forces in the direction of X and Y direction of the stage. (C) The total lateral force for (A,B) is shown, computed using the eq. (7). Abrupt rupture event (marked red) is observed in the total lateral force with a magnitude of Fr = 19.87 pN under a loading force (l) of l = 10.07 pN/s. Gray traces represent signals that lie outside the linear range.
Figure 7A shows example of rupture events with force magnitudes, Fr = 8.7, 11.4, and 16 pN. Prior to most rupture events, a linear increase in force occurs and a sudden drop in force indicates the dissociation of the c-CPE from claudin. In some cases, the increase in force is nonlinear as seen for 16 pN rupture event. Figure 7B shows the summary of all the rupture forces observed for c-CPE coated and unfunctionalized silica particles. The percentage of rupture events out of total contacts performed using particles with c-CPE is ≈ 2.3% (46 out of 2000 contacts). Whereas rupture events using unfunctionalized particles were ≈ 1% (19 out of 2000 contacts) performed in 100 cells for each condition. The number of rupture events increased by more than two-fold when optically trapped particle functionalized with c-CPE was used to probe MCF-7 cells. In contrast, no rupture events were observed when c-CPE coated particle was used to probe MDA-MB-231 cells (1000 contacts, 50 cells).
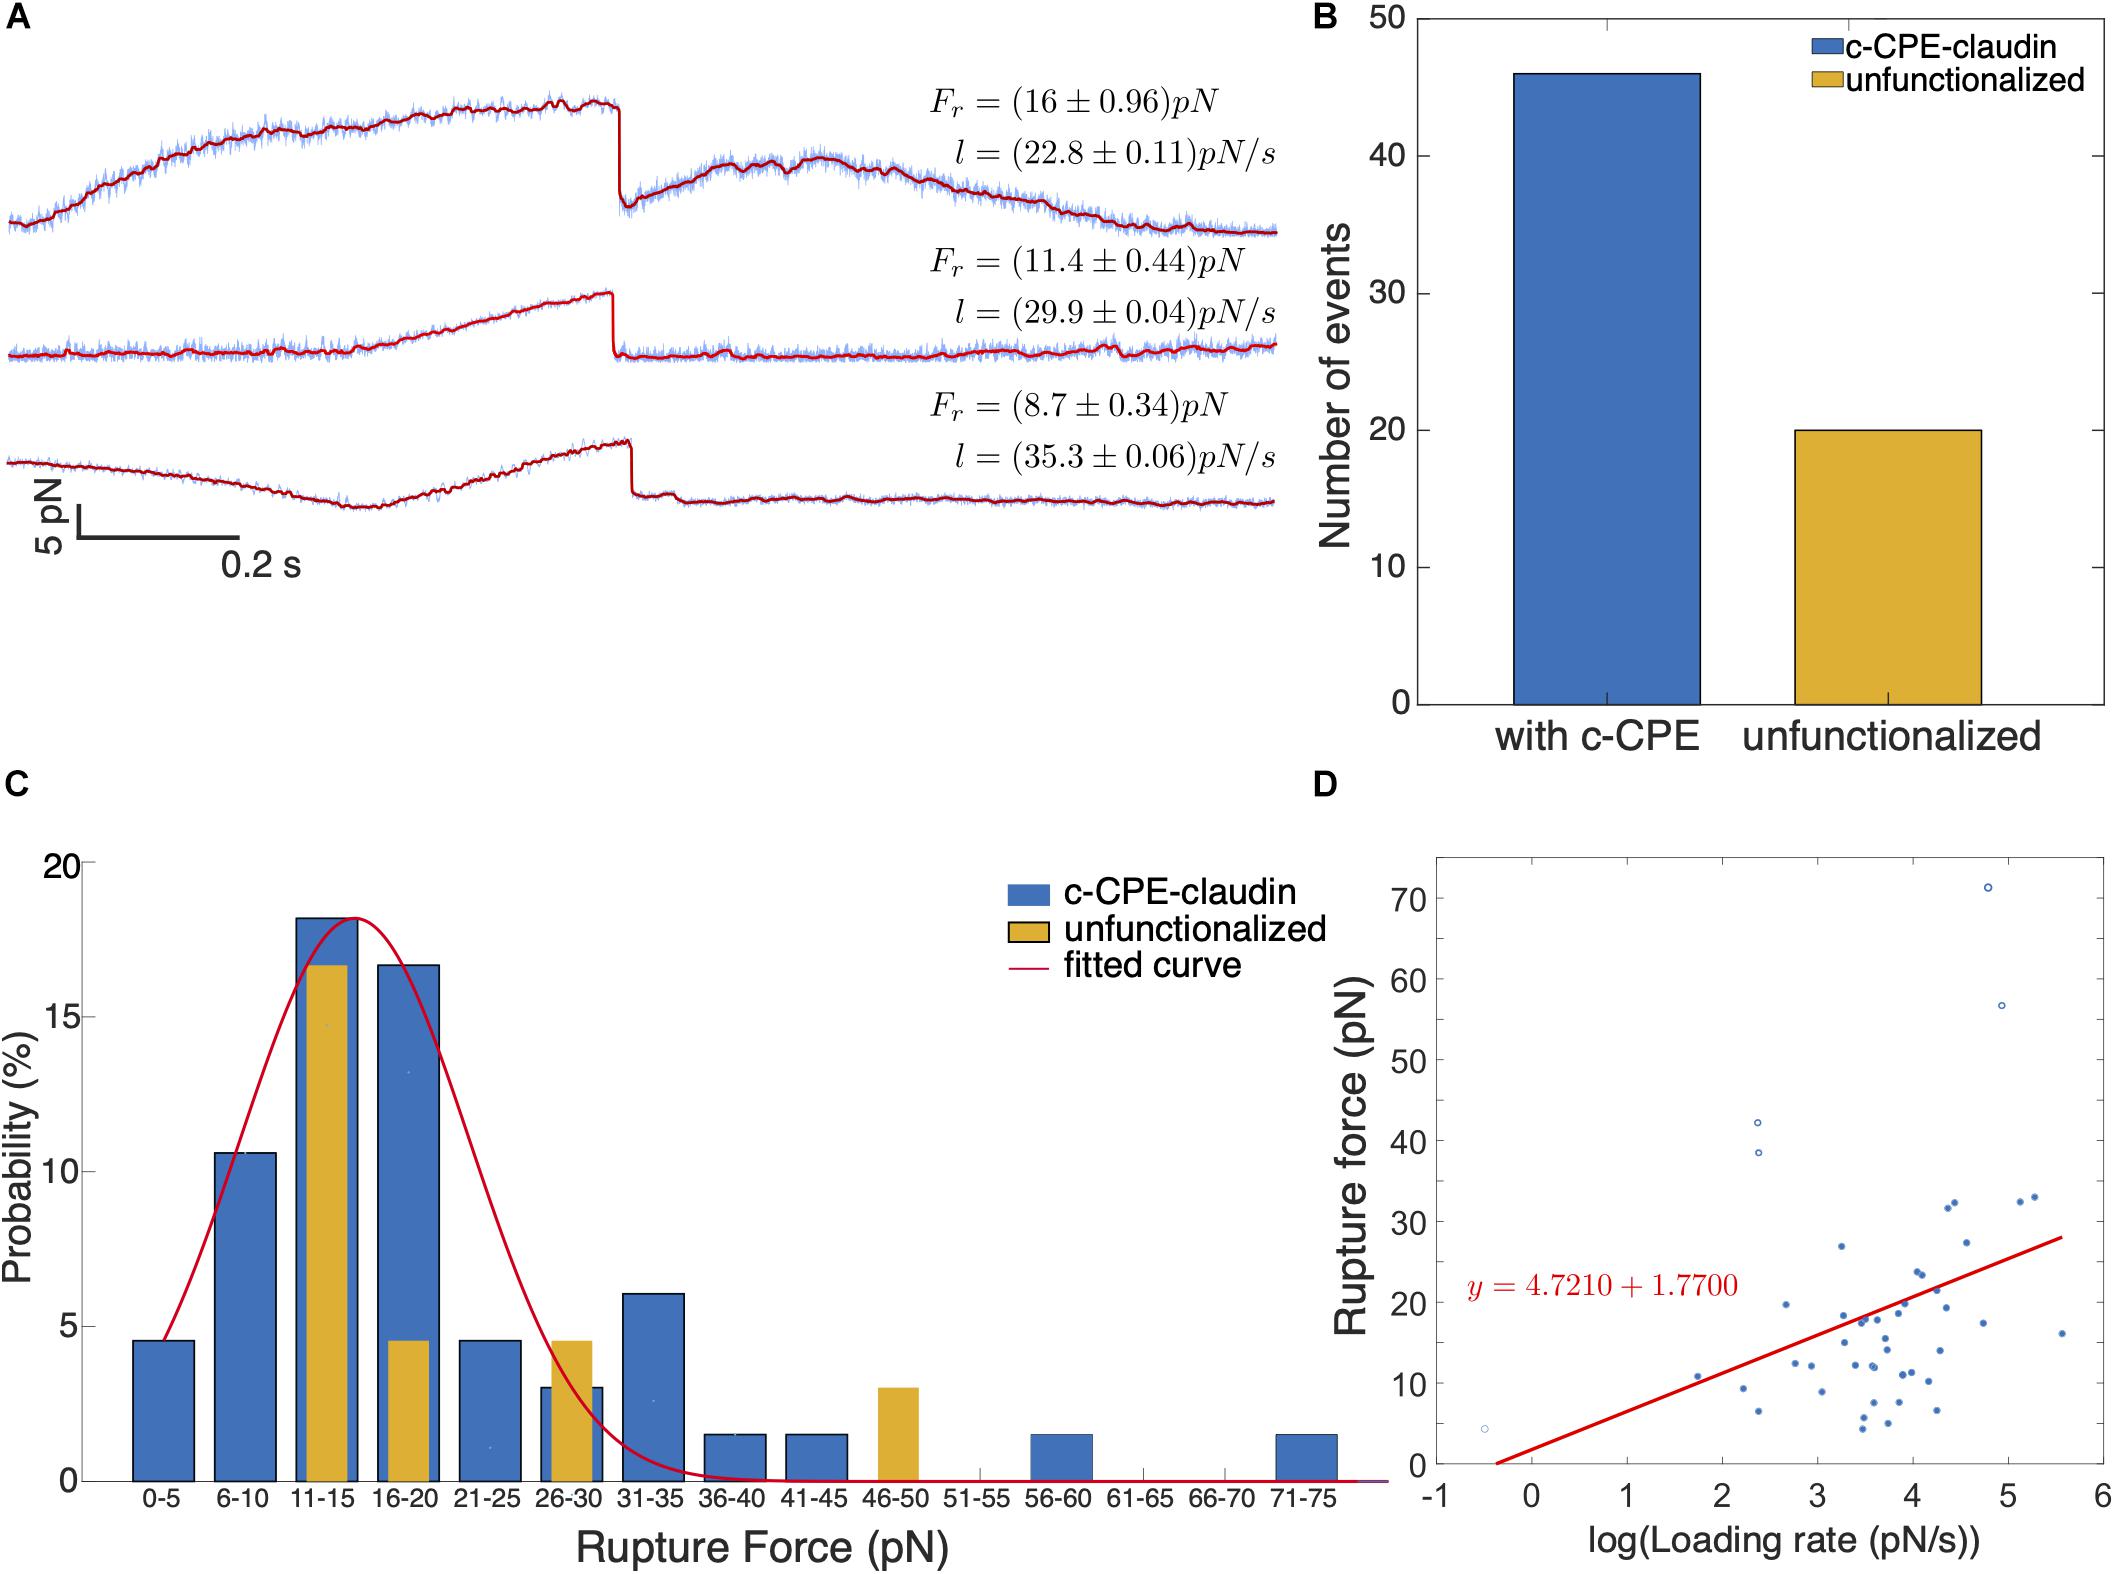
Figure 7. (A) Representative time traces of rupture force for varying loading rates. In all binding events observed, a single rupture event occurs which indicates single molecule dissociation between c-CPE and claudin. (B) Number of binding events observed with c-CPE and unfunctionalized silica particles. (C) Force spectra of rupture events as a function of rupture force binned by 5 pN interval. (D) Rupture force as a function of the logarithm of loading rate.
We plotted the probability of rupture events and binned the data by 5 pN interval. Rupture probability is defined as the percentile ratio of the number of rupture forces to the total number of rupture events. Figure 7C shows the distribution of the rupture forces. For c-CPE coated particles, the rupture forces can be fitted with a Gaussian distribution with a maximum at ≈ 18 pN and a much lower peak at 31–35 pN. Although the maximum probability of rupture events occurs for rupture forces 11–20 pN for both c-CPE coated and unfunctionalized silica particles, a higher probability of rupture force (≈ 17%) can be found at 16–20 pN probed with c-CPE coated particles, 3× more than unfunctionalized particles (≈ 4.5%). For each rupture event, the loading rate is determined from the slope of the increasing force just before the rupture event. Figure 7D shows the rupture forces as a function of the loading rate. For the range of forces obtained in our experiment, the rupture force has a linear dependence with the logarithm of the loading rate.
Discussion
Ligand binding assays play a crucial role in developing new therapeutic molecules. The binding affinity of a ligand to its target, such as a receptor in cell membrane, is an important parameter in drug development. Quantitative measurements of binding using techniques such as surface plasmon resonance, calorimetry or ELISA provide information on the dissociation constant and are based on ensemble averaging (Benoit, 2011). Some of these methods measure the binding affinity of purified receptor proteins with various ligands in solution. However, not all receptor proteins can be purified and are stably soluble in solution, and even if purified receptor proteins can be produced, they are removed from their native environment which potentially affects their functionality (Helenius et al., 2008). Optical tweezers are able to probe accessible membrane proteins in their natural biological environment providing a functional understanding of their interaction to their specific ligand.
As demonstrated in this work, optical tweezers measure rupture forces between membrane receptors and their ligands with forces less than 100 pN. The calibration of trap stiffness and the displacement of the trapped particles from their equilibrium position play a crucial role in the accuracy of the rupture forces measured. Power spectral density method provides a relatively straightforward method to perform the calibration. It does not require information regarding the viscosity as well as omits the necessity of performing position calibration. In our work, we performed calibration for the trap stiffness and β for every trapped particle used in the cell contact experiments. This approach reduces the uncertainty on these parameters which enables more accurate rupture force measurements.
Since most of the rupture forces obtained in our experiments are below 40 pN, optical tweezers are sufficient for probing receptor-ligand binding interaction at slow loading rates <100 pN/s. In our system, the maximum rupture force measured within the linear range of the displacement measurement is ≈ 40 pN using position calibration. Displacement range increases by performing third order polynomial fit to the lateral position calibration, wherein the measurable maximum rupture force is ≈ 60 pN. However, additional errors are present in position calibration due to the necessity of manual focusing of the particle and the broad particle size distribution. Additionally, the particle used for position calibration cannot be used for cell contact experiments. Using β, as well as k directly derived from the PSD for every particle minimizes any error due to particle size variability. By direct force calibration method using a position sensitive detector and a high numerical aperture condenser, it is also possible to obtain a ß value which is robust under changes in particle size and refractive index (Farré et al., 2012).
We demonstrate that specific interaction between c-CPE and claudin receptors in MCF-7 cells can be observed by measuring the single molecule binding events using optical tweezers. Despite the thousands of contacts performed, only limited rupture events were observed (≈2.3%), precluding us from obtaining huge number of measurements for statistical purposes. Yet, rupture forces between c-CPE and claudin in MCF-7 cells can be fitted with a Gaussian distribution profile with a mean rupture force of ≈18 pN. Distribution of forces present when c-CPE functionalized silica particles was used to probe claudin in MCF-7 show smaller rupture forces with magnitudes <10 pN as well as higher probability of rupture forces in the range of 16–20 pN not present in non-functionalized silica particles. Both coated and unfunctionalized particles exhibit high probability of rupture forces between 10 and 15 pN which could be interpreted as non-specific binding between the particles and cell membrane. Nonetheless, the force spectra obtained with c-CPE functionalized particles is distinct from non-functionalized particles.
In comparison to other single molecule binding experiments with optical tweezers, rupture forces for c-CPE and claudin were in the same range of values as other receptor-ligand complexes. For example, rupture forces derived for fibronectin-integrin linkages were 13–28 pN at loading rates of 5–100 pN/s (Thoumine et al., 2000). Meanwhile a force spectrum with a most probable rupture force at 19 pN was obtained from cells expressing Notch ligand Delta-like 1 and Notch 1 functionalized optically trapped particles at loading rates of 250 pN/s (Shergill et al., 2012). Hence, for single molecule experiments with optical tweezers, the probable rupture forces for different receptor-ligand complexes occur within the same range of force values.
The rupture force as a function of the logarithm of loading rate depicts the potential energy landscape of the c-CPE to claudin bond. The Bell-Evans model, describes a single barrier potential wherein the rupture force, Fr exponentially increases as a function of the rate of applied force, more commonly known as the loading rate, l, given by the equation,
where kB is the Boltzmann’s constant, T is the absolute temperature, xβ is the distance between bound and transition state (or the potential width) along the reaction coordinate and is the zero-force dissociation constant (Evans and Ritchie, 1997; Merkel et al., 1999). The extrapolated values xβ and quantify the energy landscape and the kinetic parameters of the bond complex, respectively.
Using linear regression model, we extracted the values xβ = (0.872 ± 0.34) nm and = (0.1455 ± 0.2) s–1 for c-CPE and claudin bond. These values are within the same range derived from dynamic force measurements using optical tweezers measured for other bond complexes (Arya et al., 2005). Dissociation constant at zero-force for c-CPE and claudin 9 measured using bio-layer interferometry method is = 1.67 × 10– 4 s–1 (Vecchio and Stroud, 2019). In comparison to our extrapolated , the value obtained from ensemble- based measurement is three orders of magnitude smaller, implying a higher bond affinity and a much slower dissociation time constant. However, it has been known that dissociation constants at zero force derived among different single molecule studies can vary and can have huge discrepancies to ensemble measurements (Rico et al., 2019). For example, for the well-characterized high affinity streptavidin-biotin bond, the dissociation constants range from to 10−6 s– 1 measured by atomic force microscopy (AFM) (Yuan et al., 2000; Taninaka et al., 2010; Rico et al., 2019). On the other hand, ensemble bond lifetime measurements of off-rate can vary between ≈10−4 to 10−6 s– 1 (Deng et al., 2013). Techniques used for ensemble measurements have their own limitations and must be kept in mind when comparing with single-molecule results especially at extremely low values (Morfill et al., 2007).
The stochastic nature of single molecule binding typically requires significantly large number of rupture events to accurately model the response of the bond complex to force (Hinterdorfer and Dufrêne, 2006; Johnson and Thomas, 2018). In our experiments, this is quite challenging since not every contact induces binding resulting to bond dissociation. The one barrier model, we have used as well as many others, provides a simplistic approach to quantitatively measure the bond energy profile. Yet, reports have also shown that bond rupture may be more complex and that force applied could introduce other events such as intermediate states during unbinding (Rico et al., 2019), formation of catch bonds (Marshall et al., 2003), distortion of energy pathway (Suzuki and Dudko, 2011) or generation of multiple energy barriers (Merkel et al., 1999; Boye et al., 2013). Since the observed rupture forces have a one-step profile, we interpreted these dissociations as single molecule-rupture events. Future single-molecule experiments would be needed in order to fully elucidate the complex interaction between c-CPE and claudin.
Data Availability Statement
The raw data supporting the conclusions of this article will be made available by the authors, without undue reservation, to any qualified researcher.
Author Contributions
MT-M, AH, and AN conceived the experiments. MT-M and AN designed the experiments. CR and CI-V performed the experiments and analyzed the data. AB performed immunostaining and produced the c-CPE. MT-M, CR, CI-V, and MD interpreted the results. MT-M and CR drafted the manuscript with contribution from all co-authors. All authors read and approved the manuscript.
Funding
This work was supported by the German Research Foundation, Germany Clusters of Excellence: REBIRTH (EXC 62) and Hearing4all (EXC 2177). MT-M acknowledges the support of Caroline Herschel Program from the Hochschulbüro für Chancenvielfalt, Leibniz University Hannover.
Conflict of Interest
The authors declare that the research was conducted in the absence of any commercial or financial relationships that could be construed as a potential conflict of interest.
References
Alberts, B., Johnson, A., Lewis, J., Raff, M., Roberts, K., and Walter, P. et al. (2002). “Cell junctions,” in Molecular Biology of the Cell, 4th Edn. (New York, NY: Garland Science). Available online at: https://www.ncbi.nlm.nih.gov/books/NBK26857/
Arya, M., Kolomeisky, A. B., Romo, G. M., Cruz, M. A., López, J. A., and Anvari, B. (2005). Dynamic force spectroscopy of glycoprotein Ib-IX and von Willebrand factor. Biophys. J. 88, 4391–4401. doi: 10.1529/biophysj.104.046318
Becker, A., Lehrich, T., Kalies, S., Heisterkamp, A., and Ngezahayo, A. (2019). Parameters for optoperforation-induced killing of cancer cells using gold nanoparticles functionalized with the c-terminal fragment of Clostridium perfringens enterotoxin. Int. J. Mol. Sci. 20:4248. doi: 10.3390/ijms20174248
Becker, A., Leskau, M., Schlingmann-Molina, B. L., Hohmeier, S. C., Alnajjar, S., Escobar, H. M., et al. (2018). Functionalization of gold-nanoparticles by the Clostridium perfringens enterotoxin C-terminus for tumor cell ablation using the gold nanoparticle-mediated laser perforation technique. Sci. Rep. 8:14963. doi: 10.1038/s41598-018-33392-0
Benoit, M. (2011). “Force spectroscopy on cells,” in Handbook of Nanophysics: Nanomedicine and Nanorobotics, ed. K. Sattler (Boca Raton, FL: CRC Press), 9-1–9–29.
Berg-Sørensen, K., and Flyvbjerg, H. (2004). Power spectrum analysis for optical tweezers. Rev. Sci. Instrum. 75, 594–612. doi: 10.1063/1.1645654
Boye, K., Ligezowska, A., Eble, J. A., Hoffmann, B., Klösgen, B., and Merkel, R. (2013). Two barriers or not? Dynamic force spectroscopy on the integrin α7β1invasin complex. Biophys. J. 105, 2771–2780. doi: 10.1016/j.bpj.2013.10.030
Capitanio, M., and Pavone, F. S. (2013). Interrogating biology with force: single molecule high-resolution measurements with optical tweezers. Biophys. J. 105, 1293–1303. doi: 10.1016/j.bpj.2013.08.007
Deng, L., Kitova, E. N., and Klassen, J. S. (2013). Dissociation kinetics of the streptavidin-biotin interaction measured using direct electrospray ionization mass spectrometry analysis. J. Am. Soc. Mass Spectrom. 24, 49–56. doi: 10.1007/s13361-012-0533-5
Evans, E., and Ritchie, K. (1997). Dynamic strength of molecular adhesion bonds. Biophys. J. 72, 1541–1555. doi: 10.1016/S0006-3495(97)78802-7
Farré, A., Marsà, F., and Montes-Usategui, M. (2012). Optimized back-focal-plane interferometry directly measures forces of optically trapped particles. Opt. Express 20:12270. doi: 10.1364/oe.20.012270
Gao, Z., and McClane, B. A. (2011). Use of Clostridium perfringens enterotoxin and the enterotoxin receptor-binding domain (C-CPE) for cancer treatment: opportunities and challenges. J. Toxicol. 2012:981626. doi: 10.1155/2012/981626
Gao, Z., Xu, X., McClane, B., Zeng, Q., Litkouhi, B., Welch, W. R., et al. (2011). C terminus of Clostridium perfringens enterotoxin downregulates CLDN4 and sensitizes ovarian cancer cells to taxol and carboplatin. Clin. Cancer Res. 17, 1065–1074. doi: 10.1158/1078-0432.CCR-10-1644
Günzel, D., and Yu, A. S. L. (2013). Claudins and the modulation of tight junction permeability. Physiol Rev. 93, 525–569. doi: 10.1152/physrev.00019.2012
Hansen, P. M., Tolic-Nørrelykke, I. M., Flyvbjerg, H., and Berg-Sørensen, K. (2006). tweezercalib 2.1: faster version of MatLab package for precise calibration of optical tweezers. Comput. Phys. Commun. 175, 572–573. doi: 10.1016/j.cpc.2006.07.009
Helenius, J., Heisenberg, C. P., Gaub, H. E., and Muller, D. J. (2008). Single-cell force spectroscopy. J. Cell Sci. 121, 1785–1791. doi: 10.1242/jcs.030999
Hinterdorfer, P., and Dufrêne, Y. F. (2006). Detection and localization of single molecular recognition events using atomic force microscopy. Nat. Methods 3, 347–355. doi: 10.1038/nmeth871
Johnson, K. C., and Thomas, W. E. (2018). How do we know when single-molecule force spectroscopy really tests single bonds? Biophys. J. 114, 2032–2039. doi: 10.1016/j.bpj.2018.04.002
Kominsky, S. L., Argani, P., Korz, D., Evron, E., Raman, V., Garrett, E., et al. (2003). Loss of the tight junction protein claudin-7 correlates with histological grade in both ductal carcinoma in situ and invasive ductal carcinoma of the breast. Oncogene 22, 2021–2033. doi: 10.1038/sj.onc.1206199
Litvinov, R. I., Shuman, H., Bennett, J. S., and Weisel, J. W. (2002). Binding strength and activation state of single fibrinogen-integrin pairs on living cells. Proc. Natl. Acad. Sci. U.S.A. 99, 7426–7431. doi: 10.1073/pnas.112194999
Madadi, E., Samadi, A., Cheraghian, M., and Reihani, S. N. S. (2012). Polarization-induced stiffness asymmetry of optical tweezers. Opt. Lett. 37, 3519–3521. doi: 10.1364/ol.37.003519
Marshall, B. T., Long, M., Piper, J. W., Yago, T., McEver, R. P., and Zhu, C. (2003). Direct observation of catch bonds involving cell-adhesion molecules. Nature 423, 190–193. doi: 10.1038/nature01605
Merkel, R., Nassoy, P., Leung, A., Ritchie, K., and Evans, E. (1999). Energy landscapes of receptor-ligand bonds explored with dynamic force spectroscopy. Nature 397, 50–53. doi: 10.1038/16219
Mitchell, L. A., and Koval, M. (2010). Specificity of Interaction between Clostridium perfringens Enterotoxin and Claudin-Family tight junction proteins. Toxins 2, 1595–1611. doi: 10.3390/toxins2071595
Morfill, J., Blank, K., Zahnd, C., Luginbühl, B., Kühner, F., Gottschalk, K. E., et al. (2007). Affinity-matured recombinant antibody fragments analyzed by single-molecule force spectroscopy. Biophys. J. 93, 3583–3590. doi: 10.1529/biophysj.107.112532
Neuhaus, W., Piontek, A., Protze, J., Eichner, M., Mahringer, A., Subileau, E. A., et al. (2018). Reversible opening of the blood-brain barrier by claudin-5-binding variants of Clostridium perfringens enterotoxin’s claudin-binding domain. Biomaterials 161, 129–143. doi: 10.1016/j.biomaterials.2018.01.028
Neuman, K. C., and Block, S. M. (2004). Optical trapping. Rev. Sci. Instrum. 75, 2787–2809. doi: 10.1063/1.1785844
Neuman, K. C., and Nagy, A. (2008). Single-molecule force spectroscopy: optical tweezers, magnetic tweezers and atomic force microscopy. Nat. Methods 5, 491–505. doi: 10.1038/nmeth.1218
Nicholas, M. P., Rao, L., and Gennerich, A. (2014). An improved optical tweezers assay for measuring the force generation of single kinesin molecules. Methods Mol. Biol. 1136, 171–246. doi: 10.1007/978-1-4939-0329-0_10
Pralle, A., Prummer, M., Florin, E. L., Stelzer, E. H., and Hörber, J. K. (1999). Three-dimensional high-resolution particle tracking for optical tweezers by forward scattered light. Microsc. Res. Tech. 44, 378–386. doi: 10.1002/(SICI)1097-0029(19990301)44:5<378::AID-JEMT10<3.0.CO;2-Z
Rico, F., Russek, A., González, L., Grubmüller, H., and Scheuring, S. (2019). Heterogeneous and rate-dependent streptavidin–biotin unbinding revealed by high-speed force spectroscopy and atomistic simulations. Proc. Natl. Acad. Sci. U.S.A. 116, 6594–6601. doi: 10.1073/pnas.1816909116
Shergill, B., Meloty-Kapella, L., Musse, A. A., Weinmaster, G., and Botvinick, E. (2012). Optical tweezers studies on notch: single-molecule interaction strength is independent of ligand endocytosis. Dev. Cell 22, 1313–1320. doi: 10.1016/j.devcel.2012.04.007
Shrestha, A., Uzal, F. A., and McClane, B. A. (2016). The interaction of Clostridium perfringens enterotoxin with receptor claudins. Anaerobe 41, 18–26. doi: 10.1016/j.anaerobe.2016.04.011
Stangner, T., Singer, D., Wagner, C., Gutsche, C., Ueberschär, O., Hoffmann, R., et al. (2013). FACS-sorted particles reduce the data variance in optical tweezers-assisted dynamic force spectroscopy measurements. Phys. Biol. 10:046004. doi: 10.1088/1478-3975/10/4/046004
Suzuki, Y., and Dudko, O. K. (2011). Biomolecules under mechanical stress: a simple mechanism of complex behavior. J. Chem. Phys. 134:065102. doi: 10.1063/1.3533366
Taninaka, A., Takeuchi, O., and Shigekawa, H. (2010). Reconsideration of dynamic force spectroscopy analysis of streptavidin-biotin interactions. Int. J. Mol. Sci. 11, 2134–2151. doi: 10.3390/ijms11052134
Thoumine, O., Kocian, P., Kottelat, A., and Meister, J. J. (2000). Short-term binding of fibroblasts to fibronectin: optical tweezers experiments and probabilistic analysis. Eur. Biophys. J. 29, 398–408. doi: 10.1007/s002490000087
Todd, M. C., Petty, H. M., King, J. M., Piana Marshall, B. N., Sheller, R. A., and Cuevas, M. E. (2015). Overexpression and delocalization of claudin-3 protein in MCF-7 and MDA-MB-415 breast cancer cell lines. Oncol. Lett. 10, 156–162. doi: 10.3892/ol.2015.3160
Van Itallie, C. M., and Anderson, J. M. (2013). Claudin interactions in and out of the tight junction. Tissue Barriers 1:e25247. doi: 10.4161/tisb.25247
Vecchio, A. J., and Stroud, R. M. (2019). Claudin-9 structures reveal mechanism for toxin-induced gut barrier breakdown. Proc. Natl. Acad. Sci. U.S.A. 116, 17817–17824. doi: 10.1073/pnas.1908929116
Veshnyakova, A., Protze, J., Rossa, J., Blasig, I. E., Krause, G., and Piontek, J. (2010). On the interaction of Clostridium perfringens enterotoxin with claudins. Toxins 2, 1336–1356. doi: 10.3390/toxins2061336
Keywords: optical tweezers, C-CPE, claudin, force spectroscopy, ligand, cell receptors
Citation: Riesenberg C, Iriarte-Valdez CA, Becker A, Dienerowitz M, Heisterkamp A, Ngezahayo A and Torres-Mapa ML (2020) Probing Ligand-Receptor Interaction in Living Cells Using Force Measurements With Optical Tweezers. Front. Bioeng. Biotechnol. 8:598459. doi: 10.3389/fbioe.2020.598459
Received: 24 August 2020; Accepted: 01 October 2020;
Published: 17 November 2020.
Edited by:
Daryl Preece, University of California, San Diego, United StatesReviewed by:
Jochen Fick, UPR 2940 Institut Neel (NEEL), FranceFernando Soto, Stanford University, United States
Copyright © 2020 Riesenberg, Iriarte-Valdez, Becker, Dienerowitz, Heisterkamp, Ngezahayo and Torres-Mapa. This is an open-access article distributed under the terms of the Creative Commons Attribution License (CC BY). The use, distribution or reproduction in other forums is permitted, provided the original author(s) and the copyright owner(s) are credited and that the original publication in this journal is cited, in accordance with accepted academic practice. No use, distribution or reproduction is permitted which does not comply with these terms.
*Correspondence: Maria Leilani Torres-Mapa, dG9ycmVzQGlxby51bmktaGFubm92ZXIuZGU=
†These authors have contributed equally to this work