 David L. Halaney1
 Hamidreza Fallah
 Thomas E. Milner
- 1Laboratory of Guillermo Aguilar, Department of Mechanical Engineering, University of California, Riverside, Riverside, CA, United States
- 2Laboratory of Thomas Milner, Department of Biomedical Engineering, University of Texas, Austin, TX, United States
- 3Department of Physics, University of Isfahan, Isfahan, Iran
Transparent “Window to the Brain” (WttB) cranial implants made from a biocompatible ceramic, nanocrystalline Yttria-Stabilized Zirconia (nc-YSZ), were recently reported. These reports demonstrated chronic brain imaging across the implants in mice using optical coherence tomography (OCT) and laser speckle imaging. However, optical properties of these transparent cranial implants are neither completely characterized nor completely understood. In this study, we measure optical properties of the implant using a swept source OCT system with a spectral range of 136 nm centered at 1,300 nm to characterize the group refractive index of the nc-YSZ window, over a narrow range of temperatures at which the implant may be used during imaging or therapy (20–43°C). Group refractive index was found to be 2.1–2.2 for OCT imaging over this temperature range. Chromatic dispersion for this spectral range was observed to vary over the sample, sometimes flipping signs between normal and anomalous dispersion. These properties of nc-YSZ should be considered when designing optical systems and procedures that propagate light through the window, and when interpreting OCT brain images acquired across the window.
Introduction
Neurosurgeries often involve craniectomy (removal of a portion of the cranial bone) to gain access to the brain for therapy, followed by the placement of a cranial implant to replace the excised bone. Cranial implants are normally made from a variety of materials including metals, polymers, and ceramics, and provide mechanical protection to the underlying brain tissue (Bonda et al., 2015). To our knowledge, current cranial implants available to patients lack optical transparency which could allow for brain optical imaging or therapy without implant removal or additional open skull procedures. We recently introduced a novel optically transparent cranial implant made from a biocompatible ceramic, nanocrystalline Yttria-Stabilized Zirconia (nc-YSZ), which we refer to as the “Window to the Brain” (WttB) implant (Davoodzadeh et al., 2018, 2019a,b; Cano-Velázquez et al., 2019). We have demonstrated chronic brain imaging across this implant in vivo usingoptical coherence tomography (OCT) (Halaney et al., 2020). OCT is an imaging technique based on broadband near-infrared light which can penetrate into scattering media such as brain tissue underlying the WttB implant. However, optical properties of these transparent cranial implants are neither completely characterized nor completely understood. Fundamental optical properties of the implant such as the group refractive index and chromatic dispersion are important to consider when planning or designing time-based and/or multispectral imaging strategies across the window, and for correct interpretation of recorded brain images. The group refractive index describes the speed at which a light wavepacket travels through the window, and is important to consider when focusing light across the window as well as when interpreting OCT images, where on-axis dimensions of reconstructed images are determined by time-of-flight of the OCT wavepacket. Chromatic dispersion also effects the quality of images recorded with broadband light sources like the ones used to record OCT images. Characterizing variation of group refractive index and chromatic dispersion will allow development of dispersion compensation techniques for obtaining higher quality OCT images. Furthermore, design of other multispectral imaging strategies that utilize cranial implant windows will be impacted by the group refractive index and chromatic dispersion.
Methods to measure refractive index include non-interferometric methods and interferometric methods. Non-interferometric methods include the use of index matching liquids, and refractometers. Index matching liquids are not ideal for determining the refractive index of nc-YSZ, which has lower transparency in the visible range and enhanced transparency in the near-infrared, because these liquids are typically designed for visible wavelengths and require switching the liquid until a near match is found, giving a rough estimate of the index of nc-YSZ. Refractometers require the thickness to be known at each location under interrogation, and due to the thin nature of our samples, this thickness measurement must be very precise (i.e., micron-scale) to yield an accurate index measurement. Because the samples we are measuring do not have perfect flatness nor perfectly uniform thickness, we needed a method which can simultaneously measure thickness and group refractive index at each location under interrogation on the sample. Of the interferometric methods available to measure refractive index, OCT is the most appropriate technique for our samples. Other interferometric methods are appropriate for highly transparent materials, whereas materials like transparent nc-YSZ exhibit some light scattering. While this scattering is enough to introduce artifacts in other methodologies, OCT has been used to measure the group refractive index of human skin, muscle and adipose tissue (Tearney et al., 1995), which is highly scattering, and thus is capable of accurately assessing the group refractive index of nc-YSZ. There are no other methods for these materials as precise as OCT, but because OCT is a broadband technique, we are able to assess group delay (GD) and group refractive index rather than phase index. Because OCT brain imaging is one of the most applicable imaging techniques for the Window to the Brain implant, group index over OCT wavelengths is highly applicable to envisioned clinical applications for the implant.
In this study, we measured optical properties of the transparent cranial implants using a swept source OCT system to characterize the group refractive index of the nc-YSZ window, over a narrow range of temperatures at which the implant may be used during imaging or therapy, ranging from room temperature (RT) to the point where thermal tissue damage begins to occur (20–43°C) (Yarmolenko et al., 2011). Additionally, chromatic dispersion of the OCT pulse was assessed.
Materials and Methods
Implant Fabrication and Preparation
The transparent 8 mol% YO1.5 nc-YSZ WttB implant used in this study was fabricated from a precursor yttria-stabilized zirconia nanopowder (Tosoh USA, Inc., Grove City, OH, United States) densified into a bulk ceramic via current-activated pressure-assisted densification (CAPAD) as described previously (Garay, 2010). The resulting ceramic disk was 19 mm in diameter and 1 mm thick. The thickness was reduced further by polishing with 30 μm diamond slurry on an automatic polisher (Pace Technologies, Tucson, AZ, United States). The two faces were then polished using progressively finer abrasives (from 30 μm diamond slurry down to 0.2 μm colloidal silica slurry) to reduce light scattering by the implant surfaces and thus increase transparency. A photograph of the nc-YSZ overlying the words “transparent nc-YSZ” with back lighting is shown in Figure 1A.
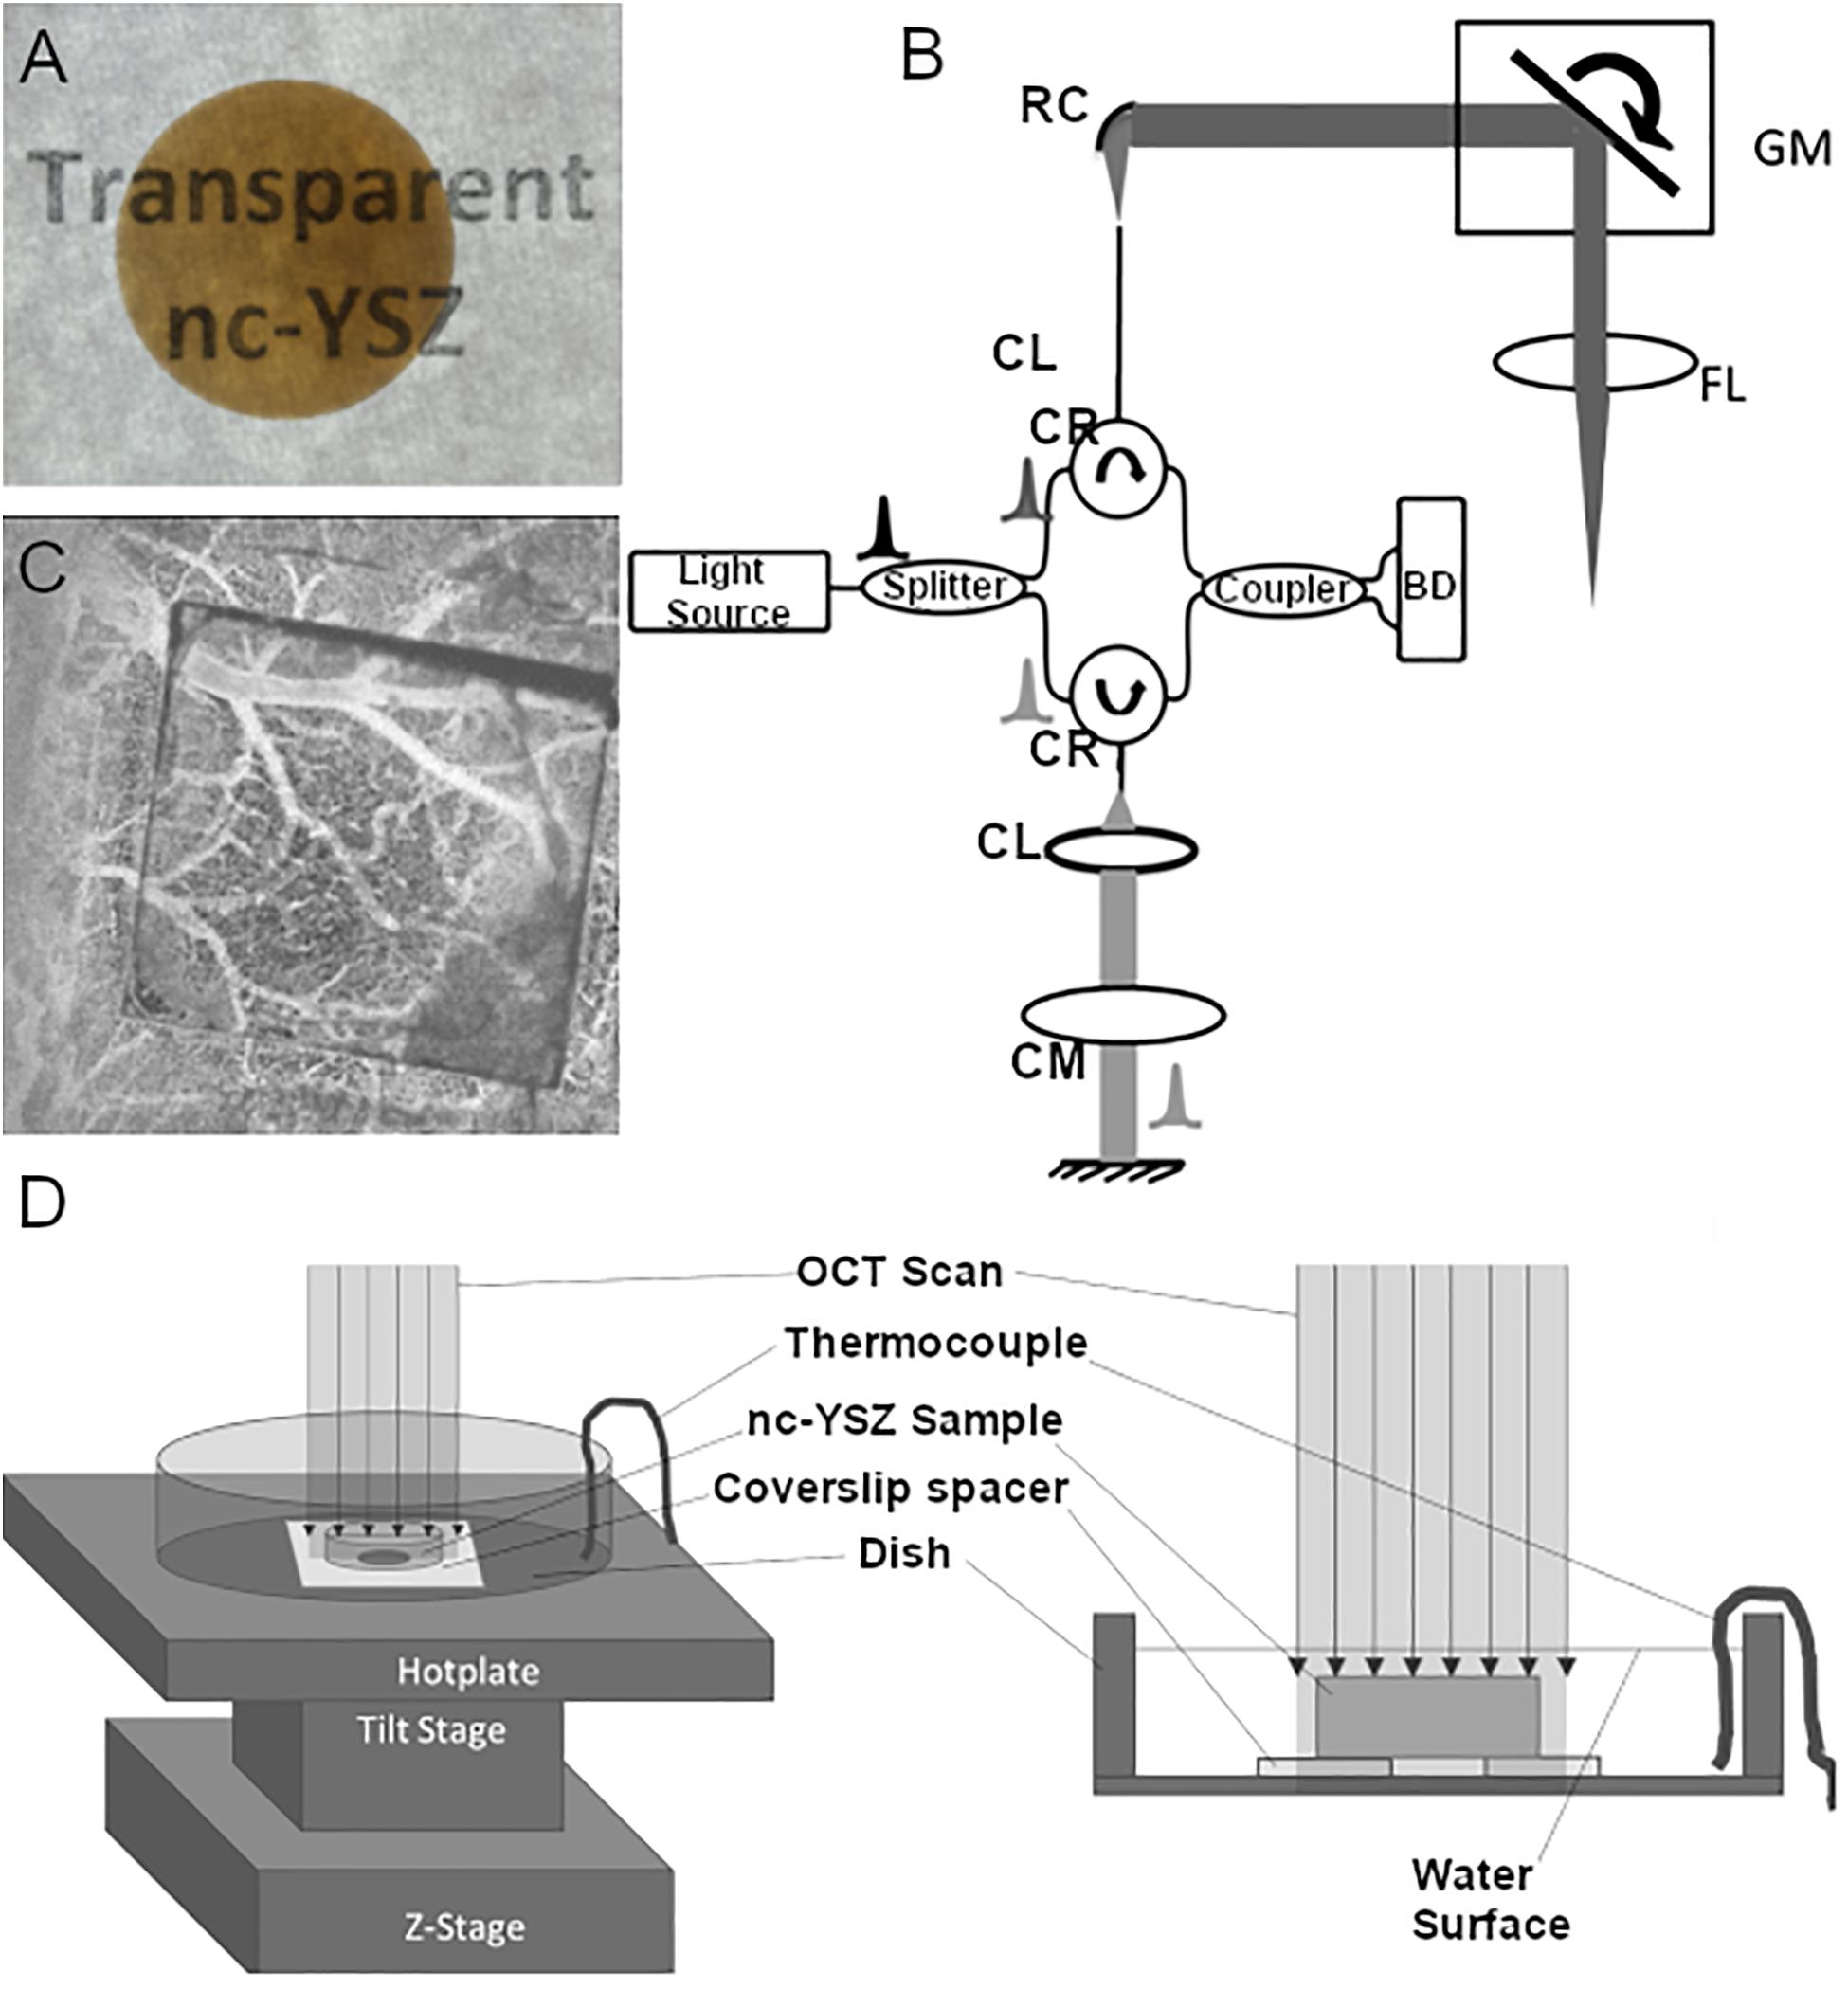
Figure 1. (A) A photograph of the nc-YSZ overlying the words “Transparent nc-YSZ” with backlighting. (B) Schematic of bench-top OCT system. Intensity OCT uses a Mach–Zehnder interferometer with circulators in the sample and reference paths (CR) using balanced detection (BD) and dispersion compensation (CM). Sample path delivery fiber APC; and reference path uses a reflective collimator (RC). Sample path uses galvo-mirrors (GM) placed at the back focal plane of the scanning lens (FL). (C) OCT angiography of mouse cerebral vasculature through a square nc-YSZ implant within a craniectomy, demonstrating the improved imaging across the implant compared to surrounding cranial bone. (D) Experimental setup for temperature-dependent measurements.
OCT Imaging
The OCT system used in this study utilized a swept-source, mode-locked laser (Axsun, Billerica, MA, United States) with central wavelength emission at 1,300 nm, 136 nm sweep and an A-scan-rate of 100 kHz (Figure 1B). The swept source output was coupled into a fiber-optic (SMF-28) Mach–Zehnder interferometer with pathlength and dispersion matched sample and reference arms. Sample path light was collimated (RC04, Thorlabs) and directed onto two galvanometer mirrors (GVS012, Thor Labs Inc.) positioned in a telecentric configuration with an aspheric ZnSe scanning lens (AR112-ZC-XWL-25-25, ISP Optics). An identical ZnSe lens was used in the reference path for dispersion compensation. Light backscattered from the sample and reflected from the reference mirror interfered and directed onto balanced detectors (BD) to obtain one-dimensional interferogram A-scans. Each one-dimensional scan (or A-line) collected contained 1,472 points (or pixels) to complete the interferogram. A pixel in the depth dimension was determined to correspond to a real thickness in air of 6.19 μm. Orthogonal scanning galvanometer mirrors in the scan head allowed for recording two-dimensional images (or B-scans where each B-scan consisted of 512 A-lines). Figure 1C shows an example of OCT angiography of mouse cerebral vasculature through a square nc-YSZ implant within a craniectomy, demonstrating the improved imaging across the implant compared to surrounding cranial bone.
Experimental Setup for Temperature-Dependent Measurements
The OCT imaging head was placed over a glass dish containing a 100 μm coverslip spacer with hole in the center and secured in place with epoxy. The refractive index of the coverslip spacer (made of borosilicate glass) is 1.504 at central wavelength of OCT at 1.31 μm. The glass dish was placed atop a temperature adjustable plate on a tilt and z-stage, allowing for the dish to be positioned with normal incidence to the OCT beam (Figure 1D). A baseline image was acquired, showing the vertical height of the dish and spacer when imaged in air (Figure 2A). In Figure 2A, the dish surface appears displaced when imaged through the coverslip spacer compared to when imaged through the hole in the center of the spacer, due to the refraction of light in the coverslip spacer (red arrows), although this surface is in fact continuous and flat. Next, the nc-YSZ sample was carefully placed atop the spacer, and water was slowly added to submerge the sample. A thermocouple was used to measure the water temperature as 20.8°C. A RT image was acquired, showing the apparent displacement of the spacer and dish due to non-unity group refractive index of water (at locations F and G) or due to the nc-YSZ and water (at locations A, B, C, D, and E) (Figure 2B). Weight of the water also caused a real downward displacement of the dish due to compression of the temperature adjustable plate. The water temperature was increased by heating the temperature adjustable plate to 38°C (near body temperature). After the temperature stabilized, an OCT image was acquired. Displacement in the image was observed to change relative to the RT image due to several factors. The increased temperature changes the group refractive index of the water, and potentially of the nc-YSZ. Evaporation of the water during the heating to 38°C decreased the height of the air-water interface as well as decreasing the real displacement of the temperature adjustable plate via compression. The temperature adjustable plate also undergoes thermal expansion during heating, translating the dish upward in the image. Finally, the temperature was increased further, to 43.2°C. This temperature is near the upper limit with which the implant should be used in vivo. Higher temperatures were not attempted, as turbulence of the water became a confounding factor at temperatures above 45°C. Similar to the case with 38°C, the displacement in the image was observed to change relative to images recorded at lower temperatures due to the same factors discussed above.
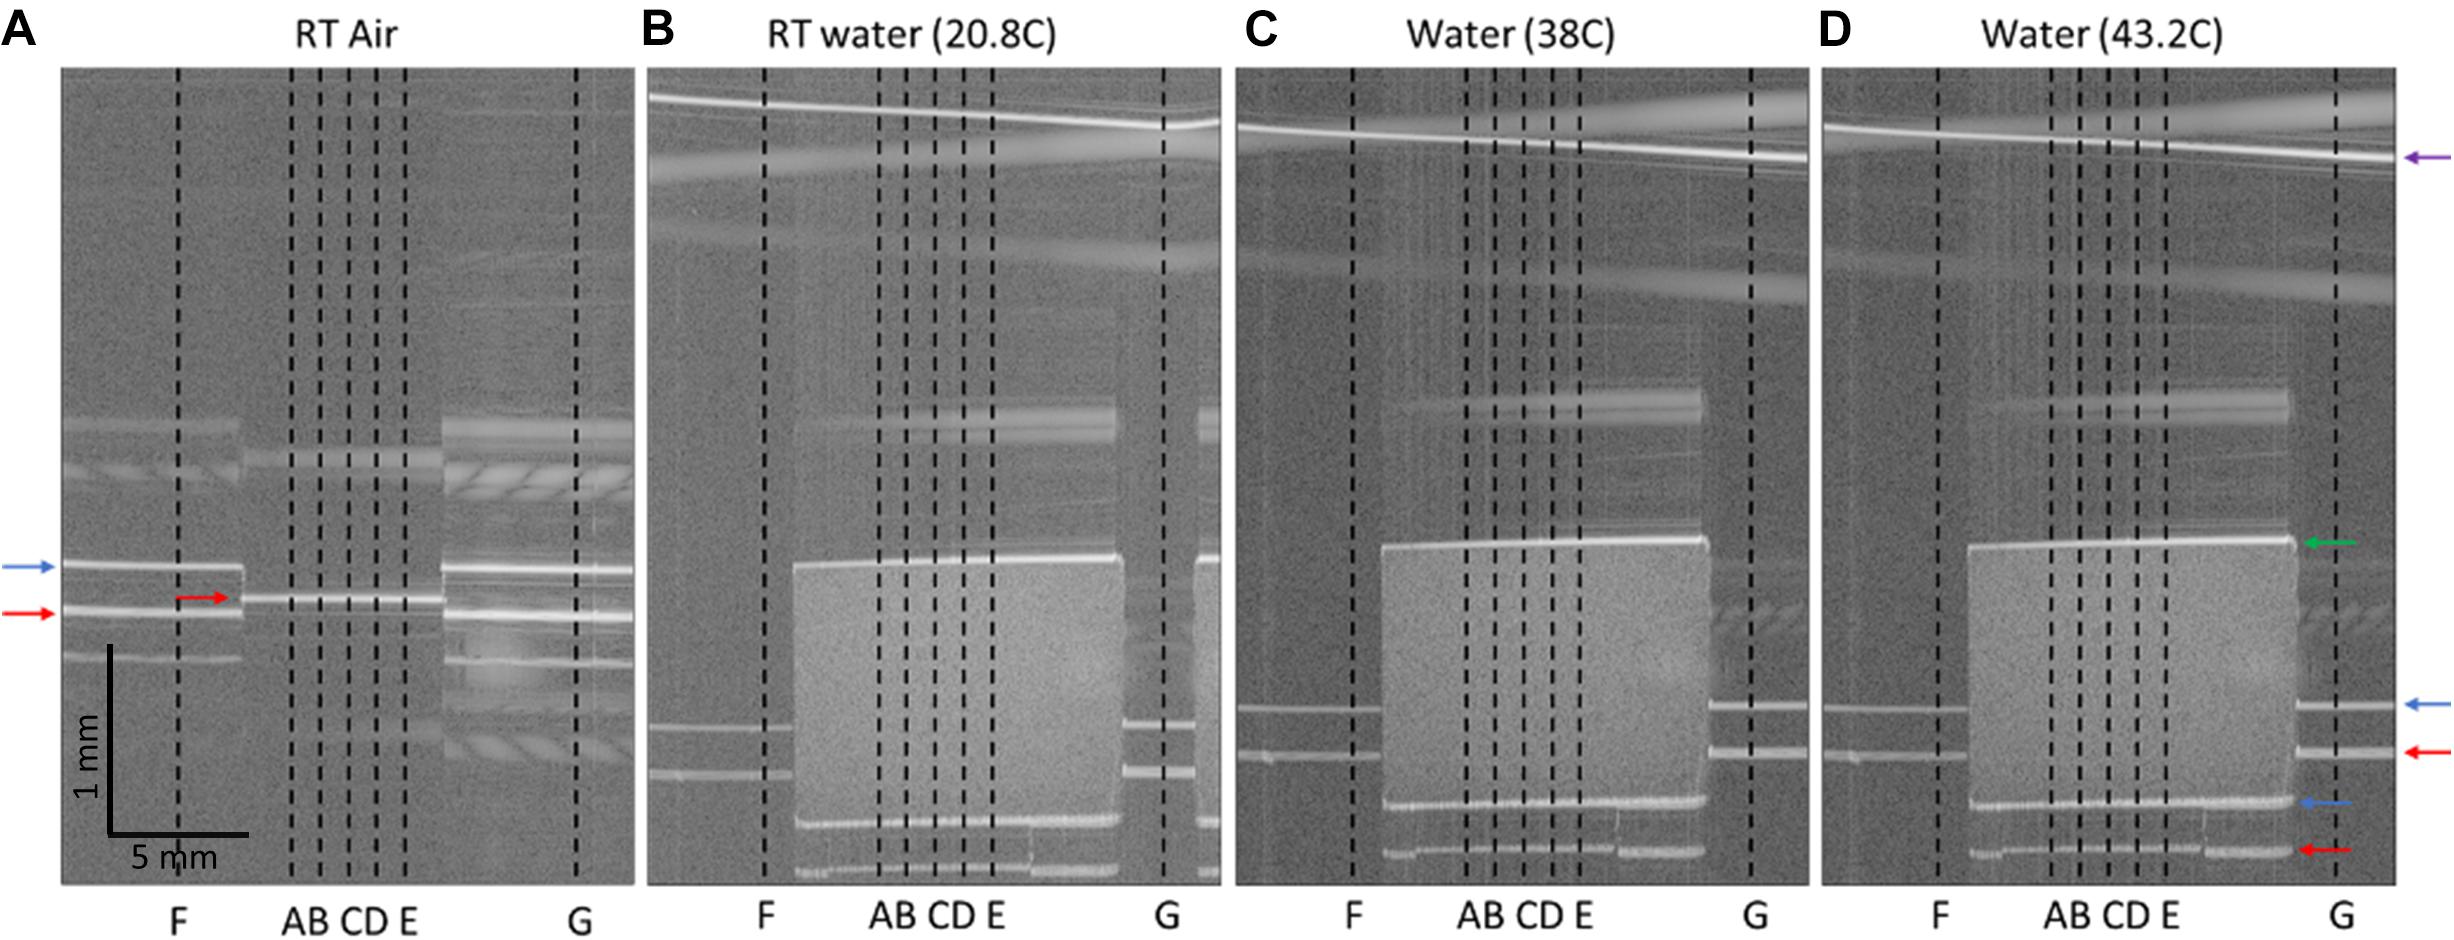
Figure 2. OCT B-Scans of nc-YSZ sample, with locations of interest identified. (A) Spacer and dish imaged in air at room temperature, (B) nc-YSZ sample imaged atop spacer and dish in water at room temperature (20.8°C), (C) nc-YSZ imaged in water at 38°C, (D) nc-YSZ imaged in water at 43.2°C. Locations A, B, C, D, and E are used to analyze nc-YSZ optical properties, while F and G are used to measure the real vertical displacement of the experimental setup within the imaging field. Horizontal arrows highlight relevant surfaces (red = dish; blue = spacer top/nc-YSZ bottom; green = nc-YSZ top; purple = water surface).
Group Refractive Index of Water
Refractive index of water was calculated using reference data (Thormählen et al., 1985), and assuming 1.0221 bar atmospheric pressure. Refractive index values were calculated for several wavelengths near the central OCT wavelength of 1,300 nm for each temperature of interest, and converted to group refractive index using Equation 1 (Paschotta, 2021):
where ng is the group refractive index, n is the phase index of wavelength λ, and λ0 is the central OCT wavelength of 1,300 nm. Calculated group refractive index values of water are 1.337, 1.339, and 1.340 at 20.8, 38, and 43.2°C, respectively.
Method 1: Image-Based Analysis (Group Refractive Index and Sample Thickness)
Using ImageJ, distances within the image were quantified (in microns and pixels). At locations of interest (A, B, C, D, E, F, and G in Figure 2), distances were measured from the top of the image to the following features: top surface of spacer, bottom of dish, top and bottom surfaces of nc-YSZ sample, and surface of water (see Figure 2). From these measurements, and group refractive index values of water at 20.8, 38, and 43.2°C, it is possible to separate the total displacement in the image Δtotal into apparent displacement Δapparent of the dish bottom and/or spacer (due to non-unity group refractive index of water and nc-YSZ) and the real displacement Δreal of the setup (due to compression and/or expansion of the temperature adjustable plate), using Equations 2, 3:
Where T = optical thickness, d = real thickness, and ng = group refractive index. First, the real displacement Δreal of the setup at each temperature is found using the total displacement Δtotal of the spacer relative to the baseline image at locations F and G, where Δapparent is caused by ngwater only. Combining Equations 2, 3, Equation 4:
The RT image had a real downward displacement Δreal = 4 px (∼25 μm) relative to the baseline image in air. This is due to the weight of the water compressing the temperature adjustable plate. The 38°C image had a real upward displacement Δreal = 2.5 px (∼15 μm) relative to the baseline image in air. This is due to thermal expansion of the temperature adjustable plate and experimental setup, as well as evaporation of some of the water compared to the RT image. The 43.2°C image had a real upward displacement Δreal = 4 px (∼25 μm) relative to the baseline image in air, due to thermal expansion of the temperature adjustable plate and experimental setup, as well as water evaporation compared to the RT and 38°C images.
Subtracting these real displacements from the total displacement Δtotal in the images (using Equation 2) yields the apparent displacement within the image. To calculate the group refractive index of nc-YSZ from the apparent displacement, the method is the same as that used to compute real displacement Δreal above, except it is applied at locations A, B, C, D, and E, where the apparent displacement Δapparent is due to non-unity group refractive index of water and nc-YSZ, using Equation 5:
Method 2: Spectral Phase Function Based Analysis (Group Delay and Group Delay Dispersion)
The second method of analysis uses the spectral phase function to calculate group refractive index and chromatic dispersion (Walmsley et al., 2001). The spectral phase function describes the relationship between the optical frequencies in the OCT pulse and the difference in phase for each frequency returning from the top and bottom surfaces of the nc-YSZ sample. The spectral phase function may be written as a Taylor series expanded about the central OCT optical frequency, Equation 6:
Where Φ is phase, ν is optical frequency, ν0 is the central OCT optical frequency, Φ(0) is a common phase shift, Φ(1)(ν0) is the GD, Φ(2)(ν0) is the group delay dispersion (GDD), and higher order terms are higher order dispersion. Single A-lines were analyzed from the five locations of interest at the three temperatures. Each A-line was filtered using a Hilbert transform/narrowband phase-invariant spectral filter (Baumann et al., 2007) to isolate photons returning from the top and bottom surfaces of the sample (defined by full-width-half-maximum, FWHM, of the intensity peaks at the surfaces). These two phase functions correspond to the spectral phase functions of light returned from the sample’s top and bottom edges. Fitting this data with a polynomial curve can approximate the spectral phase function (Equation 6). 4th order polynomial fits of the optical phase vs. frequency data were performed in MATLAB (Mathworks, 2020). The curve fits were weighted by the normalized intensity spectrum of the OCT light source, and the high and low tails of the spectrum were trimmed by 200 pixels prior to the curve fitting to eliminate regions of low SNR and reduce the impact of noise. Root-mean-squared-error, RMSE, values were less than unity for all fits. The 1st order coefficient (Equation 6) of the spectral phase function approximation is the GD. The GD of each interface corresponds to the actual optical path length difference between the interface and the reference arm. A subtraction of these GDs for the top and bottom interfaces corresponds to the distance the light experienced within the sample (T = ng× d, Equation 2). The 2nd order coefficient (Equation 6) of the spectral phase function of the bottom surface is the approximation of half of the GDD the light experienced within the sample (from the top surface to the bottom surface of the sample).
Results
Group refractive index of nc-YSZ was determined at each location and each temperature using the image-based analysis (Method 1) described above (Table 1). This method also allowed for determination of real sample thickness dnc–YSZ at each location and temperature, using the optical thickness T divided by the group refractive index ng (Equation 2) along with a calibration factor of 6.19 microns per pixel in the OCT image (Table 2). This method is based on whole pixels, and an error analysis shows that the measurement has a 2% error.
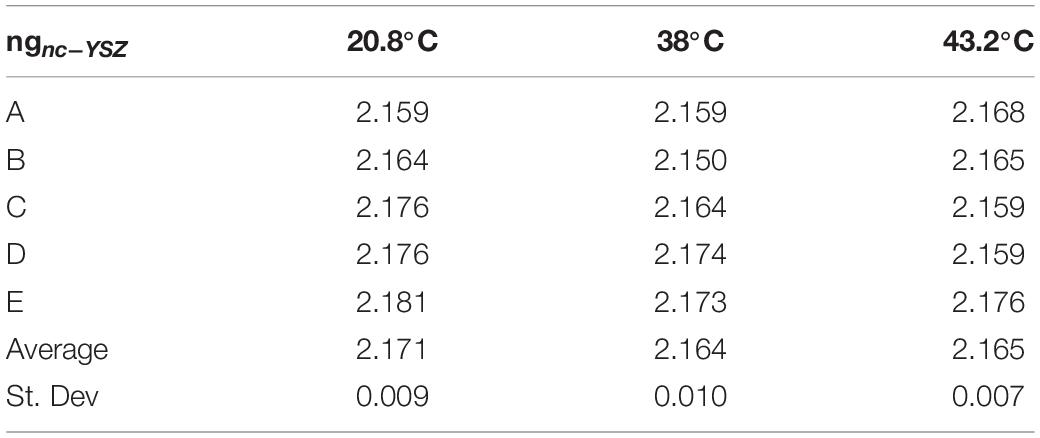
Table 1. Group refractive index of nc-YSZ measured at five locations and three temperatures, using an image-based approach.
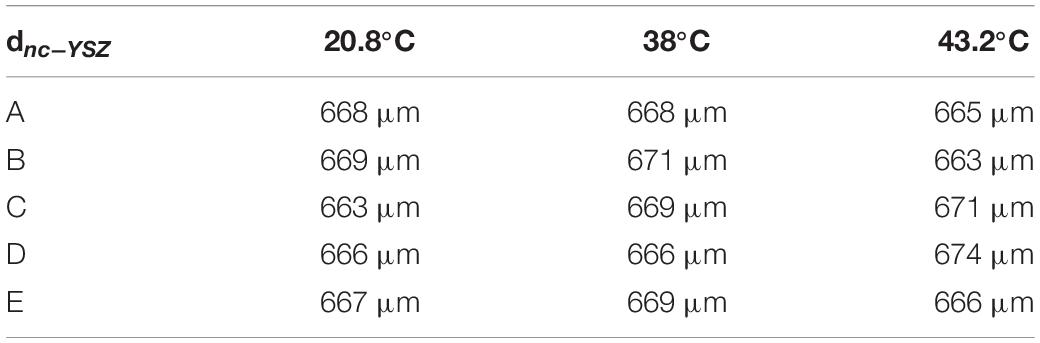
Table 2. Real thickness of nc-YSZ sample measured at the five locations and three temperatures, using an image-based approach.
Next, GD of the nc-YSZ sample was calculated using the spectral phase function approach (Method 2) described above. The 1st order coefficient of the spectral phase function approximation (Equation 6) is the GD. The GD for each location and temperature are shown in Table 3. From GD, group refractive index ng can be calculated using Equation 7 and sample thickness values dnc–YSZ obtained from Method 1 (Table 2):
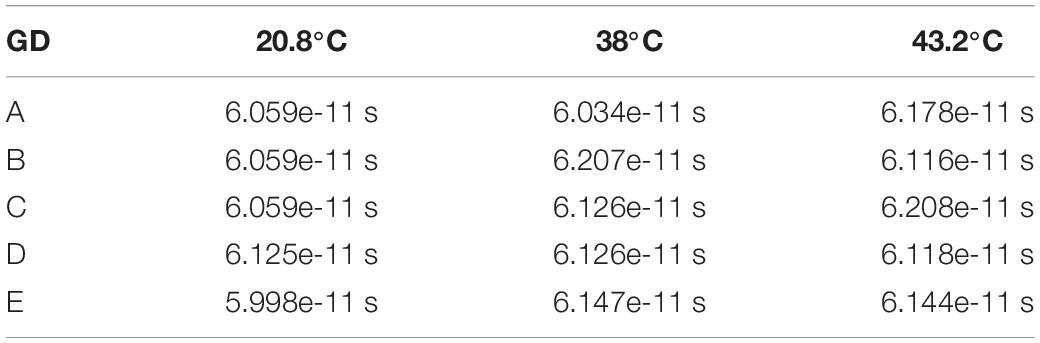
Table 3. Group delay of nc-YSZ sample measured at the five locations and three temperatures.
Where c = 2.998e+8 m/s. Group refractive index values calculated using Equation 7 are shown in Table 4. Because this method uses sample thickness values determined from Method 1, it also has a 2% error in the calculated values of group refractive index, or an error of ∼0.043.
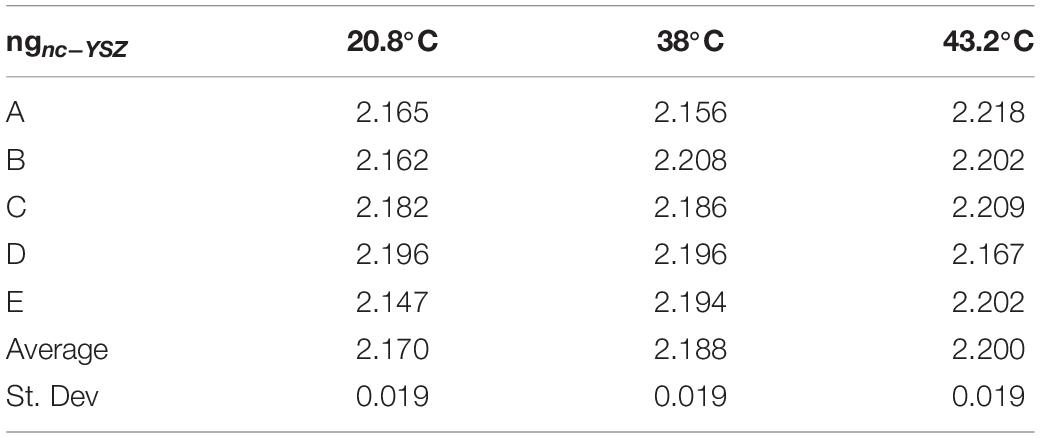
Table 4. Group refractive index of nc-YSZ sample calculated from group delay and sample thickness.
The 2nd order coefficient of the spectral phase function approximation (Equation 6) is half of the GDD. The GDD for each location and temperature are provided in Table 5. Dividing the GDD by twice the sample thickness dnc–YSZ (round trip), the β-parameter of dispersion measured for the sample is shown in Table 6. Dispersion values varied between locations in the sample and between temperatures at a single location, even flipping sign between normal and anomalous dispersion. These values were reproducible by sequential A-lines at each location and temperature, causing us to believe this variability is not due to recording method or analysis.
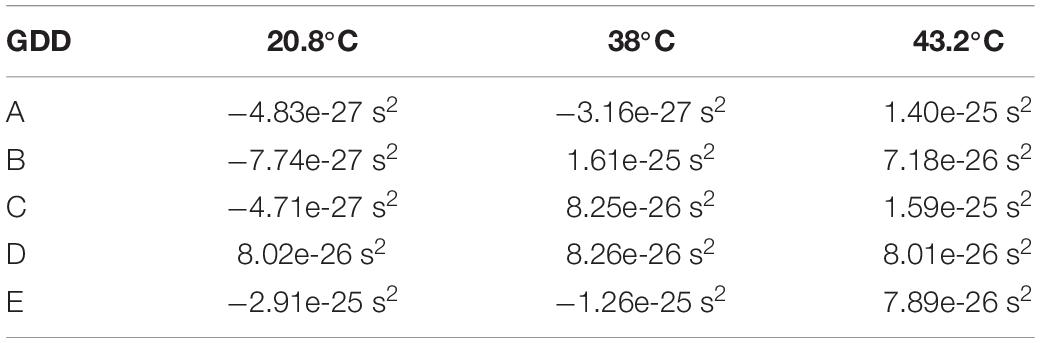
Table 5. Group delay dispersion of nc-YSZ sample measured at the five locations and three temperatures.
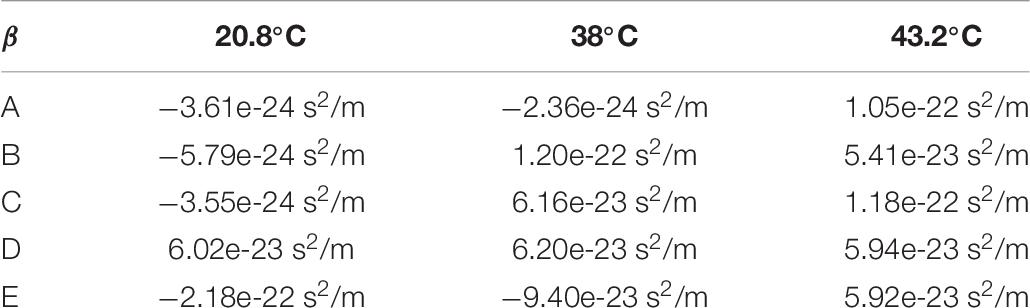
Table 6. β-parameter of nc-YSZ sample calculated from GDD and sample thickness.
Discussion
Group refractive index of the nc-YSZ window is important to consider when interpreting OCT images of underlying brain tissue, like those we reported previously (Halaney et al., 2020). Because OCT is a time-based imaging technique, on-axis dimensions in reconstructed OCT images depend on time-of-flight of the OCT pulse. When imaging across the WttB implant with a group refractive index of ∼2.1, the implant appears 2.1 times of its mechanical thickness, and displaces other features beneath the window downward in the image. This effect can be visualized in Figures 2B–D, where the coverslip spacer beneath the nc-YSZ implant is displaced downward and appears discontinuous with the parts of the coverslip spacer on either side of the implant (blue arrows). Knowing the group refractive index is also important for focusing light through the window onto underlying tissue. Changes in group refractive index between the different temperatures investigated in this study (20–43°C) were ≤0.036, and within the 2% uncertainty of the sample thickness measurement. This temperature stability is not surprising, since YSZ has high thermal stability (Ghosh et al., 2009) and stable broadband IR reflection at much greater temperatures than those used in this study (i.e., >1400°C) (Leib et al., 2016).
Chromatic dispersion values were found to vary across different sample locations and different temperatures at fixed locations, even flipping sign between normal and anomalous dispersion (Tables 5, 6). Despite this variability, individual measurements were reproducible by repeated A-lines at each fixed location and temperature. Thus, this variability may be a material property and not an artifact of data recording or analysis. The observed dispersion variation may be due to light scattering within the bulk of the sample at grain boundaries. Scattering within the sample is apparent in recorded OCT images shown in Figure 2, and is quantified in Figure 3 at location E for each temperature. This chromatic dispersion should be studied further, and will be an important consideration for any multispectral optical approaches that propagate light through the window where precise pulse duration needs to be maintained.
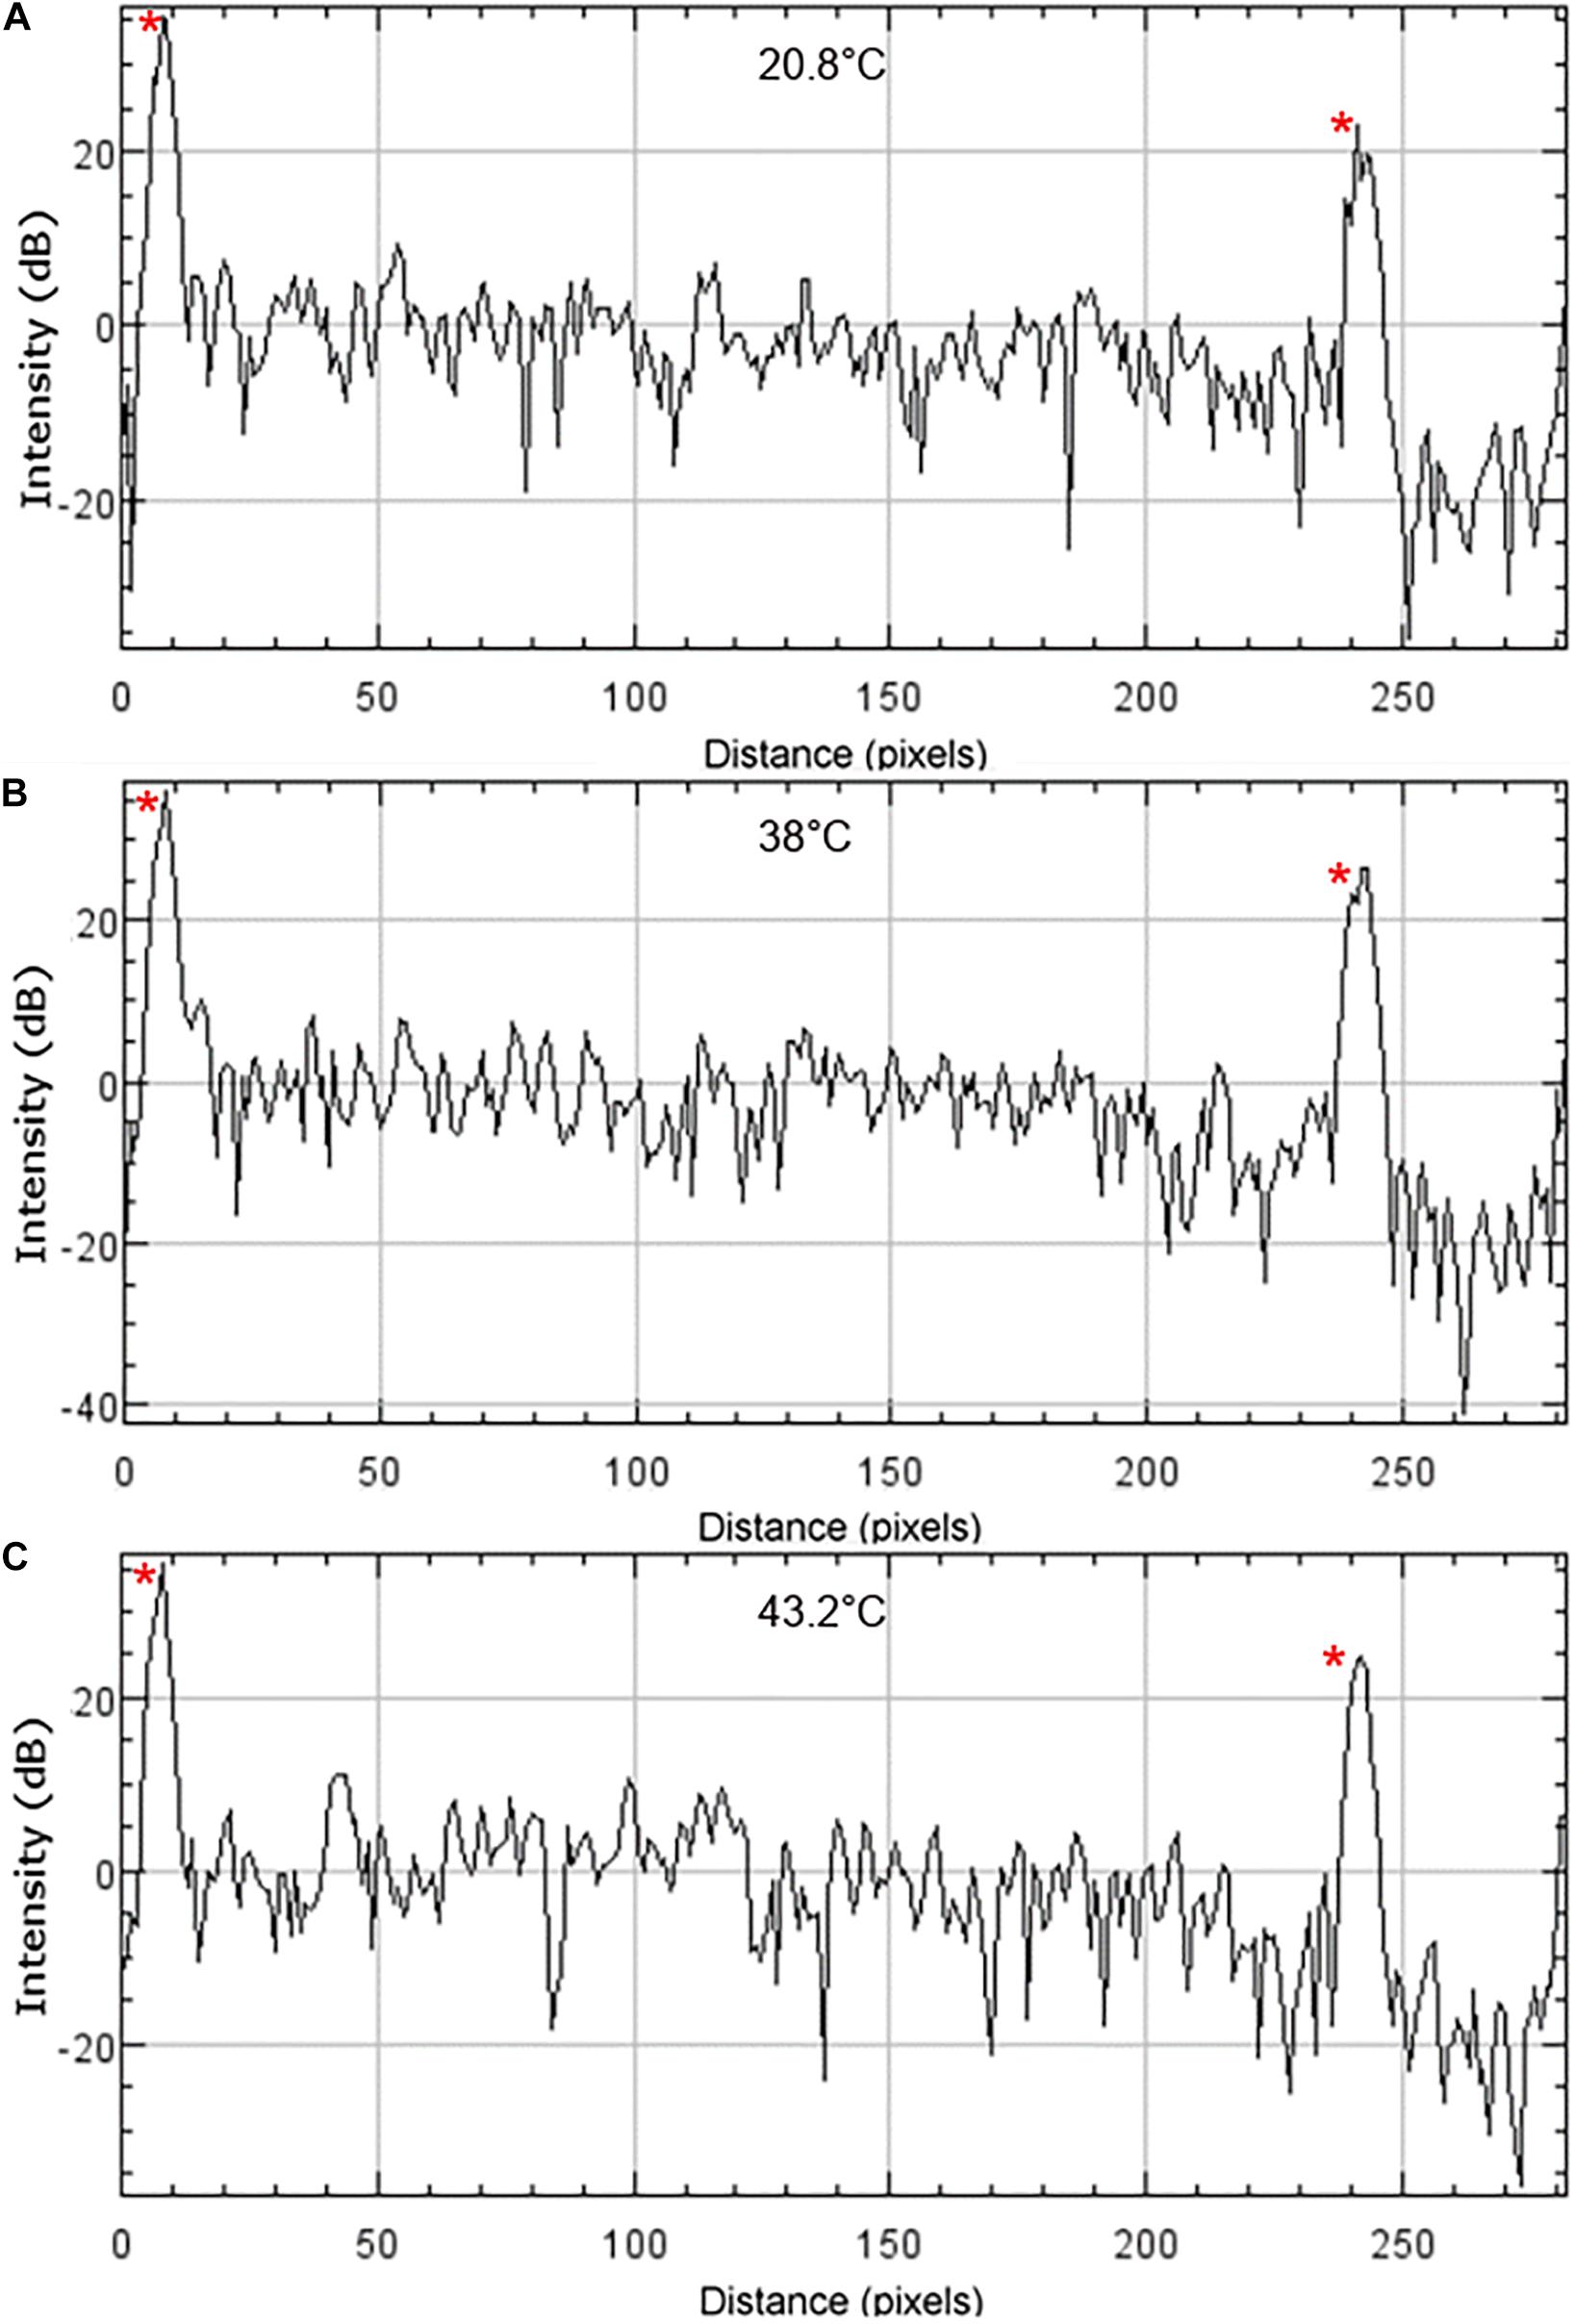
Figure 3. OCT intensity profiles of nc-YSZ sample at location E at (A) 20.8°C RT, (B) 38°C, and (C) 43.2°C. The upper and lower surfaces of the sample are visible as intensity spikes on the left and right side of the profiles, respectively, and are identified with red asterisks.
There were several limitations to the current study. As explained in the introduction, an additional method to validate the OCT findings was not conducted, due to the scattering properties of our samples and the need for simultaneous determination of the sample thickness at each location being interrogated. Additionally, while this measurement covered the wavelength range and temperature range anticipated for clinical applications of the implant with OCT brain imaging, wavelengths, and temperature effects outside of this range were not assessed. The values of group refractive index reported here are applicable to light with a spectral range of 136 nm and centered at 1,300 nm only.
Conclusion
Nc-YSZ cranial implant windows have a group refractive index of 2.1–2.2 for OCT imaging with a spectral range of 136 nm centered at 1,300 nm at normal working implant temperatures (20–43°C). Chromatic dispersion for this spectral range was observed to vary over the sample, sometimes flipping signs between normal and anomalous dispersion. These properties of nc-YSZ should be considered when designing optical systems and procedures that propagate light through the window.
Data Availability Statement
The raw data supporting the conclusions of this article will be made available by the authors, without undue reservation.
Ethics Statement
The animal study was reviewed and approved by Institutional Animal Care and Use Committee, University of Texas at Austin.
Author Contributions
DH, NK, and HF performed the OCT imaging and analysis. TM and GA provided guidance on study design and data interpretation. All authors contributed to manuscript revision, read, and approved the submitted version.
Funding
This work was supported by the National Science Foundation (NSF-PIRE 1545852).
Conflict of Interest
The authors declare that the research was conducted in the absence of any commercial or financial relationships that could be construed as a potential conflict of interest.
Acknowledgments
The authors acknowledge Gottlieb Uahengo for providing the nc-YSZ sample used in this study.
References
Baumann, B., Pircher, M., Götzinger, E., and Hitzenberger, C. K. (2007). Full range complex spectral domain optical coherence tomography without additional phase shifters. Opt. Express 15, 13375–13387. doi: 10.1364/oe.15.013375
Bonda, D. J., Manjila, S., Selman, W. R., and Dean, D. (2015). The recent revolution in the design and manufacture of cranial implants: modern advancements and future directions. Neurosurgery 77, 814–824. doi: 10.1227/neu.0000000000000899
Cano-Velázquez, M. S., Davoodzadeh, N., Halaney, D., Jonak, C. R., Binder, D. K., Hernández-Cordero, J., et al. (2019). Enhanced near infrared optical access to the brain with a transparent cranial implant and scalp optical clearing. Biomed. Opt. Express 10, 3369–3379. doi: 10.1364/BOE.10.003369
Davoodzadeh, N., Cano-Velázquez, M. S., Halaney, D. L., Jonak, C. R., Binder, D. K., and Aguilar, G. (2019a). Optical access to arteriovenous cerebral microcirculation through a transparent cranial implant. Lasers Surg. Med. 51, 920–932. doi: 10.1002/lsm.23127
Davoodzadeh, N., Cano-Velazquez, M. S., Halaney, D. L., Sabzeghabae, A., Uahengo, G., Garay, J. E., et al. (2018). Evaluation of a transparent cranial implant as a permanent window for cerebral blood flow imaging. Biomed. Opt. Express 9, 4879–4892. doi: 10.1364/BOE.9.004879
Davoodzadeh, N., Cano-Velazquez, M. S., Halaney, D. L., Sabzeghabae, A., Uahengo, G., Garay, J. E., et al. (2019b). Characterization of ageing resistant transparent nanocrystalline yttria-stabilized zirconia implants. J. Biomed. Mater. Res. B Appl. Biomater. 108, 709–716. doi: 10.1002/jbm.b.34425
Garay, J. E. (2010). Current-activated, pressure-assisted densification of materials. Annu. Rev. Mater. Res. 40, 445–468. doi: 10.1146/annurev-matsci-070909-104433
Ghosh, S., Teweldebrhan, D., Morales, J. R., Garay, J. E., and Balandin, A. A. (2009). Thermal properties of the optically transparent pore-free nanostructured yttria-stabilized zirconia. J. Appl. Phys. 106:113507. doi: 10.1063/1.3264613
Halaney, D. L., Jonak, C. R., Liu, J., Davoodzadeh, N., Cano-Velázquez, M. S., Ehtiyatkar, P., et al. (2020). Chronic brain imaging across a transparent nanocrystalline yttria-stabilized-zirconia cranial implant. Front. Bioeng. Biotechnol. 8:659. doi: 10.3389/fbioe.2020.00659
Leib, E. W., Pasquarelli, R. M., do Rosário, J. J., Dyachenko, P. N., Döring, S., Puchert, A., et al. (2016). Yttria-stabilized zirconia microspheres: novel building blocks for high-temperature photonics. J. Mater. Chem. 4, 62–74. doi: 10.1039/C5TC03260A
Mathworks (2020). Curve Fitting Toolbox: User’s Guide (R2020b). Available online at: https://www.mathworks.com/help/pdf_doc/curvefit/curvefit.pdf. (accessed October 8, 2020).
Paschotta, R. (2021). Article on ‘Group Inde”. RP Photonics Encyclopedia. Available online at: https://www.rp-photonics.com/group_index.html (accessed September 29, 2020).
Tearney, G. J., Brezinski, M. E., Southern, J. F., Bouma, B. E., Hee, M. R., and Fujimoto, J. G. (1995). Determination of the refractive index of highly scattering human tissue by optical coherence tomography. Opt. Lett. 20, 2258–2260. doi: 10.1364/ol.20.002258
Thormählen, I., Straub, J., and Grigull, U. (1985). Refractive index of water and its dependence on wavelength, temperature, and density. J. Phys. Chem. Ref. Data 14, 933–945. doi: 10.1063/1.555743
Walmsley, I., Waxer, L., and Dorrer, C. (2001). The role of dispersion in ultrafast optics. Rev. Sci. Instrum. 72, 1–29. doi: 10.1063/1.1330575
Keywords: brain, chromatic dispersion, cranial implant, group refractive index, imaging, optical coherence tomography, window to the brain
Citation: Halaney DL, Katta N, Fallah H, Aguilar G and Milner TE (2021) Group Refractive Index of Nanocrystalline Yttria-Stabilized Zirconia Transparent Cranial Implants. Front. Bioeng. Biotechnol. 9:619686. doi: 10.3389/fbioe.2021.619686
Received: 20 October 2020; Accepted: 02 March 2021;
Published: 19 March 2021.
Edited by:
Meng Zheng, Henan University, ChinaCopyright © 2021 Halaney, Katta, Fallah, Aguilar and Milner. This is an open-access article distributed under the terms of the Creative Commons Attribution License (CC BY). The use, distribution or reproduction in other forums is permitted, provided the original author(s) and the copyright owner(s) are credited and that the original publication in this journal is cited, in accordance with accepted academic practice. No use, distribution or reproduction is permitted which does not comply with these terms.
*Correspondence: Guillermo Aguilar, Z2FndWlsYXJAZW5nci51Y3IuZWR1