 Jerome Perez
 Gaël Guilhem
 Franck Brocherie
- 1French Institute of Sport (INSEP), Laboratory Sport, Expertise and Performance (EA 7370), Paris, France
- 2French Ice Hockey Federation, Cergy, France
This study aimed to compare the force-velocity mechanical variables derived from high-speed video- and radar-based method during forward skating sprint in ice hockey. Thirteen elite female ice hockey players performed two 40-m forward skating sprints to determine, in the horizontal plane, maximal velocity reached (Vmax), relative maximal theoretical force (F0), maximal theoretical velocity (V0), relative maximal power (Pmax), linear slope of the force-velocity relationship (FV slope), maximal value of the ratio of force (RFmax) and index of force application technique (Drf). Two different high-speed video-based methods adding a time shift (ST-TS) or not (ST) were used and independently compared to the radar-derived method. ST and ST-TS showed significant mean differences (all p < 0.002) compared to radar-derived processing for all variables except for V0 (p = 0.26) and Vmax (p = 0.13) inferred from ST. In reference to radar-derived variables, ST-TS significantly induced larger lower values compared to radar of the main forward skating sprint determinants (Pmax, F0, RFmax and Drf) and moderate-to-large overestimation for velocity variables (V0 and Vmax). Correlations between ST or ST-TS and radar-derived methods ranged from trivial for velocity variables to very large for force and power variables. Consequently, practitioners must be aware that using such high-speed video-based methods would permit to determine mechanical variables at the cost of much lower accuracy and reliability than the radar-derived method.
Introduction
Horizontal force, power output and acceleration achieved during forward skating sprint are key determinants of ice hockey performance (Pearsall et al., 2013; Perez et al., 2020). Recently, the application of the force-velocity (FV) profiling during forward skating has been proposed using either in situ radar-derived (Perez et al., 2019, 2020) or high-speed video-based (Stenroth et al., 2020) measurements with potential practical applications for training individualization and monitoring (Morin and Samozino, 2016; Jimenez-Reyes et al., 2019, 2020).
Unfortunately, on-ice conditions do not allow the use of gold standard methods (i.e., force plates) to clearly determine concurrent validity for both methods. Several studies have reported acceptable validity of running sprint-related velocity-time curve inferred from radar device (Simperingham et al., 2016) and its derived mechanical variables (Samozino et al., 2016). Potential limitations (i.e., change in sprinting posture during the first few steps) that could affect measurements validity (Bezodis et al., 2012; Haugen and Buchheit, 2016) has been successfully corrected by shifting the measures by a 0.3 s time delay to not overestimate force and power measurements (Samozino, 2018). As previously mentioned, this method has been successfully applied to skating sprints (Perez et al., 2019). While one may argue that such method requires specific data processing, it allows practitioners to accurately assess mechanical determinants of forward skating sprint such as relative maximal theoretical horizontal force (F0), power (Pmax) and the maximal ratio of the horizontal component of the ground-reaction force to the corresponding resultant force (RFmax) (Perez et al., 2020). Recently, Stenroth et al. (2020) adapted an alternative method based on the measurement of split time (ST method) with high-speed video (i.e., 240 frames per second) primarily developed to assess FV profiling during running sprint (Samozino et al., 2016). Romero-Franco et al. (2017) demonstrated that, in running sprint condition, high-speed video-based method was valid [r = 0.974–0.999, p < 0.001, intra-class correlation coefficient (ICC) = 0.987–1.00] and reliable (coefficient of variation = 0.14%) to determinate FV mechanical variables compared to those derived from the radar method. In the context of ice skating, Stenroth et al. (2020) proposed to add a time shift (ST-TS method) in order to easily determine on-ice forward skating sprint mechanical variables. On the one hand, this approach uses low-cost handling tools more accessible to practitioners. On the other hand, Stenroth et al. (2020) reported substantial bias when skating sprint mechanical variables are inferred from this alternative procedure—especially during the acceleration phase (F0, Pmax and RFmax)—compared to the data obtained using a continuous video tracking. For instance, inter-trial reliability, determined with ICCs, of high-speed video-based method appears to be lower to those reported using radar-derived method for maximal theoretical velocity (V0; ICCs ranging from 0.198 to 0.343 vs. 0.86, respectively) and maximal velocity (Vmax) reached during skating sprint (ICCs ranging from 0.497 to 0.596 vs. 0.91, respectively) (Perez et al., 2019). In addition, while Stenroth et al. (2020) suggested to analyze only the fastest trial, several running- and skating-based studies showed that averaging sprint trials improve the reliability (Perez et al., 2019; Simperingham et al., 2019).
This study therefore aimed to compare the force-velocity mechanical variables derived from high-speed video- and radar-based method during on-ice forward skating sprint in ice hockey. In line with the results from Stenroth et al. (2020) showing significant differences between two different video-based methods (ST-TS and continuous tracking), we hypothesized that significant differences would be found between the high-speed video-based methods and the radar-derived method, the latter remaining the preferred approach to infer FV-related mechanical variables.
Methods
Participants
Thirteen elite female ice hockey players of the French national team (mean ± SD: age, 21.0 ± 3.2 years; height, 1.65 ± 0.10 m; body mass, 64.8 ± 10.1 kg; playing experience, 14.3 ± 3.1 years) participated in this study. They were free from any musculoskeletal injury of the lower limb during the 3 months preceding data collection. All participants received a clear explanation of the experimental procedure before they provided written consent to participate. The protocol was integrated in the regular training of the players and was approved by ethics committee Ouest IV.
Experimental Design
Forward skating sprint FV profile was determined during the pre-season training camp of the national team as described elsewhere (Perez et al., 2020). Players were instructed to wear their full ice hockey equipment and were weighed (72.6 ± 9.4 kg fully equipped) before the testing session. The study compared mechanical variables determined using two high-speed video-based methods (ST and ST-TS) (Romero-Franco et al., 2017; Stenroth et al., 2020) and those obtained using the radar-derived method (Perez et al., 2019) for the same forward skating sprint for each player. ST method has been validated by Romero-Franco et al. (2017) during running sprint and designed into a spreadsheet by Morin and Samozino (2019). ST-TS method was recently developed by Stenroth et al. (2020) which added an optimized parameter in the context of forward skating sprint, named time shift, to the original method (Romero-Franco et al., 2017). This ST-TS approach aimed to remove uncertainty in identifying the onset of horizontal force generation by changing the duration of the first-time interval while maintaining the differences between other split times. On the ice, although skate’s blade must be oriented perpendicularly to the intended direction of motion inducing a medio-lateral force, the capacity to generate an efficient F0 seems paramount for an efficient forward skating performance (Pearsall et al., 2013; Perez et al., 2020).
Testing Procedures
Players had a general warm-up of 15 min including skating skills and three progressive 40-m forward skating sprints at self-perceived increasing skating velocity, as previously detailed (Perez et al., 2019). Then, players performed two on-ice (∼10°C ambient temperature and ∼75% relative humidity) 40-m maximal forward skating sprints interspersed by 4 min of passive rest. Players started from a standing straight position with skates’ blades positioned in a “V” stance and skated as fast as possible while holding their stick, mimicking in-game skating. Trials were assessed by recording each sprint using a radar device (Stalker ATS II; Applied Concepts, Plano, TX, United States) and a high-speed camera (iPhone 6, Apple Inc., United States, framerate 240 frames per second, resolution 1,280 × 720 pixels). Instantaneous horizontal velocity (Vh, in m.s–1) was measured by the radar device at a 47 Hz sampling frequency. The radar was located 3.5 m behind the starting line at a height of 1 m from the ice surface, corresponding approximatively to the average height of players’ center of mass (Samozino, 2018; Perez et al., 2019, 2020). Meanwhile, to record the video of each sprint, the camera was held by the same practitioner at a height of 1.5 m (in the frontal plane) and positioned at 20 m from the starting line and at 11.5 m from the skating line (Samozino, 2018). The practitioner moved the camera around itself in order to film the sprint from the side and register the entire sprint. According to Romero-Franco et al. (2017), and using Thales theorem, video parallax was corrected to ensure that 5-, 10-, 15-, 20-, 25-, 30-, 35-, and 40-m split times were measured properly. The correction of the parallax was done by positioning the different markers (i.e., vertical markers) not exactly at the associated distances (i.e., 5, 10, 15, 20, 25, 30, 35, and 40 m from the starting line), but at adjusted positions so that the players were filmed to cross the markers with their hip when they were exactly at these targeted distances (i.e., to correct for the parallax error, the markers positions were, respectively, positioned at 6.96, 11.30, 15.65, 20.00, 24.35, 28.70, 33.04, and 37.39 m from the start line). Skating line was parallel to the line of the markers with a 1.5 m average separation between the lines.
Data Processing
Radar raw data acquisitions were saved on StalkerTM ATS System software (Version 5.0.3.0, Applied Concepts, Inc., Texas, United States) and imported to a custom-made Origin script (Version 8.0, OriginLab Corporation, United States) to model mechanical variables from the Vh-time curve data set (Figure 1; Perez et al., 2019). F0 (in N.kg–1), V0 (in m.s–1), relative maximal horizontal power Pmax (in W.kg–1), slope of the linear relationship between force expressed relatively to body mass and velocity (FV slope, in N.m.kg–1.s–1), maximal ratio of force (RFmax, in %) and index of force application technique (Drf, in %) were determined.
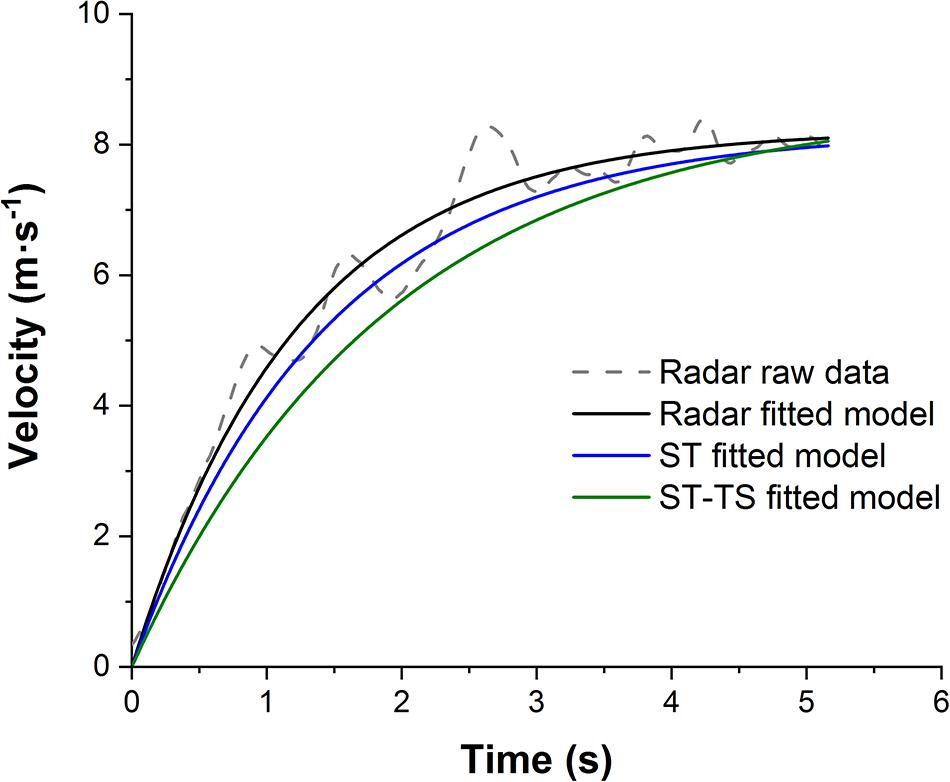
Figure 1. Raw data (dotted line) of the velocity-time curve measured by radar and fitted model (straight lines) derived from each method (high-speed video split time (ST) in blue, high-speed video split time with time shift (ST-TS) in green and radar in black). Data were collected from the same skating sprint of one player.
Considering the ST and ST-TS methods, only one rater performed the analysis. Kinovea software (Version 0.8.26, 2017) was used to measure the split times by manually selecting the frames in which the players passed the markers with their hip. Spreadsheets designed by Morin and Samozino (2019) and Stenroth et al. (2020) were used to calculate FV profile and sprint mechanical variables using ST and ST-TS methods, respectively. Position of the player was modeled as a function of time with the equation (1) for ST (Morin and Samozino, 2019) and equation (2) for ST-TS adding the time shift parameter c (Stenroth et al., 2020).
Constant maximal velocity (Vmax, plateau of the velocity) and τ (acceleration time constant) were found using built-in solver function of Excel (Microsoft Corporation, Redmond, Washington, United States) (Figure 1). The solver was set to minimize the sum of squared differences between the modeled and actual positions of the player by altering the constants. A non-linear generalized reduced gradient algorithm was used as the solving method. After estimating Vmax and τ, all mechanical variables from the FV relationship could be modeled after integration:
where Fh (in N) is the net horizontal antero-posterior of the ground reaction force, m (in kg) is the system mass which included full ice hockey equipment during the on-ice measures and Faero (in N) is the resistance due to aerodynamic friction force, individualized for the participants (i.e., depending on the height and body mass equipped). Mean net horizontal antero-posterior power output (Ph, in W) was then modeled at each instant as the product of Fh and Vh:
In order to synchronize the two devices, the start of the skating sprint was determined as the moment in which there is the first movement of the player detected by visual inspection with high-speed video and the center-of-mass velocity above an arbitrary speed of 0.2 m.s–1 for the radar (Romero-Franco et al., 2017). A total of 21 skating sprints were analysed individually.
Statistical Analysis
All data were analyzed using custom written scripts (Origin 2020, OriginLab Corporation, Northampton, MA) and expressed as mean ± standard deviation (SD). Statistical significance was set at p < 0.05. Normality was confirmed using the Shapiro-Wilk test. To investigate systematic bias (mean differences), a paired sample t-test was conducted between the same mechanical variables inferred from ST, ST-TS and radar-derived methods. The level of concordance between ST, ST-TS and radar-derived methods was estimated by the Bland and Altman plots (Bland and Altman, 2010) with a 95% limit of agreements (95% LoA, mean bias; mean difference, ±1.96 SD). The Cohen’s d scale was used to interpret the effect sizes (Hopkins et al., 2009). To determine the inter-method relative reliability of computed variables, ICCs were calculated (Hopkins et al., 2009). Pearson’s product-moment correlation analysis was used to determine the relationship between the same mechanical variables derived from ST, ST-TS and radar-derived methods (Hopkins et al., 2009). The typical error of the estimate (TEE) (95% confidence intervals, 95% CI) was calculated and standardized for the purpose of interpretation (Hopkins, 2000).
Results
The mean time shift parameter (c) of the ST-TS method for all the player was 0.268 ± 0.053 s. ST and ST-TS showed significant mean differences compared to radar for all variables except for V0 (p = 0.26) and Vmax (p = 0.13) inferred from ST (Table 1). For F0, V0, Pmax and Vmax, the mean bias between ST, ST-TS and radar-derived methods were displayed as Bland and Altman plots (Figure 2). Bias and random errors for the other variables were reported in Tables 1, 2. ST showed a negative small-to-moderate difference compared to radar for all variables except for FV slope (positive moderate difference) (Table 1). ST-TS showed even largely lower values for F0, Pmax, RFmax, and Drf variables and moderate-to-large higher values for V0, FV slope and Vmax variables compared to radar (Table 2). Relative reliability (ICC) was moderate-to-high for F0, Pmax, and RFmax for both ST and ST-TS while other variables were very low-to-low (Tables 1, 2). Correlations between ST or ST-TS and radar ranged from trivial for Vmax and V0 to very large for F0 (only for ST-TS), Pmax and RFmax (Tables 1, 2). TEE was small for Pmax to very large for V0, Drf and Vmax for ST (Table 1) and ranged from moderate for F0, Pmax and RFmax to very large for all other variables for ST-TS (Table 2).
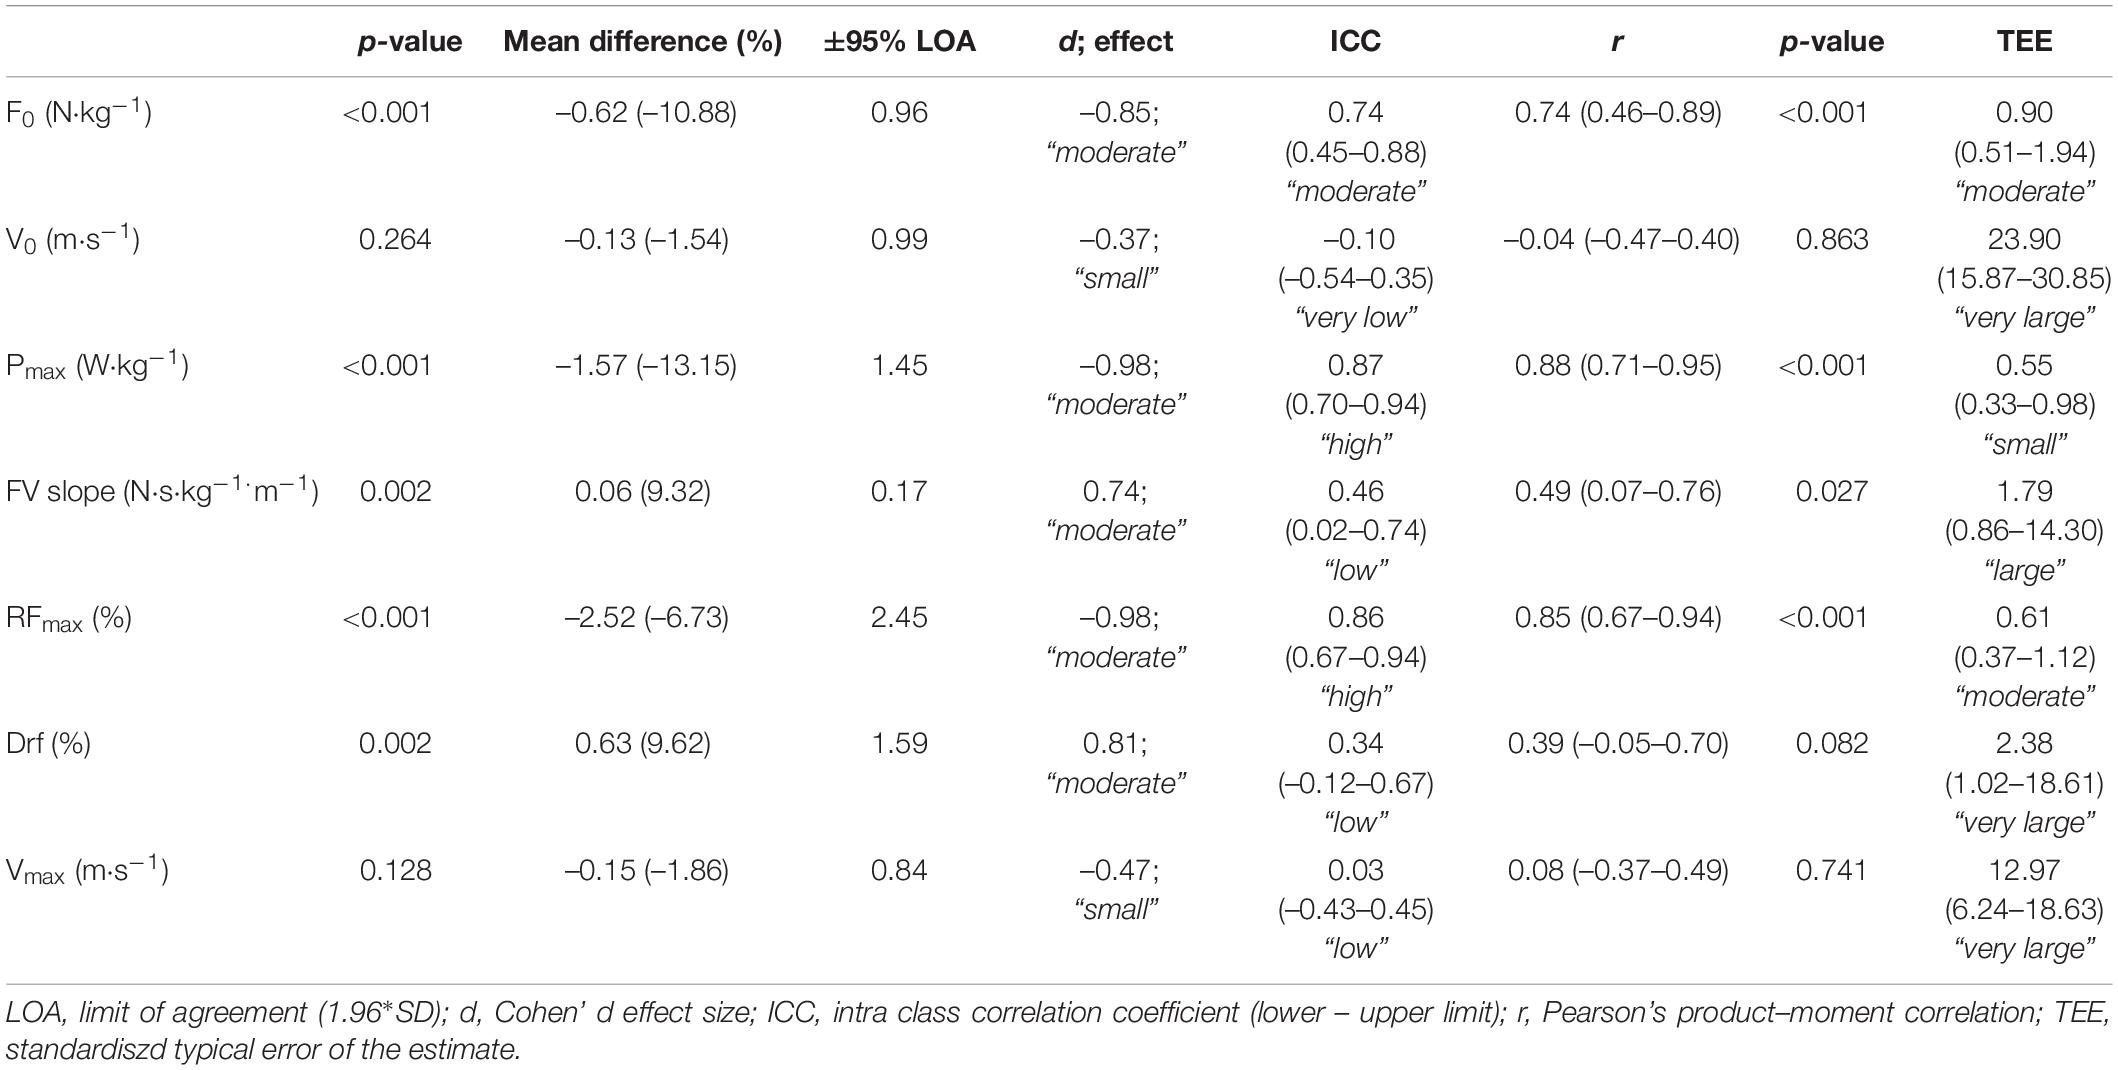
Table 1. Differences in forward skating sprint mechanical variables determined with split time (ST) high-speed video-based method in reference to radar-based method.
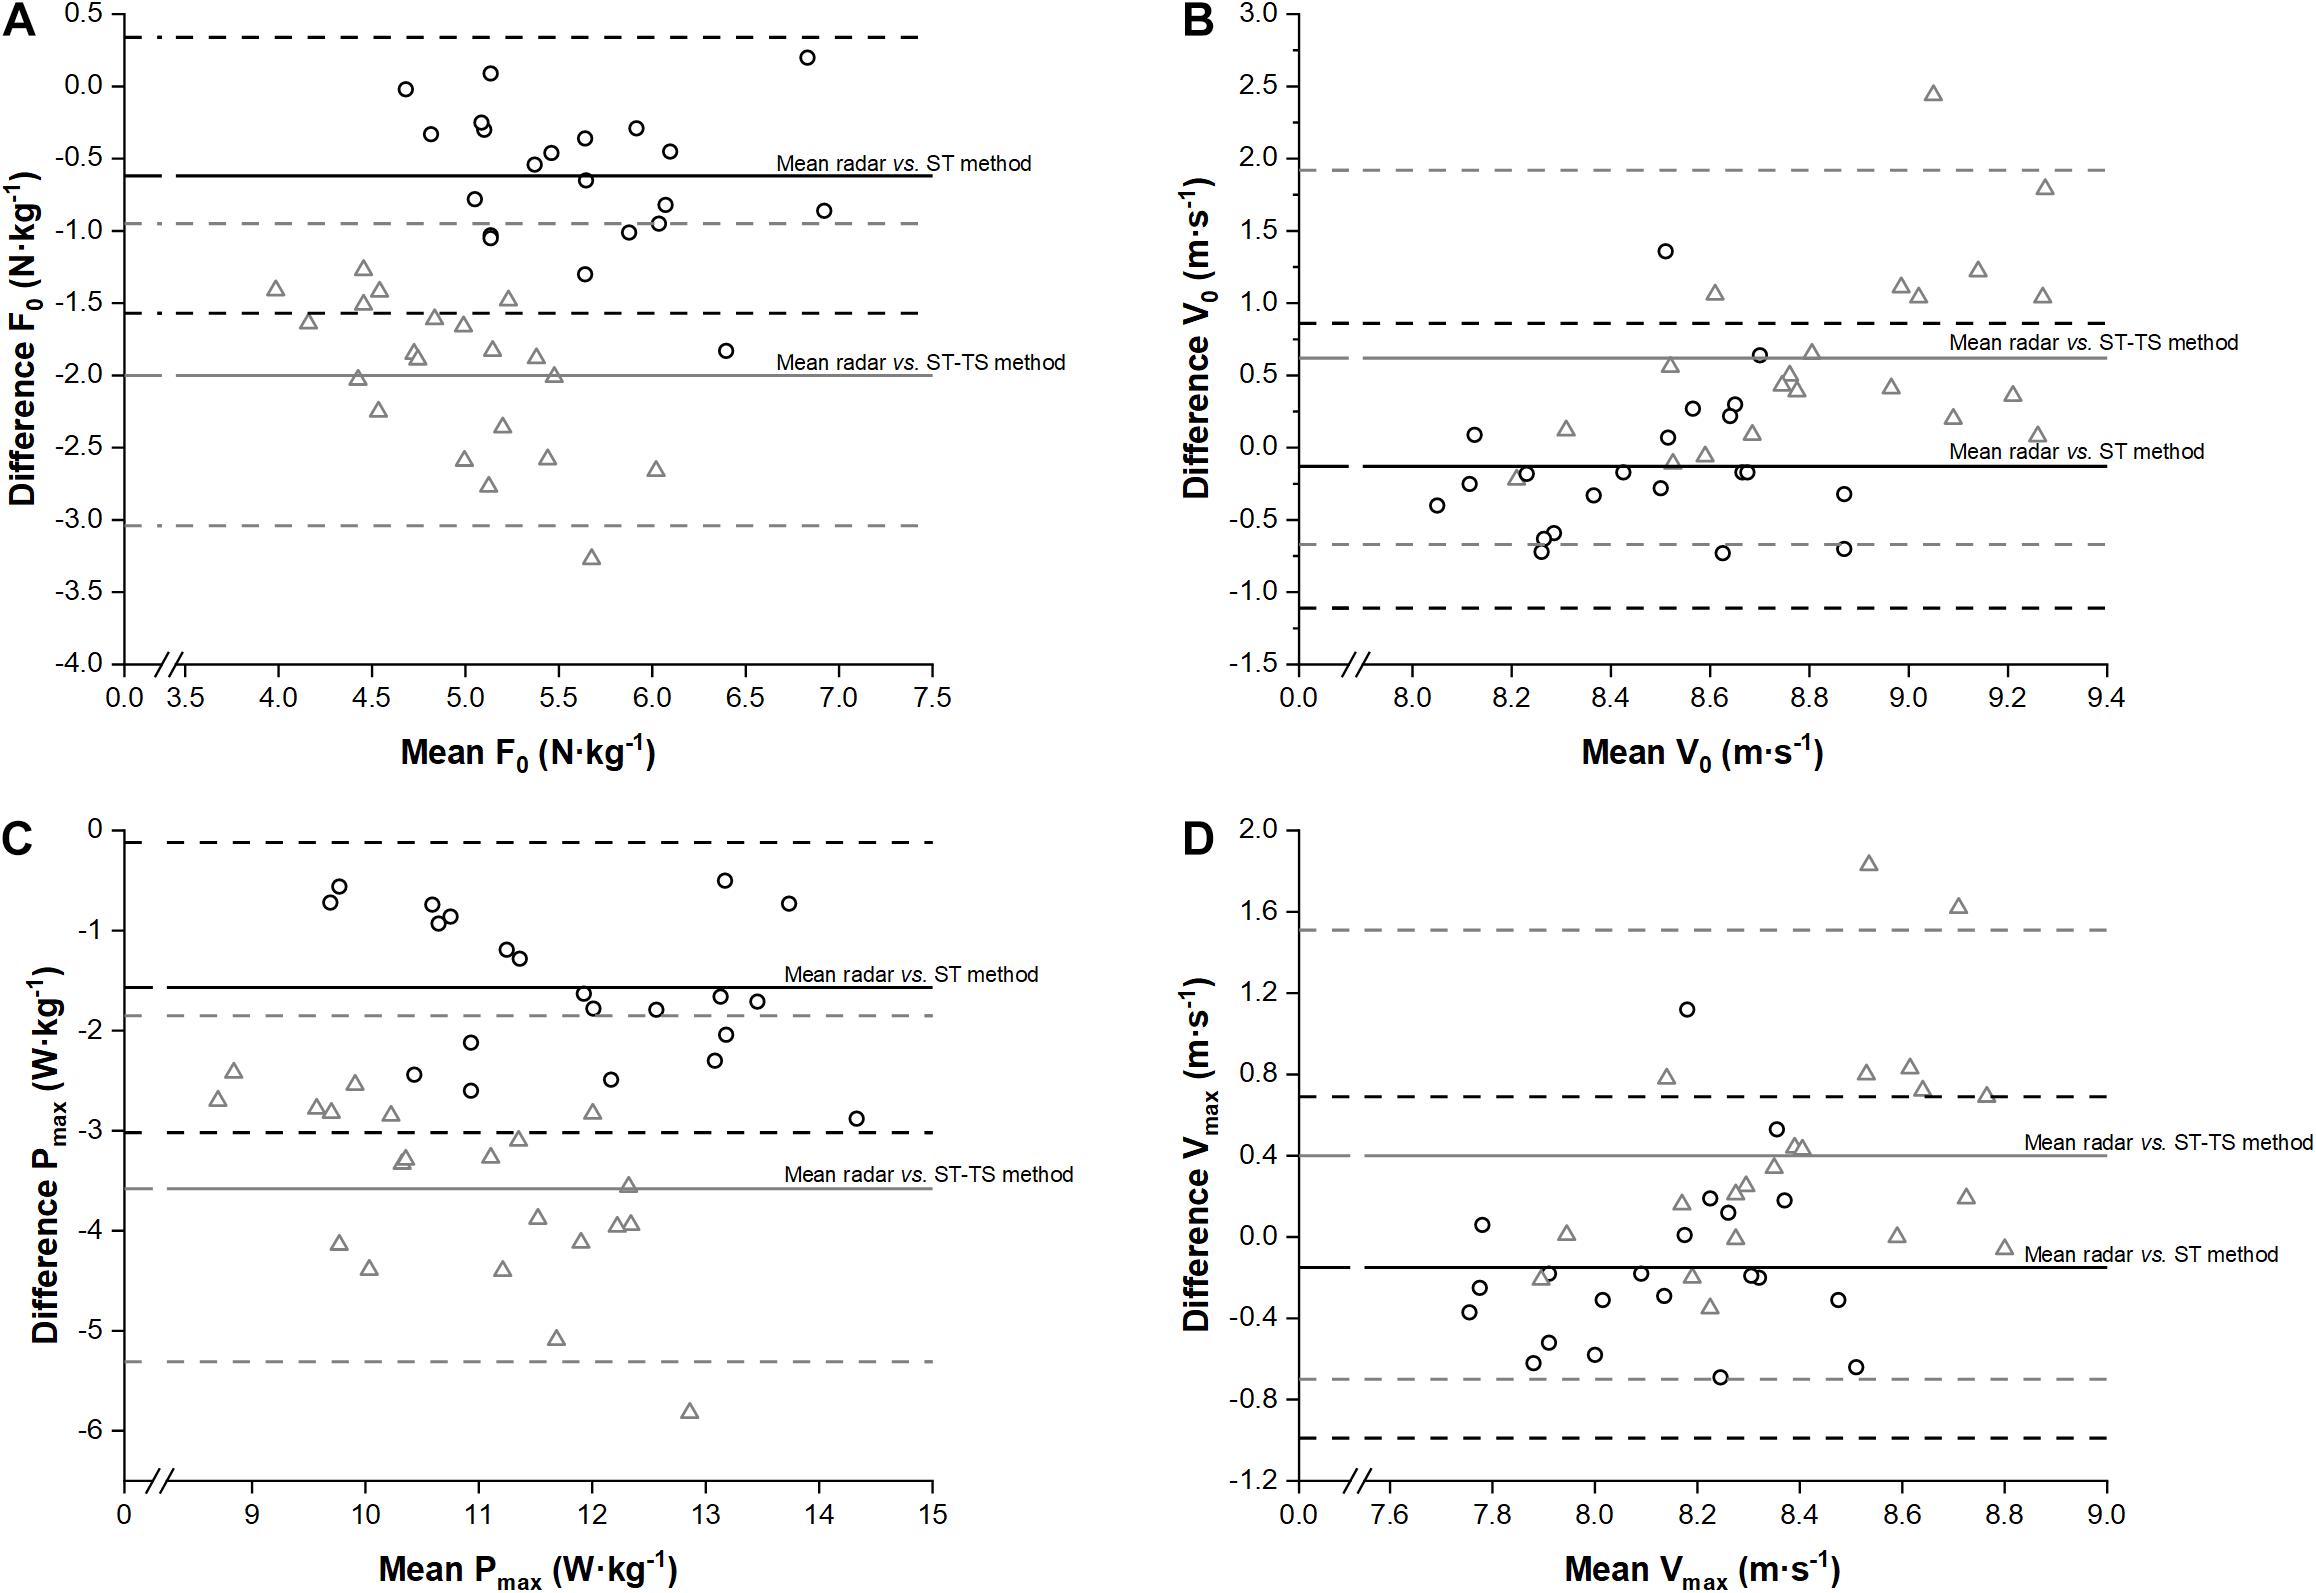
Figure 2. Bland and Altman plots of both high-speed video-based methods and radar-derived method for F0 (panel (A), V0 (panel (B), Pmax (panel (C) and Vmax (panel (D). Dark circles and lines represented differences between high-speed video split time method (ST) and radar-derived method while gray triangles and lines represented differences between high-speed video split time with time shift method (ST-TS) and radar-derived method. Upper and lower horizontal dotted lines represent the 95% limits of agreement (mean ± 1.96 SD of the difference between methods).
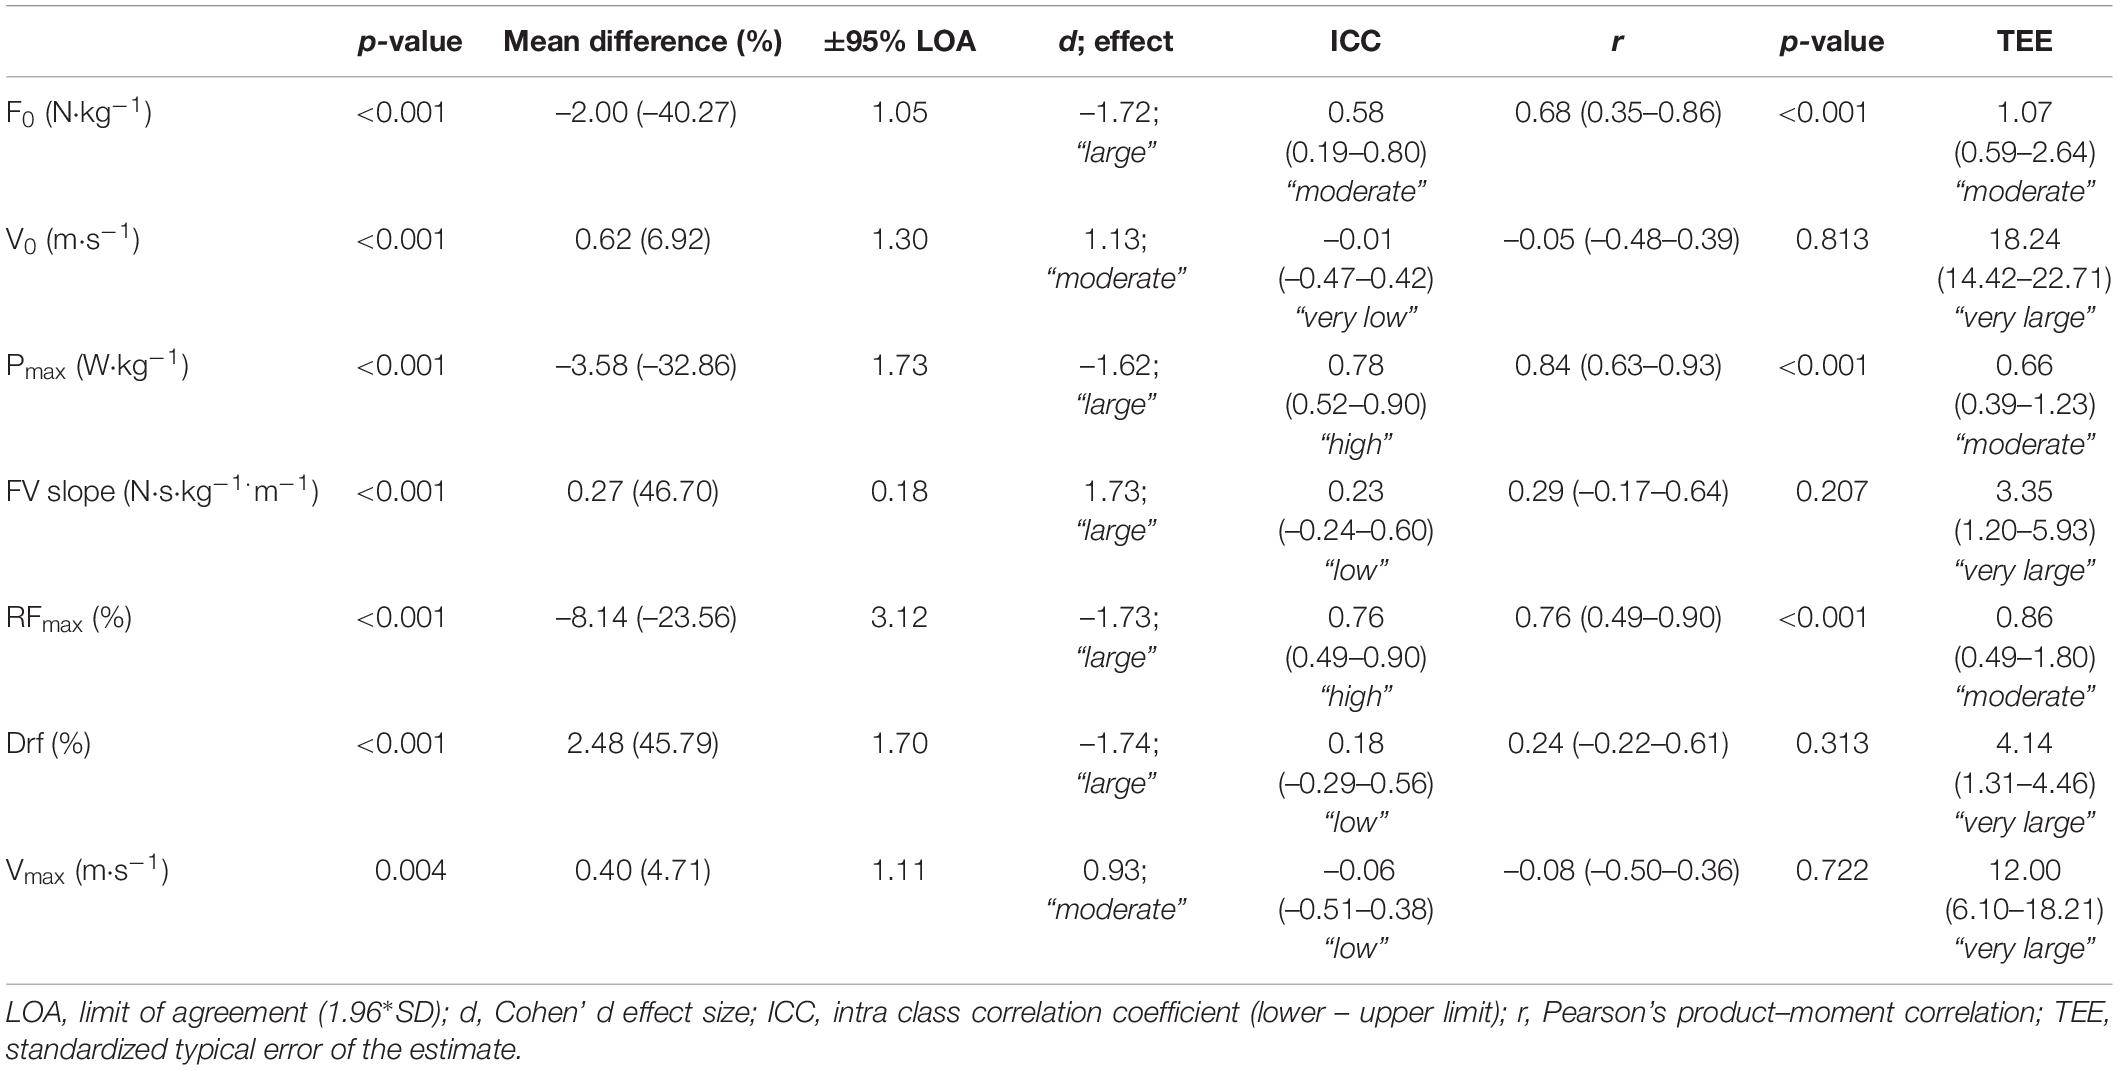
Table 2. Differences in forward skating sprint mechanical variables determined with split time with a time-shift (ST-TS) high-speed video-based method in reference to radar-based method.
Discussion
This present study demonstrated that, comparatively to radar-derived processing, both high-speed video-based methods underestimated the force and power variables (i.e., F0, Pmax, RFmax, and Drf, small-to-large differences), while velocity (i.e., V0 and Vmax) and FV slope variables were moderately to-largely overestimated by ST-TS method only. Furthermore, although mechanical variables derived from ST appeared to be more accurate than ST-TS, high-speed video-based methods seemed to be less accurate with small-to-large mean differences depending on variables compared to the measures obtained from the radar.
In line with Stenroth et al. (2020), our findings showed that the implementation of time shift in velocity data processing (ST-TS) induced a significant (p < 0.001) and large (d ranging from 1.62 to 1.74) underestimation (from –24 to–46% on average) of the main determinants of forward skating sprint performance (i.e., F0, Pmax, RFmax, and Drf variables) when compared to radar-derived data processing (Perez et al., 2020). While significant differences between ST and radar (p ≤ 0.002) were also observed with a moderate effect size (d ranging 0.81–0.98), using original ST (Romero-Franco et al., 2017) appeared to reduce, but not fully remove, the underestimation of the main determinants of forward skating sprint performance (from–7 to–13%). Additionally, ST tended to improve the ICCs compared to ST-TS, especially for F0, Pmax, RFmax, and Drf variables (0.34–0.87 vs. 0.18–0.78). Finally, our results showed that both F0, Pmax and RFmax high-speed video-derived measures showed significant large-to-very large correlations (r ranging from 0.68 to 0.88) with those derived from the radar-derived method. However, these results (large range and r < 0.9) do not allow to clearly consider these methods as accurate as the reference radar-based method.
In their study, Stenroth et al. (2020) measured sprint skating velocity over a 30-m. Budarick et al. (2018) showed that this distance may not allow ice hockey players to reach their ultimate maximum velocity as acceleration was still positive at 34 m. The achievement of Vmax is a prerequisite to reliably build the FV relationship during forward skating sprint inferred from the mono-exponential modeling of the velocity-time curve (Samozino et al., 2016; Perez et al., 2019). It is therefore unlikely that a 30-m distance may be consistently long enough for ice hockey players to reach their Vmax (Perez et al., 2020). This setup could thus induce higher variability in measured peak velocity compared to longer sprint distance and partly explain the difference in Vmax measurement. In line with the findings of Stenroth et al. (2020), we observed a significant overestimation of V0 and Vmax assessed over 40 m using ST-TS compared to radar, leading to higher differences in FV slope. This overestimation could be mainly attributed to the added time shift parameter, which has been shown to lower the curvature of the velocity-time relationship (Stenroth et al., 2020). Considering ST, V0, and Vmax were not significantly different compared to the radar-derived measures with a small difference (d ranging 0.37 and 0.47, respectively). Importantly, V0 and Vmax variables inferred from both high-speed video-based methods showed very large TEEs (12.00–23.90), very low ICCs (0.01–0.10) and no correlations (r ranging from 0.04 to 0.08) compared to the same radar-derived variables. These results confirm that the assessment of instantaneous metric (Vmax) or extracted from the FV profile requires continuous measures with sufficient sampling frequency as allowed using the radar.
While the current findings revealed large-to-very large correlations between high-speed video-based and radar-derived method, particularly for mechanical determinants of forward skating sprint, high-speed video-based methods present some limitations for measuring mechanical variables. The accuracy of the determination of the frame corresponding to the start of the sprint which corresponds to the beginning of the force production is indeed a crucial factor for accurate assessment of sprint mechanical variable (Samozino, 2018). Unfortunately, this standardized three-point starting position recommended in sprint running (Romero-Franco et al., 2017) is not directly transposable to on-ice forward skating. Such subjective data processing may lead to potential approximations or errors and in turn impair inter-trial and inter-rater reliability (Romero-Franco et al., 2017; Stenroth et al., 2020). While ST-TS developed by Stenroth et al. (2020) improved intra-rater reliability, our findings showed that this method, adding a time shift, seems less accurate than the original procedure developed by Romero-Franco et al. (2017).
Several limitations should be kept in mind when interpreting the data from the present study. Firstly, one could note that none of the tested methods includes a direct synchronization between movement kinetics and mechanical variable (e.g., using a trigger signal), which necessarily affect the determination of sprint start and resulting metrics and could be dependant of investigator’s expertise. Future studies may consider to use more than one camera in order to possibly enhance the accuracy of split time assessment. For instance, placing three panning cameras at the start line, 15 and 30 m, in the frontal plane, may allow practitioners to more precisely determine the frame corresponding to the start of the sprint or the time instant at which the skater crosses vertical markers representing split times with parallax correction (Chow, 1993). However, while such setting could improve the measurement accuracy, it would require to synchronize the different devices, which may complicate the data collection and further increase the risk of error. Finally, the sample size precludes any general conclusions and further studies are warranted with larger population, including male or mixed participants.
While easy-to-use, high-speed video-based methods lead to a truncated estimation of mechanical variables compared to radar-derived measures mainly due to subjective determination of the skating sprint start. The implementation of time shift seems to further impair the validity of the measurements. Radar-derived method should be prioritized to accurately determine mechanical variables during on-ice forward skating sprint. Practitioners have to be aware of the limitations of the high-speed video-based methods when implementing them to assess mechanical determinants of the on-ice forward skating sprint.
Data Availability Statement
The raw data supporting the conclusions of this article will be made available by the authors, without undue reservation.
Ethics Statement
The studies involving human participants were reviewed and approved by the Ouest IV. Written informed consent to participate in this study was provided by the participants’ legal guardian/next of kin.
Author Contributions
JP, GG, and FB contributed to conception and design of the study and wrote sections of the manuscript. JP performed the statistical analysis. All authors contributed to the manuscript revision, read, and approved the submitted version.
Funding
JP received a scholarship (CIFRE contract no 2017/1706) funded by the French Ice Hockey Federation and the French Agency of Research and Technology. The Laboratory Sport, Expertise and Performance (EA 7370) is a partner of the French-speaking network ReFORM, recognized as a Research Centre for the Prevention of Injury and Illness and the Protection of Athletes by the Olympic Committee (IOC). As a member of the IOC Medical Research Network, ReFORM has received funding from the IOC to establish long-term research programs on the prevention of injuries and illnesses in sport for the protection of athlete health.
Conflict of Interest
The authors declare that the research was conducted in the absence of any commercial or financial relationships that could be construed as a potential conflict of interest.
References
Bezodis, N. E., Salo, A. I., and Trewartha, G. (2012). Measurement error in estimates of sprint velocity from a laser displacement measurement device. Int. J. Sports Med. 33, 439–444. doi: 10.1055/s-0031-1301313
Bland, J. M., and Altman, D. G. (2010). Statistical methods for assessing agreement between two methods of clinical measurement. Int. J. Nurs. Stud. 47, 931–936.
Budarick, A. R., Shell, J. R., Robbins, S. M. K., Wu, T., Renaud, P. J., and Pearsall, D. J. (2018). Ice hockey skating sprints: run to glide mechanics of high calibre male and female athletes. Sports Biomech. 19, 601–617. doi: 10.1080/14763141.2018.1503323
Chow, J. W. (1993). A panning videographic technique to obtain selected kinematic characteristics of the strides in sprint hurdling. J. Appl. Biomech. 9:149. doi: 10.1123/jab.9.2.149
Haugen, T., and Buchheit, M. (2016). Sprint running performance monitoring: methodological and practical considerations. Sports Med. 46, 641–656. doi: 10.1007/s40279-015-0446-0
Hopkins, W. G. (2000). Measures of reliability in sports medicine and science. Sports Med. 30, 1–15. doi: 10.2165/00007256-200030010-00001
Hopkins, W. G., Marshall, S. W., Batterham, A. M., and Hanin, J. (2009). Progressive statistics for studies in sports medicine and exercise science. Med. Sci. Sports Exerc. 41, 3–13. doi: 10.1249/MSS.0b013e31818cb278
Jimenez-Reyes, P., Garcia-Ramos, A., Parraga-Montilla, J. A., Morcillo-Losa, J. A., Cuadrado-Penafiel, V., Castano-Zambudio, A., et al. (2020). Seasonal changes in the sprint acceleration force-velocity profile of elite male soccer players. J. Strength Cond. Res. doi: 10.1519/JSC.0000000000003513 [Epub ahead of print].
Jimenez-Reyes, P., Samozino, P., and Morin, J. B. (2019). Optimized training for jumping performance using the force-velocity imbalance: individual adaptation kinetics. PLoS One 14:e0216681. doi: 10.1371/journal.pone.0216681
Morin, J. B., and Samozino, P. (2016). Interpreting power-force-velocity profiles for individualized and specific training. Int. J. Sports Physiol. Perform. 11, 267–272. doi: 10.1123/ijspp.2015-0638
Morin, J.-B., and Samozino, P. (2019). Spreadsheet for Sprint Acceleration Force-Velocity-Power Profiling. ResearchGate. Available online at: https://www.researchgate.net/publication/321767606_Spreadsheet_for_Sprint_acceleration_force-velocity-power_profiling (accessed August 20, 2020).
Pearsall, D., Turcotte, R., Levangie, C., and Forget, S. (2013). “Biomechanical adaptation in ice hockey skating,” in Routledge Handbook of Ergonomics in Sport and Exercise, ed. H. Youlian (Abingdon: Routledge), 51–60.
Perez, J., Guilhem, G., and Brocherie, F. (2019). Reliability of the force-velocity-power variables during ice hockey sprint acceleration. Sports Biomech 1–15. doi: 10.1080/14763141.2019.1648541 [Epub ahead of print].
Perez, J., Guilhem, G., Hager, R., and Brocherie, F. (2020). Mechanical determinants of forward skating sprint inferred from off- and on-ice force-velocity evaluations in elite female ice hockey players. Eur. J. Sport. Sci. 21, 192–203. doi: 10.1080/17461391.2020.1751304
Romero-Franco, N., Jiménez-Reyes, P., Castaño-Zambudio, A., Capelo-Ramírez, F., Rodríguez-Juan, J. J., González-Hernández, J., et al. (2017). Sprint performance and mechanical outputs computed with an iPhone app: comparison with existing reference methods. Eur. J. Sport Sci. 17, 386–392. doi: 10.1080/17461391.2016.1249031
Samozino, P. (2018). “A simple method for measuring force, velocity and power capabilities and mechanical effectiveness during sprint running,” in Biomechanics of Training and Testing: Innovative Concepts and Simple Field Methods, eds J.-B. Morin and P. Samozino (Cham: Springer International Publishing), 237–267.
Samozino, P., Rabita, G., Dorel, S., Slawinski, J., Peyrot, N., Saez De Villarreal, E., et al. (2016). A simple method for measuring power, force, velocity properties, and mechanical effectiveness in sprint running. Scand. J. Med. Sci. Sports 26, 648–658. doi: 10.1111/sms.12490
Simperingham, K. D., Cronin, J. B., Pearson, S. N., and Ross, A. (2019). Reliability of horizontal force-velocity-power profiling during short sprint-running accelerations using radar technology. Sports Biomech. 18, 88–99. doi: 10.1080/14763141.2017.1386707
Simperingham, K. D., Cronin, J. B., and Ross, A. (2016). Advances in sprint acceleration profiling for field-based team-sport athletes: utility, reliability, validity and limitations. Sports Med. 46, 1619–1645. doi: 10.1007/s40279-016-0508-y
Stenroth, L., Vartiainen, P., and Karjalainen, P. A. (2020). Force-velocity profiling in ice hockey skating: reliability and validity of a simple, low-cost field method. Sports Biomech 1–15. doi: 10.1080/14763141.2020.1770321 [Epub ahead of print].
Nomenclature
ah Acceleration
d Cohen’s d scale
Drf Rate of decrease of the ratio of the horizontal component of the ground-reaction force to the corresponding resultant force (%)
F0 Maximal theoretical horizontal force relative to body mass (N.kg–1)
Faero Aerodynamic friction force (N)
Fh Net horizontal antero-posterior ground reaction force (N)
FV Force-velocity relationship
ICC Intra-class correlation coefficients
m System mass (kg)
Ph Mean net horizontal antero-posterior power output (W)
Pmax Maximal theoretical horizontal power relative to body mass (W.kg–1)
r Pearson’s product–moment correlation
RFmax Maximal ratio of the horizontal component of the ground-reaction force to the corresponding resultant force (%)
ST Split time method using high-speed video
ST-TS Split time with time shift method using high-speed video
V0 Maximal theoretical horizontal velocity (m.s–1)
Vh Instantaneous horizontal velocity (m.s–1)
Vmax Maximal horizontal velocity (m.s–1)
τ Acceleration time constant (m.s–2).
Keywords: biomechanics, ice hockey, assessment, muscle capacities, sprint performance
Citation: Perez J, Guilhem G and Brocherie F (2021) Truncated Estimation of Skating Force-Velocity Profiling When Using High-Speed Video-Based Methods Compared to Radar-Derived Processing. Front. Bioeng. Biotechnol. 9:661744. doi: 10.3389/fbioe.2021.661744
Received: 31 January 2021; Accepted: 01 June 2021;
Published: 24 June 2021.
Edited by:
Tarun Goswami, Wright State University, United StatesReviewed by:
Chi-Wen Lung, Asia University, TaiwanHui Tang, Hong Kong Polytechnic University, China
Copyright © 2021 Perez, Guilhem and Brocherie. This is an open-access article distributed under the terms of the Creative Commons Attribution License (CC BY). The use, distribution or reproduction in other forums is permitted, provided the original author(s) and the copyright owner(s) are credited and that the original publication in this journal is cited, in accordance with accepted academic practice. No use, distribution or reproduction is permitted which does not comply with these terms.
*Correspondence: Jerome Perez, amVyb21lLnBlcmV6QGluc2VwLmZy