 Thanawat Boontip
 Rungaroon Waditee-Sirisattha
 Kohsuke Honda
 Suchada Chanprateep Napathorn
- 1Department of Microbiology, Faculty of Science, Chulalongkorn University, Bangkok, Thailand
- 2International Center for Biotechnology, Osaka University, Suita, Japan
The present study attempted to increase poly(3-hydroxybutyrate) (PHB) production by improving expression of PHB biosynthesis operon derived from Cupriavidus necator strain A-04 using various types of promoters. The intact PHB biosynthesis operon of C. necator A-04, an alkaline tolerant strain isolated in Thailand with a high degree of 16S rRNA sequence similarity with C. necator H16, was subcloned into pGEX-6P-1, pColdI, pColdTF, pBAD/Thio-TOPO, and pUC19 (native promoter) and transformed into Escherichia coli JM109. While the phaCA–04 gene was insoluble in most expression systems tested, it became soluble when it was expressed as a fusion protein with trigger factor (TF), a ribosome associated bacterial chaperone, under the control of a cold shock promoter. Careful optimization indicates that the cold-shock cspA promoter enhanced phaCA–04 protein expression and the chaperone function of TF play critical roles in increasing soluble phaCA–04 protein. Induction strategies and parameters in flask experiments were optimized to obtain high expression of soluble PhaCA–04 protein with high YP/S and PHB productivity. Soluble phaCA–04 was purified through immobilized metal affinity chromatography (IMAC). The results demonstrated that the soluble phaCA–04 from pColdTF-phaCABA–04 was expressed at a level of as high as 47.4 ± 2.4% of total protein and pColdTF-phaCABA–04 enhanced soluble protein formation to approximately 3.09−4.1 times higher than that from pColdI-phaCABA–04 by both conventional method and short induction method developed in this study. Cultivation in a 5-L fermenter led to PHB production of 89.8 ± 2.3% PHB content, a YP/S value of 0.38 g PHB/g glucose and a productivity of 0.43 g PHB/(L.h) using pColdTF-phaCABA–04. The PHB film exhibited high optical transparency and possessed Mw 5.79 × 10⁵ Da, Mn 1.86 × 10⁵ Da, and PDI 3.11 with normal melting temperature and mechanical properties.
Introduction
The global environmental concern regarding microplastics in the marine environment as contaminants with significant impacts on animal and human health has led to a call for national and international policies from more than 60 countries to ban or place a levy on single-use plastics (Steensgaard et al., 2017; Xanthos and Walker, 2017; Schnurr et al., 2018; Prata et al., 2019). Renowned global companies have also integrated regulations and policies to ban single-use plastics into their green marketing and corporate social responsibility policies. Bioplastics are becoming a popular alternative to single-use plastics to reduce the amount of microplastic waste. Recently, the role of compostable plastics within the circular economy has been highlighted. To establish a truly circular economy, the EU focuses on the contribution of biodegradable and compostable plastics to help the EU to meet its organic waste recovery targets by the end of 2023. The market for bioplastics is growing and the demand for bioplastics is rising. European Bioplastics reported that the global bioplastic production capacity will increase by 36 percent from 2.1 million tons in 2020 to approximately 2.8 million tons in 2025 (Bie, 2020). Among the various types of bioplastics, polyhydroxyalkanoates (PHAs) are an important biodegradable polymer family, as they are one hundred percent biobased and fully biodegradable in all environments, especially marine (ASTM 7081) and fresh water environments (Gross and Kalra, 2002; Volova et al., 2007).
To obtain both the environmental and economic benefits of PHAs over synthetic plastics and other bioplastics, microorganisms that exhibit efficient PHA production from inexpensive and renewable carbon sources are urgently required to develop a low-cost approach. Microbial cells typically accumulate PHA at approximately 30–50% of the cell dry mass (CDM). The best known industrial PHA producer, Cupriavidus necator H16 (formerly known as Alcaligenes eutrophus, Ralstonia eutropha, and Wautersia eutropha), is capable of accumulating polyhydroxybytyrate (PHB) at over 80% of the CDM. PHA accumulation is tightly regulated by imbalanced growth conditions with excess carbon but limited nitrogen (Kawaguchi and Doi, 1992). One of the major limitations in the production of PHAs in wild-type strains has been intracellular polymer degradation caused by endogenous PHA depolymerases, which is different from the behavior of exogenous PHA depolymerases (Gebauer and Jendrossek, 2006). Therefore, intracellular PHAs are often spontaneously degraded during cultivation when the bacteria require carbon, resulting in low PHA content and a wide range of molecular weight distributions in wild-type strains. Thus, many recombinant strains have been developed by metabolic engineering to obtain a high yield of PHB and a molecular weight that is high enough for polymer processing (Liu et al., 1998; Ahn et al., 2000; Kahar et al., 2005; Taguchi et al., 2005; Agus et al., 2006b; Hiroe et al., 2012). Ordinarily, the PHB biosynthesis pathway begins with acetyl-CoA and requires three major enzymes, namely, 3-ketothiolase (phaA), NADPH-dependent acetoacetyl-CoA reductase (phaB), and PHA synthase (phaC), and these three genes are sufficient for the production of PHB in non-PHA-producing bacteria at more than 90% of the CDM when heterologously expressed in Escherichia coli (Lee et al., 1994). It has been reported that PhaC plays a key role in obtaining the polymeric form, resulting in a high level and high molecular weight of PHB (Kahar et al., 2005; Agus et al., 2006b).
To date, PHA synthases have been categorized into four major classes based on their sequence, substrate specificity, and subunit composition (Rehm, 2003; Tsuge, 2016). It was reported that PhaC derived from C. necator H16 (PhaCH16) is a Class I PhaC and is one of the most widely studied PHA synthases. It has a molecular weight of approximately 64 kDa (589 amino acids) and is located as the first gene in the PHA biosynthetic phaCAB operon, followed by PhaA and PhaB (Schubert et al., 1988; Peoples and Sinskey, 1989). It was demonstrated that the weight-average molecular weight (Mw) of PHB synthesized by wild-type bacteria is generally in the range of 0.1–2.0 × 10⁶ Da. When recombinant PhaCH16 was overexpressed in E. coli, most of the protein formed insoluble inclusion bodies due to its low aqueous solubility (Gerngross et al., 1994; Gerngross and Martin, 1995; Zhang et al., 2000; Yuan et al., 2001). To feasibly achieve industrial-scale production, PhaC would need to be produced in large quantities and its solubility would need to be improved (Thomson et al., 2013). There have been many reports that have attempted to resolve the problem mentioned above, including by modulating the concentration of the PhaC protein by varying the chemical inducer quantities (Agus et al., 2006a); expressing the protein at a reduced temperature (30°C) (Thomson et al., 2013); fusing the PhaC protein with a glutathione S-transferase (GST) tag, which is a hydrophilic tag, to improve its solubility (Harada et al., 2019); and coexpressing the protein with chaperones to obtain high total quantities of enzyme and a larger proportion in the soluble fraction than obtained without chaperones. In this study, we reported the use of pCold (cspA promoter) to improve PhaC expression as well as its combination with trigger factor (TF) chaperone and compared with the promoters mentioned above.
In a previous study, we reported the generation of the C. necator strain A-04, possessing 99.78% 16S RNA sequence similarity with C. necator H16 but differing in PHA production ability (Chanprateep et al., 2008). Designed using the gene walk technique, the PHA biosynthesis operon of C. necator strain A-04 consisted of three genes, encoding acetyl-CoA acetyltransferase (phaAA–04, 1182 bp, 40.6 kDa, accession no. FJ897461), acetoacetyl-CoA reductase (phaBA–04, 741 bp, 26.4 kDa, accession no. FJ897462) and PHB synthase (phaCA–04, 1770 bp, 64.3 kDa, accession no. FJ897463). Sequence analysis of the phaAA–04, phaBA–04, and phaCA–04 genes revealed that phaCA–04 was 99% similar to phaCH16 from C. necator H16. The difference was in the amino acid residue situated at position 122, which in phaCA–04 was proline but in C. necator H16 was leucine. The total amino acid sequences of phaAA–04 and phaBA–04 were 100% matched with those of C. necator H16 (Napathorn et al., 2021). Notably, C. necator strain A-04 prefers fructose over glucose as a carbon source, accumulating PHB at 78% of the CDM under a C/N ratio of 200, whereas it could incorporate a high mole fraction of monomeric 4-hydroxybutyrate monomeric into the poly(3-hydroxybutyrate-co-4-hydroxybutyrate) [P(3HB-co-4HB)] copolymer under a C/N ratio of 20 (Chanprateep et al., 2010), as well as the poly(3-hydroxybutyrate-co-3-hydroxyvaterate-co-4-hydroxybutyrate) [P(3HB-co-3HV-co-4HB)] terpolymer (Chanprateep and Kulpreecha, 2006). In the prior study, the intact phaCABA–04 operon was cloned into the arabinose-inducible araBAD promoter and transformed into E. coli strains Top 10, JM109 and XL-1 blue. The results showed that optimal conditions obtained from shaken flask experiments yielded 6.1 ± 1.1 g/L cell dry mass (CDM), a PHB content of 93.3 ± 0.9% (w/w) and a productivity of 0.24 g/(L⋅h). Finally, fed-batch cultivations by pH-stat control in a 5-L fermenter of E. coli strains XL1-Blue harboring pBAD/Thio-TOPO-phaCABA–04, leading the PHB production of 29.0 ± 1.1 g/L with 60.2 ± 2.3% PHB content in the cell dry mass (CDM) of 53.1 ± 1.0 g/L, a YP/S value of 0.21 g PHB/g glucose and a productivity of 0.4 g PHB/(L⋅h) in LB medium.
Thus, the objective of this work was to express phaCABA–04 genes from the isolated C. necator strain A-04 in pColdI (cspA promoter, cold- and IPTG-inducible vector, N-terminal 6His-fusion protein) and pColdTF (cspA promoter, cold- and IPTG-inducible vector, trigger factor (TF) chaperone, N-terminal 6His-fusion protein). The reason for choosing pColdI and pColdTF is that there have been few reports on utilizing cold inducible promoter for PHB production. Therefore, the obtained results will prove that if phaC solubility is enhanced, this outcome would finally result in enhancing PHB production. It has been well known that CspA was originally found as the major cold-shock protein in E. coli, consisting of 70-amino-acid residues. CspA forms a β-barrel structure with five anti-parallel β-strands and functions as an RNA chaperone. Its transient induction upon cold shock is regulated at the level of transcription, mRNA stability and translation (Yamanaka et al., 1998). Cold shock proteins are not only produced during cold stress, but in E. coli, CspA also forms 1% of all soluble proteins at the early exponential growth phase at 37°C, suggesting that CspA also functions at optimal growth temperature (Brandi et al., 1999). Furthermore, insolubility of protein overexpressed in E. coli is a common problem. Therefore, co-expression with solubility enhancers was utilized to resolve these issues, such as GST and TF. TF is a prokaryotic ribosome associated chaperone (MW 48 kDa), which facilitates co-translational protein folding, thus, reducing the chances of forming misfolded and insoluble proteins (Patzelt et al., 2002; Maier et al., 2005). As a native product from prokaryotes, TF is highly expressed in E. coli, which allowed for high yield of recombinant proteins (Baneyx, 1999). Another benefit of using the pCold system is that the induction was carried out at cold temperatures, which has been shown to significantly improve protein folding by decreasing the rate of transcription and translation, thus providing more time for the protein to be folded (Agashe et al., 2004; Baneyx and Mujacic, 2004). Compared with previous reports, the PHA biosynthesis operon of C. necator strain A-04 was also cloned into pGEX-6P-1 [tac promoter, isopropyl-β-D-thiogalactopyranoside (IPTG)-inducible vector, N-terminal GST fusion protein], pBAD/Thio-TOPO (araBAD promoter, arabinose-inducible vector, N-terminal thioredoxin fusion protein and C-terminal 6His-fusion protein) (Napathorn et al., 2021) and pUC19 (control strain, phaCABA–04 biosynthesis genes with native promoter of phaCA–04) and transformed into E. coli JM109 (Table 1). Next, to optimize phaCA–04 overexpression in shake flask cultivation, three induction methods were tested and compared with conventional induction method (Figure 1, details are described in the section “Materials and Methods”). The effect of phaCA–04 overexpression on PHB production in recombinant E. coli with respect to cell growth, glucose consumption, PHB production, and kinetic parameters in conditions ranging from flask culture to a 5-L fermenter. PhaCA–04 was purified, quantified, carefully compared versus pColdI-phaCABA–04 and pColdTF-phaCABA–04, and also between short induction and conventional induction methods. Furthermore, to examine the effect of cspA promoter and TF chaperone on the polymer properties, the produced PHB was subjected to molecular weight determination, thermal analysis and mechanical property measurement.
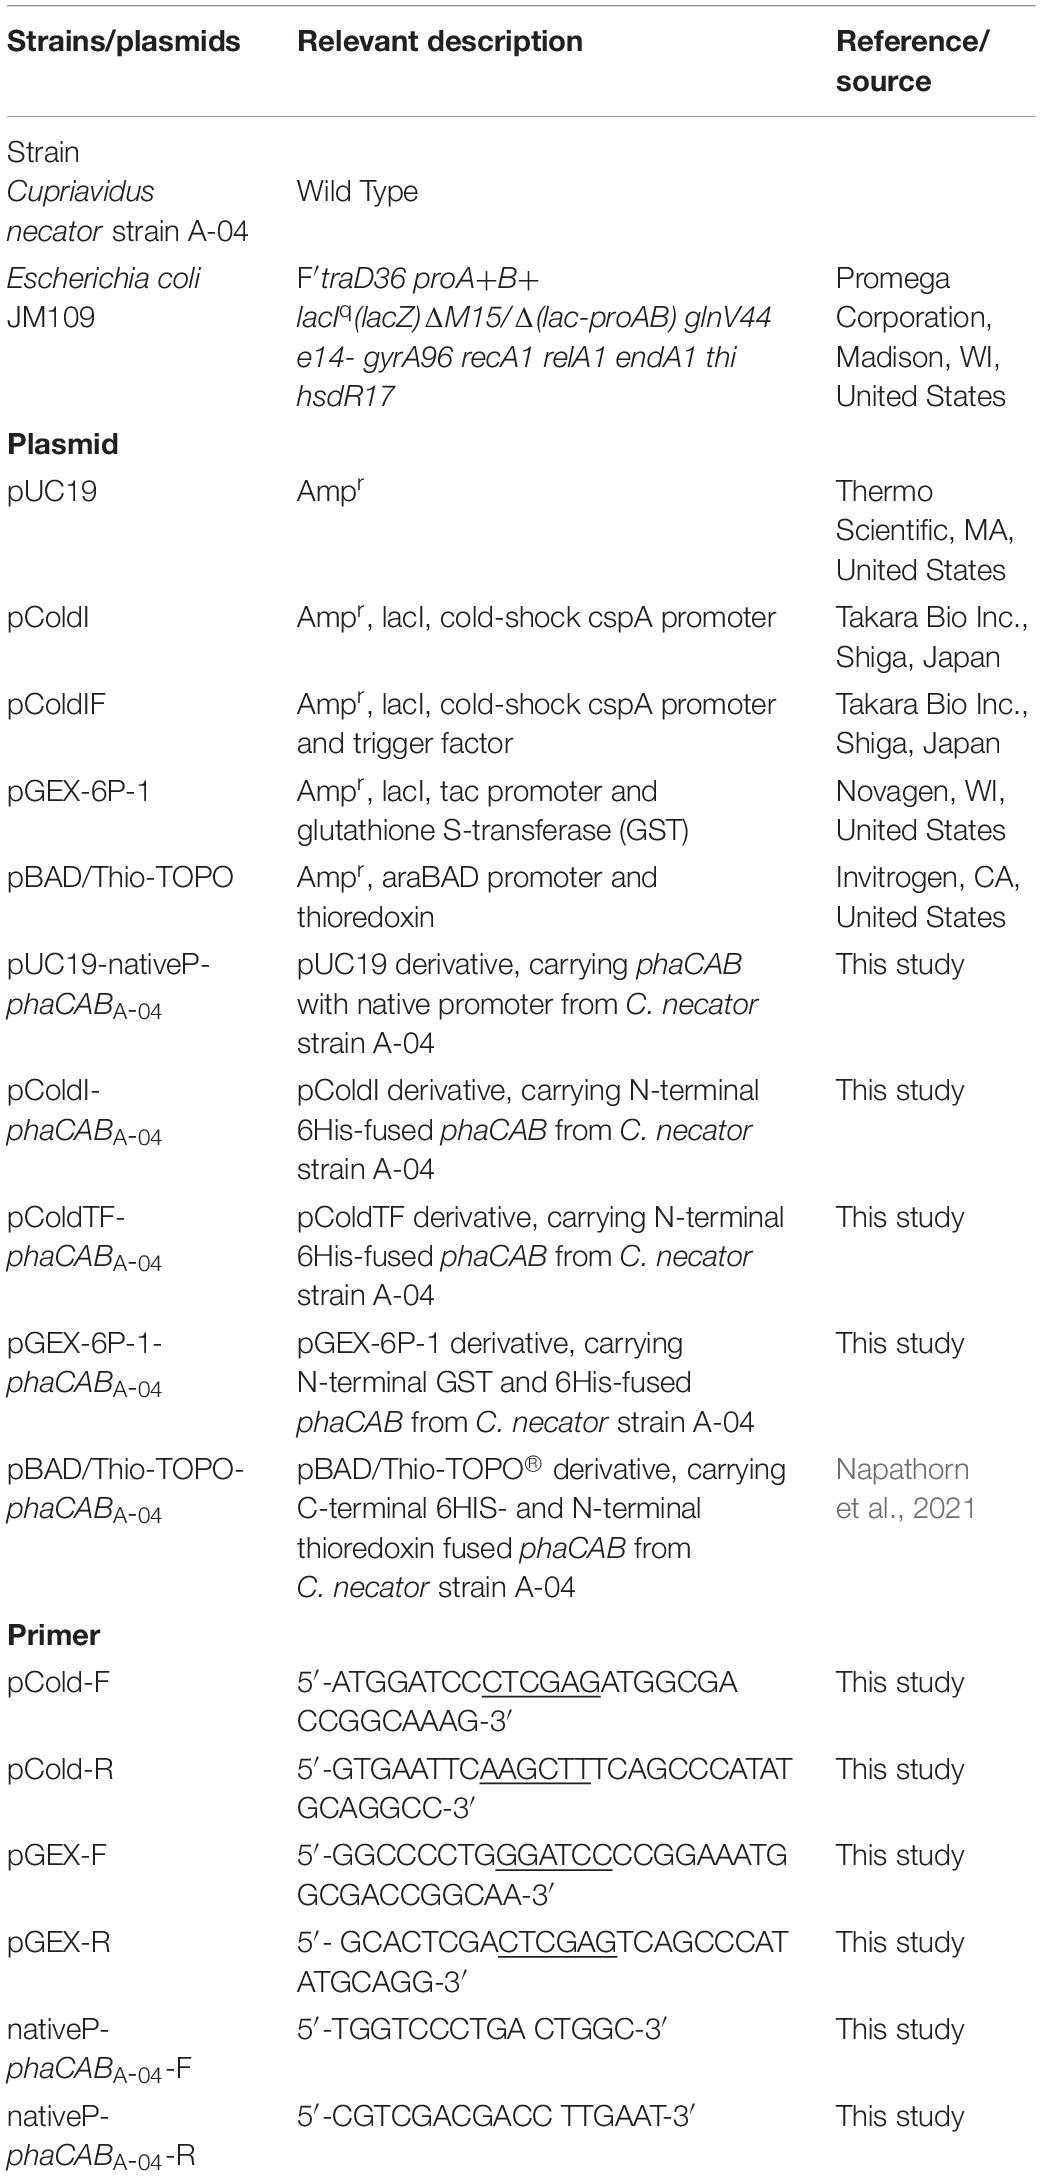
Table 1. Bacterial strains and plasmids used in this study.
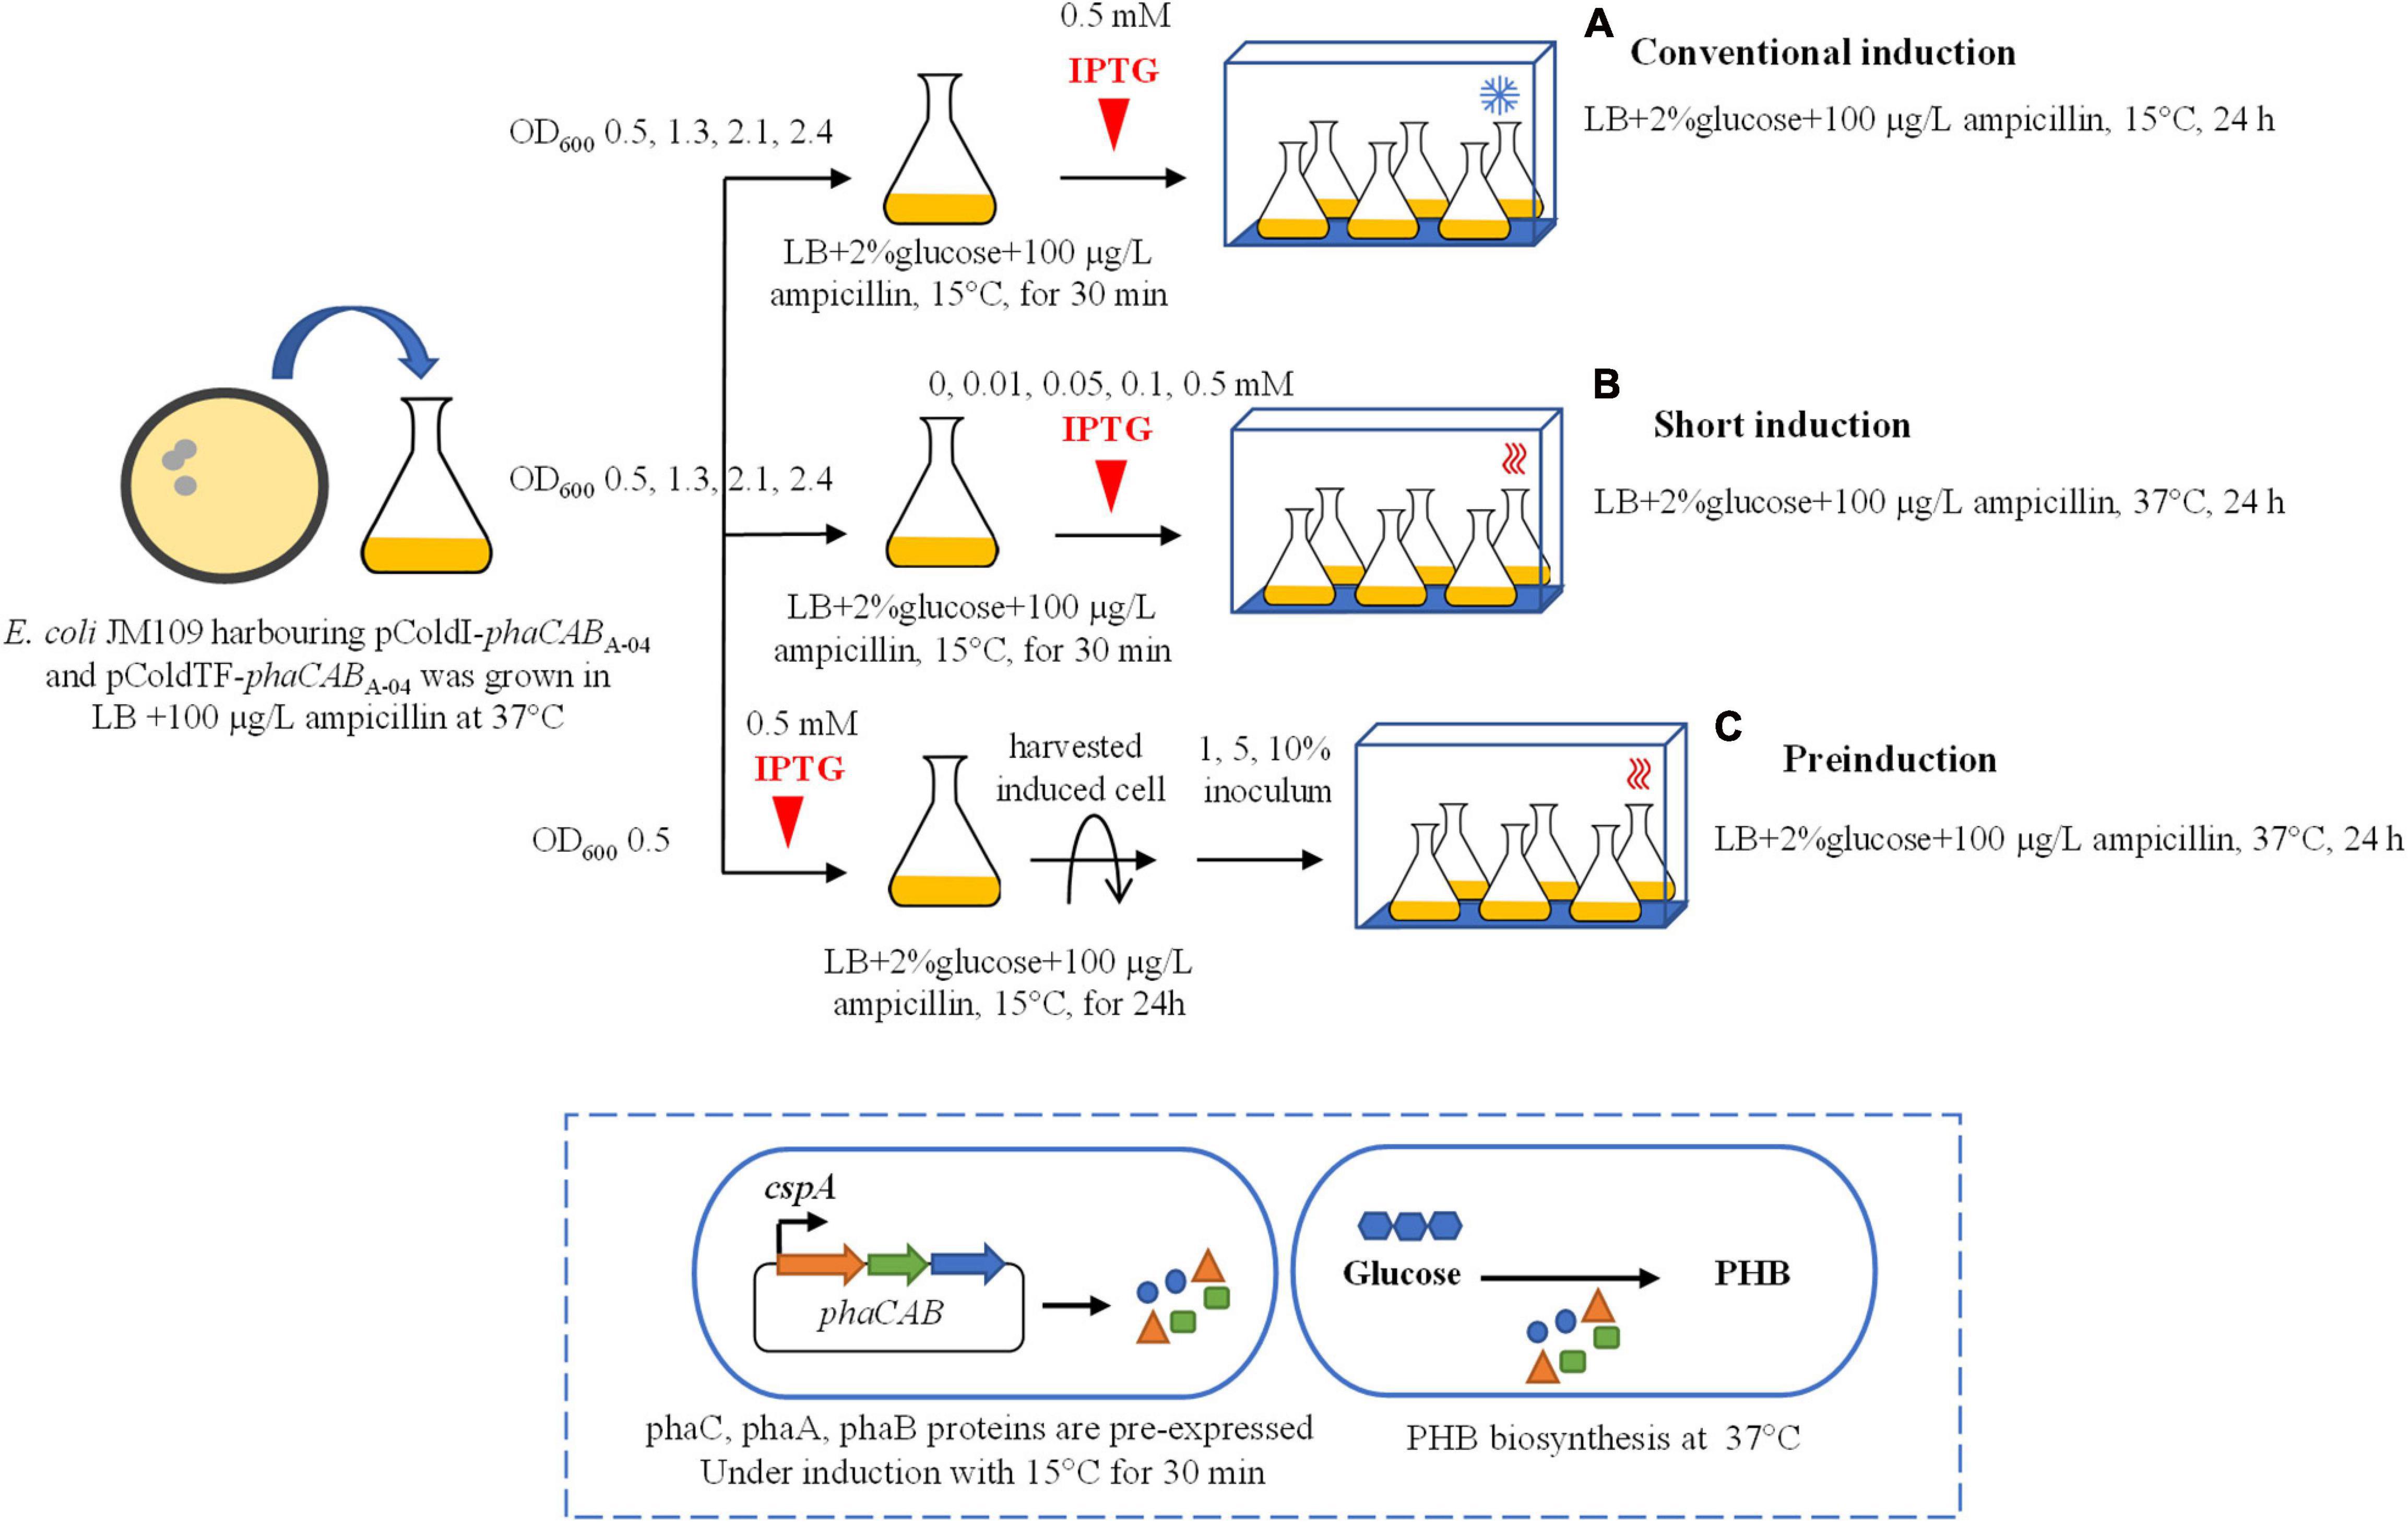
Figure 1. Schematic of three different induction methods for heterologous expression of the phaCABA–04 biosynthesis operon in E. coli JM109 (pColdI-phaCABA–04) and E. coli JM109 (pColdTF-phaCABA–04). (A) Conventional induction method: the culture was incubated at 37°C and 200 rpm until the OD600 reached 0.5, 1.3, 2.1, and 2.4. Then, the cultivation temperature was decreased from 37 to 15°C for 30 min, and the expression of the phaCABA–04 operon was induced by the addition of 0.5 mM IPTG. The cultivation temperature was further maintained at 15°C for 24 h. (B) Short-induction method: the culture was incubated at 37°C and 200 rpm until the OD600 reached 0.5, 1.3, 2.1, and 2.4. Then, the temperatures were varied at 15, 25, 30, and 37°C for 30 min. Next, the expression of the phaCABA–04 operon was induced by adding various concentrations (0.01, 0.05, 0.1, 0.5, and 1.0 mM) of IPTG, and the cultivation temperature was maintained at 37°C for 24 h. (C) Preinduction method: the culture was incubated at 37°C and 200 rpm until the OD600 reached 0.5. Next, 0.5 mM IPTG was added into the culture when the temperature was decreased from 37°C to 15°C for 24 h. Then, the induced cells were harvested by centrifugation, the medium was discarded, and the cells were resuspended in an equal volume of fresh LB medium. Finally, the induced cells at 1, 5, or 10% (v/v) were transferred into fresh LB medium supplemented with 100 μg/L ampicillin and 20 g/L glucose and incubated at 37°C and 200 rpm for 24 h.
Materials and Methods
Strains and Plasmids
The E. coli strains and plasmids used in this study are listed in Table 1. The PHB-producing C. necator strain A-04 (Chanprateep et al., 2008) was used to isolate the phaCABA–04 gene operon. All bacterial strains were grown at 37°C in Luria-Bertani (LB) medium supplemented with 100 μg/L ampicillin. The LB medium contained (per liter) 10 g of tryptone (Himedia, Mumbai, India), 5 g of yeast extract (Himedia, Mumbai, India) and 10 g of NaCl (Merck KGaA, Darmstadt, Germany). Stock cultures were maintained at –80°C in a 15% glycerol solution. The experiments were performed in a biosafety level 1 laboratory and by researchers and investigators who had undergone biosafety training.
Construction of Recombinant Plasmids
The phaCABA–04 operon PHB biosynthetic genes from C. necator A-04 were PCR-amplified using the following pair of primers: forward primer 5′-ATGGATCC CTCGAGATGGCGACCGGCAAAG-3′ (the XhoI site is underlined) and reverse primer 5′-GTGAATTCAAGCTT TCAGCCCATATGCAGGCC-3′ (the HindIII site is underlined). Primers were designed based on accession numbers FJ897463, FJ897461, and FJ897462. The blunted PCR product was purified and subcloned into pBluescript SK- (Stratagene, La Jolla, CA, United States) linearized by SmaI. The recombinant plasmid digested with XhoI and HindIII was cloned into cold-shock-inducible pColdI and pColdTF vectors (Takara Bio Inc., Shiga, Japan) at the XhoI and HindIII restriction sites, yielding pColdI-phaCABA–04 and pColdTF-phaCABA–04, respectively. For the plasmid pGEX-6P-1-phaCABA–04, the phaCABA–04 operon was amplified by the primers pGEX-F and pGEX-R (Table 1). The 3,885-bp DNA fragment was digested by BamHI and XhoI and cloned into BamHI-XhoI-digested pGEX-6P-1 to obtain pGEX-6P-1-phaCABA–04. To construct pUC19-nativeP-phaCABA–04, the primers nativeP-phaCABA–04-F and nativeP-phaCABA–04-R were used to amplify the phaCABA–04 operon, including its native promoter. The blunted PCR product was purified and cloned into SmaI-linearized pUC19 (Thermo Fisher Scientific, Inc., Waltham, MA, United States), yielding pUC19-nativeP-phaCABA–04. PCRs were performed using Q5® High-Fidelity DNA Polymerase (New England Biolabs, Ipswich, MA, United States). E. coli JM109 was used as a host for cloning and PHB production. The accuracy of the constructed plasmid was verified by the corresponding restriction enzyme and sequencing.
Optimization of Culture Conditions for PHB Production in Shaken Flask Cultivation
Expression vectors named pColdI-phaCABA–04 and pColdTF-phaCABA–04 with the entire phaCABA–04 operon were transformed into E. coli JM109 by the heat shock method (Sambrook and Russell, 2001). Shake flask experiments were performed in 250-mL Erlenmeyer flasks containing 50 mL of medium. E. coli JM109 cells transformed with pColdI-phaCABA–04 or pColdTF-phaCABA–04 were grown in LB medium containing ampicillin (100 μg/mL) on a rotary incubator shaker (Innova 4300, New Brunswick Scientific Co., Inc., Edison, NJ, United States) at 37°C and 200 rpm for 24 h. The overnight seed culture was inoculated into fresh LB medium (5% v/v inoculum) containing 100 μg/L ampicillin and 20 g/L glucose prior to induction with temperature and IPTG using three separate induction methods (Figure 1).
For the synthesis of PHB using the conventional induction method, the procedure was performed according to the user manual (Takara Bio Inc., Otsu, Shiga, Japan). The culture was incubated at 37°C and 200 rpm until the optical density at 600 nm (OD600) reached 0.5, 1.3, 2.1, and 2.4. Next, the cultivation temperature was reduced from 37°C to 15°C for 30 min. The expression of the phaCAB operon was induced by the addition of 0.5 mM IPTG, and cultivation was continued at 15°C for an additional 24 h.
For the synthesis of PHB using the short-induction method developed in this study, the culture was incubated at 37°C and 200 rpm until the OD600 reached 0.5, 1.3, 2.1, and 2.4. Then, the temperatures were varied at 15, 25, 30, and 37°C for 30 min. Next, the expression of the phaCAB operon was induced by adding various concentrations (0.01, 0.05, 0.1, 0.5, and 1.0 mM) of IPTG, and the cultivation was maintained at 37°C for 24 h.
For the synthesis of PHB using the preinduction method developed in this study, the culture was incubated at 37°C and 200 rpm until the OD600 reached 0.5. Then, 0.5 mM IPTG was added to the culture and the temperature was reduced from 37°C to 15°C for 24 h. The induced cells were harvested by centrifugation, the medium was discarded, and the cells were resuspended in an equal volume of fresh LB medium. Then, the induced cells at 1, 5, or 10% (v/v) were transferred into fresh LB medium supplemented with 100 μg/L ampicillin and 20 g/L glucose and incubated at 37°C and 200 rpm for 24 h.
For comparison of the effect of phaC expression on PHB production under various types of promoters, fusion proteins and chaperones, shake flask experiments were performed in 250-mL Erlenmeyer flasks containing 50 mL of LB medium containing ampicillin (100 μg/mL) on a rotary incubator shaker at 37°C and 200 rpm for 24 h. For PHB production, overnight cultures in LB medium (1 mL) were transferred into fresh LB medium supplemented with glucose (20 g/L) and ampicillin (100 μg/mL). Recombinant E. coli JM109 (pColdI-phaCABA–04) and E. coli JM109 (pColdTF-phaCABA–04) were induced to produce PHB using the conventional induction method and short-induction method. The effect of GST (the hydrophilic fusion protein) and the tac promoter on PHB production was investigated using E. coli JM109 (pGEX-6P-1-phaCABA–04), which was induced by the addition of IPTG (0.5 mM). The effect of the araBAD promoter and N-terminal thioredoxin fusion protein together with the C-terminal 6His-fusion protein on PhaC and PHB production was examined by inducing E. coli JM109 (pBAD/Thio-TOPO-phaCABA–04) with arabinose (1% w/v). E. coli JM109 (pUC19-nativeP-phaCABA–04), which exhibits expression from native promoter without addition of IPTG, was used as a control strain. All of these comparison experiments were performed at 15 or 37°C for 48 h. The crude glycerol used in this study was obtained from biodiesel industries belong to Bangchak Corporation Public Company Limited, a petroleum and energy conglomerate in Thailand. The content of glycerol was 80% w/v.
Conditions for PHB Production in a 5-L Fermentor
A preculture was prepared in 500-mL Erlenmeyer flasks containing 100 mL of LB medium and grown on a rotary shaker at 37°C at 200 rpm for 24 h. The preculture was inoculated into a 5-L bioreactor (MDL500, B.E. Marubishi Co., Ltd., Tokyo, Japan) containing 2 L of LB medium supplemented with 100 μg/L ampicillin and 20 g/L glucose at an inoculation volume of 5% (v/v). The agitation speed and the air flow rate were 500 rpm and 1 mL/min, respectively. After an OD600 of 0.5 was obtained, the cultivation temperature was reduced from 37 to 15°C for 30 min. Next, IPTG was added to the culture at a final concentration of 0.5 mM. After IPTG addition, the cultivation temperature was shifted from 15 to 37°C and maintained at 37°C for 48 h. Culture samples were collected at 6 h intervals for 48 h.
Analytical Methods
Cell growth was monitored by the CDM, which was determined by filtering 5 mL of the culture broth through preweighed cellulose nitrate membrane filters (pore size = 0.22 μm; Sartorius, Goettingen, Germany). The filters were dried at 80°C for 2 days and stored in desiccators. The net biomass was defined as the residual cell mass (RCM), which was calculated by subtracting the amount of PHB from the CDM. The PHB in dried cells was methyl-esterified using a mixture of chloroform and 3% (v/v) methanol-sulfuric acid (1:1 v/v) (Braunegg et al., 1978). The resulting monomeric methyl esters were quantified by a gas chromatograph (model CP3800, Varian Inc., Walnut Creek, CA, United States) using a Carbowax-PEG capillary column (0.25-μm df, 0.25-mm ID, 60-m length, Varian Inc.). The internal standard was benzoic acid, and the external standard was PHB (Sigma-Aldrich Corp.). The total reducing sugar concentration was determined using a 3,5-dinitrosalicylic acid (DNS) assay (Miller, 1959). Glycerol and acetate concentrations in culture medium were analyzed using an HPLC system (1200 Infinity series, Agilent technologies, United States) equipped with 1260 RID (Agilent Technologies, United States) and X-bridge-BEH amide column (4.6 × 250 nm × 5 μm) (Water, United States), with an isocratic mobile phase of acetonitrile: water (70:30, v/v) at a flow rate 1.0 mL/min and 30°C (Dharmadi et al., 2006; Simonzadeh and Ronsen, 2012).
Sodium Dodecyl Sulfate-Polyacrylamide Gel Electrophoresis (SDS-PAGE) and Western Blot Analysis
Recombinant E. coli cells were cultured with and without induction. Cells were collected by centrifugation at 17,000 × g and 4°C for 30 min. Cell pellets were resuspended in 100 mM Tris-HCl (pH 8.0) and normalized to an OD600 of 2.0. Total proteins were extracted from cells by using a sonicator (Sonics Vibra Cell VCX 130, Sonics & Materials, Inc., Newtown, CT, United States). The lysis mixture was then centrifuged at 17,000 × g at 4°C for 30 min. The protein concentration in the supernatant (soluble protein) was estimated by the Bradford method using a Bio-Rad protein assay kit (Bio-Rad Laboratories Inc., Hercules, CA, United States), and bovine serum albumin was used as a standard. Thirty micrograms of total protein from each sample was subjected to sodium dodecyl sulfate-polyacrylamide gel electrophoresis (SDS-PAGE) using 10% polyacrylamide gels under reducing conditions and electrophoresed at 80 V for 10 min followed by 140 V for 60 min. For the western blot analysis, the protein from SDS-PAGE was then transferred to a polyvinylidene difluoride (PVDF) membrane using a semi-dry blotting system (Trans-Blot SD Cell, Bio-Rad Laboratories Inc, Hercules, CA, United States) at 150 mA for 40 min. The 6His tag was detected by a mouse anti-His antibody (Aviva Systems Biology Corp., San Diego, CA, United States) and an HRP-conjugated goat anti-mouse IgG as the primary and secondary antibodies, respectively. Color development was performed using a Mouse IgG DAB Chromogenic Reagent Kit (Boster Biological Technology, Pleasanton CA, United States) according to the manufacturer’s instructions.
Protein Purification by Immobilized Metal Affinity Chromatography (IMAC)
The cell pellet (from 50 mL culture) was resuspended in 1 ml of lysis-equilibration-wash buffer (1X LEW buffer, 50 mM NaH2PO4, 300 mM NaCl and pH 8.0). Lysozyme (USB Corporation, OH, United States) and Benzonase® endonuclease (Novagen Inc., WI, United States) were added to concentrations of 0.2 mg/mL and 20 U/mL, respectively. The cells were ruptured by ultrasonic homogenizer (Vibra-CellTM Ultrasonic Liquid Processors VCX 130, Sonics & Materials, Inc., CT, United States). The amplitude was set to 40% (pulse interval at 30/15 s for 5 min). The lysate was clarified by centrifugation at 16, 100 × g for 20 min and the supernatant was collected. Protino@® Ni-IDA 1000 His-Tag Protein purification columns (Macherey-Nagel GmbH & Co. KG, Düren, Germany) were pre-equilibrated with four bed volumes of 1X LEW buffer and allowed to drain by gravity. The cleared supernatant with 2 mg of total protein was loaded onto a pre-equilibrated column and washed with four bed volumes of 1X LEW buffer containing 20 mM imidazole. Finally, the polyhistidine-tagged protein was eluted with elution buffer (50 mM NaH2PO4, 300 mM NaCl, 250 mM imidazole and pH 8.0). Each fraction was analyzed by running 10 μL of eluate on SDS-PAGE and quantified by Bradford protein assay. To ensure accurate quantitation of yields, the lysate flow-through was collected for detection of unbound product by SDS-PAGE analysis.
Analysis of Polymer Molecular Weight
The molecular weight was determined by Gel Permeation Chromatography (GPC; Shimadzu 10A GPC system, Shimadzu Co., Ltd., Kyoto, Japan) with a 10A refractive index detector and two Shodex columns (a GPC K-806M column (8.0 mm ID × 300 mm L, Showa Denko K.K., Tokyo, Japan) belong to Associate Professor Takeharu Tsuge’s laboratory at Department of Materials Science and Engineering, School of Materials and Chemical Technology, Tokyo Institute of Technology, Yokohama, Japan. Polymer was dissolved in 0.1% (w/v) chloroform and filtered through a 0.45 μm low protein binding Durapore® (PVDF) membrane filter (Millex®-HV, Merck Millipore Ltd., Tullagreen, Carrigtwohill Co., Cork, Ireland). The temperature was 40°C and the flow rate was 0.8 mL/min. A standard curve was determined for polystyrene with low polydispersity in the same conditions for the molecular weight 1.26 × 10³, 3.39 × 10³, 1.30 × 10⁴, 5.22 × 10⁴, 2.19 × 10⁵, 7.29 × 10⁵, 2.33 × 10⁶, and 7.45 × 10⁶. The weight-average molecular weight (Mw) and the number-average molecular weight (Mn) were determined by gel permeation chromatography (GPC) and the polydispersity index (PDI) was calculated as the ratio .
Preparation of PHB Films
PHB films were prepared according to the ASTM: D882-91 protocol. The PHB films were prepared from chloroform solutions of the polyesters using conventional solvent-casting techniques and a glass tray [Pyrex, Corning Incorporated, NY, United States) as the casting surface (modified from Yoshie et al. (1995)]. The thickness of the thin polyester films was regulated by controlling the concentration of the polymer in chloroform (1% w/v) and the volume of the polymer solution. The thickness of the PHB films was 0.05 mm, which was confirmed using a caliper (Model 500-175: CD-12C, Mitutoyo Corporation, Kawasaki-shi, Kanagawa, Japan). A film samples were aged for 1 month in desiccator at ambient temperature to allow them to reach crystallization equilibrium.
Analysis of the Mechanical Properties of PHB Films
The mechanical tests were conducted at the Scientific and Technological Research Equipment Center, Chulalongkorn University, using a universal testing machine (H10KM, Wuhan Huatian Electric Power Automation Co., Ltd., Wuhan, China) with a crosshead speed of 10 mm/min. The variables measured included the elongation at the break point (%), the stress at maximal load (MPa), and the Young’s modulus (MPa). The data represent the mean values for ten samples tested under the same conditions.
Thermal Analysis by Differential Scanning Calorimetry (DSC) of PHB Films
A 10-mg sample of PHB was encapsulated in an aluminum sample vessel and placed in the sample holding chamber of the DSC apparatus (DSC7, PerkinElmer, Inc., Waltham, MA, United States). STARe software (version SW 10.00; Mettler-Toledo International Inc., Columbus, OH, United States) was used to operate the DSC apparatus at the Petroleum and Petrochemical College, Chulalongkorn University. The previous thermal history of the sample was removed before the thermal analysis by heating the sample from ambient temperature to 180°C at 10°C/min. Next, the sample was maintained at 180°C for 5 min before cooling at 10°C/min to −50°C. The sample was then thermally cycled at 10°C/min to 180°C. The melting peak temperature, denoted by Tm, was given by the intersection of the tangent with the furthest point of an endothermic peak and the extrapolated sample baseline. The glass transition temperature, denoted by Tg, could be estimated by extrapolating the midpoint of the heat capacity difference between glassy and viscous states after heating of the quenched sample.
Data Analysis
All the data presented in this manuscript are representative of the results of three independent experiments and are expressed as the mean values ± standard deviations (SDs). Analysis of variance (one-way ANOVA) followed by Duncan’s test for testing differences among means was conducted using SPSS version 22 (IBM Corp., Armonk, NY, United States). Differences were considered significant at P < 0.05.
Results
Effect of the Growth Phase on the Production of PhaCA–04 and PHB by the Conventional Induction Method
In preliminary experiments, after the pColdI-phaCABA–04 and pColdTF-phaCABA–04 vectors were transformed into E. coli JM109, the heterologous expression of phaCABA–04 biosynthesis genes was performed by conventional induction method and by varying IPTG concentrations. It was found that 0.5 mM IPTG was the optimal concentration, which was the same as that recommended by the manufacturer’s instructions (Supplementary Figure 2). Next, to optimize the conditions, expression was induced with 0.5 mM IPTG at different growth phases by varying OD600 based on cultivation time: 0.5 (2 h, early exponential phase), 1.3 (4 h, middle exponential phase), 2.1 (6 h, late exponential phase), and 2.4 (10 h, stationary phase). Concurrently, the temperature was shifted from 37°C to 15°C for 24 h. Figure 2 shows the effect of the growth phase for gene induction on the CDM (g/L), PHB content (% w/w) and levels of insoluble and soluble PhaCA–04 protein, comparing E. coli JM109 (pColdI-phaCABA–04) and E. coli JM109 (pColdTF-phaCABA–04). The PhaCA–04 protein was detected by western blot analysis using an anti-His tag antibody as the primary antibody. A band appeared in the western blot at the position corresponding to that of the His-tagged phaCA–04 protein (67 kDa) for pColdI-phaCABA–04 and the fusion protein of His-tagged phaCA–04 and TF at 115 kDa. By varying the time courses of the growth phase, His-tagged PhaCA–04 and the His-tagged phaCA–04-TF fusion protein were successfully expressed, with the highest amount of total phaCA–04 protein obtained when the phaCABA–04 operon was induced at an OD600 of 0.5. The content of soluble PhaCA–04-TF fusion protein (Figure 2B, lane 3) in the sample after IPTG induction at an OD600 of 0.5 was much higher than that of the phaCA–04 protein alone from pColdI-phaCABA–04 (Figure 2A, lane 3), suggesting that the TF chaperone facilitates the expression of highly soluble protein in E. coli JM109. The highest amount of soluble PhaCA–04 and TF fusion protein was produced only at an OD600 of 0.5 and was not detected in other growth phases. Functional PhaCA–04 protein production was confirmed by determining the amount of PHB produced; however, the value was only 46.2 ± 1.8% w/w with a productivity of 0.03 ± 0.01 g/(L⋅h) (Table 2). Furthermore, the quantification of purified soluble PhaCA–04 protein and PhaCA–04 and TF fusion protein was performed by IMAC affinity chromatography under native conditions and the results were shown in Table 3 (the details of this experiment are given below).
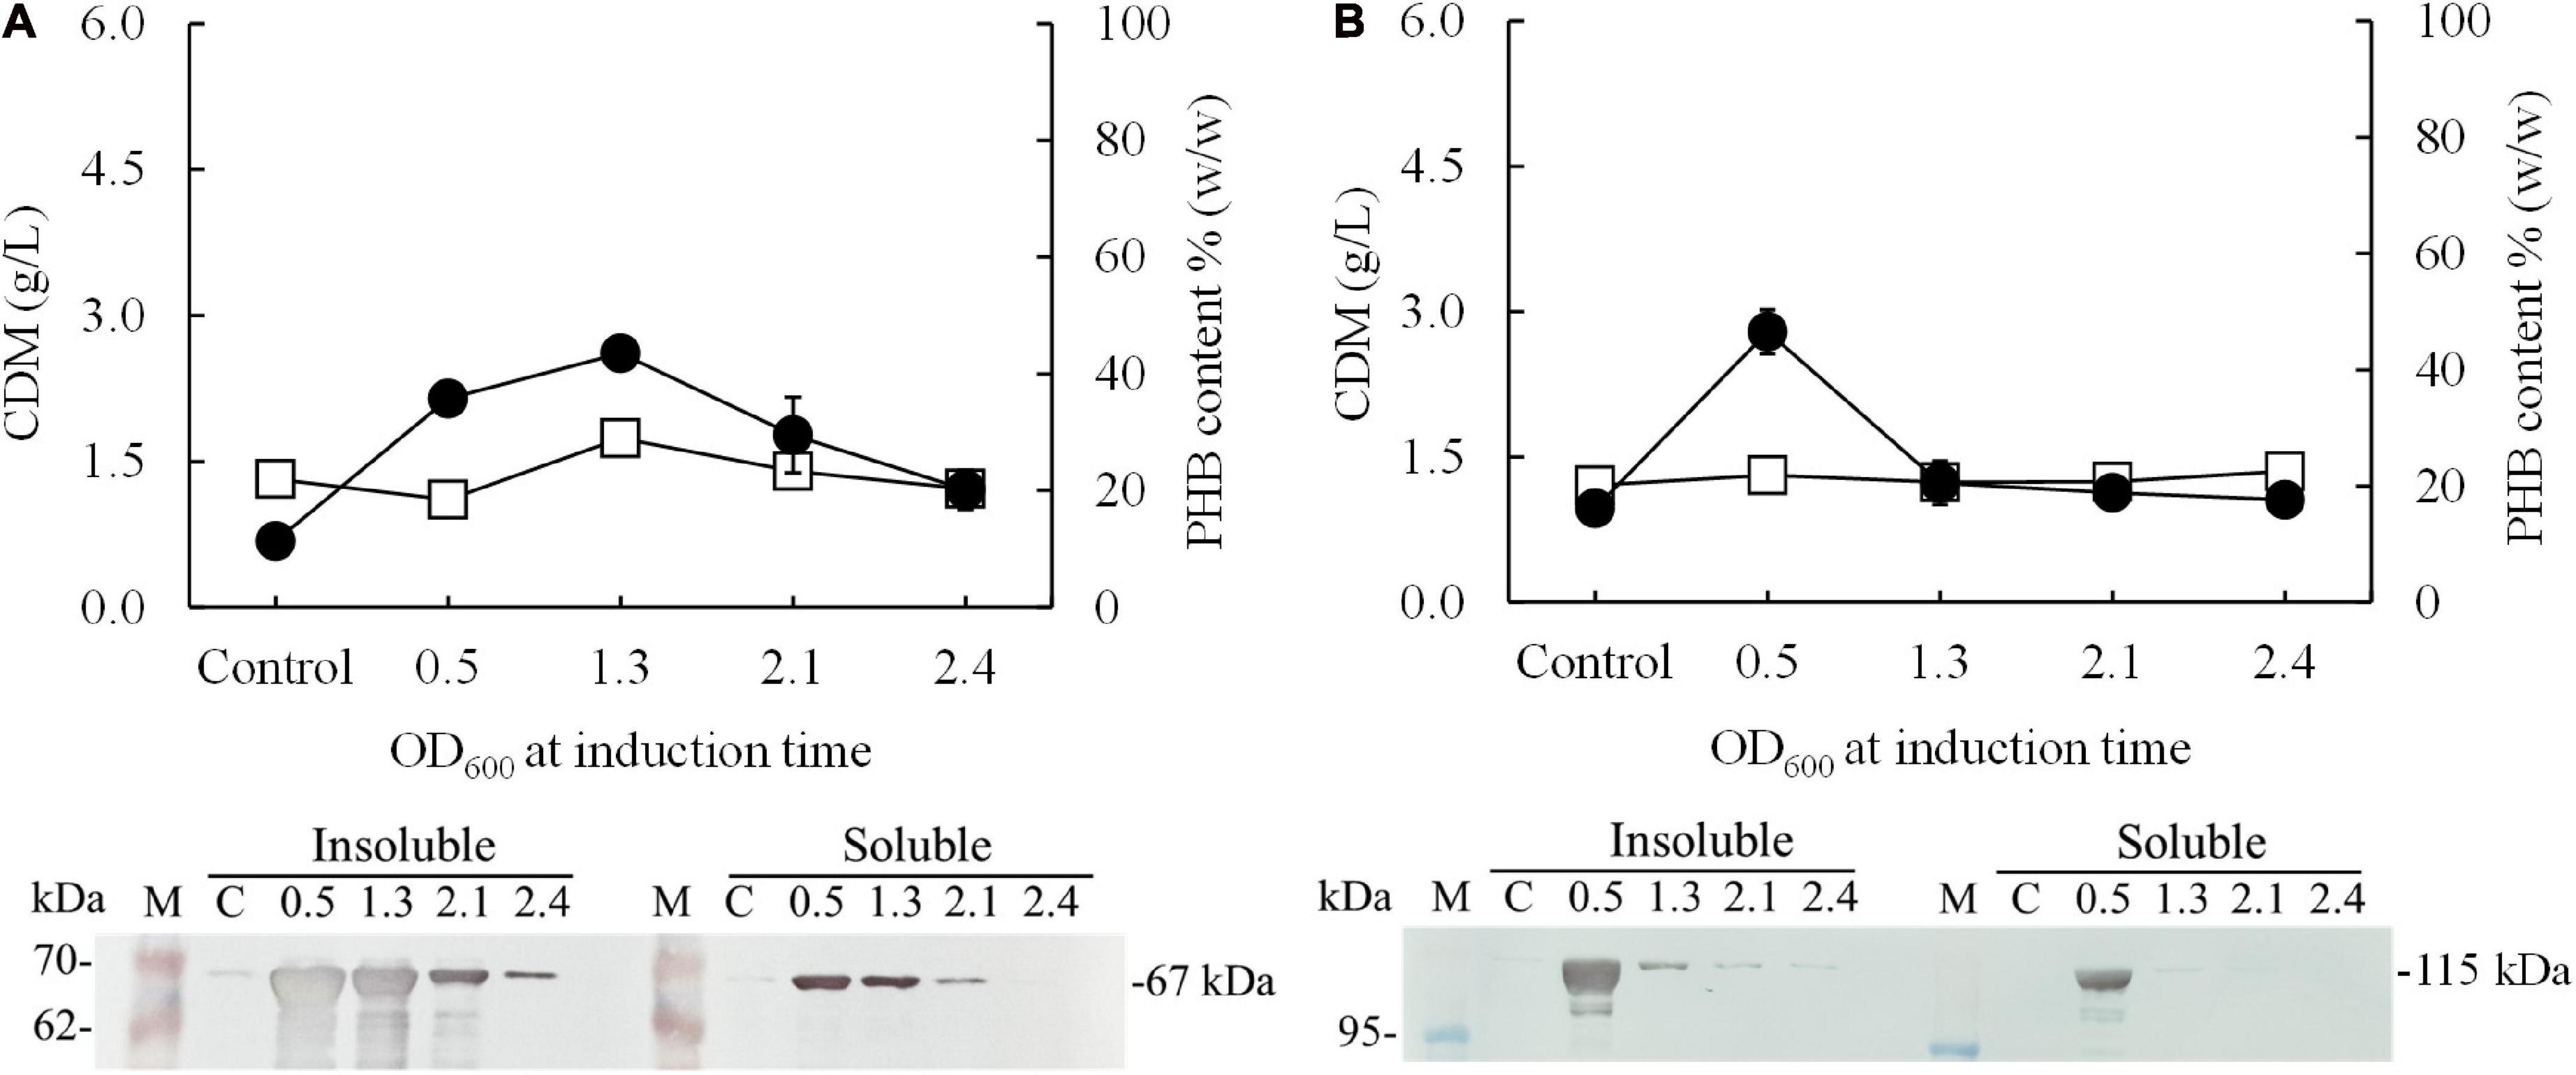
Figure 2. Effect of the growth phase suitable for cold-shock induction on CDM and PHB content (% w/w) under the conventional induction method. The different growth phases were investigated by varying OD600 based on cultivation time [0.5 (2 h, early exponential phase), 1.3 (4 h, middle exponential phase), 2.1 (6 h, late exponential phase), and 2.4 (10 h, stationary phase)] for (A) E. coli JM109 (pColdI-phaCABA–04) and (B) E. coli JM109 (pColdTF-phaCABA–04). A control experiment was performed with 0.0 mM IPTG induction. All the data are representative of the results of three independent experiments and are expressed as the mean values ± standard deviations (SDs). The PhaCA–04 protein was detected by western blot analysis using anti-His tag antibody as the primary antibody. The band appearing in the western blot at the position corresponding to that of the His-tagged phaCA–04 protein was 67 kDa in size for pColdI-phaCABA–04, and the fusion protein of His-tagged phaCA–04 and TF was 115 kDa in size. All the data are representative of the results of three independent experiments and are expressed as the mean values ± standard deviations (SDs). Symbols: open squares, CDM (g/L); closed circle, PHB (g/L).
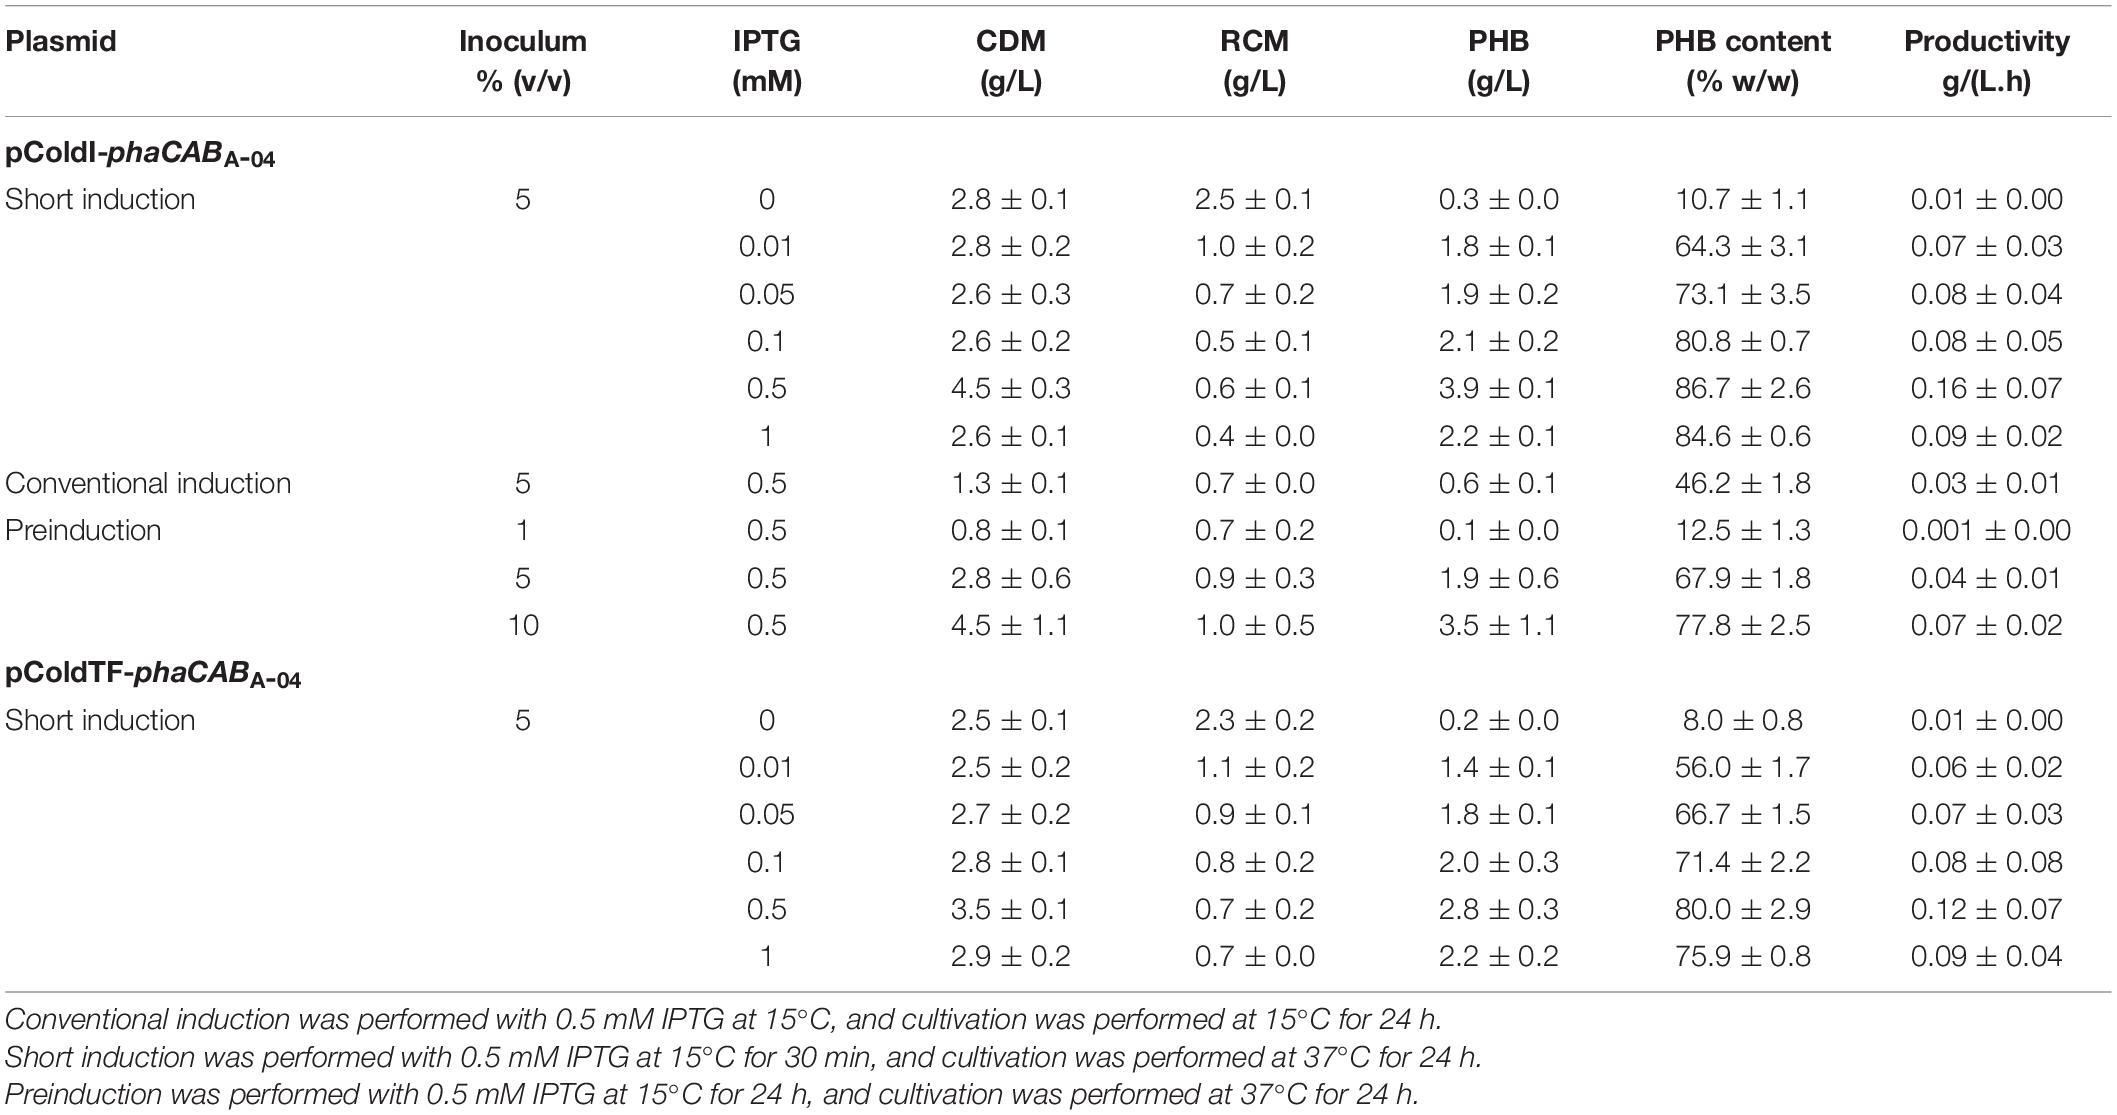
Table 2. Effect of IPTG concentration on CDM (g/L), PHB (g/L), % (w/w) PHB content and PHB productivity in a comparison between E. coli JM109 harboring pColdI-phaCABA–04 and E. coli JM109 harboring pColdTF-phaCABA–04.
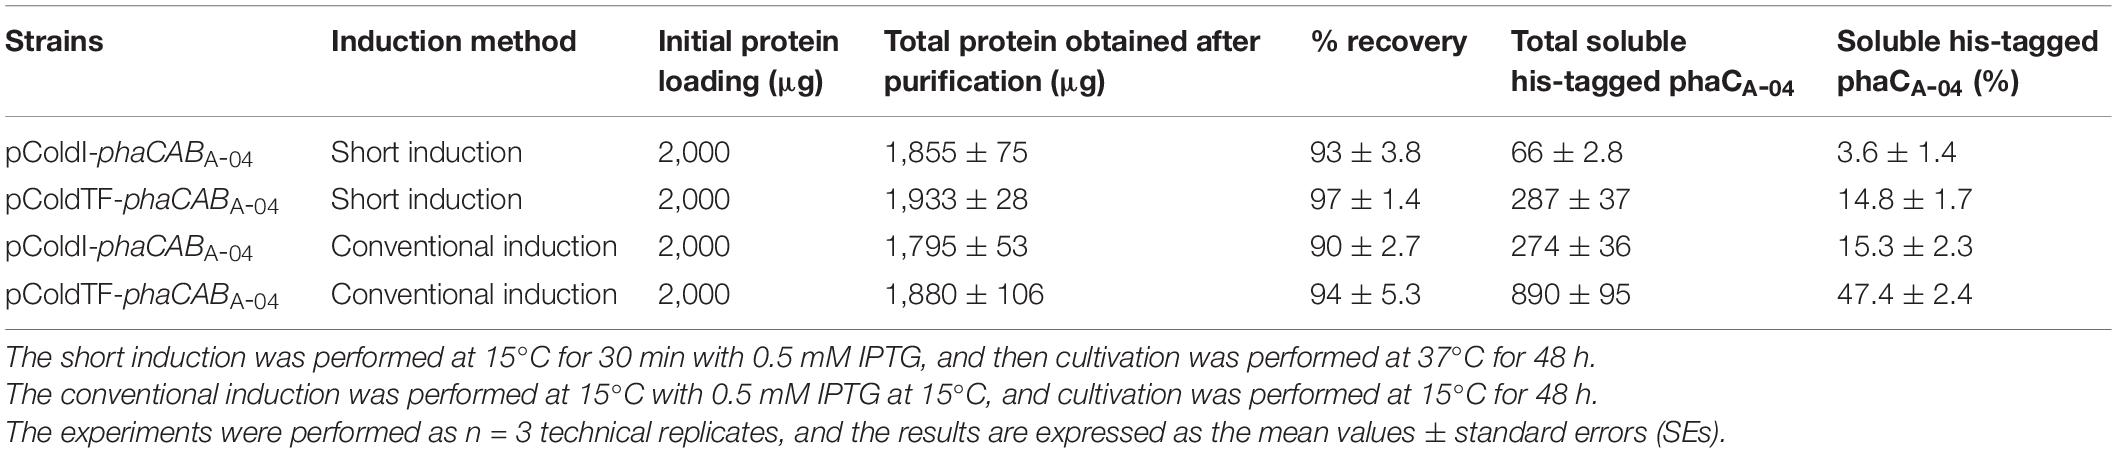
Table 3. Quantification of purified soluble phaCA–04 produced by E. coli JM109 (pColdI-phaCABA–04) and E. coli JM109 (pColdTF-phaCABA–04) under short induction method compared with the conventional method in shake flask cultivation.
Comparison of the Effect of phaC Expression on PHB Production Under Various Types of Promoters, Fusion Proteins and Chaperones
In phaCABA–04-overexpressing E. coli JM 109 (pColdI-phaCABA–04) under the conventional conditions, the formation of inclusion bodies of PhaCA–04 has been observed due to the low aqueous solubility of the protein, as described previously (Harada et al., 2019). To verify that the cold-shock cspA promoter works together with the TF chaperone to improve the solubility of PhaCA–04, the hydrophilic GST tag was fused to the N-terminus of PhaCA–04 (pGEX-6P-1- phaCABA–04), and the effect of the GST tag at 37°C on the polymerization reaction of phaCA–04 based on the amount of PHB production was investigated. In addition, pBAD/Thio-TOPO- phaCABA–04, encoding a hydrophilic N-terminal thioredoxin fusion protein and C-terminal 6His-fusion protein induced by arabinose, was also used for comparison (Napathorn et al., 2021). The control strain, harboring pUC19-nativeP-phaCABA–04, was under the control of the native promoter derived from C. necator strain A-04, and no induction agent was required under the same conditions. The amounts of PHB are shown in Table 4. The expressed phaCA–04 protein was also verified, purified and quantified and shown in Figures 3A,B and Table 3. From Table 4, it was clearly found that pColdI-phaCABA–04 and pColdTF-phaCABA–04 yielded significantly higher amounts of PHB under the short-induction (15°C for 30 min and then 37°C) conditions than under the conventional induction (15°C) conditions (pColdI-phaCABA–04, pColdTF-phaCABA–04, pGEX-6P-1-phaCABA–04, pBAD/Thio-TOPO-phaCABA–04 and pUC19-nativeP-phaCABA–04). Next, the expression level of PhaCA–04 protein was investigated by SDS-PAGE analysis. Figures 3A,B showed insoluble and soluble PhaCA–04 expressed at 24 h of cultivation, respectively. The thioredoxin-tagged PhaCA–04 fusion protein (lane 2 at 77 kDa) showed the highest amount of insoluble form, corresponding with a low amount of PHB production. Interestingly, pColdI-phaCABA–04 and pColdTF-phaCABA–04 produced significantly high amounts of phaCA–04 under both the short and conventional induction methods (Figure 3A, lanes 4−7).
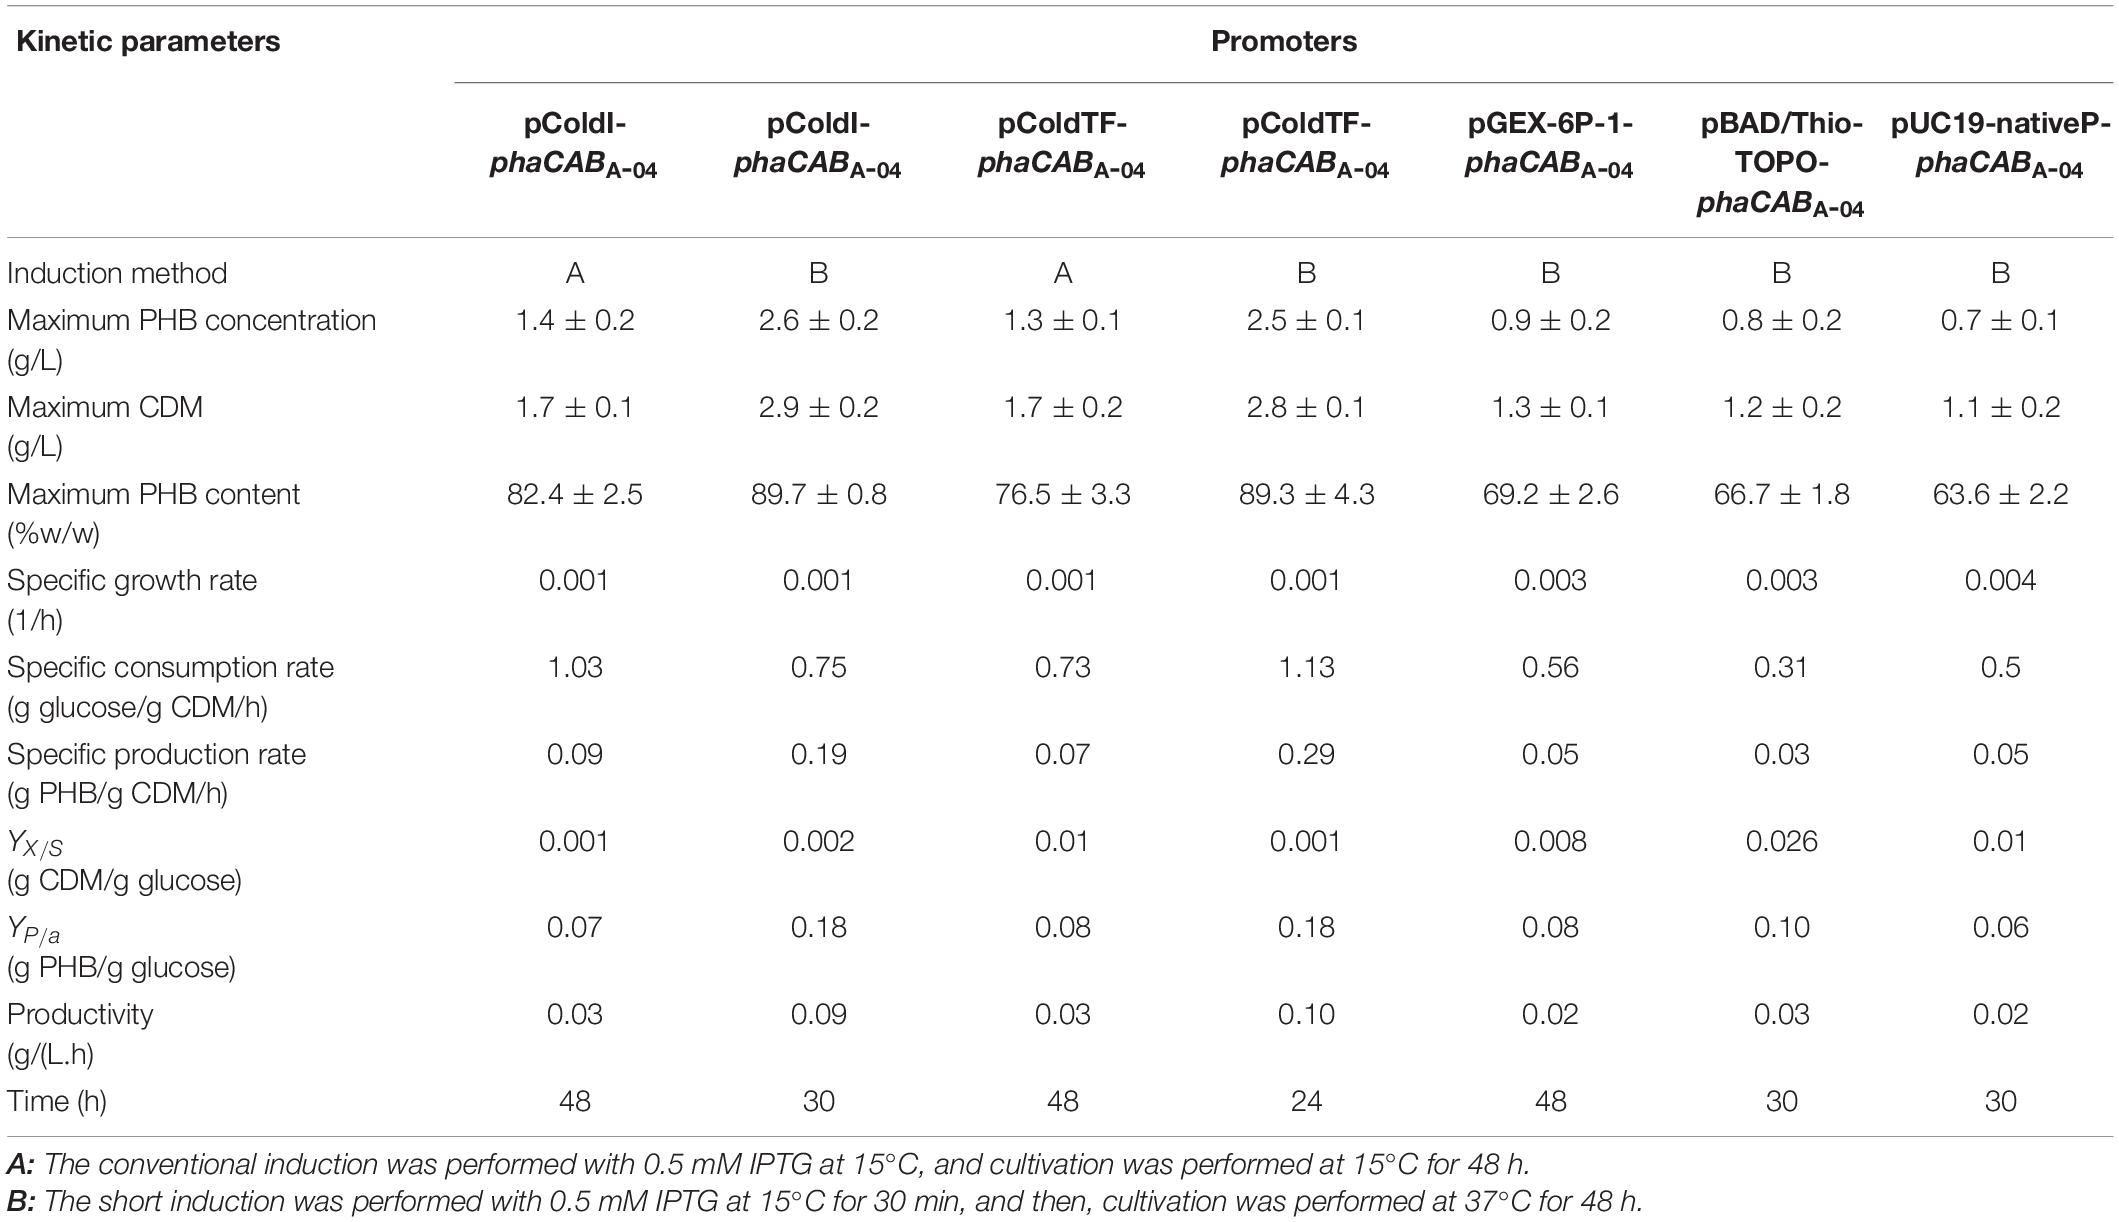
Table 4. Comparison of the kinetics of cell growth, (g PHB/g-glucose), and PHB production g/(L.h) by C. necator strain A-04, E. coli JM109 (pColdI-phaCABA–04), (pColdTF-phaCABA–04), (pGEX-6P-1- phaCABA–04), (pBAD/Thio-TOPO-phaCABA–04), and (pUC19-nativeP-phaCABA–04) in shake flask cultivation.
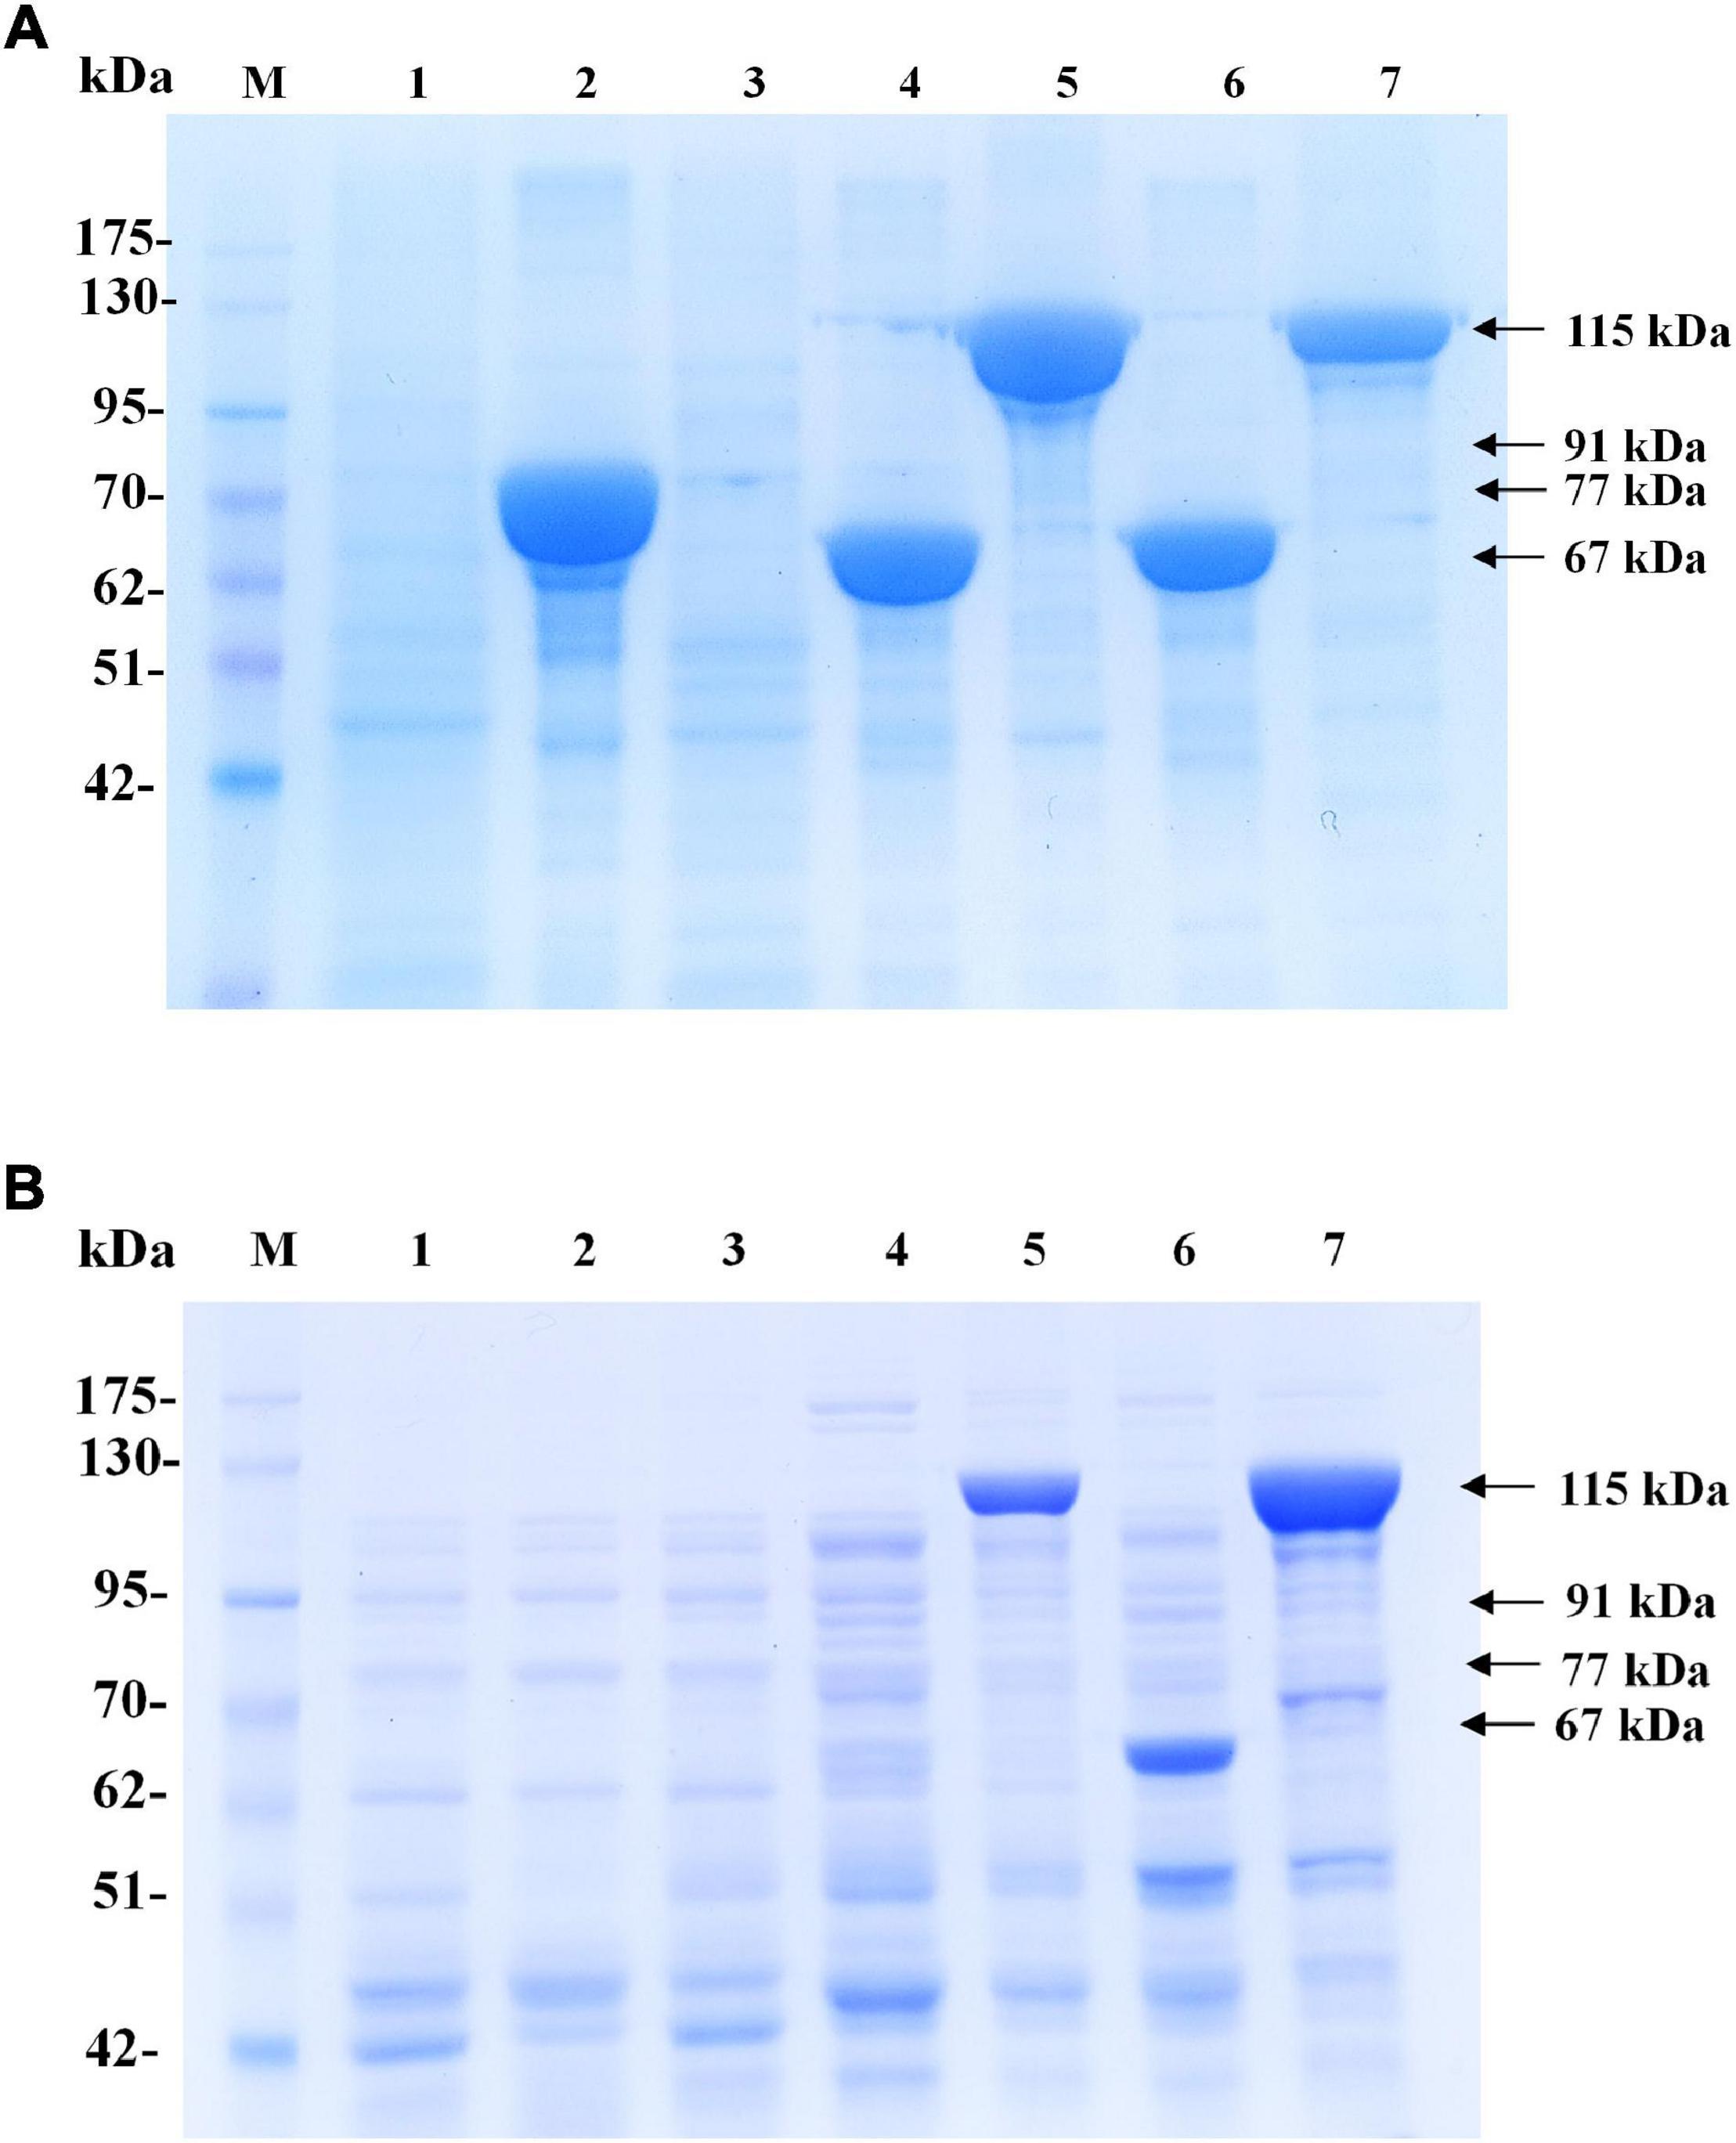
Figure 3. Time courses of PHB production (g/L). (A) The insoluble PhaCA–04 protein was confirmed by SDS-PAGE analysis (20 μg of total protein was loaded in each lane). (B) The soluble PhaCA–04 protein was confirmed by SDS-PAGE analysis (20 μg of total protein was loaded in each lane). Lane M, Protein molecular weight marker; lane 1, E. coli JM109 (pUC19-nativeP-phaCABA–04) under short induction temperature profile, but without addition of IPTG; lane 2, E. coli JM109 pBAD/Thio-TOPO- phaCABA–04 under short induction method; lane 3, E. coli JM109 (pGEX-6P-1- phaCABA–04) under short induction method; lane 4, E. coli JM109 (pColdI-phaCABA–04) under short induction method; lane 5, E. coli JM109 (pColdTF-phaCABA–04) under short induction method; lane 6, E. coli JM109 (pColdI-phaCABA–04) under conventional induction method; lane 7, E. coli JM109 (pColdTF-phaCABA–04) under conventional induction method. The band appearing in the SDS-PAGE at the position corresponding to that of the phaCA–04 protein was 64 kDa in size for pUC19-nativeP-phaCABA–04, His-tagged phaCA–04 fusion protein was 67 kDa in size for pColdI-phaCABA–04, thioredoxin-tagged phaCA–04 fusion protein was 77 kDa in size for pBAD/Thio-TOPO-phaCABA–04, GST-tagged phaCA–04 fusion protein was 91 kDa in size for pGEX-6P-1-phaCABA–04, and the fusion protein of His-tagged phaCA–04 and TF was 115 kDa in size for pColdTF-phaCABA–04.
To clarify and carefully compare the amounts of soluble phaCA–04 expressed by pColdI-phaCABA–04 and pColdTF-phaCABA–04 under short induction and conventional induction, the phaCA–04 protein was purified by IMAC affinity chromatography under native conditions. The eluted fractions were quantified by Bradford protein assay. The results are summarized in Table 3. The figures of SDS-PAGE and Western blot analysis were represented as Supplementary Results. The initial protein loading was adjusted to 2,000 μg and the maximum capacity of the IMAC column was 3,000 μg. The protein recovery was within the range of 90–97%. The conventional method induced soluble phaCA–04 from pColdTF-phaCABA–04 at a level of as high as 47.4% of total protein and pColdTF-phaCABA–04 enhanced soluble protein formation to approximately 3.09−4.1 times higher than that from pColdI-phaCABA–04 by both conventional method and short induction method. Based on our observations, the cold-shock cspA promoter enhanced phaCA–04 protein expression and TF promoted soluble phaCA–04 protein (Figure 3B and Table 3). The PHB production from pGEX-6P-1-phaCABA–04, pBAD/Thio-TOPO-phaCABA–04 and pUC19-nativeP-phaCABA–04 was not different, which may be attributed to the host strain and induction method used in this study. Therefore, pColdTF-phaCABA–04 and pColdI-phaCABA–04 were chosen to validate their effectiveness of PHB production in the 5 L fermenter.
Development of Short-Induction Method and Pre-induction Method
Next, a short-induction method was investigated in this study with the aim of accelerating growth and PHB production and attaining higher productivity than that afforded by the conventional induction method. First, conditions were optimized by varying the OD600 based on cultivation time (0.5, 1.3, 2.1, and 2.4 h) and inducing expression with 0.5 mM IPTG at 15°C for 30 min. Then, the temperature was shifted from 15°C to 37°C for 24 h to enhance growth and PHB production. The effect of the growth phase (OD600) on CDM (g/L) and PHB content (% w/w) is illustrated in Figure 4. Again, it was clearly observed that cells of both E. coli JM109 (pColdI-phaCABA–04) and E. coli JM109 (pColdTF-phaCABA–04) in the 2-h early exponential phase (OD600 of 0.5) exhibited higher CDM and PHB production than those in other growth phases. After induction with 0.5 mM IPTG at 15°C for 30 min and cultivation at 37°C for 24 h, E. coli JM109 (pColdI-phaCABA–04) attained 4.5 ± 0.3 g/L CDM, 3.9 ± 0.1 g/L PHB and 86.70 ± 2.6% (w/w) PHB content with a productivity of 0.16 ± 0.07 g PHB/(L.h), whereas E. coli JM109 (pColdTF-phaCABA–04) attained 3.5 ± 0.1 g/L CDM, 2.8 ± 0.3 g/L PHB and 80.0 ± 2.9% (w/w) PHB content with a productivity of 0.12 ± 0.07g PHB/(L.h). Thus, the short-induction method enhanced the PHB content and productivity more than the conventional method. Next, an OD600 of 0.5 was used to investigate the optimal concentration of IPTG (0, 0.01, 0.05, 0.1, 0.5, and 1.0 mM) under the short-induction conditions. The effects of various IPTG concentrations on CDM (g/L), PHB (g/L), PHB content (% w/w) and PHB productivity [g PHB/(L.h)], comparing E. coli JM109 (pColdI-phaCABA–04) and E. coli JM109 (pColdTF-phaCABA–04), are summarized in Table 2. It can be concluded that the optimal concentration of IPTG was 0.5 mM in both cases. The PHB content (% w/w) increased in accordance with the IPTG concentration, but the amount of PHB (g/L) produced was maximum under induction with 0.5 mM IPTG. The PHB content (% w/w) increased approximately 8-fold, and the productivity [g PHB/(L.h)] increased 16-fold, compared with those under the control condition in the case of pColdI-phaCABA–04.
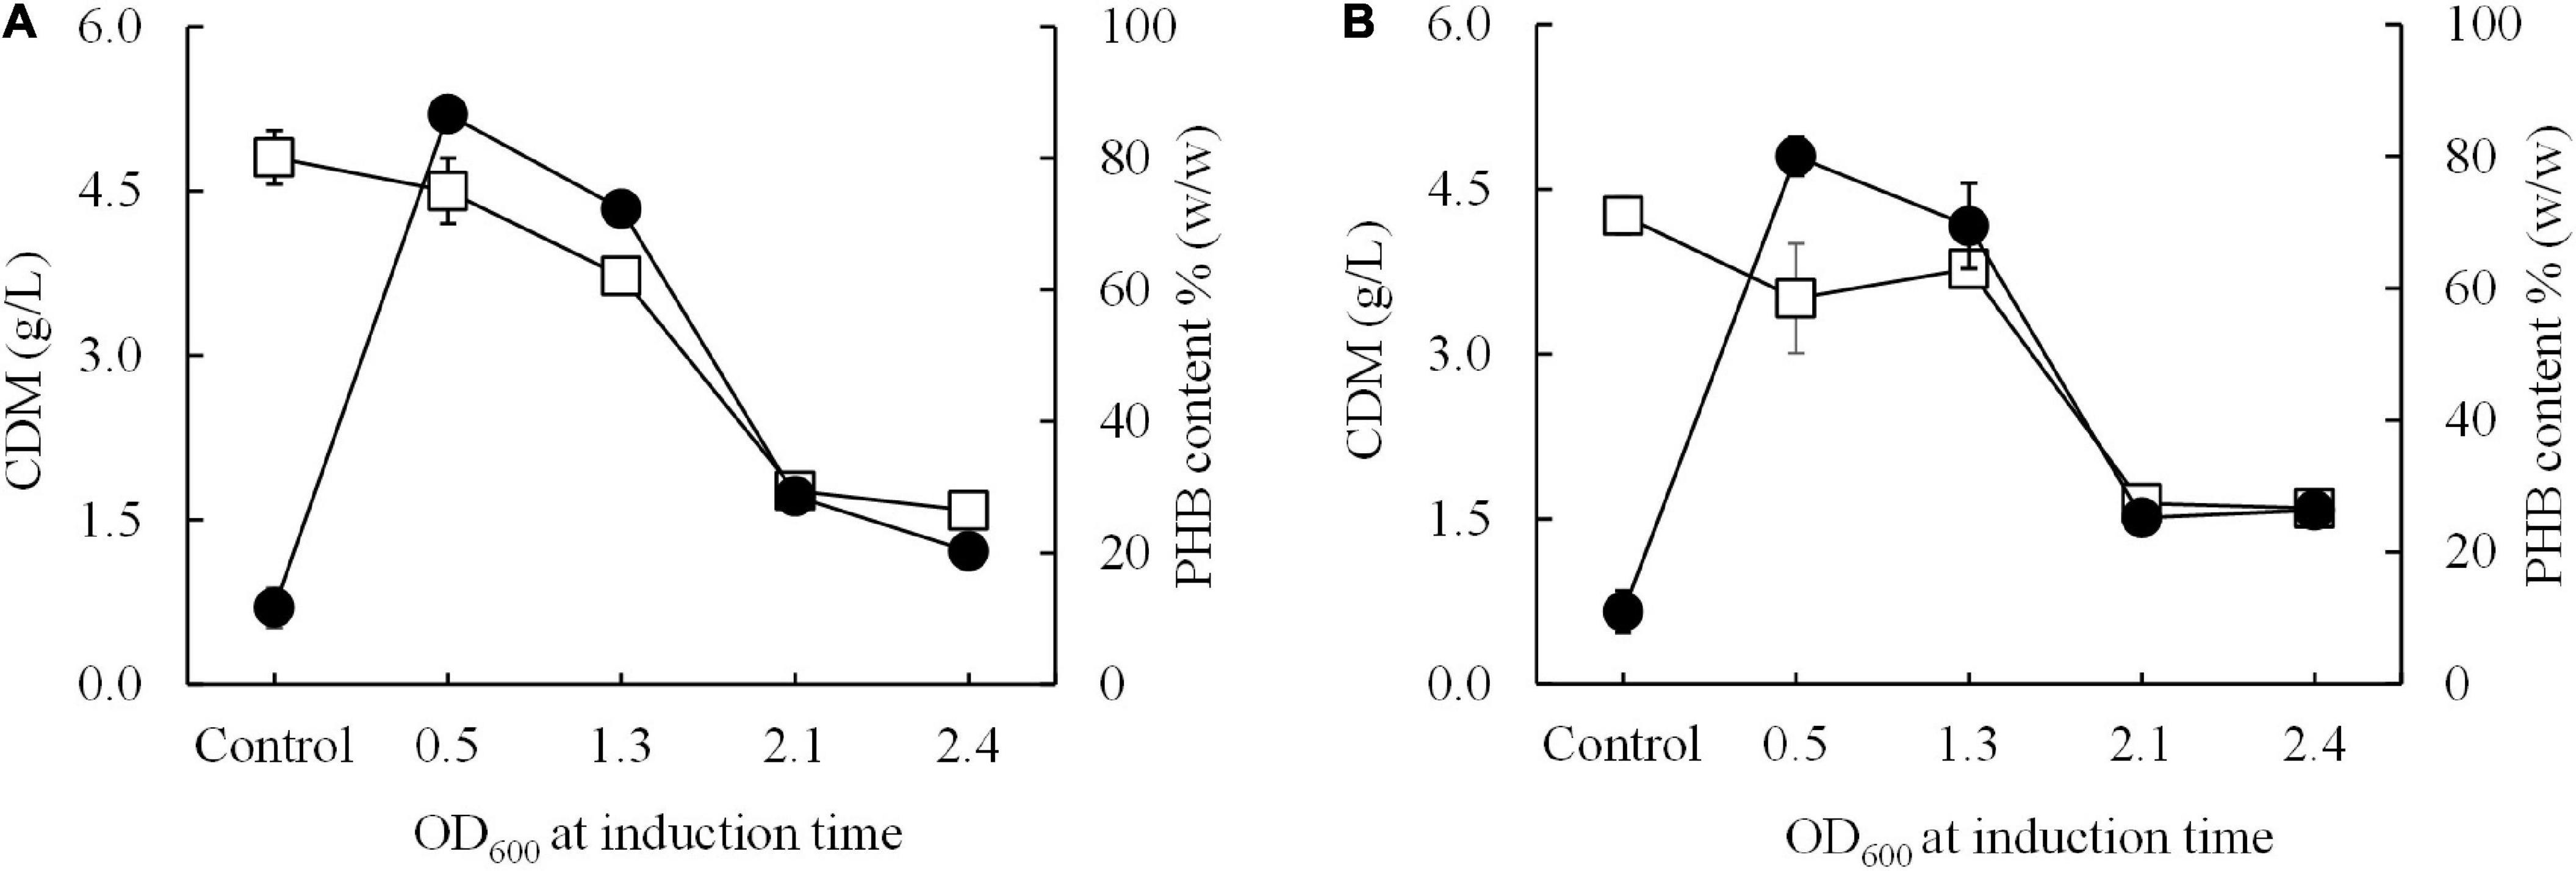
Figure 4. Effect of the growth phase suitable for cold-shock induction on CDM and PHB content (% w/w) under the short-induction method. The different growth phases were investigated by varying OD600 based on cultivation time [0.5 (2 h, early exponential phase), 1.3 (4 h, middle exponential phase), 2.1 (6 h, late exponential phase), and 2.4 (10 h, stationary phase)] for (A) E. coli JM109 (pColdI-phaCABA–04) and (B) E. coli JM109 (pColdTF-phaCABA–04). A control experiment was performed with 0.0 mM IPTG induction. All the data are representative of the results of three independent experiments and are expressed as the mean values ± standard deviations (SDs). Symbols: open squares, CDM (g/L); closed circle, PHB (g/L).
The optimal short-induction temperature was investigated in a range between 15°C and 37°C for 30 min before increasing the temperature to 37°C for 24 h to confirm that the high PHB productivity resulting in this study is a result of the cold-shock cspA promoter and that 15°C is the optimal induction temperature. Figure 5 shows the results of the effect of the short-induction temperature (15, 25, 30, and 37°C) on cell growth and PHB production. It was clear that 15°C was the optimal induction temperature for enhancing the amount of PHB produced, which resulted in a maximum PHB content of 86.7 ± 2.6% (w/w). The amount of PHB produced decreased as the induction temperature increased. The PHB productivity at 15°C was sevenfold higher than that obtained with an induction temperature of 37°C.
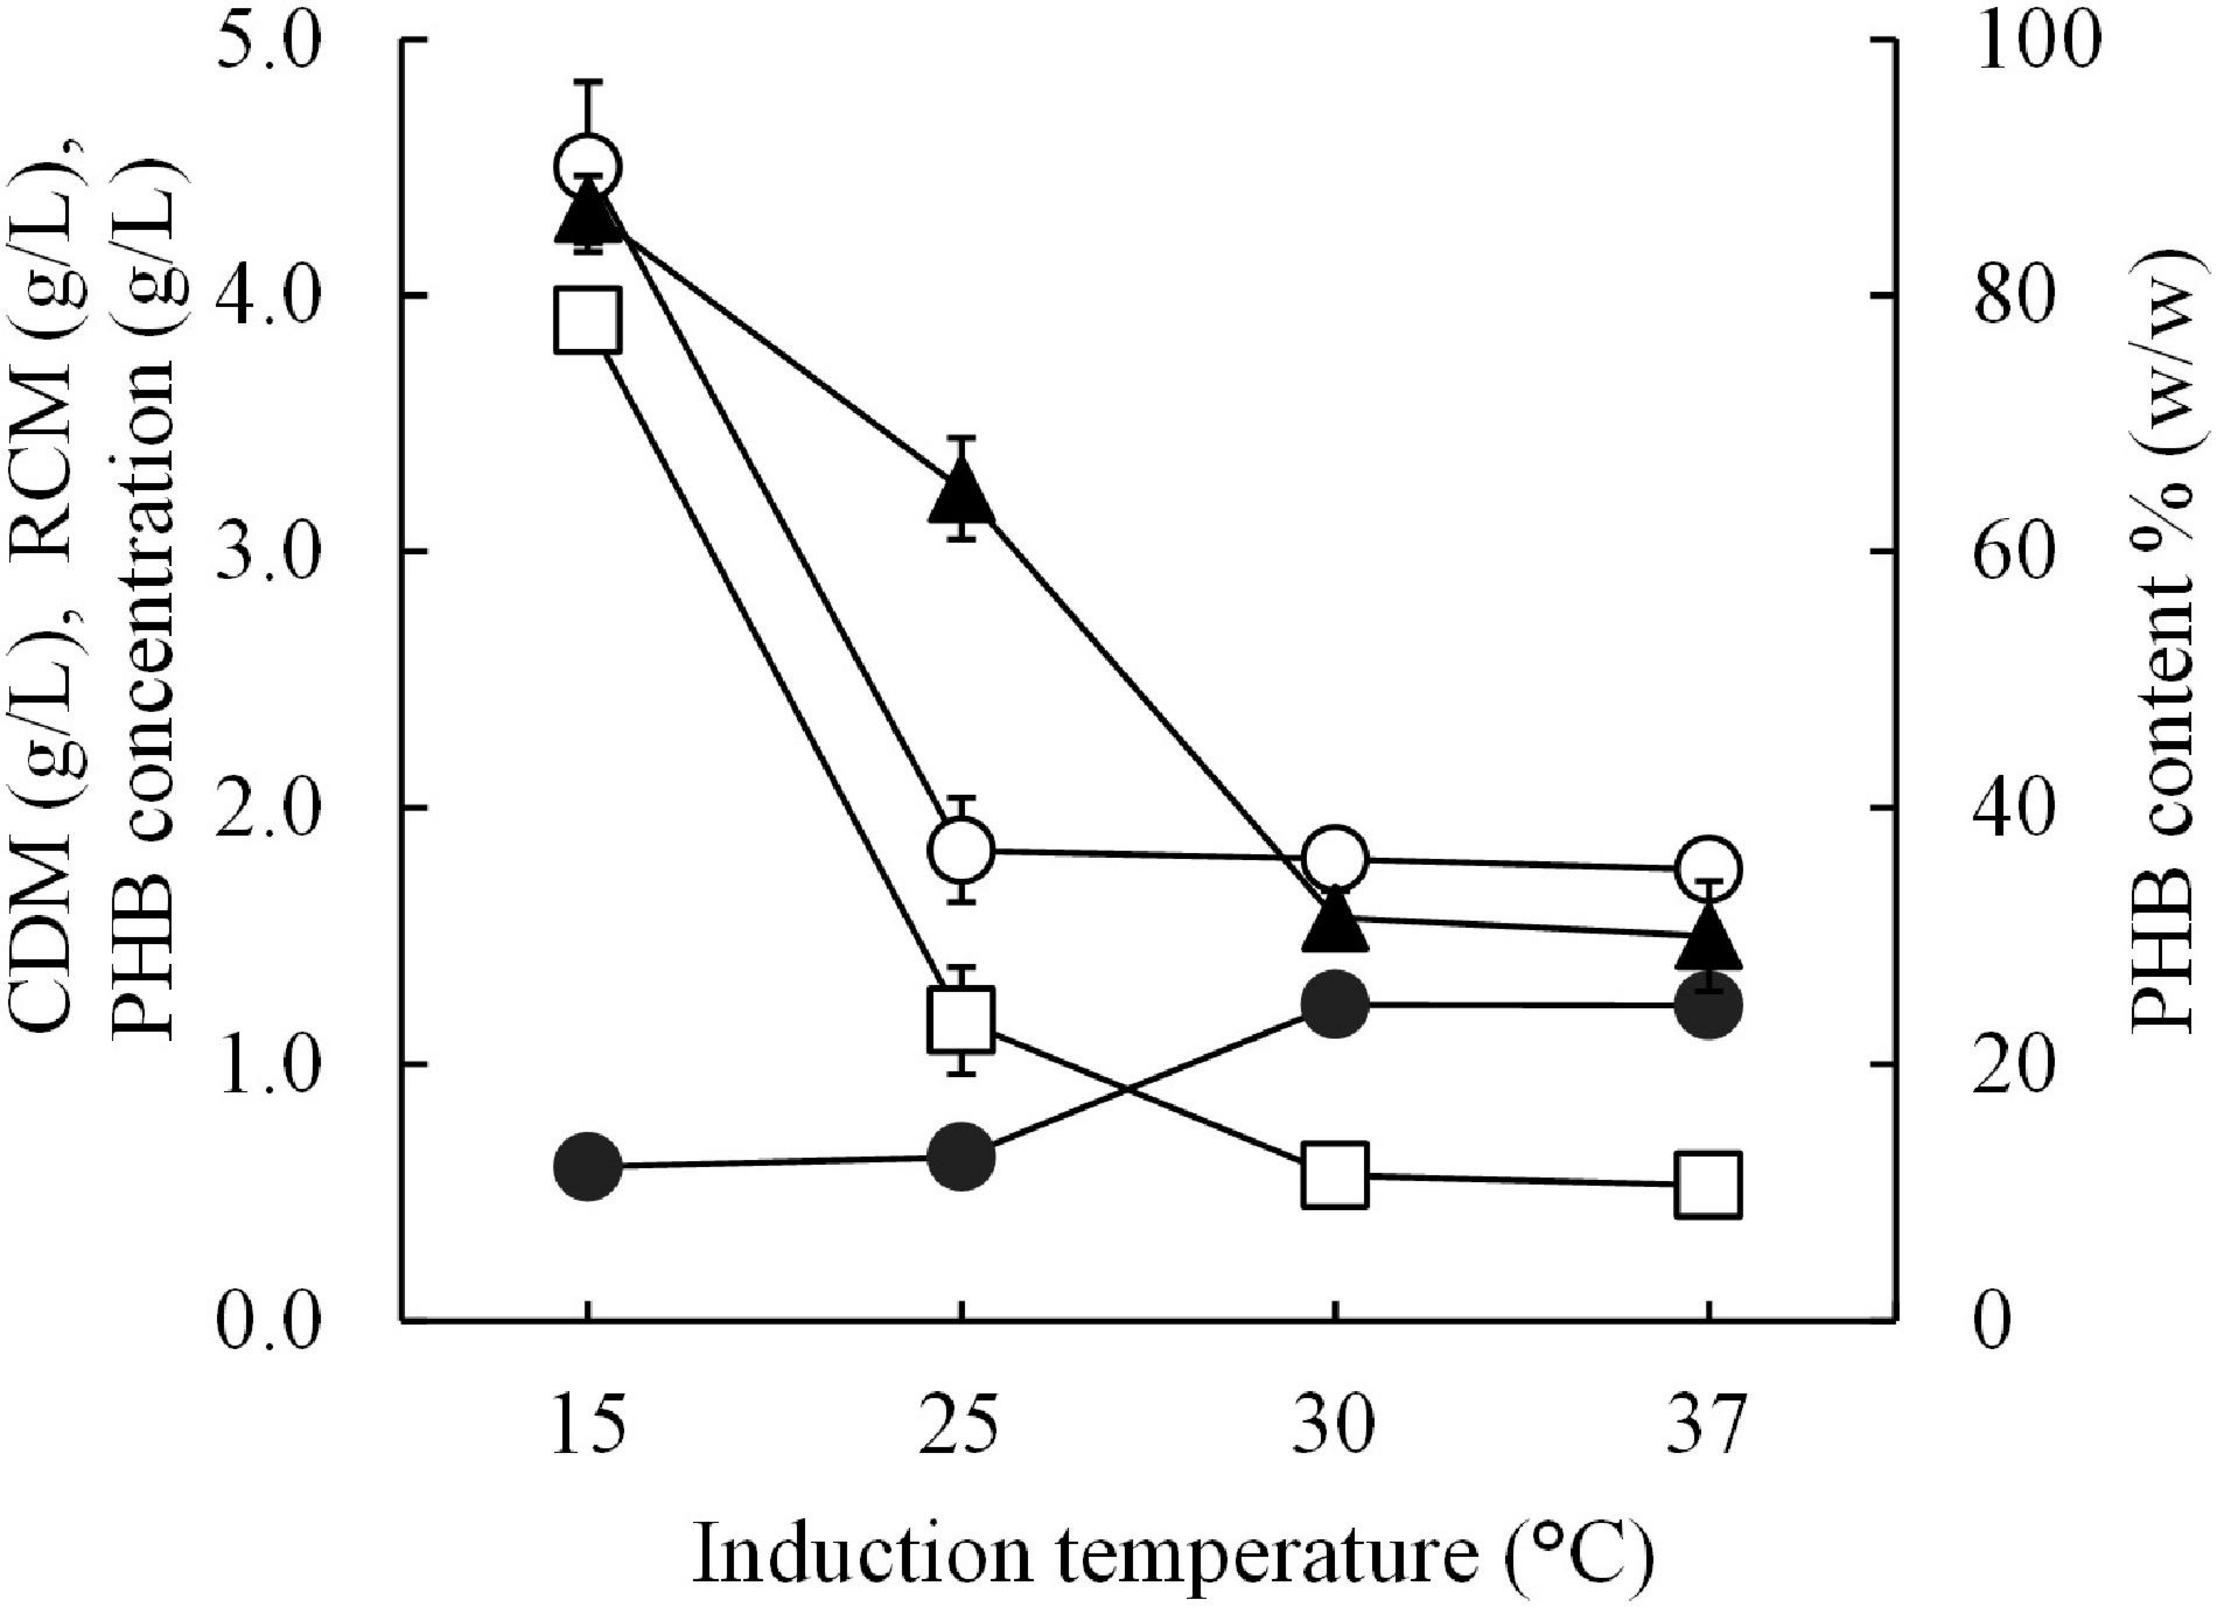
Figure 5. Effect of different short-induction temperatures (15, 25, 30, and 37 °C) on the CDM (g/L), RCM (g/L), PHB (g/L), and PHB content (% w/w) of E. coli JM109 (pColdI-phaCABA–04). All the data are representative of the results of three independent experiments and are expressed as the mean values ± standard deviations (SDs). Symbols: open circle, CDM (g/L); closed circle, RCM (g/L); open square, PHB (g/L); closed triangle, PHB content (% w/w).
We also investigated a preinduction strategy to enhance PHB productivity by extending the PHB production phase at 37°C for an additional 24 h after conventional induction. When the OD600 reached 0.5, IPTG was added at 0.5 mM into the culture, and the temperature was reduced from 37 to 15°C. Then, cultivation was performed for 24 h to allow full expression of the phaCABA–04 protein. Concurrently, the effect of inoculum size [1, 5, and 10% (v/v)] of induced cells was investigated under the preinduction conditions. The results are shown in comparison with those of the conventional induction and short-induction methods (Table 2). The preinduction method with a 5% (v/v) inoculum gave a higher amount of PHB (1.9 ± 0.6 g/L) than conventional induction with an inoculum size of 5% (v/v) (0.6 ± 0.1 g/L) and could extend the productivity of 0.039 ± 0.01 g PHB/(L⋅h) for 48 h so that the PHB content increased from 46.2 ± 1.8% (w/w) to 67.9 ± 1.8% (w/w). The increase in PHB content and PHB productivity occurred with an increase in the inoculum size. Nevertheless, the short-induction method with an inoculum size of 5% (v/v) gave the highest levels of PHB content and productivity. Therefore, the short-induction method using E. coli JM109 (pColdI-phaCABA–04) with an inoculum size of 0.5% (v/v) and cultivated until the OD600 reached 0.5 (2 h) before induction with 0.5 mM IPTG was selected to investigate the effect of induction temperature in the subsequent experiment.
Comparison of PHB Production Between pColdI-phaCABA–04 and pColdTF-phaCABA–04 in a 5-L Fermentor by the Short Induction Method
Altogether, for flask cultivation, the optimal conditions were the short-induction method using an inoculum of 0.5% (v/v) in a culture with an OD600 of 0.5, cold shock induced with 15°C for a short time, 30 min, and the addition of 0.5 mM IPTG. These conditions were selected as optimal parameters for scaling up production in a 5-L fermenter. The comparison between pColdI-phaCABA–04 and pColdTF-phaCABA–04 in a 5-L fermenter by the short-induction method was performed because the ratio of the soluble fraction and inclusion bodies of the phaCA–04 protein may affect PHB productivity and molecular weight distribution as reported by Harada et al. (2019).
Figure 6 shows the time courses of CDM (g/L), RCM (g/L), PHB (g/L), PHB content (% w/w), glucose (g/L), dissolved oxygen (%) and pH during batch cultivation in a 5-L fermenter, comparing E. coli JM109 (pColdI-phaCABA–04) (Figure 6A) and E. coli JM109 (pColdTF-phaCABA–04) (Figure 6B). The soluble PhaCA–04 protein detected by western blot analysis was also monitored at 6-h intervals over 48 h. The results shown in Table 5 demonstrated that E. coli JM109 (pColdTF-phaCABA–04) was a more effective PHB producer than the other strain. A PHB content of 89.8 ± 2.3% (w/w), PHB production of 7.9 ± 0.7 g/L, CDM production of 8.8 ± 0.5 g/L, YP/S value of 0.38 g PHB/g glucose and productivity of 0.43 g PHB/(L.h) were the maximum values obtained using pColdTF-phaCABA–04, whereas a PHB content of 80.6 ± 2.1% (w/w), PHB production of 5.8 ± 0.1 g/L, CDM production of 7.2 ± 0.3 g/L, YP/S value of 0.32 g PHB/g glucose and productivity of 0.24 g PHB/(L.h) were attained using pColdI-phaCABA–04. The phaCA–04 protein produced by pColdTF-phaCABA–04 was more stable and longer lasting (Figure 6B) than that obtained from pColdI-phaCABA–04, which was no longer detectable after 30 h of cultivation (Figure 6A). Therefore, we report here that the short-induction strategy facilitates cold shock cspA and chaperone TF proteins to act synergistically to improve the stabilization of PhaCA–04 and enhance productivity and the YP/S value in comparison with the use of cspA alone in pColdI.
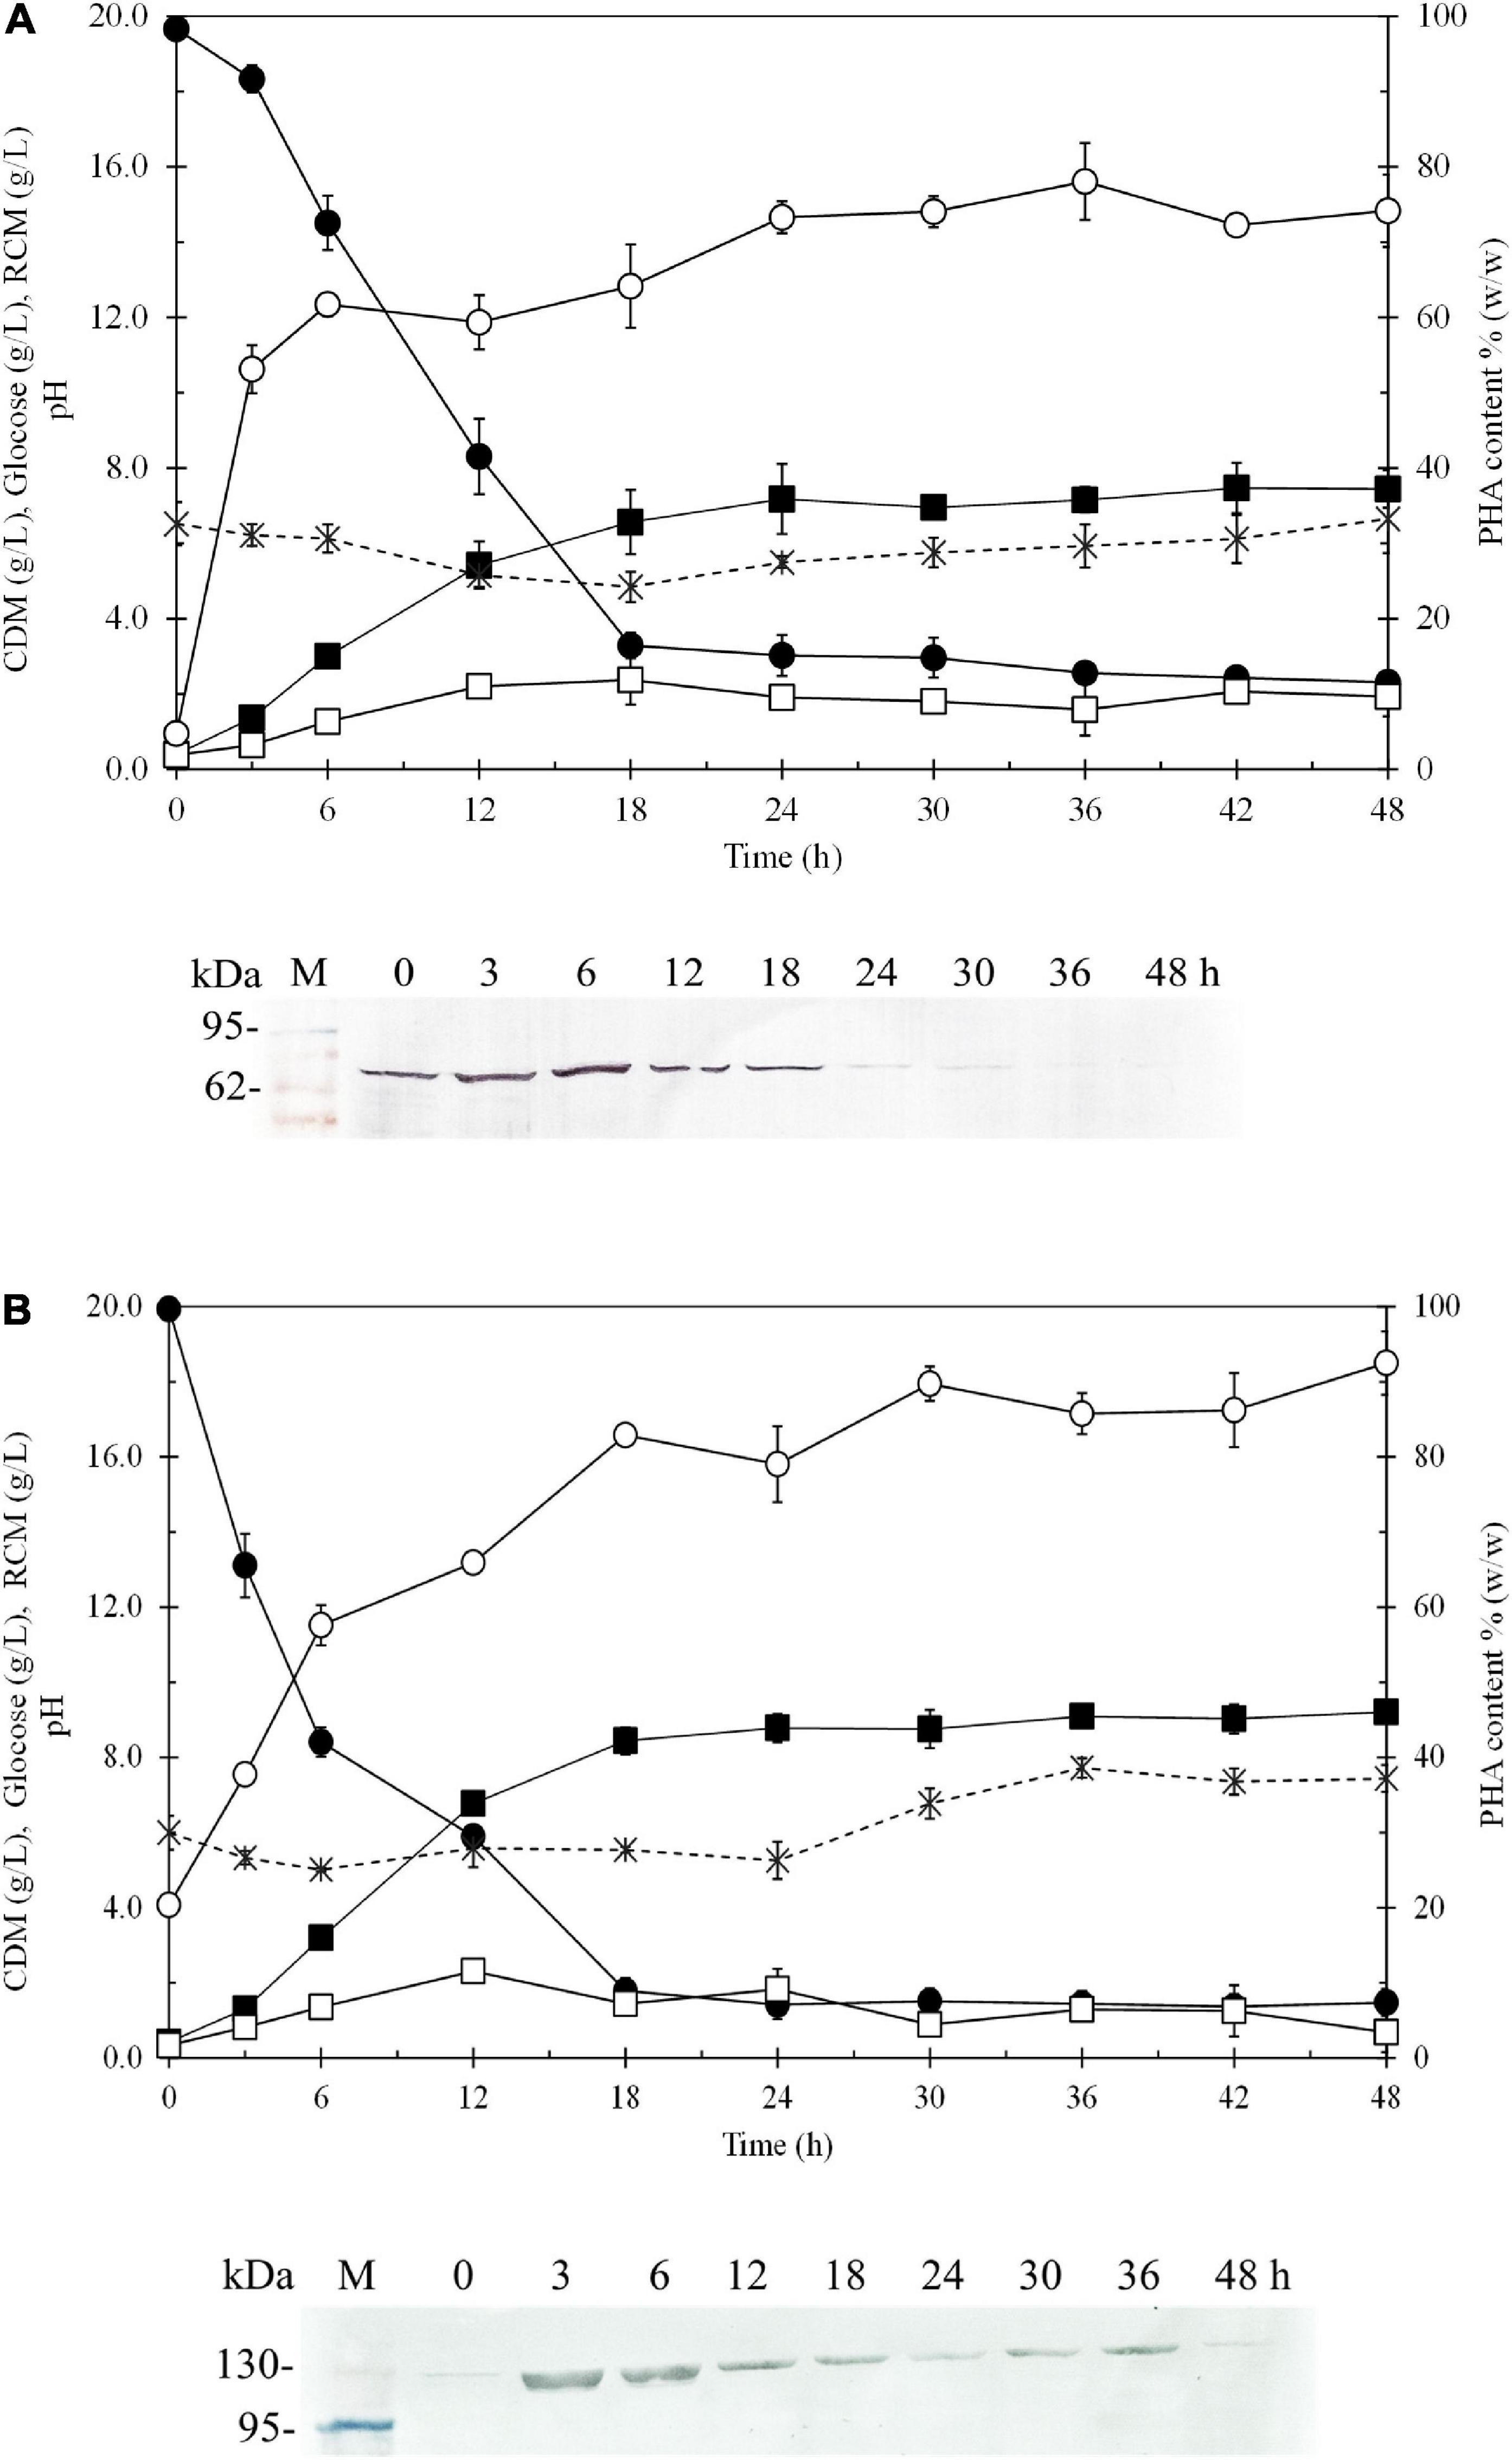
Figure 6. Time courses of CDM (g/L), RCM (g/L), PHB (g/L), PHB content (% w/w), and glucose (g/L) and pH during batch cultivation in a 5-L fermenter under the short-induction method in a comparison between (A) E. coli JM109 (pColdI-phaCABA–04) and (B) E. coli JM109 (pColdTF-phaCABA–04). The band appearing in the western blot at the position corresponding to that of the His-tagged phaCA–04 protein was 67 kDa in size for pColdI-phaCABA–04, and the fusion protein of His-tagged phaCA–04 and TF was 115 kDa in size. All the data are representative of the results of three independent experiments and are expressed as the mean values ± standard deviations (SDs). Symbols: closed square, CDM (g/L); closed circle, glucose (g/L); asterisks, pH; open square, RCM (g/L); open circle, PHB content (% w/w).
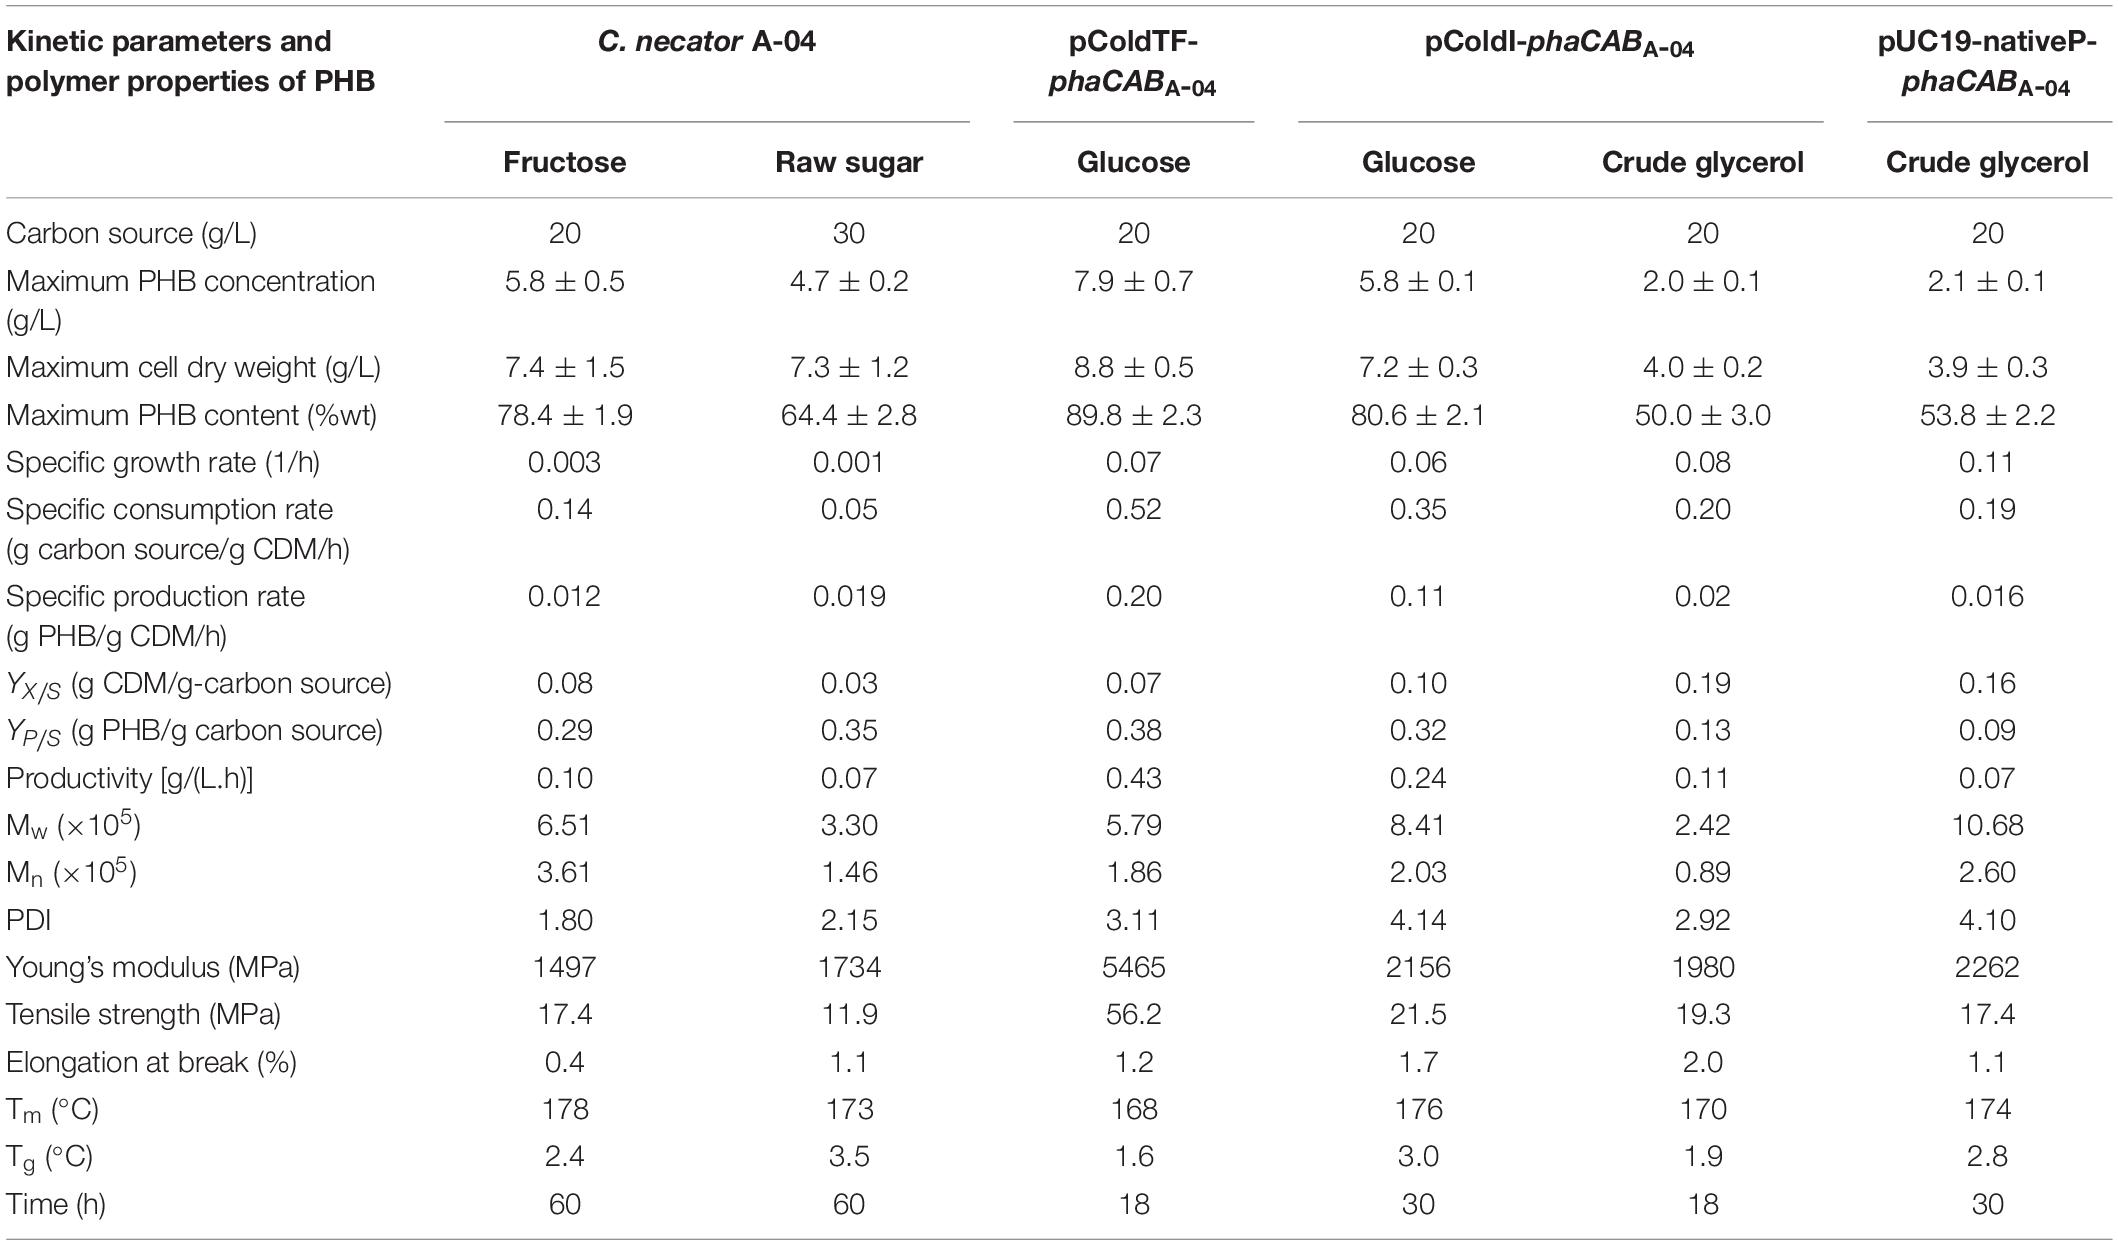
Table 5. Comparison of kinetic parameters, molecular weight, and thermal and mechanical properties of PHB produced by C. necator strain A-04, E. coli JM109 (pColdI-phaCABA–04), E. coli JM109 (pColdTF-phaCABA–04), and E. coli JM109 (pUC19-nativeP-phaCABA–04) in 5-L fermenter.
The PHB thin films were subjected to thermal analysis by DSC, molecular weight determination by GPC and mechanical property analysis by a universal testing machine as per the ASTM: D882-91 protocol (Table 5). The PHB from E. coli JM109 (pColdI-phaCABA–04) had an Mw of 8.17 × 10⁵ Da, an Mn of 1.97 × 10⁵ Da and a PDI of 4.1, whereas the PHB from E. coli JM109 (pColdTF-phaCABA–04) had an Mw of 2.6 × 10⁵ Da, an Mn of 0.95 × 10⁵ Da and a PDI 2.8, when glucose was used as a carbon source. However, the PHB from E. coli JM109 (pColdI-phaCABA–04) obtained using crude glycerol had the lowest Mw of 2.42 × 10⁵ Da, an Mn of 0.89 × 10⁵ Da and a PDI of 2.92. Interestingly, the PHB from E. coli JM109 (pUC19-nativeP-phaCABA–04) obtained using crude glycerol showed the highest Mw of 1.1 × 10⁶ Da, an Mn of 2.6 × 10⁵ Da and a PDI of 4.1. The melting temperature, Tm, of all the PHB film samples produced in this study was in the range of 165−178°C (Owen et al., 1992), and the glass transition temperature, Tg, was in the normal range of 1−4°C (Shimamura et al., 1994; Doi et al., 1995; Chanprateep et al., 2010). The Young’s modulus and tensile strength of the PHB from E. coli JM109 (pColdTF-phaCABA–04) possessed the highest values of 5465 and 56.2 MPa, respectively. Figure 7 shows the morphology and transparency of PHB films produced by C. necator strain A-04, E. coli JM109 (pColdI-phaCABA–04) and E. coli JM109 (pColdTF-phaCABA–04). The PHB films prepared by the film casting technique and produced from E. coli JM109 (pColdTF-phaCABA–04) showed a soft morphology with high transparency, which was different from the properties of the other PHB films. The PHB films were also subjected to 1H-NMR and 13C-NMR analyses and showed only chemical shifts of the PHB structure.
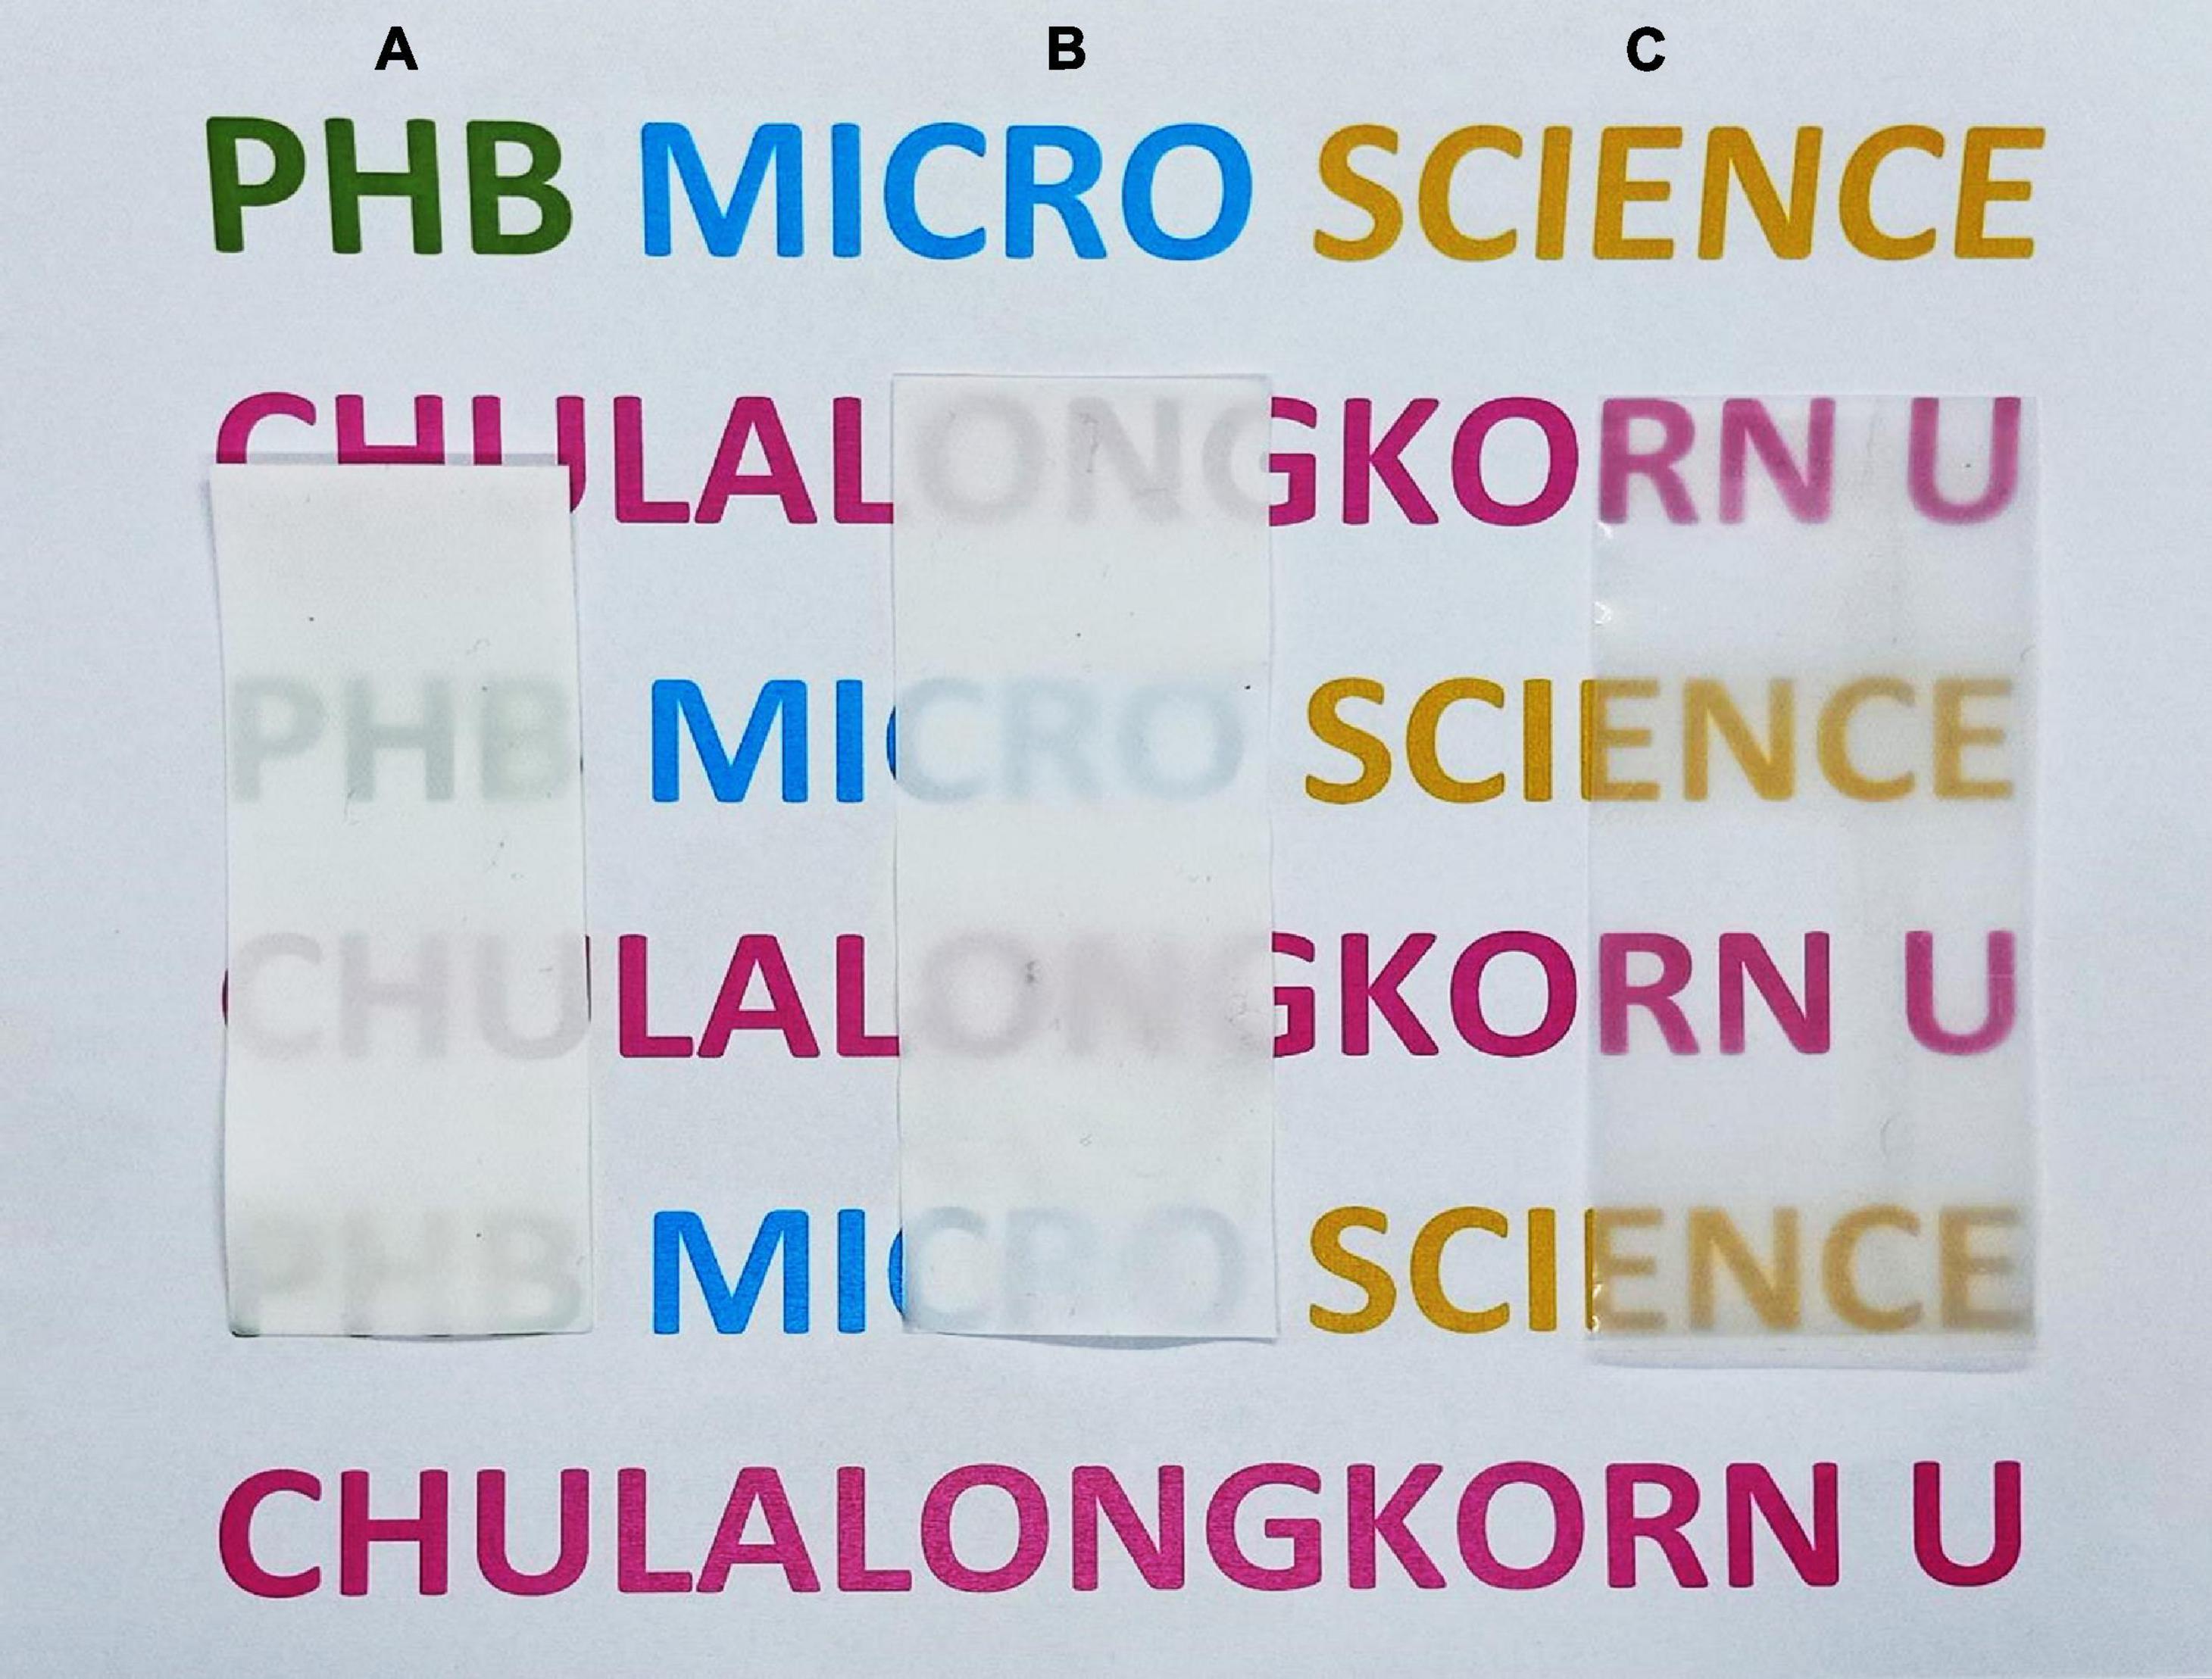
Figure 7. Morphology of PHB films produced by (A) C. necator strain A-04, (B) E. coli JM109 (pColdI-phaCABA–04), and (C) E. coli JM109 (pColdTF-phaCABA–04).
Discussion
It has been reported that PhaCH16, as a type I synthase and the most intensively studied of these proteins, preferentially catalyzes the polymerization of short-chain (R)-hydroxyalkanoic acids (4 to 6 carbon atoms), particularly the conversion of (R)-3-hydroxybutyrate-coenzyme A (3HBCoA) to poly(3-hydroxybutyrate) (PHB) (Schubert et al., 1988; Gerngross et al., 1994). In fact, a high concentration of PHB (157 g/L) has been achieved from glucose in high-cell-density cultures of recombinant E. coli harboring phaCABH16 and the additional cell division protein ftsZ gene (Wang and Lee, 1997; Choi and Lee, 2004). Ultrahigh-molecular-weight PHB and its applications have also been reported by many research groups (Kusaka et al., 1998; Iwata, 2005; Hiroe et al., 2012; Kabe et al., 2012). Beyond these previous reports, there have been few reports on the application of cold-shock systems for PHB production to address the challenges of soluble phaC expression in E. coli. From our previous reports, C. necator strain A-04 exhibits 99.78% similarity of 16S rRNA, 99.9% similarity of phaCA–04 and 100% similarity of phaAA–04 and phaBA–04 with those of C. necator H16. However, we observed differences in PHB productivity as well as the monomeric composition of the copolymers and terpolymers when we used the same carbon source (Chanprateep and Kulpreecha, 2006; Chanprateep et al., 2008, 2010). Interestingly, C. necator strain A-04 also exhibited growth abilities on pure glycerol as well as crude glycerol from a biodiesel plant in Thailand as compared with C. necator strain H16 (unpublished observations from personal communication with Tuck Seng Wong, University of Sheffield, United Kingdom). Thus, C. necator strain A-04 can be considered as one of the promising candidates for PHA production. However, the PHA productivity of C. necator strain A-04 still does not meet the requirement for industrial production. Thus, our objective was to investigate the ability of the phaCABA–04 gene operon when heterologously expressed in recombinant E. coli. We initially aimed to use the pColdI and pColdTF expression systems to address the challenges of soluble and functional phaCA–04 expression in E. coli JM109 from glucose as a carbon source for PHB production in a 5-L fermenter and evaluate its ability to use crude glycerol to attain low cost PHB production.
First, this study aimed to increase soluble PhaCA–04 expression in E. coli JM109 by using the cold-shock cspA promoter and TF. His-tagged phaCA–04 was overexpressed by pColdI, but most of the protein was present in insoluble form, with significant aggregation resulting in smear bands (Figures 2A, 5 and Table 3), whereas the His-tagged phaCA–04-TF fusion protein was expressed from pColdTF at lower levels than the protein from pColdI, but most of this protein was present in soluble form.
To examine the optimal induction temperature, the cold shock temperature was varied at 15, 25, 30, and 37°C for 30 min and then the cultivation temperature was shifted to 37°C for 24 h. It is noted that the optimal growth temperature of E. coli is 37°C where the optimal growth temperature for C. necator strain A-04 is 30°C. Our results demonstrated that the PHB content decreased when the temperature increased although the optimal growth temperature for C. necator strain A-04 was 30°C. The appropriate temperature for enzymatic activity of phaCA–04 activity can be considered between 30 to 37°C similar to Sheu et al. (2012) who reported the effects of temperature on the activity of PHA synthases and who revealed that mesophilic (PhaCH16) PHA synthases were differentiated distinctly based on the highest level of PHB accumulation at different temperatures. They demonstrated that the parental enzymes PhaCH16 had optimal temperature of 37°C (Sheu et al., 2012). Thus, our strategy (short induction) for PHB production using a cold-shock promoter in E. coli is lowering the temperature at 15°C for 30 min and then shifting the temperature to 37°C which is the optimal temperature for phaC activity.
We also performed parallel experiments using different hydrophilic tags, including expression via the native promoter of C. necator strain A-04, N-terminal GST-fused phaCABA–04, and N-terminal thioredoxin-fused and C-terminal 6His-fused phaCABA–04, to confirm that the high efficiency of PHB production was contributed by the cold-shock cspA promoter. It was found that the GST-PhaCABA–04, Thioredoxin-PhaCABA–04, 6His-phaCABA–04 and nativeP-phaCABA–04 gave similar values for PHB production and PHB content, which were 2.5 times lower than the values obtained with pCold and pColdTF (Figure 3A and Table 4). In our study, the GST-PhaCA–04 did not improve PHB production and exhibited lower PHB productivity than the control pUC19-nativeP-phaCABA–04, same as previously mentioned by Harada et al. (2019). The araBAD promoter showed the highest level of PhaCA–04 protein production, but most of them were in insoluble form. However, this study was performed using the short induction strategies that could limit the expression of PhaCABA–04 under different promoters.
In addition, the ratio of soluble fraction to the total phaCA–04 proteins from pColdTF-phaCABA–04 and pColdI-phaCABA–04 under conventional induction and short induction method was carefully analyzed by IMAC affinity chromatography under native conditions protein (Table 3). The ratio of soluble fraction to the total phaCA–04 proteins from pColdTF-phaCABA–04 was about 3−4 times higher than that from pColdI-phaCABA–04 both under short induction and conventional induction method. Thus, it can be concluded that the TF chaperone helped solubilize phaCA–04 in our investigation. Finally, the production of PHB of pColdI-phaCABA–04 and pColdTF-phaCABA–04 was compared in the 5-L fermenter using the short induction method and yielded YP/S of 0.38 g-PHB/g-glucose whereas the theoretical yield YP/S was reported as 0.48 of g-PHB/g-glucose (Yamane, 1993). This phenomenon can be explained that the growth of E. coli on glucose causes acidic by-products formation, mainly acetate, under both aerobic and anaerobic conditions (Lee et al., 1994). In this study, it was observed that the pH decreased from 7.0 (initial pH) to 4.9–5.0 at 18 h as acetate accumulated and then increased back to 6.6–7.4 (Figure 6) as acetate was consumed (Chen et al., 2018). Therefore, the YP/S obtained in these experiments was lower than the theoretical yield. In this study, the pH and dissolved oxygen were not controlled because Lee et al. reported that controlled pH and/or dissolved oxygen of the recombinant E. coli strains resulted in higher RCM with low PHB content of less than 40% due to better growth condition, where much acetyl-CoA can flow into the tricarboxylic acid (TCA) cycle (Lee et al., 1994). Acetyl-CoA is a fundamental metabolite in central metabolic pathways of E. coli, and also served as a precursor for biosynthesis of a large number of industrial chemicals and natural products including PHB (Martin et al., 2003; Meng et al., 2012; Liu et al., 2016; Sun et al., 2020). The main metabolic route for acetyl-CoA synthesis in E. coli is the glycolysis pathway coupled with decarboxylation of pyruvate by pyruvate dehydrogenase (Bates et al., 1977). Through this pathway, each mol of glucose is converted into 2 mol of acetyl-CoA with generation of 4 mol of NADH, 2 mol of ATP and 2 mol of CO2. The release of CO2 lowers the atomic economy of targeted chemical biosynthetic pathway, leading to the decrease of theoretical production yield, titer and productivity (Chae et al., 2017). In addition, glucose is catabolized through glycolysis pathway to pyruvate, which is converted into acetyl-CoA under catalysis of pyruvate dehydrogenase, with reduction of NAD+ to NADH in both glycolysis pathway and pyruvate dehydrogenation. As a result, NADH could not be oxidized through respiratory chain sufficiently, the build-up of NADH rapidly inactivated the pyruvate dehydrogenase (Hansen and Henning, 1966), leading to accumulation of pyruvate in cells, and the recycling of NAD+ must be achieved through the reduction of some metabolites (Bunch et al., 1997). Therefore, acetate is accumulated in medium in large quantity. Acetate overflow is caused by an imbalance between the pathways of glycolysis and TCA cycle in rapidly growing cells, and severely decreases the yield of target chemicals from glucose (Farmer and Liao, 1997; Wong et al., 2008). It has been known that E. coli cells grown on glucose produce acetate and consume acetate after glucose exhaustion, but do not grow on acetate due to the decoupling of acetate anabolism and acetate catabolism, and the growth restores only after prolonged exposure to acetate (Sun et al., 2020). With the same glucose concentration, Lee et al. (1994) performed a comparative study of recombinant E. coli strains (K12, B, W, XL1-Blue, JM109, DH5α, and HB101) for PHB production from glucose. They reported that YP/S of E. coli strain XL1-Blue (pSYL105) grown in LB medium containing 20 g/L glucose was as high as 0.369 g PHB/g glucose whereas JM109 provided 0.299 g PHB/g glucose. Thus, the YP/S obtained in this study was comparable. In the fed-batch cultivation studies, Wang and Lee (1997) performed a fed-batch culture of E. coli XL1-Blue (pSYL107) in a 50-l fermentor and attained YP/S of 0.28 g of PHB/g of glucose (3,849 g of PHB produced from 13,900 g of glucose). They mentioned that a slightly lower PHB yield on glucose in a defined medium than in LB medium (0.37 g of PHB/g of glucose) because glucose was converted to CO2 in a defined medium more than in LB medium (Wang and Lee, 1997). Next, they applied the feeding solution contained 700 g/L glucose, 20 MgSO4⋅7H2O, and 250 mg/L of thiamine in fed-batch cultivation. As a result, cell concentration of 149 g/L and PHB concentration of 104 g/L (PHB content 69.5%) were obtained in 51 h, resulting in the PHB productivity of 2.0 g/L/h. This is the highest PHB concentration obtained by employing recombinant E. coli containing the phaCABH16 biosynthesis genes and the E. coli ftsZ gene. In our previous report, we performed fed-batch cultivations by pH-stat control in a 5-L fermenter using E. coli strain XL1-Blue harboring pColdTF-phaCABA–04, leading to a PHB production of 31.4 ± 0.9 g/L at 54 h with a PHB content of 83.0 ± 3.8% (w/w), a CDM of 37.8 ± 1.2 g/L, a YP/S value of 0.39 g PHB/g glucose and a productivity of 0.6 g PHB/(L⋅h) in define medium. To investigate the possibility of improving the PHB yield and productivity, we are now carrying out fed-batch cultures under various conditions including oxygen limitation during PHB synthesis phase as it may be possible to enhance the PHB synthesis rate by increasing the acetyl-CoA flux into the PHB biosynthetic pathway and reducing its flux into the tricarboxylic acid cycle (Wang and Lee, 1997).
The produced PHB were characterized and it was found that the Mw of PHB produced from pColdTF-phaCABA–04, for which soluble phaCA–04 was 4.1 times higher than pColdI-phaCABA–04 was lower than that from pColdI-phaCABA–04. Hiroe et al. (2012) have reported that that the concentration of active PHA synthase had a negative correlation with PHB molecular weight and a positive correlation with cellular PHB content, similar to our observation. The Mw and Mn of PHB produced by pColdTF were lower than those of pColdI-phaCABA–04 and pUC19-nativeP-phaCABA–04. In this case, TF increases PhaC production and its Mw decreases due to the presence of more active PhaC. To achieve low-cost production, crude glycerol containing 80% glycerol provided by Bangchak Corporation Public Company Limited as a byproduct from biodiesel production, was used as a carbon source to produce PHB using pColdI-phaCABA–04 and pUC19-nativeP-phaCABA–04. With E. coli JM109 (pColdI-phaCABA–04), PHB produced from crude glycerol had an Mw of 2.42 × 10⁵ Da and an Mn of 0.89 × 10⁵ Da with a PDI of 2.92, whereas those results from glucose were Mw of 8.41 × 10⁵ Da and an Mn of 2.03 × 10⁵ Da with a PDI of 4.14. The crude glycerol caused the termination step involves a chain transfer (CT) reaction in which the polymer chain is transferred to the crude glycerol (CT agent) in this case (Madden et al., 1999). However, in our study, when pUC19-nativeP-phaCABA–04-expressing E. coli was used to produce PHB from crude glycerol, an Mw of 1.1 × 10⁶ Da, an Mn of 2.6 × 10⁵ Da and a PDI of 4.1 were obtained, indicating that slow and low phaCA–04 expression prolonged and maintained the phaCA–04 polymerization activity, which in turn resulted in a low amount of PHB with a high molecular weight (Hiroe et al., 2012).
Conclusion
This study revealed that the cspA promoter in a cold-inducible vector can enhance total PhaCA–04 expression and TF chaperones showed obvious effects on enhancing PhaC solubility. The short induction strategies developed in this study did not affect on molecular weight distribution and polymer properties. Cultivation in a 5-L fermenter led to PHB production of 7.9 ± 0.7 g/L with 89.8 ± 2.3% PHB content in the cell dry mass (CDM), a YP/S value of 0.38 g PHB/g glucose and a productivity of 0.43 g PHB/(L⋅h) using pColdTF-phaCABA–04. The PHB from pColdTF-phaCABA–04 had Mw 5.79 × 10⁵ Da, Mn 1.86 × 10⁵ Da and PDI 3.11 and the film exhibited high optical transparency with typical melting temperature and mechanical properties.
Data Availability Statement
The datasets presented in this study can be found in online repositories. The names of the repository/repositories and accession number(s) can be found below: https://www.ncbi.nlm.nih.gov/genbank/, FJ897463; https://www.ncbi.nlm.nih.gov/genbank/, FJ897461; and https://www.ncbi.nlm.nih.gov/genbank/, FJ897462.
Author Contributions
TB performed the experiments and discussed the results. RW-S provided guidance for the experimental design and discussed the results. KH provided suggestions for the experimental design and discussed the results. SCN provided guidance and suggestions for the experimental design, discussed the results, and wrote and revised the manuscript. All the authors read and approved the final version of the manuscript.
Conflict of Interest
The authors declare that the research was conducted in the absence of any commercial or financial relationships that could be construed as a potential conflict of interest.
Funding
This research was supported in part by The 100th Anniversary Chulalongkorn University Fund for Doctoral Scholarship and The 90th Anniversary of Chulalongkorn University Fund (Rachadaphiseksomphot Endowment Fund).
Acknowledgments
The authors greatly appreciate support and useful advice from Associate Professor Takeharu Tsuge at Department of Materials Science and Engineering, School of Materials and Chemical Technology, Tokyo Institute of Technology, Yokohama, Japan regarding the analysis of molecular weight distributions by gel permeation chromatography. The authors would also like to thank Bangchak Initiative Innovation Center at Bangchak Corporation Public Company Limited for providing the glycerol wastes used in this study. The preprint (doi: 10.21203/rs.3.rs-28241/v1 and 10.21203/rs.3.rs-28241/v) from the research square preprint platform was a previous version that underwent major revisions.
Supplementary Material
The Supplementary Material for this article can be found online at: https://www.frontiersin.org/articles/10.3389/fbioe.2021.666036/full#supplementary-material
Supplementary Figure 1 | Construction of PHA biosynthesis genes in cold-shock inducible expression vectors (A) pColdI-phaCABA–04 and (B) pColdTF-phaCABA–04.
Supplementary Figure 2 | Effect of IPTG concentrations (0.01, 0.05, 0.1, 0.5, and 1.0 mM) on the expression of His-tagged phaCA–04 protein (A) (pColdI-phaCABA–04) and (B) the fusion protein of His-tagged phaCA–04 and TF (pColdTF-phaCABA–04) under conventional induction method. The band appearing in the SDS PAGE at the position corresponding to that of the His-tagged phaCA–04 protein was 67 kDa in size and the fusion protein of His-tagged phaCA–04 and TF was 115 kDa in size.
Supplementary Figure 3 | Purification of His-tagged PhaCA–04 protein of E. coli JM109 (pColdI-phaCABA–04) at 15°C (A) and the fusion protein of His-tagged PhaCA–04 protein and TF of E. coli JM109 (pColdTF-phaCABA–04) at 15°C by IMAC affinity chromatography under native condition (B). The extracted protein was normalized to 2 mg and loaded on Protino® Ni-IDA 1000 packed column. Ten microliters of each fraction eluted from IMAC column were loaded onto 10% w/v acrylamide gel for SDS-PAGE and Western blot analysis. M, Protein molecular weight marker; Ly, Bacterial lysate, soluble proteins; Fl, Flow-though lysate; W1 and W2, Wash with 50 mM NaH2PO4, 300 mM NaCl, 20 mM imidazole and pH 8.0; E1–E3, Eluted with 50 mM NaH2PO4, 300 mM NaCl, 250 mM imidazole and pH 8.0. His-tagged phaCA–04 fusion protein was 67 kDa in size for pColdI-phaCABA–04 and the fusion protein of His-tagged phaCA–04 and TF was 115 kDa in size for pColdTF-phaCABA–04. The soluble fractions were quantified by Bradford protein assay. All IMAC purifications were performed as n = 3 technical replicates.
References
Agashe, V. R., Guha, S., Chang, H.-C., Genevaux, P., Hayer-Hartl, M., Stemp, M., et al. (2004). Function of trigger factor and DnaK in multidomain protein folding: increase in yield at the expense of folding speed. Cell 117, 199–209. doi: 10.1016/s0092-8674(04)00299-5
Agus, J., Kahar, P., Abe, H., Doi, Y., and Tsuge, T. (2006a). Altered expression of polyhydroxyalkanoate synthase gene and its effect on poly [(R)-3-hydroxybutyrate] synthesis in recombinant Escherichia coli. Polym. Degrad. Stab. 91, 1645–1650. doi: 10.1016/j.polymdegradstab.2005.12.011
Agus, J., Kahar, P., Abe, H., Doi, Y., and Tsuge, T. (2006b). Molecular weight characterization of poly [(R)-3-hydroxybutyrate] synthesized by genetically engineered strains of Escherichia coli. Polym. Degrad. Stab. 91, 1138–1146. doi: 10.1016/j.polymdegradstab.2005.07.006
Ahn, W. S., Park, S. J., and Lee, S. Y. (2000). Production of Poly (3-hydroxybutyrate) by fed-batch culture of recombinant Escherichia coli with a highly concentrated whey solution. Appl. Environ. Microbiol. 66, 3624–3627. doi: 10.1128/aem.66.8.3624-3627.2000
Baneyx, F. (1999). Recombinant protein expression in Escherichia coli. Curr. Opin. Biotechnol. 10, 411–421.
Baneyx, F., and Mujacic, M. (2004). Recombinant protein folding and misfolding in Escherichia coli. Nat. Biotechnol. 22, 1399–1408. doi: 10.1038/nbt1029
Bates, D. L., Danson, M. J., Hale, G., Hooper, E. A., and Perham, R. N. (1977). Self-assembly and catalytic activity of the pyruvate dehydrogenase multienzyme complex of Escherichia coli. Nature 268, 313–316. doi: 10.1038/268313a0
Bie, F. D. (2020). Market Update 2020. Available online at: https://www.european-bioplastics.org/market-update-2020-bioplastics-continue-to-become-mainstream-as-the-global-bioplastics-market-is-set-to-grow-by-36-percent-over-the-next-5-years/ (accessed May 3, 2021).
Brandi, A., Spurio, R., Gualerzi, C. O., and Pon, C. L. (1999). Massive presence of the Escherichia coli ‘majorcold-shock protein’CspA under non-stress conditions. EMBO J. 18, 1653–1659. doi: 10.1093/emboj/18.6.1653
Braunegg, G., Sonnleitner, B., and Lafferty, R. (1978). A rapid gas chromatographic method for the determination of poly-β-hydroxybutyric acid in microbial biomass. Appl. Microbiol. Biotechnol. 6, 29–37. doi: 10.1007/bf00500854
Bunch, P. K., Mat-Jan, F., Lee, N., and Clark, D. P. (1997). The ldhA gene encoding the fermentative lactate dehydrogenase of Escherichia coli. Microbiology 143, 187–195. doi: 10.1099/00221287-143-1-187
Chae, T. U., Choi, S. Y., Kim, J. W., Ko, Y.-S., and Lee, S. Y. (2017). Recent advances in systems metabolic engineering tools and strategies. Curr. Opin. Biotechnol. 47, 67–82. doi: 10.1016/j.copbio.2017.06.007
Chanprateep, S., Buasri, K., Muangwong, A., and Utiswannakul, P. (2010). Biosynthesis and biocompatibility of biodegradable poly(3-hydroxybutyrate- co-4-hydroxybutyrate). Polym. Degrad. Stab. 95, 2003–2012. doi: 10.1016/j.polymdegradstab.2010.07.014
Chanprateep, S., Katakura, Y., Visetkoop, S., Shimizu, H., Kulpreecha, S., and Shioya, S. (2008). Characterization of new isolated Ralstonia eutropha strain A-04 and kinetic study of biodegradable copolyester poly(3-hydroxybutyrate-co-4-hydroxybutyrate) production. J. Industr. Microbiol. Biotechnol. 35, 1205–1215. doi: 10.1007/s10295-008-0427-5
Chanprateep, S., and Kulpreecha, S. (2006). Production and characterization of biodegradable terpolymer poly(3-hydroxybutyrate-co-3-hydroxyvalerate-co-4-hydroxybutyrate) by Alcaligenes sp. A-04. J. Biosci. Bioeng. 101, 51–56. doi: 10.1263/jbb.101.51
Chen, J., Li, W., Zhang, Z.-Z., Tan, T.-W., and Li, Z.-J. (2018). Metabolic engineering of Escherichia coli for the synthesis of polyhydroxyalkanoates using acetate as a main carbon source. Microb. Cell Factories 17, 1–12.
Choi, J.-I., and Lee, S. Y. (2004). High level production of supra molecular weight poly (3-hydroxybutyrate) by metabolically engineered Escherichia coli. Biotechnol. Bioprocess Eng. 9, 196–200. doi: 10.1007/bf02942292
Dharmadi, Y., Murarka, A., and Gonzalez, R. (2006). Anaerobic fermentation of glycerol by Escherichia coli: a new platform for metabolic engineering. Biotechnol. Bioeng. 94, 821–829. doi: 10.1002/bit.21025
Doi, Y., Kitamura, S., and Abe, H. (1995). Microbial synthesis and characterization of poly (3-hydroxybutyrate-co-3-hydroxyhexanoate). Macromolecules 28, 4822–4828. doi: 10.1021/ma00118a007
Farmer, W. R., and Liao, J. C. (1997). Reduction of aerobic acetate production by Escherichia coli. Appl. Environ. Microbiol. 63, 3205–3210. doi: 10.1128/aem.63.8.3205-3210.1997
Gebauer, B., and Jendrossek, D. (2006). Assay of poly (3-hydroxybutyrate) depolymerase activity and product determination. Appl. Environ. Microbiol. 72, 6094–6100. doi: 10.1128/aem.01184-06
Gerngross, T., and Martin, D. (1995). Enzyme-catalyzed synthesis of poly [(R)-(-)-3-hydroxybutyrate]: formation of macroscopic granules in vitro. Proc. Natl. Acad. Sci. U.S.A. 92, 6279–6283. doi: 10.1073/pnas.92.14.6279
Gerngross, T., Snell, K., Peoples, O., Sinskey, A., Csuhai, E., Masamune, S., et al. (1994). Overexpression and purification of the soluble polyhydroxyalkanoate synthase from Alcaligenes eutrophus: evidence for a required posttranslational modification for catalytic activity. Biochemistry 33, 9311–9320. doi: 10.1021/bi00197a035
Gross, R. A., and Kalra, B. (2002). Biodegradable polymers for the environment. Science 297, 803–807. doi: 10.1126/science.297.5582.803
Hansen, R., and Henning, U. (1966). Regulation of pyruvate dehydrogenase activity in Escherichia coli K12. Biochim. Biophys. Acta (BBA)-Enzymol. Biol. Oxidation 122, 355–358. doi: 10.1016/0926-6593(66)90076-2
Harada, K., Nambu, Y., Mizuno, S., and Tsuge, T. (2019). In vivo and in vitro characterization of hydrophilic protein tag-fused Ralstonia eutropha polyhydroxyalkanoate synthase. Int. J. Biol. Macromolecules 138, 379–385. doi: 10.1016/j.ijbiomac.2019.07.095
Hiroe, A., Tsuge, K., Nomura, C. T., Itaya, M., and Tsuge, T. (2012). Rearrangement of gene order in the phaCAB operon leads to effective production of ultrahigh-molecular-weight poly [(R)-3-hydroxybutyrate] in genetically engineered Escherichia coli. Appl. Environ. Microbiol. 78, 3177–3184. doi: 10.1128/aem.07715-11
Iwata, T. (2005). Strong fibers and films of microbial polyesters. Macromol. Biosci. 5, 689–701. doi: 10.1002/mabi.200500066
Kabe, T., Tsuge, T., Kasuya, K.-I., Takemura, A., Hikima, T., Takata, M., et al. (2012). Physical and structural effects of adding ultrahigh-molecular-weight poly [(R)-3-hydroxybutyrate] to wild-type poly [(R)-3-hydroxybutyrate]. Macromolecules 45, 1858–1865. doi: 10.1021/ma202285c
Kahar, P., Agus, J., Kikkawa, Y., Taguchi, K., Doi, Y., and Tsuge, T. (2005). Effective production and kinetic characterization of ultra-high-molecular-weight poly [(R)-3-hydroxybutyrate] in recombinant Escherichia coli. Polym. Degrad. Stab. 87, 161–169. doi: 10.1016/j.polymdegradstab.2004.08.002
Kawaguchi, Y., and Doi, Y. (1992). Kinetics and mechanism of synthesis and degradation of poly (3-hydroxybutyrate) in Alcaligenes eutrophus. Macromolecules 25, 2324–2329. doi: 10.1021/ma00035a007
Kusaka, S., Iwata, T., and Doi, Y. (1998). Microbial synthesis and physical properties of ultra-high-molecular-weight poly [(R)-3-hydroxybutyrate]. J. Macromol. Sci., Part A: Pure Appl. Chem. 35, 319–335. doi: 10.1080/10601329808001980
Lee, S. Y., Lee, K. M., Chan, H. N., and Steinbüchel, A. (1994). Comparison of recombinant Escherichia coli strains for synthesis and accumulation of poly-(3-hydroxybutyric acid) and morphological changes. Biotechnol. Bioeng. 44, 1337–1347. doi: 10.1002/bit.260441110
Liu, C., Ding, Y., Zhang, R., Liu, H., Xian, M., and Zhao, G. (2016). Functional balance between enzymes in malonyl-CoA pathway for 3-hydroxypropionate biosynthesis. Metab. Eng. 34, 104–111. doi: 10.1016/j.ymben.2016.01.001
Liu, F., Li, W., Ridgway, D., Gu, T., and Shen, Z. (1998). Production of poly-β-hydroxybutyrate on molasses by recombinant Escherichia coli. Biotechnol. Lett. 20, 345–348.
Madden, L. A., Anderson, A. J., Shah, D. T., and Asrar, J. (1999). Chain termination in polyhydroxyalkanoate synthesis: involvement of exogenous hydroxy-compounds as chain transfer agents. Int. J. Biol. Macromolecules 25, 43–53. doi: 10.1016/s0141-8130(99)00014-8
Maier, T., Ferbitz, L., Deuerling, E., and Ban, N. (2005). A cradle for new proteins: trigger factor at the ribosome. Curr. Opin. Struct. Biol. 15, 204–212. doi: 10.1016/j.sbi.2005.03.005
Martin, V. J., Pitera, D. J., Withers, S. T., Newman, J. D., and Keasling, J. D. (2003). Engineering a mevalonate pathway in Escherichia coli for production of terpenoids. Nat. Biotechnol. 21, 796–802. doi: 10.1038/nbt833
Meng, D.-C., Shi, Z.-Y., Wu, L.-P., Zhou, Q., Wu, Q., Chen, J.-C., et al. (2012). Production and characterization of poly (3-hydroxypropionate-co-4-hydroxybutyrate) with fully controllable structures by recombinant Escherichia coli containing an engineered pathway. Metab. Eng. 14, 317–324. doi: 10.1016/j.ymben.2012.04.003
Miller, G. L. (1959). Use of dinitrosalicylic acid reagent for determination of reducing sugar. Anal. Chem. 31, 426–428. doi: 10.1021/ac60147a030
Napathorn, S. C., Visetkoop, S., Pinyakong, O., Okano, K., and Honda, K. (2021). Polyhydroxybutyrate (PHB) production using an arabinose-inducible expression system in Escherichia coli. Front. Bioeng. Biotechnol. 9:329. doi: 10.3389/fbioe.2021.661096
Owen, A., Heinzel, J., and Škrbić, Ž, and Divjaković, V. (1992). Crystallization and melting behaviour of PHB and PHB/HV copolymer. Polymer 33, 1563–1567. doi: 10.1016/0032-3861(92)90139-n
Patzelt, H., Kramer, G., Rauch, T., Schönfeld, H.-J., Bukau, B., and Deuerling, E. (2002). Three-state equilibrium of Escherichia coli trigger factor. Biol. Chem. 383, 1611–1619.
Peoples, O. P., and Sinskey, A. J. (1989). Poly-beta-hydroxybutyrate (PHB) biosynthesis in Alcaligenes eutrophus H16. Identification and characterization of the PHB polymerase gene (phbC). J. Biol. Chem. 264, 15298–15303. doi: 10.1016/s0021-9258(19)84825-1
Prata, J. C., Silva, A. L. P., Da Costa, J. P., Mouneyrac, C., Walker, T. R., Duarte, A. C., et al. (2019). Solutions and integrated strategies for the control and mitigation of plastic and microplastic pollution. Int. J. Environ. Res. Public Health 16:2411. doi: 10.3390/ijerph16132411
Rehm, B. H. (2003). Polyester synthases: natural catalysts for plastics. Biochem. J. 376, 15–33. doi: 10.1042/bj20031254
Sambrook, J., and Russell, D. W. (2001). Molecular Cloning: A Laboratory Manual. 2001. New York, NY: Cold Spring Harbor Laboratory Press.
Schnurr, R. E., Alboiu, V., Chaudhary, M., Corbett, R. A., Quanz, M. E., Sankar, K., et al. (2018). Reducing marine pollution from single-use plastics (SUPs): a review. Mar. Pollut. Bull. 137, 157–171. doi: 10.1016/j.marpolbul.2018.10.001
Schubert, P., Steinbüchel, A., and Schlegel, H. G. (1988). Cloning of the Alcaligenes eutrophus genes for synthesis of poly-beta-hydroxybutyric acid (PHB) and synthesis of PHB in Escherichia coli. J. Bacteriol. 170, 5837–5847. doi: 10.1128/jb.170.12.5837-5847.1988
Sheu, D.-S., Chen, W.-M., Lai, Y.-W., and Chang, R.-C. (2012). Mutations derived from the thermophilic polyhydroxyalkanoate synthase PhaC enhance the thermostability and activity of PhaC from Cupriavidus necator H16. J. Bacteriol. 194, 2620–2629. doi: 10.1128/jb.06543-11
Shimamura, E., Scandola, M., and Doi, Y. (1994). Microbial synthesis and characterization of poly (3-hydroxybutyrate-co-3-hydroxypropionate). Macromolecules 27, 4429–4435. doi: 10.1021/ma00094a003
Simonzadeh, N., and Ronsen, B. (2012). An isocratic HPLC method for the determination of sorbitol and glycerol in pharmaceutical formulations. J. Chromatogr. Sci. 50, 644–647. doi: 10.1093/chromsci/bms044
Steensgaard, I. M., Syberg, K., Rist, S., Hartmann, N. B., Boldrin, A., and Hansen, S. F. (2017). From macro-to microplastics-Analysis of EU regulation along the life cycle of plastic bags. Environ. Pollut. 224, 289–299. doi: 10.1016/j.envpol.2017.02.007
Sun, S., Ding, Y., Liu, M., Xian, M., and Zhao, G. (2020). Comparison of glucose, acetate and ethanol as carbon resource for production of poly(3-hydroxybutyrate) and other acetyl-CoA derivatives. Front. Bioeng. Biotechnol. 8:833. doi: 10.3389/fbioe.2020.00833
Taguchi, K., Taguchi, S., Sudesh, K., Maehara, A., Tsuge, T., and Doi, Y. (2005). “Metabolic pathways and engineering of polyhydroxyalkanoate biosynthesis,” in Biopolymers Online (Wiley-VCH Verlag GmbH & Co. KGaA). doi: 10.1002/3527600035.bpol3a07
Thomson, N. M., Saika, A., Ushimaru, K., Sangiambut, S., Tsuge, T., Summers, D. K., et al. (2013). Efficient production of active polyhydroxyalkanoate synthase in Escherichia coli by coexpression of molecular chaperones. Appl. Environ. Microbiol. 79, 1948–1955. doi: 10.1128/aem.02881-12
Tsuge, T. (2016). Fundamental factors determining the molecular weight of polyhydroxyalkanoate during biosynthesis. Polym. J. 48, 1051–1057. doi: 10.1038/pj.2016.78
Volova, T., Gladyshev, M., Trusova, M. Y., and Zhila, N. (2007). Degradation of polyhydroxyalkanoates in eutrophic reservoir. Polym. Degrad. Stab. 92, 580–586. doi: 10.1016/j.polymdegradstab.2007.01.011
Wang, F., and Lee, S. Y. (1997). Production of poly (3-hydroxybutyrate) by fed-batch culture of filamentation-suppressed recombinant Escherichia coli. Appl. Environ. Microbiol. 63, 4765–4769. doi: 10.1128/aem.63.12.4765-4769.1997
Wong, M. S., Wu, S., Causey, T. B., Bennett, G. N., and San, K. Y. (2008). Reduction of acetate accumulation in Escherichia coli cultures for increased recombinant protein production. Metab. Eng. 10, 97–108. doi: 10.1016/j.ymben.2007.10.003
Xanthos, D., and Walker, T. R. (2017). International policies to reduce plastic marine pollution from single-use plastics (plastic bags and microbeads): a review. Mar. Pollut. Bull. 118, 17–26. doi: 10.1016/j.marpolbul.2017.02.048
Yamanaka, K., Fang, L., and Inouye, M. (1998). The CspA family in Escherichia coli: multiple gene duplication for stress adaptation. Mol. Microbiol. 27, 247–255. doi: 10.1046/j.1365-2958.1998.00683.x
Yamane, T. (1993). Yield of poly-D (-)-3-hydroxybutyrate from various carbon sources: a theoretical study. Biotechnol. Bioeng. 41, 165–170. doi: 10.1002/bit.260410122
Yoshie, N., Menju, H., Sato, H., and Inoue, Y. (1995). Complex composition distribution of poly(3-hydroxybutyrate-co-3-hydroxyvalerate). Macromolecules 28, 6516–6521. doi: 10.1021/ma00123a018
Yuan, W., Jia, Y., Tian, J., Snell, K. D., Müh, U., Sinskey, A. J., et al. (2001). Class I and III polyhydroxyalkanoate synthases from Ralstonia eutropha and Allochromatium vinosum: characterization and substrate specificity studies. Arch. Biochem. Biophys. 394, 87–98. doi: 10.1006/abbi.2001.2522
Keywords: polyhydroxybutyrate, pCold, cold shock, Cupriavidus necator, E. coli – Escherichia coli, cspA gene
Citation: Boontip T, Waditee-Sirisattha R, Honda K and Napathorn SC (2021) Strategies for Poly(3-hydroxybutyrate) Production Using a Cold-Shock Promoter in Escherichia coli. Front. Bioeng. Biotechnol. 9:666036. doi: 10.3389/fbioe.2021.666036
Received: 09 February 2021; Accepted: 14 May 2021;
Published: 03 June 2021.
Edited by:
Prasun Kumar, Chungbuk National University, South KoreaCopyright © 2021 Boontip, Waditee-Sirisattha, Honda and Napathorn. This is an open-access article distributed under the terms of the Creative Commons Attribution License (CC BY). The use, distribution or reproduction in other forums is permitted, provided the original author(s) and the copyright owner(s) are credited and that the original publication in this journal is cited, in accordance with accepted academic practice. No use, distribution or reproduction is permitted which does not comply with these terms.
*Correspondence: Suchada Chanprateep Napathorn, c3VjaGFkYS5jaGFAY2h1bGEuYWMudGg=