 Flávio C. F. Baleeiro
 Magda S. Ardila
 Sabine Kleinsteuber
 Heike Sträuber
- 1Department of Environmental Microbiology, Helmholtz Centre for Environmental Research – UFZ, Leipzig, Germany
- 2Institute of Process Engineering in Life Science 2, Technical Biology, Karlsruhe Institute of Technology – KIT, Karlsruhe, Germany
Mixed microbial cultures have become a preferred choice of biocatalyst for chain elongation systems due to their ability to convert complex substrates into medium-chain carboxylates. However, the complexity of the effects of process parameters on the microbial metabolic networks is a drawback that makes the task of optimizing product selectivity challenging. Here, we studied the effects of small air contaminations on the microbial community dynamics and the product formation in anaerobic bioreactors fed with lactate, acetate and H2/CO2. Two stirred tank reactors and two bubble column reactors were operated with H2/CO2 gas recirculation for 139 and 116 days, respectively, at pH 6.0 and 32°C with a hydraulic retention time of 14 days. One reactor of each type had periods with air contamination (between 97 ± 28 and 474 ± 33 mL O2 L−1 d−1, lasting from 4 to 32 days), while the control reactors were kept anoxic. During air contamination, production of n-caproate and CH4 was strongly inhibited, whereas no clear effect on n-butyrate production was observed. In a period with detectable O2 concentrations that went up to 18%, facultative anaerobes of the genus Rummeliibacillus became predominant and only n-butyrate was produced. However, at low air contamination rates and with O2 below the detection level, Coriobacteriia and Actinobacteria gained a competitive advantage over Clostridia and Methanobacteria, and propionate production rates increased to 0.8–1.8 mmol L−1 d−1 depending on the reactor (control reactors 0.1–0.8 mmol L−1 d−1). Moreover, i-butyrate production was observed, but only when Methanobacteria abundances were low and, consequently, H2 availability was high. After air contamination stopped completely, production of n-caproate and CH4 recovered, with n-caproate production rates of 1.4–1.8 mmol L−1 d−1 (control 0.7–2.1 mmol L−1 d−1). The results underline the importance of keeping strictly anaerobic conditions in fermenters when consistent n-caproate production is the goal. Beyond that, micro-aeration should be further tested as a controllable process parameter to shape the reactor microbiome. When odd-chain carboxylates are desired, further studies can develop strategies for their targeted production by applying micro-aerobic conditions.
Introduction
Anaerobic fermentation with mixed microbial communities is an appealing option for the production of medium-chain carboxylates (MCCs) (De Groof et al., 2019). However, the high degree of complexity of mixed communities is an additional obstacle to achieve a stable and feasible bioprocess. Changes in operation parameters favor some microorganisms while negatively affecting others in ways that are hard to predict. Controlled experiments with defined substrates can help to understand the response of microbial networks to disturbances and to develop more robust fermentation processes (Angenent et al., 2016; Andersen et al., 2017; Oleskowicz-Popiel, 2018).
Oxygen from the air can easily enter anaerobic reactors by diffusion due to incomplete tightness or oxic feedstocks, and is considered a disturbance of the anaerobic processes. At first thought, MCC-producing mixed cultures should be protected from O2 at all costs. So far, almost all isolated MCC producers are strict anaerobes (one exception was described by Stamatopoulou et al. (2020)) to which O2 causes damage via direct and indirect ways. O2 gives rise to reactive oxygen species (ROS), such as O2− and H2O2, which are intermediates produced during O2 reduction that severely damage cells if not promptly neutralized (Johnson and Hug, 2019). Even though every cultured microorganism has mechanisms to deal with ROS (Johnson and Hug, 2019), obligate anaerobic bacteria such as Clostridium spp. suffer particularly from O2 due to their high dependence on O2-sensitive enzymes (e.g., ferredoxin-dependent oxidoreductases or [FeFe]-hydrogenases) (Imlay, 2006; Khademian and Imlay, 2020). Most hydrogenases, which also contain Fe-S clusters, are reversibly or irreversibly inhibited by O2 and its activated forms. Exposure to O2 causes some hydrogenases to decompose or to form additional ROS that damage other parts of the cell (Stiebritz and Reiher, 2012).
Oxygen contamination does not necessarily mean a complete failure of the anaerobic process and its effect depends on the contamination rate and on the ability of the anaerobic community to remove the contaminant (Botheju and Bakke, 2011). Facultative anaerobic microorganisms present in mixed cultures can consume traces of oxygen and thus protect strict anaerobes (Nguyen and Khanal, 2018). As an exemplary proof of concept, the facultative anaerobe Parageobacillus thermoglucosidasius has been used for O2 scrubbing before feeding waste gases to acetogenic cultures (Mohr et al., 2019). Additionally, the presence of biofilms, microbial aggregates, and other types of diffusion gradients in reactors can form protective oxygen barriers (Botheju and Bakke, 2011).
Uncontrolled aeration during anaerobic fermentation, e.g., via the supply of oxic substrates, can lead to the presence of strict aerobic microorganisms (Lambrecht et al., 2019). On the other hand, small amounts of oxygen may be desired in anaerobic processes. Micro-aeration, the controlled dosing of small amounts of air or oxygen (loosely defined from 5 to 5,000 mL O2 L−1 d−1), has been mainly used to create different oxidative-reductive regions in digesters to favor biological desulfurization (Krayzelova et al., 2015; Nguyen and Khanal, 2018). Besides, it has been reported that micro-aeration can enhance the hydrolysis step in anaerobic digestion by increasing the production of extracellular enzymes such as proteases, amylases, and cellulases (Girotto et al., 2016). Presence of O2 can also be advantageous in fermentations with acetogens. During batch cultivation of Clostridium ljungdahlii on H2, CO, CO2, and fructose, 8% O2 in the headspace has been found to increase the production of ethanol (Whitham et al., 2015), which is an electron donor for chain elongation.
Although the possibilities with O2 are being explored in many types of anaerobic technologies, no literature can be found about the effects of controlled O2 contamination rates on chain elongation systems. One possible reason is that designing controlled experiments to understand the effects of small oxygen contamination in mixed microbial communities is not trivial. Distribution and monitoring of O2 can be challenging at the low concentrations found in micro-aerated systems (Nguyen and Khanal, 2018). Recently, an anaerobic reactor system with continuous gas recirculation was presented as a way to ensure high gas availability to the microbial community at all times, while keeping the system closed and allowing to track component balances in the gas phase (Baleeiro et al., 2021b).
With the help of gas recirculation systems, this study aimed to investigate the effects of small air contamination on the dynamics of the microbial community and the product formation in MCC-producing fermenters. For this purpose, two stirred tank reactors (STRs) and two bubble column reactors (BCRs) with continuous H2/CO2 recirculation were operated with mixed cultures fed with lactate and acetate. One of the reactors of each type had periods with air contamination, while the other two were kept anoxic.
Materials and Methods
Experimental Design and Reactor Systems
Two pairs of reactors with continuous gas recirculation were assembled for this study. One pair consisted of stirred tank reactors (STR-control and STR-test) and the other of bubble column reactors (BCR-control and BCR-test). Assembly and configuration of the STRs were described in detail by Baleeiro et al. (2021b). BCRs were assembled and operated with the following differences in relation to the STRs: 1) the BCR vessels consisted of bubble columns made of glass with a working volume of 1.2 L each; 2) the systems had no oxidation-reduction potential (ORP) monitoring; 3) pH monitoring and correction was done manually three times a week; 4) temperature regulation was carried out via the water jacket of the vessels and a thermal bath; 5) gas recirculation was carried out with micro-diaphragm gas pumps NMP 830 (KNF Neuberger GmbH, Freiburg, Germany) at a flow of ca. 1.5 L min−1; and 6) an internal vertical hollow glass with holes of 1–2 mm was used to bubble the gas into the broth. In all other aspects, BCRs were operated similarly to STRs. The reactors were operated at 32°C, at pH values of 6.0 ± 0.1 (STRs) and 6.1 ± 0.3 (BCRs), and with a hydraulic retention time (HRT) of 14 days. The basal medium contained 133 mM lactate (12 g L−1) and 200 mM acetate (12 g L−1) as organic carbon sources and the gas reservoirs were periodically refilled with 10 L H2:CO2 (80:20), 240 mL ethylene (methanogenesis inhibitor), and 120 mL He (tracer gas). Basal medium composition, reactor start-up and reactor operation were identical for STRs and BCRs and were as described by Baleeiro et al. (2021b), except that lactate was fed ten times per day along with the basal medium.
Figure 1 shows the two reactor types used in the study and the timelines with the oxygen contamination events. The four reactors were inoculated with the broth harvested from the H2/CO2/ethylene recirculation reactors described by Baleeiro et al. (2021b). For STRs, the broths of the two reactors were mixed before the start of the experiment and before the second comparison period to ensure that both reactors started with identical microbial and chemical compositions for each comparison period. The same was done with the broths of the BCRs. Startup and broth mixing of STR-test and STR-control occurred on operation days 0–27 and the second broth mixture occurred on days 111–115 (Figure 1A). Startup and acclimatization of the community to a BCR occurred during the 86 days preceding the start of this study. Mixing of the BCR-control and BCR-test broths occurred on days 0–4 and 36–39 (Figure 1B). The broths were mixed without opening the reactors using Hei-Flow Precision peristaltic pumps (Heidolph Instruments GmbH, Schwabach, Germany), PVC tubes Tygon® LMT-55, and three-way valves. The major air contamination events were detected in STR-test on days 27–59 and 115–119 and in BCR-test on days 11–36 and 39–50 (Figure 1).
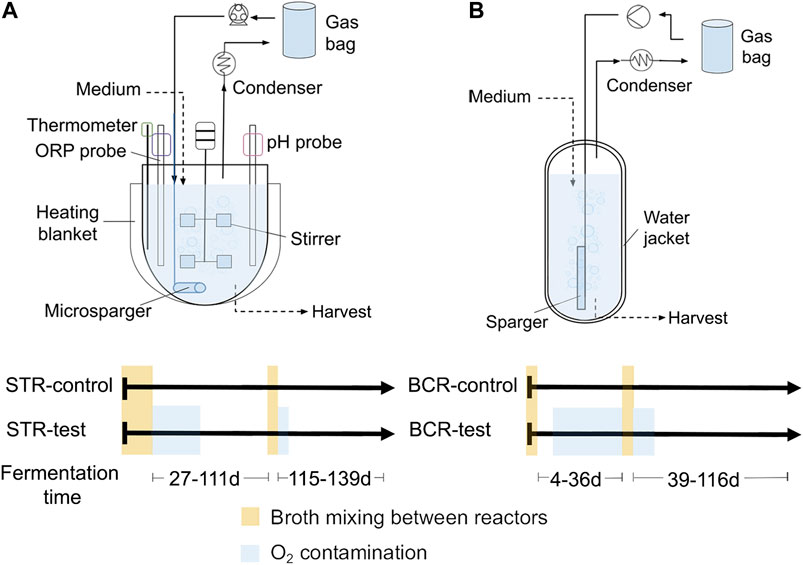
FIGURE 1. Gas recirculation reactors used in the study. Stirred tank reactors (STRs) (A) and bubble column reactors (BCRs) (B) with their respective timelines of events for each reactor.
The reactors that remained air-tight all the time were used as control reactors. Reactors STR-test and BCR-test presented detectable air intrusion at certain periods due to imperfect air-tight conditions. With the help of a H2 leak detector (GLD-100, Coy Laboratory Products, Grass Lake, USA), tightness problems that caused gas to leak out of the reactor systems were located and promptly solved. The same was not true for tightness problems that only allowed air to leak into the system and that were solved by trial and error interventions.
Analytical Methods
High performance liquid chromatography with a refractive index detector (HPLC Prominence-i RID, Shimadzu Europa GmbH, Duisburg, Germany) was operated under the conditions described by Apelt (2020) with adaptations described by Baleeiro et al. (2021a) for monitoring of the following chemicals in the aqueous phase: formate, acetate, ethanol, lactate, propionate, n-propanol, n-butyrate, i-butyrate, n-butanol, n-valerate, i-valerate, n-pentanol, n-caproate, i-caproate, n-hexanol, n-heptanoate, and n-caprylate. Biomass concentration was determined by measuring optical density at 600 nm (spectrophotometer Genesys 10 S, Thermo Scientific Inc., Waltham, United States). Conversion factors for optical density at 600 nm and biomass are described previously (Baleeiro et al., 2021a). In the gas phase, H2, CO2, CH4, He, O2, N2, and ethylene were monitored by gas chromatography as described by Logroño et al. (2020).
Microbial Community Analysis
Microbial communities were analyzed by 16S rRNA gene amplicon sequencing with taxonomic assignments done with the SILVA 138 reference database (Yilmaz et al., 2014). DNA extraction, PCR, and library preparation for Illumina MiSeq sequencing were described previously (Baleeiro et al., 2021a). Trimming, filtering, and denoising of amplicon data as well as visualization of microbiome census data and Spearman correlations were done as described by Baleeiro et al. (2021a). All samples were rarified to an equal depth according to the sample with the lowest read number in the dataset (4,977 counts). Raw sequence data for this study was deposited at the European Nucleotide Archive (ENA) under the study accession number PRJEB44209 (http://www.ebi.ac.uk/ena/data/view/PRJEB44209).
Component Balance and Estimation of O2 Contamination
Assumptions and calculation steps used for the component balances in the gas recirculation reactors were described previously (Baleeiro et al., 2021b). Direct measurements of O2 concentration (such as by using dissolved oxygen probes) are not adequate to monitor micro-aerobic environments (Krayzelova et al., 2015). Therefore, O2 contamination was determined indirectly via the N2 concentration in the recirculating gas, using the N2:O2 ratio in air of 3.73 according to the following equation:
for sampling points 1 and 2: Y is the volumetric fraction of N2 in the gas phase; Vgas is the gas volume of the system in mL; and t is the sampling time in days. Eq. 1 holds true if no N2 is formed or consumed in the reactor, if O2 is below the detection limit, and if the increase in the system’s gas volume due to air leaking in can be neglected. Calculations of contamination rates in the control reactors (STR-control and BCR-control) were used to determine standard errors for the O2 contamination rate (Supplementary Figure S1). ORP measurements did not show a clear relation with O2 contamination rates (Supplementary Figure S2) and were, hence, not used to quantify rates.
Results
The experiments were divided into two periods, each with one air contamination event. STR-test and BCR-test were contaminated with O2 from air for certain periods, while STR-control and BCR-control remained virtually anoxic throughout the study (calculated average contamination rates of 7 ± 33 and 3 ± 28 mL O2 L−1 d−1, respectively) and were adopted as controls for anoxic reactor operation. Before the start of each period, the broths of each reactor pair were mixed so that each pair started with a similar microbial community and broth composition. The broths from the STRs were not mixed with the broths from the BCRs, resulting in communities developing independently for each reactor type.
General Performance of the Gas Recirculation Reactors
The main carboxylates produced were propionate, n-butyrate, i-butyrate, n-valerate, n-caproate, and n-caprylate, with maximum concentrations presented in Table 1. The STRs reached higher n-caproate maxima and were the only ones in which n-caprylate was detected, whereas the BCRs reached higher propionate, n-valerate, and i-butyrate maxima. These differences can also be seen in terms of specific production and consumption rates given in mmol L−1 d−1 in Supplementary Table S1. For all reactors, most of the lactate fed was consumed and differences in its consumption rates were due to washout of unconsumed substrate (Supplementary Table S1). Except for the period when O2 was present in detectable amounts, net consumption of acetate occurred in all reactors, ranging from 1.4 to 4.4 mmol L−1 d−1, which corresponded to a small fraction of the total acetate fed (14.3 mmol L−1 d−1). With the exception of STR-control, where very little i-butyrate was produced, i-butyrate production rates ranged from 0.23 to 1.08 mmol L−1 d−1 and showed no clear relation to O2 contamination (Supplementary Table S1).
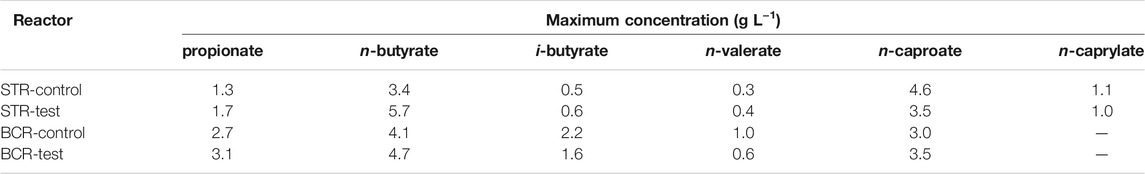
TABLE 1. Maximum concentration of carboxylates achieved in the experiments.
According to previous experience with the H2/CO2 recirculation reactors, ethylene was used to inhibit CH4 production. Even though the partial pressure of ethylene was higher than 1 kPa at all times, methanogens gradually acclimatized to the inhibitor. Methanogenesis was observed first in the reactors that remained anoxic throughout the experimental time: in BCR-control from day 0 and in STR-control from day 31. Later on, methanogenesis was also observed in STR-test from day 48 and in BCR-test from day 60. Methane production rates were similar in the control reactors STR-control and BCR-control (16.5 and 15.9 mmol L−1 d−1, respectively) and the highest rate observed over a sustained period was 19.5 mmol L−1 d−1 during an anoxic operation period between days 59 and 111 of STR-test (Supplementary Table S1).
With 200 mM acetate (12 g L−1) originally present in the growth medium, no net acetate formation was observed and no clear signs of homoacetogenic activity were found. After discounting the H2 used for CH4 formation (assuming 1 mol CH4 produced from 4 mol H2), almost no additional H2 consumption was seen in the control reactors STR-control and BCR-control. STR-control had a net H2 formation of 3.73 mmol L−1 d−1, whereas BCR-control showed a net H2 consumption of 0.50 mmol L−1 d−1 (Supplementary Table S1). In the periods with O2 contamination, H2 consumption rates remained relatively high, despite low methanogenic activity. STR-test showed additional H2 consumption of 26.3 mmol L−1 d−1 between days 27 and 59 and of 64.7 mmol L−1 d−1 between days 115 and 119 (Supplementary Table S1). This consumption of H2 corresponded from 3.0 to 3.4 times the molar consumption of O2 in the same period. In aerated periods in BCR-test, H2 consumption after discounting methane production ranged from 1.1 to 3.6 times the oxygen consumption.
Electron balances encompassing the whole period of fermentation had errors of -0.63% (i.e., 0.63% of the monitored pool of electron equivalents had unexplained consumption) for STR-test, −0.73% for STR-control, −0.93% for BCR-control, and −1.61% for BCR-test.
Effect of O2 on the Fermentation in the Stirred Tank Reactor
Figure 2 shows the profiles of the cumulated amounts of carboxylates and O2 as well as the microbial community composition at class level for the first period comparing the STRs. Between days 27 and 59, O2 concentration in the gas phase remained below the detection limit in STR-test (Supplementary Figure S3), although a contamination rate of 220 ± 33 mL O2 L−1 d−1 was detected. Between days 59 and 111, STR-test had an anoxic operation period although small O2 contaminations occurred between days 104 and 111 (Figure 2) and were the reason why the reactor could not reach perfectly anoxic conditions (21 ± 33 mL O2 L−1 d−1).
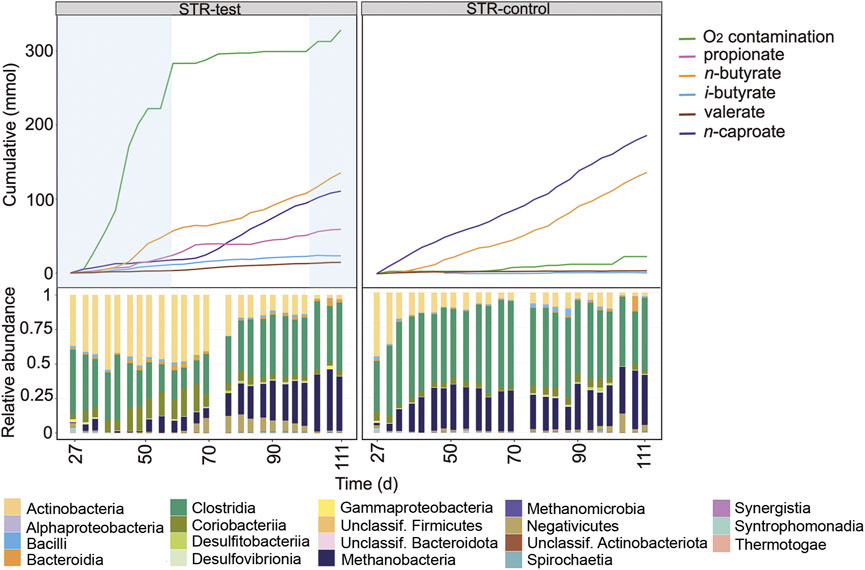
FIGURE 2. Profiles of the cumulated amounts of carboxylates and O2, as well as community composition at class level between days 27 and 111 for STR-test and STR-control. Blue shading indicates the O2 contamination period.
Even though n-butyrate and n-caproate were the main carboxylates produced in both reactors, n-caproate production in STR-test was, with 0.56 mmol L−1 d−1, 72% lower than in STR-control (2.12 mmol L−1 d−1) during the contamination period (days 27–59, Figure 2). Under O2 stress, STR-test produced more propionate (0.76 mmol L−1 d−1, 6.4 times that of the control) but n-butyrate production was similar in both reactors. Moreover, O2 contamination in STR-test caused 63% less methane production (6.05 of 16.5 mmol L−1 d−1) and 38% less acetate consumption (1.80 of 2.91 mmol L−1 d−1, Supplementary Table S1). After anoxic conditions in STR-test had been restored (days 59–111), methane production was 18% higher than in the control reactor (19.5 of 16.5 mmol L−1 d−1) and propionate production decreased slightly to 0.67 mmol L−1 d−1. Under anoxic conditions in STR-test, propionate production slowed down from day 66 on, coinciding with an acceleration of n-caproate production (Figure 2), which was still 16% lower than in the control (1.78 of 2.12 mmol L−1 d−1).
O2 contamination caused differences in microbial community composition that were visible up to the class level (Figure 2). Clostridia and Methanobacteria predominated in the reactor that remained completely anoxic. In the other reactor, Actinobacteria and Coriobacteriia were the main classes found in periods when O2 contamination occurred. The community of STR-test converged to a composition similar to that of the control reactor after anoxic conditions had been restored.
For the same operation period, community composition with resolution to the genus level and concentrations of the main carboxylates are shown in Supplementary Figure S4. Clostridia were mainly represented by the genera Caproiciproducens, Clostridium sensu stricto 12, and Oscillibacter, while the Actinobacteria belonged to the genera Acidipropionibacterium and Actinomyces. Methanogens were from the genus Methanobrevibacter and the Coriobacteriia were from the family Eggerthellaceae.
A second O2 contamination event occurred in STR-test between days 115 and 119 (Figure 3), this time for a shorter period but at double rate (471 ± 33 mL O2 L−1 d−1) (Supplementary Table S1). With the new contamination event in STR-test, CH4 and n-caproate production rates fell to 32% (5.33 of 16.5 mmol L−1 d−1) and 50% (1.06 of 2.12 mmol L−1 d−1) of those of the control reactor, respectively (Supplementary Table S1). This time, the O2 contamination coincided with an increase in n-butyrate formation rate from 1.51 to 2.76 mmol L−1 d−1, and instead of increasing propionate production, n-valerate production reached four times that of the control reactor (0.29 in relation to 0.07 mmol L−1 d−1). The short period of intense O2 contamination had a smaller impact on the microbial community composition and coincided with an increase in relative abundance of Prevotella belonging to the Bacteroidia (Supplementary Figure S5). In the last 20 days of operation of STR-test, O2 contamination was reduced but not completely stopped (39 ± 33 mL O2 L−1 d−1, Supplementary Table S1) as shown between days 125 and 128 (Figure 3). In this period, propionate production decreased to its lowest value in STR-test and n-butyrate production increased once more to 4.77 mmol L−1 d−1. Although CH4 formation increased again to the level observed during anoxic operation, n-caproate production could not be restored (Figure 3).
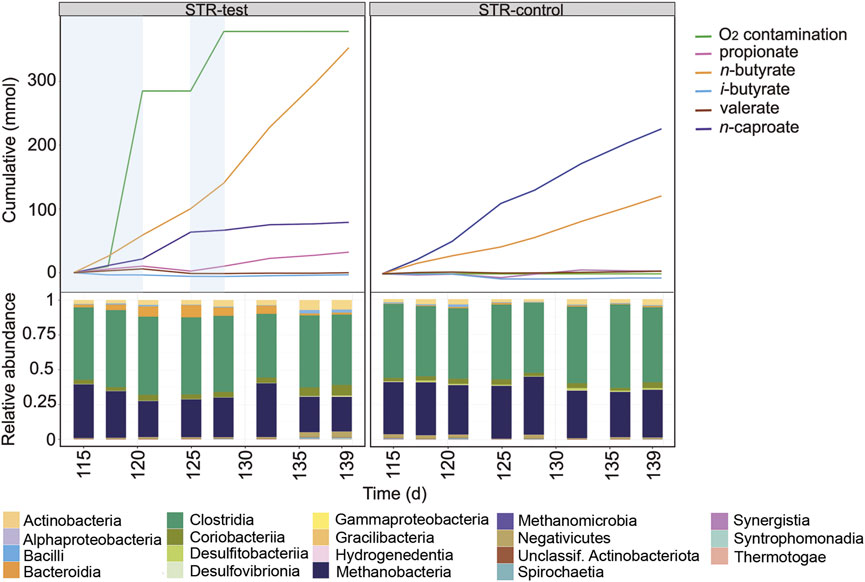
FIGURE 3. Profiles of the cumulated amounts of carboxylates and O2, as well as community composition at class level between days 115 and 139 for STR-test and STR-control. Blue shading indicates the O2 contamination period.
Effect of O2 on the Fermentation in the Bubble Column Reactor
The earlier operation phase of the BCRs is shown in Figure 4 and in Supplementary Figure S6. For this comparison period, the mixing of broths was not enough to ensure equal community compositions in BCR-test and BCR-control. The O2 contamination period between days 11 and 36 in BCR-test differed from the other contamination events since O2 concentrations up to 18% were detected in the gas phase between days 11 and 28 (Supplementary Figure S3). Considering that the assumptions for balance calculations in the reactors do not account for high O2 concentrations, the O2 contamination rate determined for this period (97 ± 28 mL O2 L−1 d−1) might be inaccurate. When O2 was detected in the system, the microbial community in the BCR-test showed a strong dominance of Rummeliibacillus (Supplementary Figure S6) accompanied by Actinobacteria and Gammaproteobacteria (Figure 4).
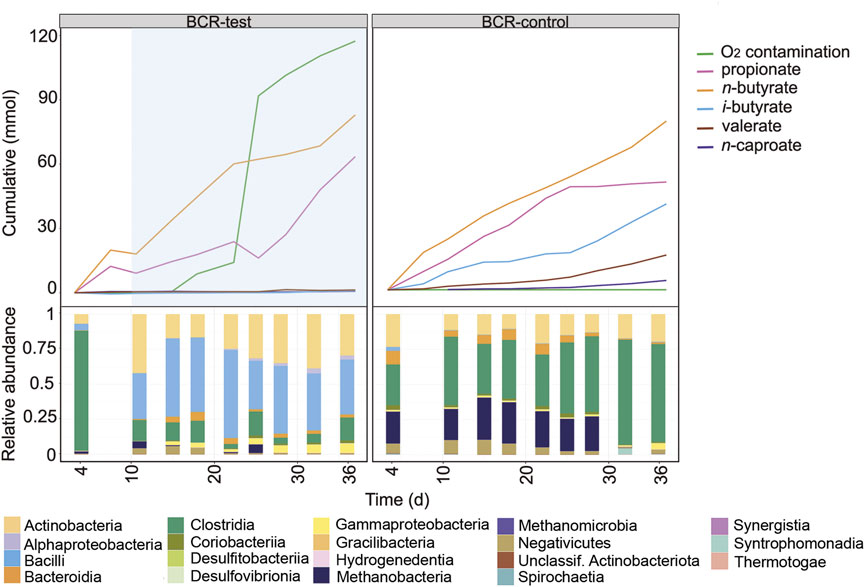
FIGURE 4. Profiles of the cumulated amounts of carboxylates and O2, as well as community composition at class level between days 4 and 36 for BCR-test and BCR-control. Blue shading indicates the O2 contamination period. Between days 11 and 28, O2 concentrations in the gas phase were detected up to 18% in BCR-test, hence, determination of O2 consumption in this time period might not be accurate.
After mixing the broths of the bubble columns to start a new comparison period, BCR-test received 129 ± 28 mL O2 L−1 d−1 between days 39 and 50 whereas BCR-control remained completely anoxic (Figure 5). During the contamination period, BCR-test produced virtually no n-caproate (0.03 mmol L−1 d−1 in comparison to 0.92 mmol L−1 d−1 in control) and propionate was produced instead (1.78 mmol L−1 d−1, 2.8 times that of the control). With O2 contamination, BCR-test produced 46% less n-butyrate (1.22 of 2.25 mmol L−1 d−1) and 91% less methane (1.41 of 15.9 mmol L−1 d−1) than the control (Supplementary Table S1). After O2 contamination stopped in BCR-test (from day 50 on), n-caproate production recovered with a rate of 1.40 mmol L−1 d−1 while propionate formation decreased to 0.34 mmol L−1 d−1. n-Butyrate and methane production recovered partially and remained 18% (1.84 of 2.25 mmol L−1 d−1) and 25% (11.9 of 15.9 mmol L−1 d−1) lower than that of the control, respectively.
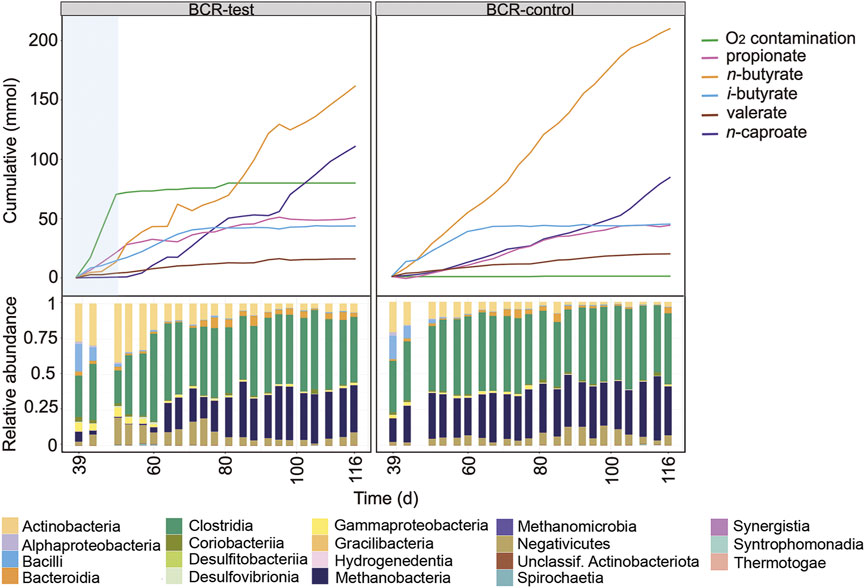
FIGURE 5. Profiles of the cumulated amounts of carboxylates and O2, as well as community composition at class level between days 39 and 116 for BCR-test and BCR-control. Blue shading indicates the O2 contamination period.
Similarly to what was seen in the STRs, Actinobacteria increased their relative abundances at the cost of Clostridia and Methanobacteria during the O2 contamination period in BCR-test (Figure 5). In addition, Gammaproteobacteria also became more abundant during the contamination. Visualization of the community development at genus level in Supplementary Figure S7 reveals that the main genera of Actinobacteria were the same as those found in the STRs (i.e., Acidipropionibacterium and Actinomyces). Besides the Clostridia genera that dominated in the STRs, a transient presence of Eubacterium was also observed in the BCRs. Gammaproteobacteria were represented by Sutterella and Burkholderia (Supplementary Figure S7).
Correlations between Community Members and Abiotic Parameters
Figure 6 shows Spearman correlations between the most abundant genera, O2 contamination, and the formation or consumption rates of the main chemicals. In Supplementary Table S2, the correlation coefficients and their p-values are listed. Positive correlations of n-caproate formation and relative abundances of Caproiciproducens, unclassified Peptostreptococcales, and Methanobrevibacter were found, whereas Clostridium sensu stricto 12, unclassified Micrococcales, Acidipropionibacterium, Burkholderia, Rummeliibacillus, Dialister, and Sutterella correlated negatively. Propionate production correlated positively to abundances of Acidipropionibacterium, Burkholderia, and Proteiniphilum. O2 contamination correlated negatively with Methanobrevibacter, whereas positive correlations were found with abundances of unclassified Eggerthellaceae, unclassified Actinomycetaceae, Actinomyces, and Proteiniphilum. Abundances of Clostridium sensu stricto 12, Acidipropionibacterium, Acidaminococcus, and Dialister correlated positively with i-butyrate and n-valerate production. H2 consumption after discounting methane production (i.e. non-CH4 H2 consumption) correlated positively with Acidipropionibacterium, Actinomyces, and unclassified Micrococcales. i-Butyrate production correlated negatively with relative abundances of Methanobrevibacter, Caproiciproducens, and unclassified Peptostreptococcales.
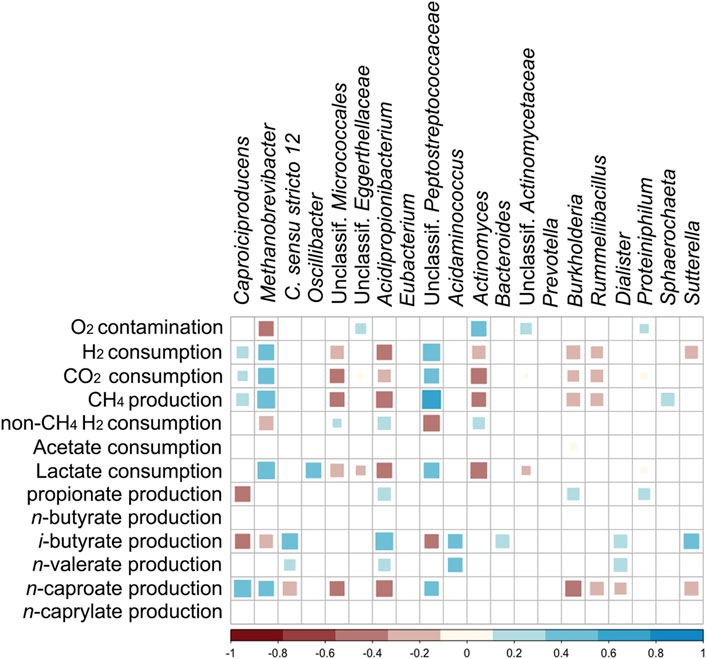
FIGURE 6. Spearman correlation matrix between the most abundant genera, O2 contamination rate, and production/consumption rates of chemicals (p < 0.01). “non-CH4 H2 consumption” stands for H2 consumption after discounting methane formation.
Among the most abundant amplicon sequence variants (ASVs), Clostridium sensu stricto 12 and Acidipropionibacterium had ASVs that were identical to isolated species in the Silva 138 database. Within the genus Clostridium sensu stricto 12, ASVs were assigned to C. luticellarii, C. tyrobutyricum, or C. ljungdahlii (the latter was also ambiguously assigned to C. autoethanogenum, C. ragsdalei, and C. coskatii). ASVs within Acidipropionibacterium were assigned to A. acidipropionici.
Discussion
Regardless of O2 contamination, the BCRs had higher concentrations of propionate, i-butyrate, and n-valerate, whereas the stirred tank design facilitated higher concentrations of n-butyrate, n-caproate, and n-caprylate (Table 1). The production of n-valerate and i-butyrate was not clearly related to O2 contamination (Figures 2, 5 and Supplementary Table S1), but its connection to Clostridium sensu stricto 12 (Figure 6), specifically C. luticellarii, was observed previously (de Smit et al., 2019; de Leeuw et al., 2020; Huang et al., 2020; Baleeiro et al., 2021a). C. luticellarii was shown to be important for n-valerate production from propionate (de Smit et al., 2019) and could therefore play an important role in the production of odd-chain MCC in chain elongation reactors. n-Valerate and i-butyrate production also correlated with other genera that are not commonly known for the production of these compounds (Figure 6). Higher relative abundances of Caproiciproducens not only correlated significantly with n-caproate production (Figure 6) but were visually related to higher concentrations of n-caproate (Supplementary Figures S4, S7). The correlation of n-caproate production with the abundance of Caproiciproducens is not surprising, since this genus has been commonly found in other MCC-producing communities (Duber et al., 2020; Joshi et al., 2021).
Micro-aerobic conditions favored the classes Actinobacteria, Gammaproteobacteria, Bacilli, and Coriobacteriia over Clostridia and Methanobacteria. Notably, a similar pattern is known for gut microbiota, where Actinobacteria and Alpha- or Gammaproteobacteria have been observed to dominate over Clostridia in regions of the gut more exposed to O2 (Friedman et al., 2018). One explanation is that the evolutionary younger taxa of aerotolerant Actinobacteria (e.g., propionibacteria) and Proteobacteria (Martin and Sousa, 2015) are generally better equipped with enzymes that mitigate the toxicity of ROS (e.g., catalases, H2O2 reductases, and superoxide dismutases) than typical strict anaerobes such as Clostridia (Kato et al., 1997; Johnson and Hug, 2019).
Partial Acclimatization of Methanogens to Ethylene
Hydrogenotrophic methanogenesis was likely the main pathway for CH4 production. This is supported by the results of previous experiments where Methanobrevibacter was one of the predominating community members under similar conditions with H2/CO2 (Baleeiro et al., 2021a). Notably, methanogens partially overcame the inhibition by ethylene. The acclimatization occurred after 42 days of successful inhibition reported by Baleeiro et al. (2021b). To the best of our knowledge, such acclimatization has not been reported before. With ethylene, CH4 production was relatively strong (up to 19.5 mmol L−1 d−1) but still about one third lower than the rates observed in the absence of the inhibitor in a similar gas recirculation system (up to 32.8 mmol L−1 d−1) (Baleeiro et al., 2021b). We hypothesize that Methanobrevibacter, the main methanogenic genus found in our reactors, may have acclimatized to ethylene by expressing [Fe]-hydrogenases. For hydrogenotrophic methanogens, [Fe]-hydrogenases have less favorable kinetics than [NiFe]-hydrogenases. Still, some methanogens, including Methanobacteria, can express [Fe]-hydrogenases to grow under nickel-limiting conditions (Thauer et al., 2010). As postulated by Baleeiro et al. (2021b), ethylene might not exert an inhibitory effect on nickel-free hydrogenases as it does on [NiFe]-hydrogenases of methanogens. Considering that [Fe]-hydrogenases are not inhibited by O2 (Thauer et al., 2010; Stiebritz and Reiher, 2012), micro-aerobic conditions and broth mixing between reactors could have caused further selection of methanogens expressing [Fe]-hydrogenases even if nickel was not limiting. Further studies using transcriptome or proteome analyses of pure methanogenic cultures are needed to test this hypothesis.
Steering the Fermentation with Small O2 Contamination
When the O2 concentration in the gas phase increased up to 18% between days 11 and 28, the aerobic genus Rummeliibacillus (Vaishampayan et al., 2009; Her and Kim, 2013) flourished in the bubble column reactor and the concentrations of n-butyrate and propionate decreased (Supplementary Figure S6). With an O2 concentration below the detection limit by day 28 (Supplementary Figure S3), Actinobacteria abundance increased and propionate production reached its highest rates (Supplementary Table S1).
Methanogenesis and n-caproate production were strongly inhibited by O2 intrusion. After the contamination stopped, CH4 production recovered on every occasion but n-caproate production did not (Supplementary Table S1), indicating that the O2 contamination had particularly strong detrimental effects on C4-to-C6 chain elongation. In the period between days 119 and 139 in STR-test, n-caproate production did not increase after O2 contamination rate changed from 474 ± 33 mL O2 L−1 d−1 to 39 ± 33 mL O2 L−1 d−1, instead, the highest rates of n-butyrate production and acetate consumption were achieved. This was observed even with high relative abundances of Caproiciproducens in the community (Supplementary Figure S5).
Relatively low O2 contamination rates were found to favor propionate formation in lactate-based fermentation. However, the relationship between O2 and propionate accumulation was not as straightforward as the inhibitory effect of O2 on chain elongation and methanogenesis. One possible reason is that propionate is not only a product of lactate fermentation, but also a substrate for n-valerate production by chain-elongating bacteria (Angenent et al., 2016). This could explain what was observed in the micro-aerobic period between days 115 and 119 in the STR-test, when propionate production did not increase but n-valerate production was relatively high (Supplementary Table S1).
Key Players that can Profit from O2 Intrusion
Among the microorganisms enriched in the O2 contamination periods, Acidipropionibacterium correlated to propionate production (p < 0.01). Other Actinobacteria enriched during O2 contamination did not correlate with propionate production and may have diverted electrons from lactate to products other than propionate, which could be another reason why STR-test showed lower propionate production rates (Supplementary Table S1). Actinomyces, a facultative anaerobe (Rao et al., 2012), was particularly enriched in STR-test during an O2 contamination period (Supplementary Figure S4). Actinomyces can grow anaerobically or aerobically on lactate and produces acetate, formate, and CO2 during fermentative growth (Takahashi et al., 1994; Takahashi and Yamada, 1999; Rao et al., 2012). In agreement with the reported aerobic growth of Actinomyces naeslundii on lactate (Takahashi and Yamada, 1999), Actinomyces was likely not responsible for propionate production in the STR. The Coriobacteriia (Eggerthellaceae) observed in O2 contamination periods belong to a family of strict anaerobes that are not reported to produce propionate (Gupta et al., 2013). Proteiniphilum (as well as Dialister) are genera with microaerophilic species that produce propionate, although it is not clear if from lactate (Tomazetto et al., 2018; Sakamoto et al., 2020). In our study, the abundance of Proteiniphilum correlated to O2 contamination and to propionate formation whereas no significant correlation was found between Dialister, propionate, and O2 contamination (Figure 6).
Fermentation of lactate by propionate producing bacteria commonly leads to a 2:1:1 stoichiometry of propionate to acetate to CO2 (Eq. 2). Gammaproteobacteria and Actinobacteria species that produce propionate are known to use methylmalonyl-CoA pathways rather than the acrylate pathway (Seeliger et al., 2002; Gonzalez-Garcia et al., 2017). In particular, Acidipropionibacterium spp. are among the most efficient propionate producers thanks to the highest energy efficiency of their methylmalonyl-CoA pathway (also known as Wood-Werkman cycle, a succinate pathway involving methylmalonyl-CoA:pyruvate transcarboxylase) (Scholz and Kilian, 2016; Gonzalez-Garcia et al., 2017).
Even though it can express O2-sensitive enzymes for fermentative growth similar to those in Clostridium, Acidipropionibacterium also has aerotolerant enzymes with similar functions (Piwowarek et al., 2018; McCubbin et al., 2020). Members of this genus are not only more tolerant to O2 than clostridia, they have also been found to increase propionate and energy yields when exposed to O2 (McCubbin et al., 2020).
It should be taken into account that propionibacteria, unlike many clostridia, do not form endospores (Gonzalez-Garcia et al., 2017). Hence, if exploration of propionate production is desired, shock treatments of the inoculum (e.g., with pH or heat), common techniques for starting non-methanogenic anaerobic bioprocesses (Baleeiro et al., 2019), should be avoided.
The phenomenon that lactate is diverted to propionate in chain elongation reactors under micro-aerobic conditions may have been overlooked in former studies. In one notable case, Kucek et al. (2016) observed the competitive production of propionate in a lactate-based chain elongation reactor. Although the possibility of O2 contamination was not discussed, the study detected high abundances of Acinetobacter, strictly aerobic Gammaproteobacteria (Smet et al., 2014) commonly found in micro-aerated reactors (Krayzelova et al., 2015). To explain the propionate production observed in certain time periods, Kucek et al. (2016) suggested the residual concentration of lactate in the reactor to be a determining factor. Although not discussed in the study, O2 presence could have played a role in propionate production.
Possible Roles of H2 during O2 Contamination
A common way for the reduction of O2 in the presence of H2 is shown in Eq. 3 and is realized even by obligate anaerobes such as methanogens (Thauer et al., 2010), Negativicutes (Boga et al., 2007), and sulfate reducers (Dannenberg et al., 1992; Chen et al., 1993).
H2 consumption that was not attributed to methane formation was particularly high during O2 contamination periods. In STR-test, it ranged from 3.0 to 3.4 fold molar O2 consumption, while in BCR-test it ranged from 1.1 to 3.6 fold. Considering the 2:1 ratio of H2 to O2 during H2 oxidation (Eq. 3), H2 consumption not linked to methane formation in this study may have been related to other reactions during O2 intrusion. Interestingly, similar consumption ratios of H2 to O2 (between 3.2 and 3.4) have been observed in communities dominated by hydrogen-oxidizing bacteria during autotrophic growth (Matassa et al., 2016). Nevertheless, we did not observe the presence of Sulfuricurvum (the genus enriched by Matassa et al. (2016)) and Burkholderia, a possible aerobic autotroph (Takors et al., 2018) found in our study, did not correlate positively with H2 consumption nor with O2 contamination. Besides, if aerobic hydrogen-oxidizing bacteria played a major role in the micro-aerobic reactors in our study, signs of biomass formation and carbon source (e.g., CO2) consumption should have accompanied H2 oxidation with O2. However, no clear relation between O2 contamination, biomass formation, and CO2 consumption rates was found.
Communities enriched with propionate-producing bacteria in anaerobic reactors, such as Acidipropionibacterium spp., often correlate with high H2 consumption or low H2 production (Cabrol et al., 2017). In the presence of exogenous H2, some propionate producers such as Propionispira arboris are able to perform homopropionate fermentation of lactate (Eq. 4) producing neither CO2 nor acetate (Thompson et al., 1984).
We did not observe Propionispira spp. in our reactors and its closest relative found in our system (Dialister) is only related at the order level (Veillonellales-Selenomonadales). Besides, Eq.4 alone cannot explain the high H2 consumption during most of the micro-aerobic periods in this study. H2 consumption not linked to methane was much higher than propionate formation. In fact, the period between days 39 and 50 of BCR-test had the lowest H2 to O2 consumption ratio and was the period with the highest propionate productivity (Supplementary Table S1). Lastly, it is not clear if the correlation found between abundance of Acidipropionibacterium and H2 consumption not linked to methane (Figure 6) is a direct one. H2 consumption by isolated members of Propionibacterium is not observed during fermentative growth (Seeliger et al., 2002).
Homoacetogens consume H2 and CO2 (Eq. 5) and, among them, at least C. ljungdahlii was shown to have some resistance against O2 exposure (Whitham et al., 2015). Here, similar clostridia were detected in the reactors and Clostridium sensu stricto 12 was still present during some O2 contamination events (Supplementary Figures S3, S7). Therefore, homoacetogenic activity could be considered to explain H2 consumption during O2 contamination. Nevertheless, no further evidence for this hypothesis was found. H2 consumption was not accompanied by net CO2 consumption and the net acetate production was unfavorable because acetate was fed in excess with the growth medium (12 g L−1 acetate) to favor chain elongation as an acetate-consuming reaction.
Another way that H2 presence might have influenced the micro-aerated community is by amplifying the effects of O2 contamination. The activation of O2 into ROS by hydrogenases and reduced electron carriers might be accentuated by H2 recirculation (Misra and Fridovich, 1971; Krab et al., 1982). Since we did not have a control reactor for the presence of H2, we could not test this hypothesis.
Conclusion
Even small O2 contaminations were very detrimental to n-caproate and methane formation, but favored propionate formation. The relation of O2 contamination and propionate formation was not straightforward: reactors with micro-aerobic conditions produced more propionate overall, but propionate production cycles were not always synchronous to O2 contamination. Besides, the negative effects of O2 on methane formation could be reversed in all cases whereas chain elongation could not always be resumed when O2 contamination stopped. These patterns were observed in both stirred tank and in bubble column reactors, with the bubble column process being more sensitive to O2 contamination.
It is unclear whether the effects of O2 reported in this study could be reproduced without the recirculation of H2. It is possible that the H2 recirculation amplified the effects of O2 toxicity, since presence of H2 can favor ROS formation by hydrogenases. Considering that H2 consumption was particularly high during micro-aeration, H2 may have acted as an important energy source for aerotolerant and aerobic microorganisms. Controlled O2 contamination studies with co-cultures or mixed communities of lower complexity can shed light on how impactful H2 recirculation during micro-aeration is.
Aerotolerant fermenting bacteria such as Acidipropionibacterium spp. are efficient propionate producers that could be regarded as welcomed guests rather than competitors. Here, they were the main candidates responsible for propionate production although their correlation with O2 contamination was unclear. Instead, Actinomyces spp. (Actinobacteria that did not produce propionate) profited most from the micro-aerobic environment. Future experiments could help clarify if stable propionate-producing communities can be selected by micro-aeration. If micro-aeration facilitates propionate accumulation, a sequential anaerobic step can be used for chain elongation with high selectivity to odd-numbered MCC. Studies with defined cultures aiming to understand what is behind the recovery of chain elongation activity after micro-aerobic periods are also recommended.
Data Availability Statement
The datasets generated for this study can be found in the European Nucleotide Archive (ENA) under accession number PRJEB44209 (http://www.ebi.ac.uk/ena/data/view/PRJEB44209).
Author Contributions
Conceptualization: FB and HS; methodology: FB; investigation: FB and MA; formal analysis, data curation, and visualization: FB and MA; writing (original draft preparation): FB and MA; writing (review and editing): FB, MA, SK, and HS; supervision: SK and HS; project administration: SK and HS. All authors have read and agreed to the published version of the manuscript.
Funding
This study was funded by the Helmholtz Association, Research Program Renewable Energies. Financial support was also received from the CAPES–Brazilian Federal Agency for Support and Evaluation of Graduate Education within the Ministry of Education of Brazil (No. 88887.163504/2018–00) and from the BMBF - German Federal Ministry of Education and Research (No. 01DQ17016).
Conflict of Interest
The authors declare that the research was conducted in the absence of any commercial or financial relationships that could be construed as a potential conflict of interest.
Publisher’s Note
All claims expressed in this article are solely those of the authors and do not necessarily represent those of their affiliated organizations, or those of the publisher, the editors and the reviewers. Any product that may be evaluated in this article, or claim that may be made by its manufacturer, is not guaranteed or endorsed by the publisher.
Acknowledgments
We thank Ute Lohse for technical assistance in library preparation for MiSeq amplicon sequencing and the DBFZ Department Biorefineries is acknowledged for providing the stirred tank reactors.
Supplementary Material
The Supplementary Material for this article can be found online at: https://www.frontiersin.org/articles/10.3389/fbioe.2021.725443/full#supplementary-material
References
Andersen, S. J., De Groof, V., Khor, W. C., Roume, H., Props, R., Coma, M., et al. (2017). A Clostridium Group IV Species Dominates and Suppresses a Mixed Culture Fermentation by Tolerance to Medium Chain Fatty Acids Products. Front. Bioeng. Biotechnol. 5, 8. doi:10.3389/fbioe.2017.00008
Angenent, L. T., Richter, H., Buckel, W., Spirito, C. M., Steinbusch, K. J. J., Plugge, C. M., et al. (2016). Chain Elongation with Reactor Microbiomes: Open-Culture Biotechnology to Produce Biochemicals. Environ. Sci. Technol. 50 (6), 2796–2810. doi:10.1021/acs.est.5b04847
Apelt, M. (2020). “Examination of Samples of Solids (Substrates) and Digestates with HPLC for Aliphatic and Aromatic Acids, Alcohols and Aldehydes,” in Series "Biomass Energy Use": Collection of Methods for Biogas: Methods to Determine Parameters for Analysis Purposes and Parameters that Describe Processes in the Biogas Sector. Editors J. Liebetrau, D. Pfeiffer, and D. Thrän. 2nd ed (Leipzig: DBFZ).
Baleeiro, F. C. F., Kleinsteuber, S., Neumann, A., and Sträuber, H. (2019). Syngas-aided Anaerobic Fermentation for Medium-Chain Carboxylate and Alcohol Production: the Case for Microbial Communities. Appl. Microbiol. Biotechnol. 103 (21-22), 8689–8709. doi:10.1007/s00253-019-10086-9
Baleeiro, F. C. F., Kleinsteuber, S., and Sträuber, H. (2021a). Hydrogen as a Co-electron Donor for Chain Elongation with Complex Communities. Front. Bioeng. Biotechnol. 9, 650631. doi:10.3389/fbioe.2021.650631
Baleeiro, F. C. F., Kleinsteuber, S., and Sträuber, H. (2021b). Recirculation of H2, CO2, and Ethylene Improves Carbon Fixation and Carboxylate Yields in Anaerobic Fermentation. bioRxiv. 2006.2011.448067. doi:10.1101/2021.06.11.448067
Boga, H. I., Ji, R., Ludwig, W., and Brune, A. (2006). Sporotalea propionica gen. nov. and sp. nov., a Hydrogen-Oxidizing, Oxygen-Reducing, Propionigenic Firmicute from the Intestinal Tract of a Soil-Feeding Termite. Arch. Microbiol. 187 (1), 15–27. doi:10.1007/s00203-006-0168-7
Botheju, D., and Bakke, R. (2011). Oxygen Effects in Anaerobic Digestion - A Review. Towmj 4 (4), 1–19. doi:10.2174/1876400201104010001
Cabrol, L., Marone, A., Tapia-Venegas, E., Steyer, J.-P., Ruiz-Filippi, G., and Trably, E. (2017). Microbial Ecology of Fermentative Hydrogen Producing Bioprocesses: Useful Insights for Driving the Ecosystem Function. FEMS Microbiol. Rev. 41 (2), 158–181. doi:10.1093/femsre/fuw043
Chen, L., Liu, M. Y., Legall, J., Fareleira, P., Santos, H., and Xavier, A. V. (1993). Rubredoxin Oxidase, a New Flavo-Hemo-Protein, Is the Site of Oxygen Reduction to Water by the "Strict Anaerobe" Desulfovibrio gigas. Biochem. Biophysical Res. Commun. 193 (1), 100–105. doi:10.1006/bbrc.1993.1595
Dannenberg, S., Kroder, M., Dilling, W., and Cypionka, H. (1992). Oxidation of H2, Organic Compounds and Inorganic Sulfur Compounds Coupled to Reduction of O2 or Nitrate by Sulfate-Reducing Bacteria. Arch. Microbiol. 158 (2), 93–99. doi:10.1007/BF00245211
De Groof, V., Coma, M., Arnot, T., Leak, D. J., and Lanham, A. B. (2019). Medium Chain Carboxylic Acids from Complex Organic Feedstocks by Mixed Culture Fermentation. Molecules 24 (3), 398. doi:10.3390/molecules24030398
de Leeuw, K. D., de Smit, S. M., van Oossanen, S., Moerland, M. J., Buisman, C. J. N., and Strik, D. P. B. T. B. (2020). Methanol-Based Chain Elongation with Acetate to n-Butyrate and Isobutyrate at Varying Selectivities Dependent on pH. ACS Sustain. Chem. Eng. 8 (22), 8184–8194. doi:10.1021/acssuschemeng.0c00907
de Smit, S. M., de Leeuw, K. D., Buisman, C. J. N., and Strik, D. P. B. T. B. (2019). Continuous n-Valerate Formation from Propionate and Methanol in an Anaerobic Chain Elongation Open-Culture Bioreactor. Biotechnol. Biofuels 12, 132. doi:10.1186/s13068-019-1468-x
Duber, A., Zagrodnik, R., Chwialkowska, J., Juzwa, W., and Oleskowicz-Popiel, P. (2020). Evaluation of the Feed Composition for an Effective Medium Chain Carboxylic Acid Production in an Open Culture Fermentation. Sci. Total Environ. 728, 138814. doi:10.1016/j.scitotenv.2020.138814
Friedman, E. S., Bittinger, K., Esipova, T. V., Hou, L., Chau, L., Jiang, J., et al. (2018). Microbes vs. Chemistry in the Origin of the Anaerobic Gut Lumen. Proc. Natl. Acad. Sci. USA 115 (16), 4170–4175. doi:10.1073/pnas.1718635115
Girotto, F., Peng, W., Rafieenia, R., and Cossu, R. (2016). Effect of Aeration Applied during Different Phases of Anaerobic Digestion. Waste Biomass Valor. 9 (2), 161–174. doi:10.1007/s12649-016-9785-9
Gonzalez-Garcia, R., McCubbin, T., Navone, L., Stowers, C., Nielsen, L., and Marcellin, E. (2017). Microbial Propionic Acid Production. Fermentation 3 (2), 21. doi:10.3390/fermentation3020021
Gupta, R. S., Chen, W. J., Adeolu, M., and Chai, Y. (2013). Molecular Signatures for the Class Coriobacteriia and its Different Clades; Proposal for Division of the Class Coriobacteriia into the Emended Order Coriobacteriales Containing the Emended Family Coriobacteriaceae and Atopobiaceae fam. nov., and Eggerthellales ord. nov., Containing the Family Eggerthellaceae fam. nov. Int. J. Syst. Evol. Microbiol. 63 (Pt 9), 3379–3397. doi:10.1099/ijs.0.048371-0
Her, J., and Kim, J. (2013). Rummeliibacillus suwonensis sp. nov., Isolated from Soil Collected in a Mountain Area of South Korea. J. Microbiol. 51 (2), 268–272. doi:10.1007/s12275-013-3126-5
Huang, S., Kleerebezem, R., Rabaey, K., and Ganigué, R. (2020). Open Microbiome Dominated by Clostridium and Eubacterium Converts Methanol into i-Butyrate and n-Butyrate. Appl. Microbiol. Biotechnol. 104 (11), 5119–5131. doi:10.1007/s00253-020-10551-w
Imlay, J. A. (2006). Iron-sulphur Clusters and the Problem with Oxygen. Mol. Microbiol. 59 (4), 1073–1082. doi:10.1111/j.1365-2958.2006.05028.x
Johnson, L. A., and Hug, L. A. (2019). Distribution of Reactive Oxygen Species Defense Mechanisms across Domain Bacteria. Free Radic. Biol. Med. 140, 93–102. doi:10.1016/j.freeradbiomed.2019.03.032
Joshi, S., Robles, A., Aguiar, S., and Delgado, A. G. (2021). The Occurrence and Ecology of Microbial Chain Elongation of Carboxylates in Soils. ISME J. 15, 1907–1918. doi:10.1038/s41396-021-00893-2
Kato, M. T., Field, J. A., and Lettinga, G. (1997). Anaerobe Tolerance to Oxygen and the Potentials of Anaerobic and Aerobic Cocultures for Wastewater Treatment. Braz. J. Chem. Eng. 14 (4), 395–407. doi:10.1590/s0104-66321997000400015
Khademian, M., and Imlay, J. A. (2020). Do Reactive Oxygen Species or Does Oxygen Itself Confer Obligate Anaerobiosis? The Case of Bacteroides thetaiotaomicron. Mol. Microbiol. 114 (2), 333–347. doi:10.1111/mmi.14516
Krab, K., Oltmann, L. F., and Stouthamer, A. H. (1982). Linkage of Formate Hydrogenlyase with Anaerobic Respiration in Proteus mirabilis. Biochim. Biophys. Acta (Bba) - Bioenerg. 679 (1), 51–59. doi:10.1016/0005-2728(82)90254-7
Krayzelova, L., Bartacek, J., Díaz, I., Jeison, D., Volcke, E. I. P., and Jenicek, P. (2015). Microaeration for Hydrogen Sulfide Removal during Anaerobic Treatment: a Review. Rev. Environ. Sci. Biotechnol. 14 (4), 703–725. doi:10.1007/s11157-015-9386-2
Kucek, L. A., Nguyen, M., and Angenent, L. T. (2016). Conversion of L-Lactate into n-Caproate by a Continuously Fed Reactor Microbiome. Water Res. 93, 163–171. doi:10.1016/j.watres.2016.02.018
Lambrecht, J., Cichocki, N., Schattenberg, F., Kleinsteuber, S., Harms, H., Müller, S., et al. (2019). Key Sub-community Dynamics of Medium-Chain Carboxylate Production. Microb. Cell Fact. 18 (1), 92. doi:10.1186/s12934-019-1143-8
Logroño, W., Popp, D., Kleinsteuber, S., Sträuber, H., Harms, H., and Nikolausz, M. (2020). Microbial Resource Management for Ex Situ Biomethanation of Hydrogen at Alkaline pH. Microorganisms 8 (4), 614. doi:10.3390/microorganisms8040614
Martin, W. F., and Sousa, F. L. (2015). Early Microbial Evolution: The Age of Anaerobes. Cold Spring Harb. Perspect. Biol. 8 (2), a018127. doi:10.1101/cshperspect.a018127
Matassa, S., Verstraete, W., Pikaar, I., and Boon, N. (2016). Autotrophic Nitrogen Assimilation and Carbon Capture for Microbial Protein Production by a Novel Enrichment of Hydrogen-Oxidizing Bacteria. Water Res. 101, 137–146. doi:10.1016/j.watres.2016.05.077
McCubbin, T., Gonzalez-Garcia, R. A., Palfreyman, R. W., Stowers, C., Nielsen, L. K., and Marcellin, E. (2020). A Pan-Genome Guided Metabolic Network Reconstruction of Five Propionibacterium Species Reveals Extensive Metabolic Diversity. Genes 11 (10), 1115. doi:10.3390/genes11101115
Misra, H. P., and Fridovich, I. (1971). The Generation of Superoxide Radical during the Autoxidation of Ferredoxins. J. Biol. Chem. 246 (22), 6886–6890. doi:10.1016/s0021-9258(19)45929-2
Mohr, T., Infantes, A., Biebinger, L., de Maayer, P., and Neumann, A. (2019). Acetogenic Fermentation from Oxygen Containing Waste Gas. Front. Bioeng. Biotechnol. 7, 433. doi:10.3389/fbioe.2019.00433
Nguyen, D., and Khanal, S. K. (2018). A Little Breath of Fresh Air into an Anaerobic System: How Microaeration Facilitates Anaerobic Digestion Process. Biotechnol. Adv. 36 (7), 1971–1983. doi:10.1016/j.biotechadv.2018.08.007
Oleskowicz-Popiel, P. (2018). Designing Reactor Microbiomes for Chemical Production from Organic Waste. Trends Biotechnol. 36 (8), 747–750. doi:10.1016/j.tibtech.2018.01.002
Piwowarek, K., Lipińska, E., Hać-Szymańczuk, E., Kieliszek, M., and Ścibisz, I. (2018). Propionibacterium spp.–Source of Propionic Acid, Vitamin B12, and Other Metabolites Important for the Industry. Appl. Microbiol. Biotechnol. 102 (2), 515–538. doi:10.1007/s00253-017-8616-7
Rao, J. U., Rash, B. A., Nobre, M. F., da Costa, M. S., Rainey, F. A., and Moe, W. M. (2012). Actinomyces naturae sp. nov., the First Actinomyces sp. Isolated from a Non-human or Animal Source. Antonie Van Leeuwenhoek 101 (1), 155–168. doi:10.1007/s10482-011-9644-4
Sakamoto, M., Ikeyama, N., Toyoda, A., Murakami, T., Mori, H., Iino, T., et al. (2020). Dialister hominis sp. nov., Isolated from Human Faeces. Int. J. Syst. Evol. Microbiol. 70 (1), 589–595. doi:10.1099/ijsem.0.003797
Scholz, C. F. P., and Kilian, M. (2016). The Natural History of Cutaneous Propionibacteria, and Reclassification of Selected Species within the Genus Propionibacterium to the Proposed Novel Genera Acidipropionibacterium gen. nov., Cutibacterium gen. nov. and Pseudopropionibacterium gen. nov. Int. J. Syst. Evol. Microbiol. 66 (11), 4422–4432. doi:10.1099/ijsem.0.001367
Seeliger, S., Janssen, P. H., and Schink, B. (2002). Energetics and Kinetics of Lactate Fermentation to Acetate and Propionate via Methylmalonyl-CoA or Acrylyl-CoA. FEMS Microbiol. Lett. 211 (1), 65–70. doi:10.1111/j.1574-6968.2002.tb11204.x
Smet, A., Cools, P., Krizova, L., Maixnerova, M., Sedo, O., Haesebrouck, F., et al. (2014). Acinetobacter gandensis sp. nov. Isolated from Horse and Cattle. Int. J. Syst. Evol. Microbiol. 64 (Pt 12), 4007–4015. doi:10.1099/ijs.0.068791-0
Stamatopoulou, P., Malkowski, J., Conrado, L., Brown, K., and Scarborough, M. (2020). Fermentation of Organic Residues to Beneficial Chemicals: A Review of Medium-Chain Fatty Acid Production. Processes 8 (12), 1571. doi:10.3390/pr8121571
Stiebritz, M. T., and Reiher, M. (2012). Hydrogenases and Oxygen. Chem. Sci. 3 (6), 1739. doi:10.1039/c2sc01112c
Takahashi, N., Kalfas, S., and Yamada, T. (1994). The Role of the Succinate Pathway in Sorbitol Fermentation by Oral Actinomyces viscosus and Actinomyces naeslundii. Oral Microbiol. Immunol. 9 (4), 218–223. doi:10.1111/j.1399-302X.1994.tb00061.x
Takahashi, N., and Yamada, T. (1999). Effects of pH on the Glucose and Lactate Metabolisms by the Washed Cells of Actinomyces naeslundii under Anaerobic and Aerobic Conditions. Oral Microbiol. Immunol. 14 (1), 60–65. doi:10.1034/j.1399-302X.1999.140108.x
Takors, R., Kopf, M., Mampel, J., Bluemke, W., Blombach, B., Eikmanns, B., et al. (2018). Using Gas Mixtures of CO, CO2 and H2 as Microbial Substrates: the Do's and Don'ts of Successful Technology Transfer from Laboratory to Production Scale. Microb. Biotechnol. 11 (4), 606–625. doi:10.1111/1751-7915.13270
Thauer, R. K., Kaster, A.-K., Goenrich, M., Schick, M., Hiromoto, T., and Shima, S. (2010). Hydrogenases from Methanogenic Archaea, Nickel, a Novel Cofactor, and H2 Storage. Annu. Rev. Biochem. 79, 507–536. doi:10.1146/annurev.biochem.030508.152103
Thompson, T. E., Conrad, R., and Zeikus, J. G. (1984). Regulation of Carbon and Electron Flow in Propionispira arboris: Physiological Function of Hydrogenase and its Role in Homopropionate Formation. FEMS Microbiol. Lett. 22 (3), 265–271. doi:10.1111/j.1574-6968.1984.tb00739.x
Tomazetto, G., Hahnke, S., Wibberg, D., Pühler, A., Klocke, M., and Schlüter, A. (2018). Proteiniphilum saccharofermentans Str. M3/6T Isolated from a Laboratory Biogas Reactor Is Versatile in Polysaccharide and Oligopeptide Utilization as Deduced from Genome-Based Metabolic Reconstructions. Biotechnol. Rep. 18, e00254. doi:10.1016/j.btre.2018.e00254
Vaishampayan, P., Miyashita, M., Ohnishi, A., Satomi, M., Rooney, A., La Duc, M. T., et al. (2009). Description of Rummeliibacillus stabekisii gen. nov., sp. nov. and reclassification of Bacillus pycnus Nakamura et al. 2002 as Rummeliibacillus pycnus comb. nov. Int. J. Syst. Evol. Microbiol. 59 (Pt 5), 1094–1099. doi:10.1099/ijs.0.006098-0
Whitham, J. M., Tirado-Acevedo, O., Chinn, M. S., Pawlak, J. J., and Grunden, A. M. (2015). Metabolic Response of Clostridium ljungdahlii to Oxygen Exposure. Appl. Environ. Microbiol. 81 (24), 8379–8391. doi:10.1128/AEM.02491-15
Keywords: carboxylate platform, lactate-based chain elongation, mixotrophy, micro-aerobic fermentation, open mixed culture, caproic acid, propionic acid, gas recirculation
Citation: Baleeiro FCF, Ardila MS, Kleinsteuber S and Sträuber H (2021) Effect of Oxygen Contamination on Propionate and Caproate Formation in Anaerobic Fermentation. Front. Bioeng. Biotechnol. 9:725443. doi: 10.3389/fbioe.2021.725443
Received: 15 June 2021; Accepted: 19 August 2021;
Published: 10 September 2021.
Edited by:
David Strik, Wageningen University and Research, NetherlandsReviewed by:
Nathaniel W. Fortney, Great Lakes Bioenergy Research Center (DOE), United StatesDiana Calvo, Arizona State University, United States
Copyright © 2021 Baleeiro, Ardila, Kleinsteuber and Sträuber. This is an open-access article distributed under the terms of the Creative Commons Attribution License (CC BY). The use, distribution or reproduction in other forums is permitted, provided the original author(s) and the copyright owner(s) are credited and that the original publication in this journal is cited, in accordance with accepted academic practice. No use, distribution or reproduction is permitted which does not comply with these terms.
*Correspondence: Heike Sträuber, aGVpa2Uuc3RyYWV1YmVyQHVmei5kZQ==