 Gaurav Chandola1†
 Jun-Mei Zhang1,2†Ru-San Tan1,2Ping Chai3,4Lynette Teo4,5
 John C. Allen2Ris Low1Weimin Huang6
 Shuang Leng1,2
 Jiang Ming Fam1Chee Yang Chin1,2
 Ghassan S. Kassab7Adrian Fatt Hoe Low3,4Swee Yaw Tan1,2Terrance Chua1,2Soo Teik Lim1,2
 Liang Zhong1,2*
- 1National Heart Centre Singapore, Singapore, Singapore
- 2Duke-NUS Medical School, Singapore, Singapore
- 3Department of Cardiology, National University Heart Centre, Singapore, Singapore
- 4Yong Loo Lin School of Medicine, National University of Singapore, Singapore, Singapore
- 5Department of Diagnostic Imaging, National University Hospital, Singapore, Singapore
- 6Institute for Infocomm Research, Agency for Science, Technology and Research, Singapore, Singapore
- 7California Medical Innovations Institute, San Diego, CA, United States
Invasive fractional flow reserve (FFR) is recommended to guide stent deployment. We previously introduced a non-invasive FFR calculation (FFRB) based on computed tomography coronary angiography (CTCA) with reduced-order computational fluid dynamics (CFD) and resistance boundary conditions. Current study aimed to assess the feasibility and accuracy of FFRB for predicting coronary hemodynamics before and after stenting, with invasive FFR as the reference. Twenty-five patients who had undergone CTCA were prospectively enrolled before invasive coronary angiography (ICA) and FFR-guided percutaneous coronary intervention (PCI) on 30 coronary vessels. Using reduced-order CFD with novel boundary conditions on three-dimensional (3D) patient-specific anatomic models reconstructed from CTCA, we calculated FFRB before and after virtual stenting. The latter simulated PCI by clipping stenotic segments from the 3D coronary models and replacing them with segments to mimic the deployed coronary stents. Pre- and post-virtual stenting FFRB were compared with FFR measured pre- and post-PCI by investigators blinded to FFRB results. Among 30 coronary lesions, pre-stenting FFRB (mean 0.69 ± 0.12) and FFR (mean 0.67 ± 0.13) exhibited good correlation (r = 0.86, p < 0.001) and agreement [mean difference 0.024, 95% limits of agreement (LoA): −0.11, 0.15]. Similarly, post-stenting FFRB (mean 0.84 ± 0.10) and FFR (mean 0.86 ± 0.08) exhibited fair correlation (r = 0.50, p < 0.001) and good agreement (mean difference 0.024, 95% LoA: −0.20, 0.16). The accuracy of FFRB for identifying post-stenting ischemic lesions (FFR ≤ 0.8) (residual ischemia) was 87% (sensitivity 80%, specificity 88%). Our novel FFRB, based on CTCA with reduced-order CFD and resistance boundary conditions, accurately predicts the hemodynamic effects of stenting which may serve as a tool in PCI planning.
Introduction
Revascularization of coronary artery ischemic lesions with stents by percutaneous coronary intervention (PCI) has proven to be an effective therapeutic method for patients with symptomatic coronary artery disease (CAD) (Erne et al., 2007; Shaw et al., 2008). Significant residual ischemia may occur, however, in approximately 5–24% of patients after stenting (Pijls et al., 2000; Jeremias et al., 2019). Therefore, a tool to predict the hemodynamic effect of revascularization is vital to enable appropriate stenting strategies.
Fractional flow reserve (FFR) is the gold standard for assessing the hemodynamic significance of stenosis (Tonino et al., 2009). Use of FFR to guide PCI enables improved clinical and economic outcomes of stenting (Tonino et al., 2009; Fearon et al., 2010). Given the invasive and time-consuming nature of FFR, its adoption as clinical routine has been somewhat less enthusiastic than anticipated (Zhang D. et al., 2015). An added complication involves measurement of a side branch after stenting, which is challenging because the jailed side branch must be re-crossed through the stent strut using a pressure wire/catheter.
Computational fluid dynamics (CFD) methods have been combined with medical images to derive non-invasive FFR (Min et al., 2012; Nørgaard et al., 2014; Zhang et al., 2016; Zhang et al., 2018; Zhong et al., 2018) and develop virtual stenting approaches to assist PCI treatment planning (Kim et al., 2014; Gosling et al., 2019). Although these CFD based approaches have shown a high level of accuracy when compared to invasive FFR measurements (Koo et al., 2011; Min et al., 2012; Taylor et al., 2013; Nørgaard et al., 2014), the demand on computational time is significant [1–4 h (Nørgaard et al., 2014) or 6 h (Koo et al., 2011) per simulation] due to the transient simulations. This limits the utility of these methods in routine clinical practice where real-time results are needed. Attempts to reduce computational time have employed reduced order methods whereby vessels are modeled as 1D segments in CFD simulations. Although this results in a significant reduction in computational time (5–10 min per simulation), only fair correlation (e.g., Pearson correlation of 0.59) with invasive FFR is achieved (Coenen et al., 2015). Some CFD schemes use generic outlet boundary conditions in the absence of patient-specific data at the distal model boundaries (Gosling et al., 2019), but do not attain the level of accuracy obtained by applying personalized distal boundary conditions.
We previously introduced a reduced-order CFD method and novel boundary conditions (FFRB) for obtaining FFR non-invasively from computed tomography coronary angiography (CTCA) images based on steady state flow simulations (Zhang et al., 2016). Here “B” represents “Bernoulli”, as it signifies the importance of fluid mechanics in the non-invasive FFR calculation. It requires less computational time and has demonstrated excellent accuracy compared with invasive FFR measurements (Zhang et al., 2016; Zhang et al., 2018; Zhang et al., 2020). The goal of this study is to assess the performance of FFRB in predicting coronary hemodynamics before and after stenting, with invasive FFR as the reference.
Materials and Methods
Study Design and Population
The study was carried out at the National Heart Centre Singapore and National University Hospital Singapore. Participants of this study were recruited from an ongoing observational cohort study that aimed to compare the diagnostic performance of FFRB against invasive FFR in patients with intermediate coronary artery disease (ClinicalTrials.gov Identifier: NCT03054324). Consecutive patients attending two tertiary cardiology centers aged 21–98 years who had undergone CTCA and were scheduled to undergo clinically indicated coronary angiography (with invasive FFR performed to vessels having diameter stenoses between 30 and 90%) within 180 days were eligible to participate. The inclusion criteria of the trial were as follows: 1) Suspected or known CAD patients aged ≥21 years; and 2) Patients had undergone CTCA within 6 months and were scheduled to undergo clinically indicated coronary angiography with FFR measurement. Exclusion criteria were 1) Prior PCI; 2) Cardiac event and/or coronary revascularization between CTCA and invasive coronary angiography (ICA) (Bashore et al., 2012); 3) Angina at rest; 4) Left ventricular ejection fraction <30%; 5) Hypertrophic cardiomyopathy, significant valve disease including prosthetic heart valve, implanted pacemaker or defibrillator, complex congenital heart disease; 6) Estimated glomerular filtration rate <30 ml/min/1.73 m2; 7) Tachycardia or significant arrhythmia; 8) iodinated contrast allergy; 9) Contraindication to beta blocker, nitroglycerin or adenosine; 10) Atrial fibrillation; and 11) Serious comorbidity with life expectancy <2 years and pregnancy. The local institutional review boards approved the protocol for this clinical trial. All recruited subjects gave written informed consent. From September 20, 2016 to March 25, 2020, 117 participants were recruited for the trial.
As a sub-study of the multicenter prospective trial, this study consecutively enrolled a total of 27 patients who had undergone elective stenting with FFR measurements before and after stenting in at least one vessel. As the image quality in two patients was inadequate to allow satisfactory segmentation, a total of 25 patients were included in the final analysis.
CTCA Acquisition and Image Segmentation
Following SCCT guidelines (Abbara et al., 2016), CTCA was performed on the following CT scanners: Toshiba Aquilion One 320 slice, Canon Aquilion ONE Genesis 640 Slice, Siemens Somatom Force dual source 384-dector and Philips Brilliance iCT 256-detector. Detailed scanner information is summarized in Supplementary Table 1. Beta-blockers were administrated to patients with resting heart rate >65 beats/minute, and sublingual glyceryl trinitrate was administered prior to each scan. Prospective ECG-triggered scanning mode was used for all CTCA scans.
All acquired CTCA images were processed and reconstructed into 3D patient-specific coronary models. The images were initially classified as diagnostic or non-diagnostic following independent review by two experienced imaging specialists blinded to the analyses. Severe motion artefacts, stair-step artefacts and image noise were the main reasons for non-diagnostic CTCA images. Coronary segmentation was performed on segments with diameter ≥1.5 mm using semi-automated software (QAngio CT, Research Edition v3.0.37.0, Medis) (Collet et al., 2018). Segmentation was performed as coronary arteries were divided into 17 segments based on the American Heart Association recommendation (Austen et al., 1975). Centerline of the coronary artery was first obtained using a fast vessel tracking algorithm and a stretched multi planar-reformatted (MPR) volume was created accordingly. Second, four longitudinal cross sections were extracted from the MPR volume at 45° angular intervals. Lumen contours in these longitudinal images were detected with a model-guided minimum cost approach (MCA) (Van der Zwet et al., 1989). Third, the lumen contours were detected in each transverse slice of the MPR volume using MCA with a circular lumen model. The intersection points of each transverse slice with the longitudinal contours aided the contour depiction.
The segmented contours of each vessel were subsequently imported into 3D Workbench (Medis) to generate the surface meshes and facilitate reconstruction of a 3D model in ANSYS SpaceClaim (Supplementary Figure 1).
ICA and FFR Measurement
ICA was performed in accordance with standard clinical guidelines (Bashore et al., 2012). The decision to perform invasive FFR measurements was made at the discretion of the interventionalist based on severity of the stenosis, lesion characteristics and clinical experience. Of note, interventionalists at the two participating hospitals were encouraged to perform invasive FFR for intermediate coronary stenosis to guide revascularization decisions in accordance with guidelines, as well as after coronary stenting. PCI were performed by the interventionalists based on ICA, invasive FFR and clinical considerations, as applicable. FFR measurements were carried out using one of the following devices: PressureWire Aeris guidewire (St Jude Medical), ACIST Navvus microcatheter (Medtronic), Volcano Verrata pressure guidewire (Philips), or Certus PressureWireX guidewire (Abbott). The intra-coronary pressure was measured in at least one vessel following either intravenous infusion (140–180 μg/kg/min) or intracoronary bolus (60–200 µg) of adenosine to induce hyperaemia (Supplementary Figure 2). Systolic (SBP) and diastolic brachial blood pressure (DBP) measurements were carried out before the ICA examination. Mean blood pressure (MBP) was calculated using Eq. 1 and used in the calculation of non-invasive FFRB.
Lesions with invasive FFR ≤0.80 were considered hemodynamically significant (Pijls et al., 1996). Lesions were also classified as focal, bifurcation, ostial and tandem lesions. Focal lesions were single isolated lesions present in a vessel path from ostium to the distal segment; bifurcation lesions extended across a branch; ostial lesions occurred at the junction of the aorta and coronary artery or the take-off of the daughter branch artery from the parent vessel. Tandem lesions had two or more lesions in a vessel path with ≥50% diameter stenosis (Supplementary Figure 3).
FFRB Determination and Virtual Stenting
The workflow to compute FFRB is shown in Figure 1 and described in our previous study (Zhang et al., 2016). In short, the 3D model was imported into ANSYS Meshing (ANSYS) to discretize the computational domain into tetrahedral elements with boundary inflation layers, the total cell count ranging from 0.3 to 0.8 million cells. Subsequently, FLUENT (ANSYS) was used to solve the continuity and Navier-Stokes equations. Blood was modeled as a Newtonian fluid. The inlet static pressure was set at 6.8 mmHg lower than the patient-specific MBP in consideration of the hyperemia effect of adenosine (Wilson et al., 1990). Resistance boundary conditions were specified at each outlet boundary of the model to mimic physiological conditions. At each coronary outlet, the pressure was related to the reference pressure (P0) and the resistance of downstream vasculature of each coronary branch (Ri). They were updated with an under-relaxation scheme during iterations until the total outflow from all the outlets matched the inflow rate at hyperemia. The detailed derivation of the formulations for the outlet boundary condition can be found in the Supplementary Material. User-defined functions modeling the coronary microvasculature were used to mimic the outlet physiology. It comprises algorithm to implement the resistance boundary conditions at the outlet of the model, based on a novel iterative scheme to determine the resistance and reference pressure of each coronary vessel (Zhang et al., 2016). The CFD simulation relied on several physiological assumptions (Koo et al., 2011; Nørgaard et al., 2014). First, the resting total coronary blood flow rate was related to myocardial mass measured from patient-specific CTCA (Hamada et al., 1998; Wieneke et al., 2005). Second, the resistance of each coronary branch at rest was assumed to be proportional to the size of the parent and daughter branch vessels (Zhou et al., 1999). Third, coronary resistance was taken to be 0.21 times the resting value to mimic hyperemia (Wilson et al., 1990). A no-slip boundary condition was set for the wall. FFRB ≤0.8 was deemed as indicating ischemia. To ensure identical locations of FFRB and invasive FFR measurements, two interventionists blinded to non-invasive FFRB results visually reviewed the ICA images and then marked the FFR measurement locations on the 3D models reconstructed from CTCA images. The values of the invasive FFR measured across coronary artery stenoses before and after stenting served as ground truths against which we compare the corresponding CFD-derived FFRB values in the pre-stenting CTCA models as well as in the simulated post-stenting CTCA models with coronary anatomy reconstituted using actual implanted stents’ geometries and locations.
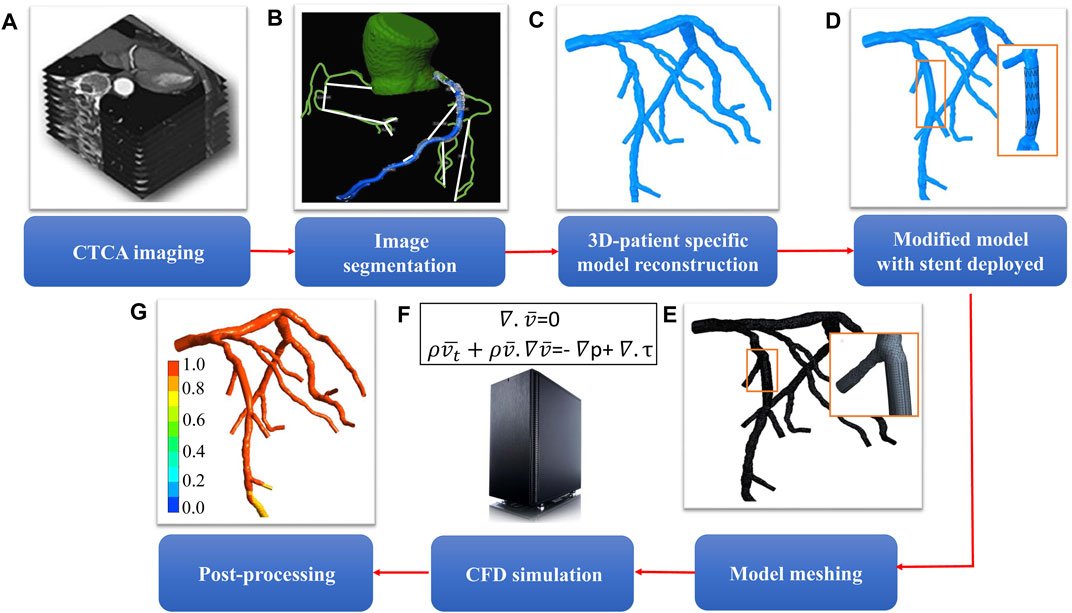
FIGURE 1. Workflow for determining the hemodynamic effect of revascularization using virtual stenting and noninvasive FFRB(A) acquisition of CTCA images (B) segmentation of acquired images (C) 3D reconstruction of patient-specific coronary artery tree (D) model modification to replace the stenotic region with a virtual stent of desired geometric characteristics (E) mesh generation to discretize the 3D model (F) solution of mass and momentum conservation equations to simulate blood flow in coronary arteries (G) post-processing to obtain non-invasive FFRB.
ANSYS SpaceClaim (ANSYS) was used to mimic the 3D model with deployed stent. The stenotic segment was clipped and replaced by a segment with appropriate diameter and length to replicate the dimensions of the deployed stent(s) during PCI. The reconstructed segment was constructed by B-spline interpolation of a set of circular cross-sections, which followed the lumen centerline with diameters identical to those of the stent (Figures 2B,C). The stent deployment location was inferred from the angiograms and checked by two experienced interventionists to facilitate the comparison between FFRB and FFR post-stenting. Figures 2A–D show the procedures used to generate the model with virtual stenting and FFRB was subsequently computed. This procedure can be generalized to accommodate a stent of any diameter and length in testing the effects of different stenting strategies. Examples of FFRB at locations corresponding to invasive FFR measurements are shown in Figure 3.
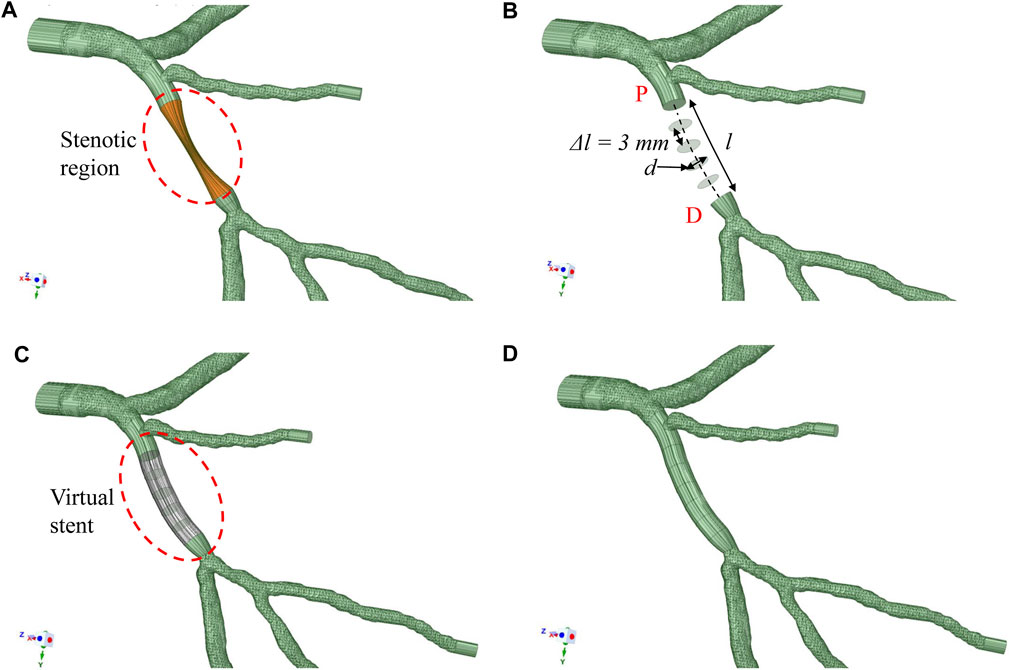
FIGURE 2. Methodology to deploy stent (A) patient-specific 3D model with the stenotic region highlighted (B) The diseased section is clipped between the proximal (P*) and distal (D*) locations. A series of circular surfaces are generated along and perpendicular to the original lumen centerline. These circular surfaces have diameters equal to the virtual stent and spaced at 3 mm interval apart from one another (C) These circular surfaces and original surfaces at “P*” and “D*” are interpolated with B-spline interpolation to form a virtual stent segment (D) The virtual stent segment is merged with the rest of the segments in the original model to form a new model to mimic the post-stenting scenario.
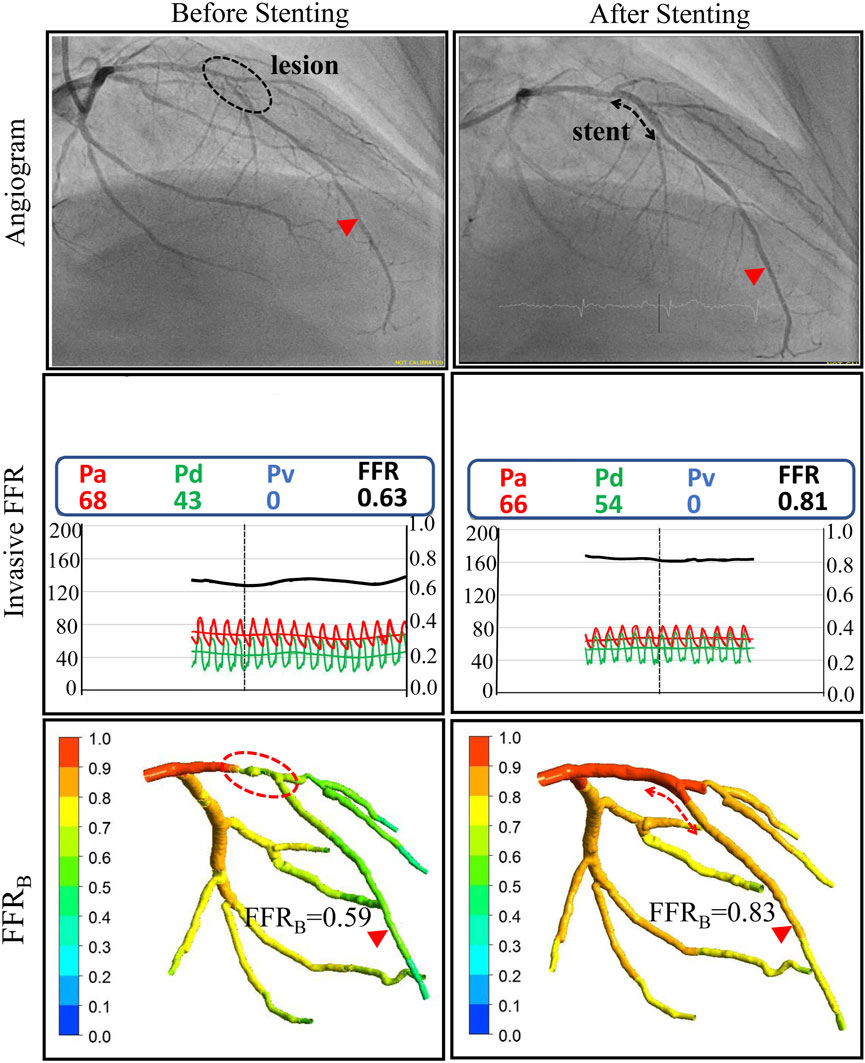
FIGURE 3. Comparison of invasive and non-invasive functional assessment before and after coronary stenting for one of the patients. Left column: ICA and invasive FFR confirmed the presence of a functionally significant lesion on the Left Anterior Descending (LAD) coronary artery with an FFR value of 0.63. Non-invasive FFR (FFRB) obtained using CTCA imaging successfully classified the lesion as functionally significant with an FFRB value of 0.59. Right Column: After stent implantation invasive FFR was 0.81 and the corresponding FFRB calculated on virtual stenting was 0.83, both indicating no residual ischemia.
Statistical Analysis
Continuous and categorical variables were reported as mean ± standard deviation (SD), and frequencies and/or percentages, respectively. The correlations between FFRB and invasive FFR before and after stenting were assessed using Pearson correlation. Bland-Altman plots were used to determine the agreement between FFRB and invasive FFR. Diagnostic accuracy of FFRB with invasive FFR as the reference was assessed by calculating sensitivity, specificity, positive and negative predictive values, and raw accuracy. All statistical analyses were performed using SPSS version 22 (IBM Inc., Armonk, NY, United State). Statistical significance was set at p ≤ 0.05.
Intra and Inter Observer Reproducibility
To evaluate reproducibility and observer concordance of FFRB measurement, intra-observer and inter-observer variability were studied on a randomly selected 10 cases before and after stenting using Bland-Altman analysis, intra-class correlation (ICC) and coefficient of variation (COV). In assessing inter-observer variability, measurements were repeated by a second independent observer (Author ZJM) blinded to the first observer’s (Author GC) results. To address intra-observer variability, repeated analyses 37 days apart were performed by the same observer on the same 10 cases.
Results
Baseline Clinical and Lesion Characteristic Variables
ICA and FFR measurements were performed 22 (interquartile range 14–32) days after CTCA scan for 25 patients. Baseline clinical and lesion characteristic variables are summarized in Table 1. Mean age was 59 ± 9 years; 21 (84%) patients were male; 8 (32%) patients had diabetes mellitus. The mean calcium score was 349. The number of focal, bifurcation, ostial and tandem lesions was 12, 10, 3 and 5, respectively. In total, 30 vessels (22 left anterior descending (LAD), four left circumflex (LCX), and four right coronary arteries (RCA)) were treated with 36 drug eluting stents (DES). The mean length and diameter of the stent was 26 ± 11 mm and 2.96 ± 0.50 mm respectively (Table 2). The histogram of invasive FFR values before and after stenting is shown in Supplementary Figure 4.

TABLE 1. Baseline patient and lesion characteristics.
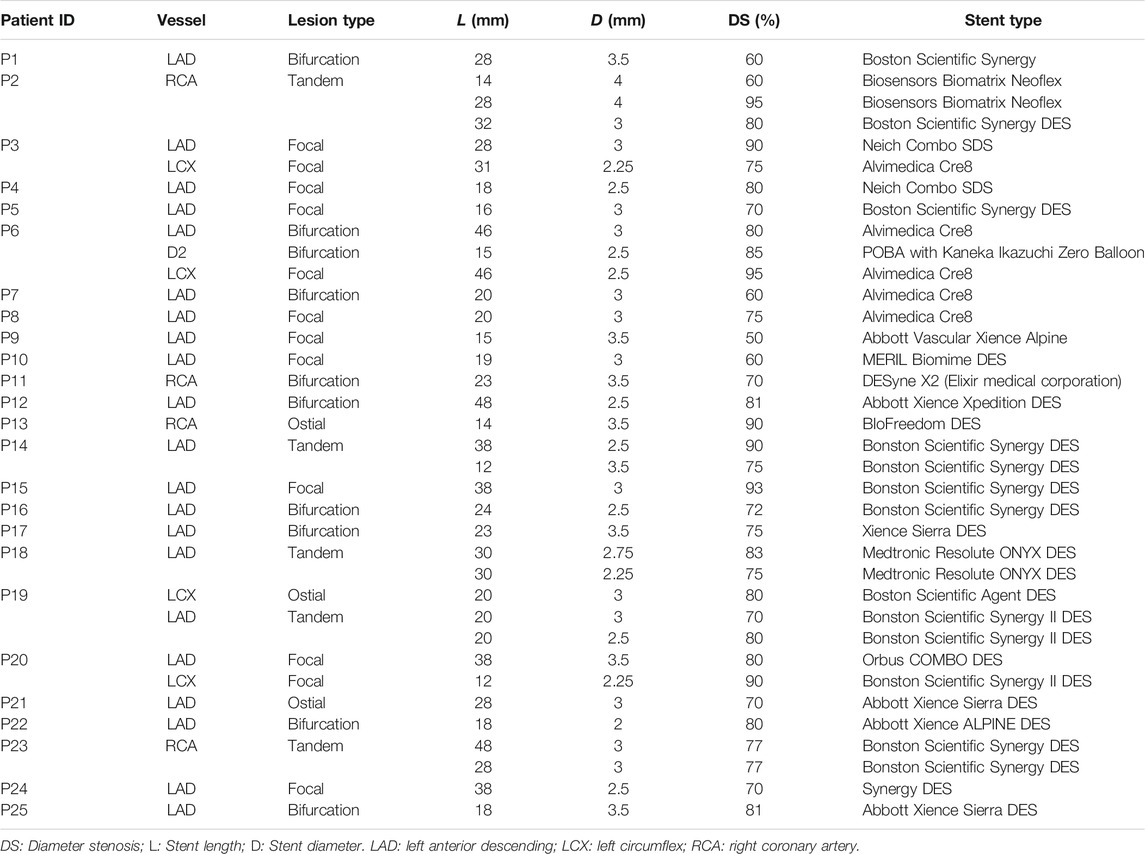
TABLE 2. Baseline lesion and implanted stent characteristics.
Comparison of FFRB and Invasive FFR Before Stenting
CFD simulations were successfully conducted in all patients. Each simulation took 0.4–1.5 h with a Dell T7800 workstation. Before stenting, mean FFRB was 0.69 ± 0.12 and mean FFR was 0.67 ± 0.13. The mean difference (bias) between FFRB and FFR was 0.024 [95% limit of agreement (LoA): −0.11, 0.15]. A comparison of FFRB and FFR before stenting is presented in Figure 4A and shows excellent correlation of 0.86 (p < 0.001) between FFRB and FFR. The corresponding Bland-Altman plot is shown in Figure 4B.
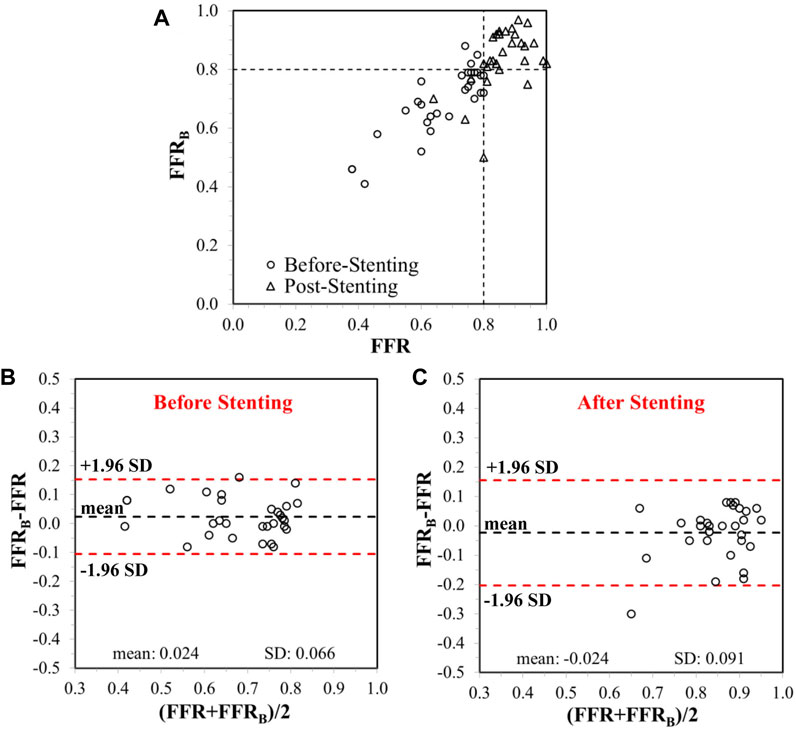
FIGURE 4. (A) Correlation between invasive FFR and FFRB, before and after stenting. The vertical and horizontal dashed lines represent the thresholds for FFR and FFRB, respectively, for ischemic classification of lesions. Bland-Altman plots showing limits of agreement on differences between FFR and FFRB(B) before and (C) after stenting.
Comparison of FFRB and Invasive FFR After Stenting
After stenting, mean FFRB was 0.84 ± 0.10 and mean FFR was 0.86 ± 0.08. The mean difference (bias) between FFRB and FFR was −0.024 (95% LoA: −0.21, 0.16). A comparison of FFRB and FFR after stenting is presented in Figure 4A demonstrating fair correlation (r = 0.50, p < 0.001) between FFRB and FFR. The corresponding Bland-Altman plot is shown in Figure 4C. Diagnostic accuracy, sensitivity, specificity, positive predictive value (PPV) and negative predictive value (NPV) of FFRB for predicting residual ischemia after stenting was 87, 80, 88, 57 and 96%, respectively. Figure 5 presents simulation results for individual patients and vessels before and after stenting with the corresponding FFRB values.
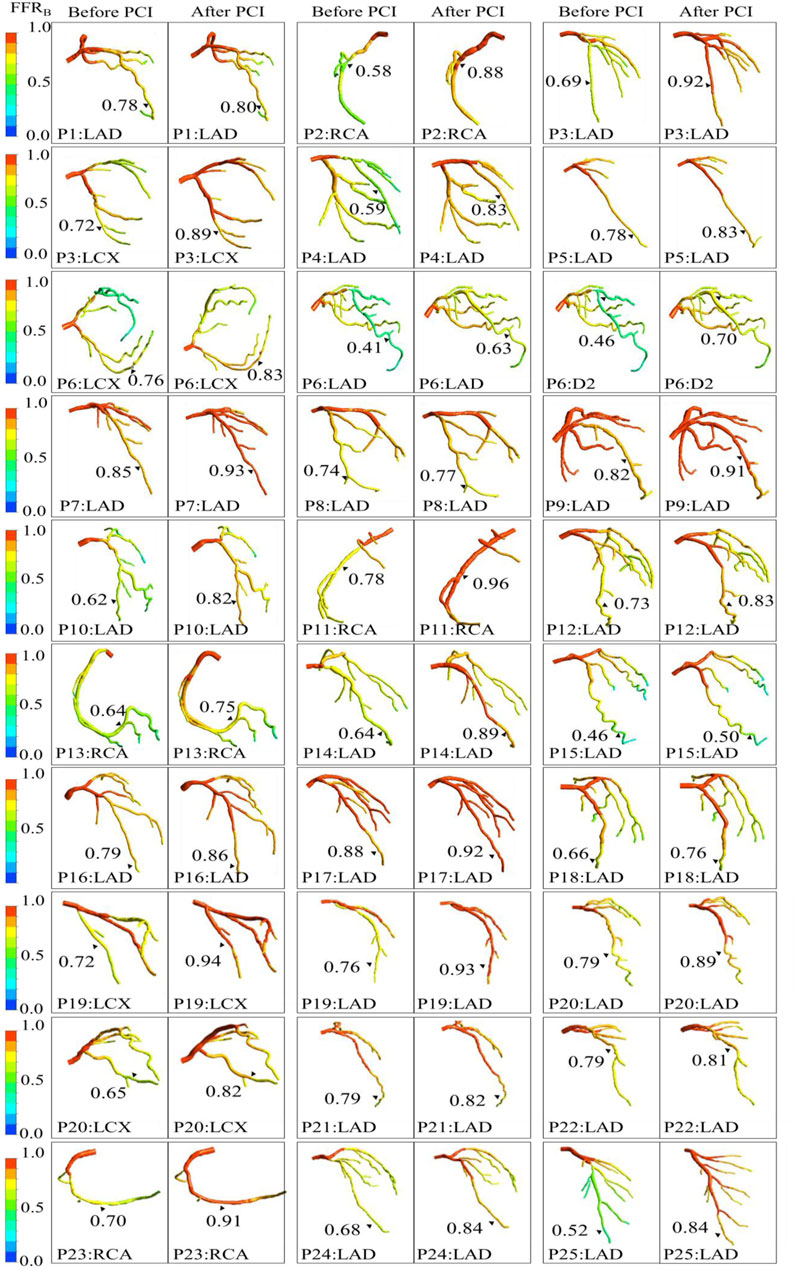
FIGURE 5. Comparison of computationally simulated FFR (FFRB) before and after stenting for all 25 patients (30 vessels).
Reproducibility
For first observer, the median and interquartile range of derived FFRB for replicated analyses of the selected 10 models were 0.83 (0.80, 0.89) and 0.82 (0.80, 0.90), respectively. The mean difference was 0.0018 with 95% LoA of (−0.017, 0.021). Intra-observer ICC and COV was 0.997 (95% CI: 0.988, 0.999) and 0.83% (95% CI: 0.43%, 1.22%), respectively.
For the second observer, the median and interquartile range of derived FFRB was 0.81 (0.80, 0.87) for the same selected 10 models. Compared with the first set of analysis results by the first observer, FFRB had a mean difference of 0.015 with 95% LoA of (−0.035, 0.064). Inter-observer ICC and COV were 0.976 (95% CI: 0.915, 0.994) and 2.34% (95% CI: 1.22%, 3.48%), respectively.
Discussion
In our study, we developed a rapid method for computing FFRB before and after stenting and compared it with invasive FFR. FFRB increased significantly from 0.69 ± 0.12 before stenting to 0.84 ± 0.10 after stenting. The Pearson correlation coefficients between FFRB and FFR were 0.86 before and 0.50 after virtual stenting. FFRB demonstrated 87% accuracy for identifying post-stenting ischemic lesions.
A similar approach was adopted by Kim et al. (Kim et al., 2014) to evaluate residual ischemia post PCI via non-invasive FFRCT. They reported correlation coefficients between FFRCT. and invasive FFR of 0.60 and 0.55 before and after stenting, respectively, while the coefficients in our study were 0.86 and 0.50. When classifying FFR >0.80 post stenting as ischemia free, the accuracy, sensitivity, specificity, PPV and NPV for diagnosing residual ischemia in their study was 96, 100, 96, 50, and 100% while our corresponding values were 87, 80, 88, 57, and 96%, respectively. The lower PPV in these studies can be attributed to the relatively few residual ischemia cases after intervention (e.g., in the present study we only have five of 30 vessels with residual ischemia). In another study, Bom et al. (Bom et al., 2021) investigated the accuracy of FFRCT planner to predict the hemodynamic gain of PCI. Results have shown that the FFRCT planner tool demonstrated significant agreement with invasive post-PCI FFR values (r = 0.53 pre-PCI and 0.41 post-PCI, both p < 0.001) and with changes in FFR values after PCI (r = 0.57, p < 0.001).
Gosling et al. (Gosling et al., 2019) used ICA as the imaging modality for simulating stent placement. Using ICA, they obtained improved correlations between noninvasive FFR and invasive FFR before and after stenting reporting correlations of 0.87 and 0.80, respectively. Their method, however, relied on ICA images. To achieve real time prognosis similar to or shorter than the time required for FFR measurements, simplifying the computations via implementation of generic distal boundary conditions and/or limiting the vessels for CFD analysis (without considering side branches) can be explored and accuracy would need to be verified.
Our method relies on CTCA imaging and employs complete coronary artery tree reconstruction with patient-specific distal boundary conditions. Although Kim et al. (Kim et al., 2014) also used CTCA images, their computationally simulated FFR values were based on transient simulations of the entire cardiac cycle and consequently were computationally demanding. In comparison, our method relies on steady state simulation and combines a novel iterative algorithm to implement patient-specific outlet boundary conditions which considerably lowers the computation time (Zhang et al., 2016). We anticipated that this would lead to shorter turnaround time, which is an important consideration in the proposed application for decision-making in the clinical setting. Compared with the transient simulation employed, our methodology involves steady state simulation along with novel resistance boundary conditions that achieved equivalent accuracy in reference to invasive FFR at a computational time 1/16 of that required for full transient simulation (Zhang J.-M. et al., 2015). Of note, we have applied this reduced order CFD method to model both pre- and post-virtual stenting coronary hemodynamics, which constitute an original application.
As shown in the case example of treatment planning for tandem lesions (see Supplementary Material and Supplementary Figure 5), using non-invasive FFR prediction, we can determine the importance of each lesion’s role in the hemodynamics of tandem lesions and decide the optimal treatment strategy for tandem lesions. All of these results corroborate the potential of our technology as a tool for assisting treatment planning in the catheterization laboratory. Our technology allows operators latitude and flexibility to explore various stenting strategies virtually on a per-patient basis, before the invasive procedure, and depending on the hemodynamic effects of various options, choose the optimal strategy. In that manner the hemodynamic effects of the different strategies can be assessed by FFRB.
The current study simulated post-stenting hemodynamics on the CTCA model by incorporating information on implanted stent characteristics. This included actual stent lengths and diameters as chosen by the interventionists (see Table 2), and stenting locations referred from invasive angiography. This is for the purpose of validation against actual hemodynamic parameters that were measured after coronary intervention, so as to demonstrate the proof-of-concept of using our simulation models to predict the hemodynamic outcomes of coronary stenting.
For the proposed use of simulated models for treatment planning, the hemodynamic results of both stenting strategy (choice of which discrete lesions to stent or not to stent) and stent selection (stent length and diameter) can be simulated. With regards to the latter, stent characteristics can be determined from the luminal geometry on CTCA. For example, we can generate a curve to represent coronary lumen area changes along the centerline of the stenosed coronary artery from 3D curved multiplanar reformatted CTCA. A finite length “S” represents the stenotic site with minimum lumen area. The proximal (“P”) and distal (“D”) ends of the stenotic site correspond to the proximate and distal points on plotted curves with maximal absolute values of change of slope on either side of “S”, respectively. The distance between points “P” and “D” can be used to determine the stent length, while the average of the diameters corresponding to points “P” and “D” respectively can be used to estimate the stent diameter.
Hence, the present technology has the dual capability of diagnosing as well as planning and predicting therapeutic benefits of a revascularization strategy for CAD patients. The clinical application of this tool can thus reduce unnecessary interventions, procedural time, radiation dose and costs.
Our study had limitations. The number of patients enrolled was relatively small (25 patients with FFR measurement on 30 vessels) in a predominantly Asian population. A larger cohort size will be needed to corroborate these initial findings. Thus, we propose these findings be considered as a “proof-of-concept”. Another clinical trial on a much larger cohort of patients undergoing PCI to further validate the current methodologies is prerequisite before applying this tool in routine clinical practice. Second, this technology relies on CTCA imaging for reconstructing patient-specific anatomy and currently is only applicable in patients with diagnostic quality CTCA images. Third, the patient-specific geometry is based on the CTCA images taken before revascularization and hence do not consider anatomical changes (e.g., local curvature changes due to vessel compliance with stent) or microvascular injury introduced during the PCI procedure. Fourth, although in a previous study our non-invasive FFRB technology was shown to have good diagnostic performance in classifying ischemia causing lesions (Zhang et al., 2016), the results were based on retrospective data. The complete data of our current prospective study on Asian cohort will be released to validate the clinical utility of the proposed methodology. Fifth, the present method does not consider different stent designs, material characteristics or drug coatings. These factors are more likely to affect long term stent performance than the acute hemodynamic improvement that is studied here. Sixth, hyperemia was induced by either intravenous infusion or intracoronary bolus of adenosine, nonetheless, prior studies have reported that intravenous infusion of adenosine yielded identical FFR result compared with intracoronary bolus (Schlundt et al., 2015). Lastly, the inlet static pressure was set at 6.8 mmHg below the patient-specific mean blood pressure (MBP) to account for the hyperemia effect of adenosine (Wilson et al., 1990). After stenting, even though the stenotic luminal area is enlarged (e.g. diameter stenosis decreased), this assumption is still valid since the adenosine effect on MBP will still dominate. While we cannot measure actual MBP post-virtual stenting, the effects of any potential effects on FFRB are unlikely to be clinically significant. In a prior study, we estimated a FFRB change 0.01 for every 6.25 mmHg unit change of MBP (Zhang et al., 2020).
Conclusion
Computationally simulated FFR is highly reproducible, readily obtainable from standard CTCA images with reduced-order CFD and novel boundary conditions. This finding is promising for noninvasive detection of hemodynamically significant coronary stenosis and holds potential as a virtual coronary stent implantation planning tool to predict the hemodynamic effects of stenting in CAD patients.
Data Availability Statement
The original contributions presented in the study are included in the article/Supplementary Material, further inquiries can be directed to the corresponding author.
Ethics Statement
The studies involving human participants were reviewed and approved by SingHealth Centralised Institutional Review Board. The patients/participants provided their written informed consent to participate in this study.
Author Contributions
SL and LZ conceived the study design; GC and J-MZ analyzed data; GC, J-MZ, R-ST, PC, LT, WH, JF, CC, GK, AL, ST, TC, SL and LZ interpreted results; JA performed statistical analysis; GC drafted article; J-MZ, R-ST, PC, LT, JA, RL, WH, SL, JF, CC, GK, AL, ST, TC, SL and LZ edited and revised article; All authors read and approved the final article.
Funding
This work was supported by National Medical Research Council Singapore (NMRC/BnB/0017/2015) and (MOH-000358). The funder had no role in the design and conduct of the study; collection; management, analysis, and interpretation of the data; and preparation, review, or approval of the article.
Conflict of Interest
The authors declare that the research was conducted in the absence of any commercial or financial relationships that could be construed as a potential conflict of interest.
Publisher’s Note
All claims expressed in this article are solely those of the authors and do not necessarily represent those of their affiliated organizations, or those of the publisher, the editors and the reviewers. Any product that may be evaluated in this article, or claim that may be made by its manufacturer, is not guaranteed or endorsed by the publisher.
Supplementary Material
The Supplementary Material for this article can be found online at: https://www.frontiersin.org/articles/10.3389/fbioe.2021.739667/full#supplementary-material
Abbreviations
CAD, coronary artery disease; CFD, computational fluid dynamics; COV, coefficient of variation; CTCA, computed tomography coronary angiography; DBP, diastolic blood pressure; FFR, fractional flow reserve; ICA, invasive coronary angiography; ICC, intra-class correlation; LAD, left anterior descending artery; LoA, limits of agreement; MBP, mean blood pressure; NPV, negative predictive value; PCI, percutaneous coronary intervention; PPV, positive predictive value; SBP, systolic blood pressure; SD, standard deviation.
References
Abbara, S., Blanke, P., Maroules, C. D., Cheezum, M., Choi, A. D., Han, B. K., et al. (2016). SCCT Guidelines for the Performance and Acquisition of Coronary Computed Tomographic Angiography: A Report of the Society of Cardiovascular Computed Tomography Guidelines Committee. J. Cardiovasc. Computed Tomography 10, 435–449. doi:10.1016/j.jcct.2016.10.002
Austen, W., Edwards, J., Frye, R., Gensini, G., Gott, V., Griffith, L., et al. (1975). A Reporting System on Patients Evaluated for Coronary Artery Disease. Report of the Ad Hoc Committee for Grading of Coronary Artery Disease, Council on Cardiovascular Surgery, American Heart Association. Circulation 51, 5–40. doi:10.1161/01.cir.51.4.5
Bashore, T. M., Balter, S., Barac, A., Byrne, J. G., Cavendish, J. J., Chambers, C. E., et al. (2012). 2012 American College of Cardiology Foundation/Society for Cardiovascular Angiography and Interventions Expert Consensus Document on Cardiac Catheterization Laboratory Standards Update. J. Am. Coll. Cardiol. 59, 2221–2305. doi:10.1016/j.jacc.2012.02.010
Bom, M. J., Schumacher, S. P., Driessen, R. S., Diemen, P. A., Everaars, H., Winter, R. W., et al. (2021). Non‐invasive Procedural Planning Using Computed Tomography‐derived Fractional Flow reserve. Catheter Cardiovasc. Interv. 97, 614–622. doi:10.1002/ccd.29210
Coenen, A., Lubbers, M. M., Kurata, A., Kono, A., Dedic, A., Chelu, R. G., et al. (2015). Fractional Flow Reserve Computed from Noninvasive CT Angiography Data: Diagnostic Performance of an On-Site Clinician-Operated Computational Fluid Dynamics Algorithm. Radiology 274, 674–683. doi:10.1148/radiol.14140992
Collet, C., Onuma, Y., Grundeken, M., Miyazaki, Y., Bittercourt, M., Kitslaar, P., et al. (2018). In Vitro validation of Coronary CT Angiography for the Evaluation of Complex Lesions. EuroIntervention 13, e1823–e1830. doi:10.4244/EIJ-D-17-00326
Erne, P., Schoenenberger, A. W., Burckhardt, D., Zuber, M., Kiowski, W., Buser, P. T., et al. (2007). Effects of Percutaneous Coronary Interventions in Silent Ischemia after Myocardial Infarction. Jama 297, 1985–1991. doi:10.1001/jama.297.18.1985
Fearon, W. F., Bornschein, B., Tonino, P. A. L., Gothe, R. M., Bruyne, B. D., Pijls, N. H. J., et al. (2010). Economic Evaluation of Fractional Flow reserve-guided Percutaneous Coronary Intervention in Patients with Multivessel Disease. Circulation 122, 2545–2550. doi:10.1161/CIRCULATIONAHA.109.925396
Gosling, R. C., Morris, P. D., Silva Soto, D. A., Lawford, P. V., Hose, D. R., and Gunn, J. P. (2019). Virtual Coronary Intervention. JACC: Cardiovasc. Imaging 12, 865–872. doi:10.1016/j.jcmg.2018.01.019
Hamada, M., Kuwahara, T., Shigematsu, Y., Kodama, K., Hara, Y., Hashida, H., et al. (1998). Relation between Coronary Blood Flow and Left Ventricular Mass in Hypertension. Noninvasive Quantification of Coronary Blood Flow by Thallium-201 Myocardial Scintigraphy. Hypertens. Res. 21, 227–234. doi:10.1291/hypres.21.227
Jeremias, A., Davies, J. E., Maehara, A., Matsumura, M., Schneider, J., Tang, K., et al. (2019). Blinded Physiological Assessment of Residual Ischemia after Successful Angiographic Percutaneous Coronary Intervention. JACC: Cardiovasc. Interventions 12, 1991–2001. doi:10.1016/j.jcin.2019.05.054
Kim, K.-H., Doh, J.-H., Koo, B.-K., Min, J. K., Erglis, A., Yang, H.-M., et al. (2014). A Novel Noninvasive Technology for Treatment Planning Using Virtual Coronary Stenting and Computed Tomography-Derived Computed Fractional Flow reserve. JACC: Cardiovasc. InterventionsInterv 7, 72–78. doi:10.1016/j.jcin.2013.05.024
Koo, B.-K., Erglis, A., Doh, J.-H., Daniels, D. V., Jegere, S., Kim, H.-S., et al. (2011). Diagnosis of Ischemia-Causing Coronary Stenoses by Noninvasive Fractional Flow Reserve Computed from Coronary Computed Tomographic Angiograms. J. Am. Coll. Cardiol. 58, 1989–1997. doi:10.1016/j.jacc.2011.06.066
Min, J. K., Leipsic, J., Pencina, M. J., Berman, D. S., Koo, B.-K., van Mieghem, C., et al. (2012). Diagnostic Accuracy of Fractional Flow reserve from Anatomic CT Angiography. JAMA 308, 1237–1245. doi:10.1001/2012.jama.11274
Nørgaard, B. L., Leipsic, J., Gaur, S., Seneviratne, S., Ko, B. S., Ito, H., et al. (2014). Diagnostic Performance of Noninvasive Fractional Flow Reserve Derived from Coronary Computed Tomography Angiography in Suspected Coronary Artery Disease. J. Am. Coll. Cardiol. 63, 1145–1155. doi:10.1016/j.jacc.2013.11.043
Pijls, N. H. J., De Bruyne, B., Bech, G. J. W., Liistro, F., Heyndrickx, G. R., Bonnier, H. J. R. M., et al. (2000). Coronary Pressure Measurement to Assess the Hemodynamic Significance of Serial Stenoses within One Coronary Artery. Circulation 102, 2371–2377. doi:10.1161/01.cir.102.19.2371
Pijls, N. H. J., De Bruyne, B., Peels, K., Van Der Voort, P. H., Bonnier, H. J. R. M., Bartunek, J., et al. (1996). Measurement of Fractional Flow reserve to Assess the Functional Severity of Coronary-Artery Stenoses. N. Engl. J. Med. 334, 1703–1708. doi:10.1056/NEJM199606273342604
Schlundt, C., Bietau, C., Klinghammer, L., Wiedemann, R., Rittger, H., Ludwig, J., et al. (2015). Comparison of Intracoronary versus Intravenous Administration of Adenosine for Measurement of Coronary Fractional Flow reserve. Circ. Cardiovasc. Interv. 8, e001781. doi:10.1161/CIRCINTERVENTIONS.114.001781
Shaw, L. J., Berman, D. S., Maron, D. J., Mancini, G. B. J., Hayes, S. W., Hartigan, P. M., et al. (2008). Optimal Medical Therapy with or without Percutaneous Coronary Intervention to Reduce Ischemic Burden. Circulation 117, 1283–1291. doi:10.1161/CIRCULATIONAHA.107.743963
Taylor, C. A., Fonte, T. A., and Min, J. K. (2013). Computational Fluid Dynamics Applied to Cardiac Computed Tomography for Noninvasive Quantification of Fractional Flow Reserve. J. Am. Coll. Cardiol. 61, 2233–2241. doi:10.1016/j.jacc.2012.11.083
Tonino, P. A. L., De Bruyne, B., Pijls, N. H. J., Siebert, U., Ikeno, F., van`t Veer, M., et al. (2009). Fractional Flow reserve versus Angiography for Guiding Percutaneous Coronary Intervention. N. Engl. J. Med. 360, 213–224. doi:10.1056/NEJMoa0807611
Van der Zwet, P. M. J., von Land, C. D., Loois, G., Gerbrands, J. J., and Reiber, J. H. C. (1989). An On-Line System for the Quantitative Analysis of Coronary Arterial Segments. Comput. Cardiol., 157–160. doi:10.1109/CIC.1989.130509
Wieneke, H., von Birgelen, C., Haude, M., Eggebrecht, H., Möhlenkamp, S., Schmermund, A., et al. (2005). Determinants of Coronary Blood Flow in Humans: Quantification by Intracoronary Doppler and Ultrasound. J. Appl. Physiol. 98, 1076–1082. doi:10.1152/japplphysiol.00724.2004
Wilson, R. F., Wyche, K., Christensen, B. V., Zimmer, S., and Laxson, D. D. (1990). Effects of Adenosine on Human Coronary Arterial Circulation. Circulation 82, 1595–1606. doi:10.1161/01.cir.82.5.1595
Zhang, D., Lv, S., Song, X., Yuan, F., Xu, F., Zhang, M., et al. (2015a). Fractional Flow reserve versus Angiography for Guiding Percutaneous Coronary Intervention: A Meta-Analysis. Heart 101, 455–462. doi:10.1136/heartjnl-2014-306578
Zhang, J.-M., Chandola, G., Tan, R.-S., Chai, P., Teo, L. L. S., Low, R., et al. (2020). Quantification of Effects of Mean Blood Pressure and Left Ventricular Mass on Noninvasive Fast Fractional Flow reserve. Am. J. Physiology-Heart Circulatory Physiol. 319, H360–H369. doi:10.1152/ajpheart.00135.2020
Zhang, J.-M., Luo, T., Tan, S. Y., Lomarda, A. M., Wong, A. S. L., Keng, F. Y. J., et al. (2015b). Hemodynamic Analysis of Patient-specific Coronary Artery Tree. Int. J. Numer. Meth. Biomed. Engng. 31, e02708. doi:10.1002/cnm.2708
Zhang, J.-M., Shuang, D., Baskaran, L., Wu, W., Teo, S.-K., Huang, W., et al. (2018). Advanced Analyses of Computed Tomography Coronary Angiography Can Help Discriminate Ischemic Lesions. Int. J. Cardiol. 267, 208–214. doi:10.1016/j.ijcard.2018.04.020
Zhang, J.-M., Zhong, L., Luo, T., Lomarda, A. M., Huo, Y., Yap, J., et al. (2016). Simplified Models of Non-invasive Fractional Flow reserve Based on CT Images. PLoS One 11, e0153070. doi:10.1371/journal.pone.0153070
Zhong, L., Zhang, J.-M., Su, B., Tan, R. S., Allen, J. C., and Kassab, G. S. (2018). Application of Patient-specific Computational Fluid Dynamics in Coronary and Intra-cardiac Flow Simulations: Challenges and Opportunities. Front. Physiol. 9, 742. doi:10.3389/fphys.2018.00742
Keywords: fractional flow reserve, stents, hemodynamics, coronary angiography, computed tomography angiography
Citation: Chandola G, Zhang J-M, Tan R-S, Chai P, Teo L, Allen JC, Low R, Huang W, Leng S, Fam JM, Chin CY, Kassab GS, Low AFH, Tan SY, Chua T, Lim ST and Zhong L (2021) Computed Tomography Coronary Angiography and Computational Fluid Dynamics Based Fractional Flow Reserve Before and After Percutaneous Coronary Intervention. Front. Bioeng. Biotechnol. 9:739667. doi: 10.3389/fbioe.2021.739667
Received: 11 July 2021; Accepted: 25 August 2021;
Published: 07 September 2021.
Edited by:
Josue Sznitman, Technion Israel Institute of Technology, IsraelReviewed by:
Eun Bo Shim, Kangwon National University, South KoreaAike Qiao, Beijing University of Technology, China
Copyright © 2021 Chandola, Zhang, Tan, Chai, Teo, Allen, Low, Huang, Leng, Fam, Chin, Kassab, Low, Tan, Chua, Lim and Zhong. This is an open-access article distributed under the terms of the Creative Commons Attribution License (CC BY). The use, distribution or reproduction in other forums is permitted, provided the original author(s) and the copyright owner(s) are credited and that the original publication in this journal is cited, in accordance with accepted academic practice. No use, distribution or reproduction is permitted which does not comply with these terms.
*Correspondence: Liang Zhong, emhvbmcubGlhbmdAbmhjcy5jb20uc2c=
†These authors have contributed equally to this work and share first authorship