 C. R. Bernau1†
 M. Knödler
 J. Emonts
 J. F. Buyel
- 1Fraunhofer Institute for Molecular Biology and Applied Ecology IME, Aachen, Germany
- 2Institute for Molecular Biotechnology, RWTH Aachen University, Aachen, Germany
- 3University of Natural Resources and Life Sciences, Vienna (BOKU), Department of Biotechnology (DBT), Institute of Bioprocess Science and Engineering (IBSE), Vienna, Austria
Chromatography is the workhorse of biopharmaceutical downstream processing because it can selectively enrich a target product while removing impurities from complex feed streams. This is achieved by exploiting differences in molecular properties, such as size, charge and hydrophobicity (alone or in different combinations). Accordingly, many parameters must be tested during process development in order to maximize product purity and recovery, including resin and ligand types, conductivity, pH, gradient profiles, and the sequence of separation operations. The number of possible experimental conditions quickly becomes unmanageable. Although the range of suitable conditions can be narrowed based on experience, the time and cost of the work remain high even when using high-throughput laboratory automation. In contrast, chromatography modeling using inexpensive, parallelized computer hardware can provide expert knowledge, predicting conditions that achieve high purity and efficient recovery. The prediction of suitable conditions in silico reduces the number of empirical tests required and provides in-depth process understanding, which is recommended by regulatory authorities. In this article, we discuss the benefits and specific challenges of chromatography modeling. We describe the experimental characterization of chromatography devices and settings prior to modeling, such as the determination of column porosity. We also consider the challenges that must be overcome when models are set up and calibrated, including the cross-validation and verification of data-driven and hybrid (combined data-driven and mechanistic) models. This review will therefore support researchers intending to establish a chromatography modeling workflow in their laboratory.
1 Introduction
Chromatography is the method of choice for the purification of biopharmaceutical proteins during downstream processing (DSP), typically achieving a purity >95% for the final product (Geigert 2013). However, chromatography is also a major cost driver during production and process development due to the high cost of materials and the time-consuming optimization of process conditions to increase the yield, recovery and purity while minimizing the environmental impact (Buyel and Fischer 2014; Madabhushi et al., 2018). Optimization focuses on the interaction between a protein and a ligand-coated stationary phase within a chromatography column, which can be modified by adjusting factors such as the resin matrix, pore size, ligand type and density, pH, flow rate, temperature and conductivity, thus constituting a multi-parameter problem (Schmidt-Traub et al., 2020). A combination of automated, high-throughput screening and scale-down models (SDMs) can reduce the time required and therefore the cost of optimization, and can be used to build empirical, data-driven descriptive models (Kawajiri 2021), for example using a design of experiments (DoE) approach (Hibbert 2012a; Bayer et al., 2021). Nevertheless, the identification and quantification of key factors and their interactions is dependent on substantial infrastructure and experimental effort, and the efficiency of the process can largely depend on the availability of experienced staff (Hanke and Ottens 2014).
In contrast, mechanistic models describe chromatography based on physicochemical principles and thus facilitate a priori predictions about protein separation processes (Shekhawat and Rathore 2019). These models consist of equations describing mass transport (e.g., the general rate model (Püttmann et al., 2013), and protein sorption (e.g., the steric mass action (SMA) model (Brooks and Cramer 1992; Osberghaus et al., 2012a). Mechanistic models require calibration with empirical data, such as resin-specific gradient elution experiments and breakthrough curves (Schmidt-Traub 2006), and they need substantial computational power (Juliane Dorothea Diedrich 2019; Rischawy et al., 2019). Accordingly, these models are currently used mainly for late-stage downstream process characterization but their widespread use in academia and industry is limited by the complexity of model calibration and implementation (Saleh et al., 2020). Nevertheless, there is a growing commercial interest in the topic because it can accelerate process development (Mouellef et al., 2021), for example, the German start-up company GoSilico has developed chromatography modeling software (Hahn et al., 2012) and was acquired by Cytiva (formerly GE Healthcare) in 20211. Specifically, mechanistic modelling can improve holistic process understanding (Close 2015), increase transferability to new processes, and simplify change management (Djuris and Djuric 2017). For example, the experimental effort required to model a cation exchange chromatography step for a monoclonal antibody in silico was reduced by ∼75% compared to traditional laboratory-based process characterization (Saleh et al., 2021c). This reflected the ability of the model to predict the effect of changes in protein surface charge on separation a priori, thus accounting for the impact on purification (Saleh et al., 2021a). Similarly, mechanistic models can augment SDM-based data by incorporating process information about loading density, bed height or mobile phase properties (Saleh et al., 2021b). Furthermore, consecutive, orthogonal purification steps can be optimized in a holistic manner, for example by ensuring compatibility between the elution conditions of the first step and the loading conditions of the next (Huuk et al., 2014).
Ultimately, mechanistic models may be combined with data-driven counterparts to form hybrid models that can build the basis of a digital twin for a production process. Such a twin can be augmented through real-time data from process analytical technologies (PAT) to facilitate model-predictive control (MPC) as a means to ensure continuous optimal performance (Mollerup et al., 2008; Andris and Hubbuch 2020; Saleh et al., 2021c; Moser et al., 2021). This is in line with the quality by design (QbD) approach to improve process robustness and consistency by ensuring fundamental process understanding (Shekhawat et al., 2016; Saleh et al., 2021c). Thereby, the different types of chromatography models support a risk-based approach during pharmaceutical product and process development as proposed by the European Medicines Agency (EMA) and US Food and Drug Administration (FDA), and as outlined in the International Council for Harmonisation (ICH) quality guidelines Q8–Q11 (Holm et al., 2017).
In this article, we consider the requirements and challenges associated with data-driven, mechanistic and hybrid modeling of chromatography, which we introduce first. Then, we discuss the individual challenges starting with interdisciplinary work necessary to build such models and to collect high-quality experimental data for model calibration. We also highlight the benefits and limitations of the different modeling approaches, including model calibration, parameter fitting and validation, and the impact of nonspecific protein–resin interactions. However, the design and optimization of multi-stage purification processes is beyond the scope of this article and is not discussed any further.
2 Modeling approaches
2.1 Descriptive models
Data-driven models can be built without prior knowledge of the mechanisms underlying the process under investigation and are therefore especially useful for poorly characterized settings, for example in the social sciences (Stattner and Collard 2015a) or in complex biotechnological production processes (Walther et al., 2022a). A pre-defined set of equations is not required to account explicitly for all the proteins in a chromatographic separation. Instead, data-driven approaches use (experimental) data to build descriptive or predictive models a posteriori by applying data analysis techniques such as machine learning (ML) and classical statistical regression analysis (Mitchel 1997a; Vidakovic 2011; Song et al., 2021b). The latter can be applied retrospectively, for example by subjecting the data to principal component analysis (PCA), which can also be considered as a form of ML, or principal component regression (PCR) (Jolliffe and Cadima 2016a). These operations reduce the dimensionality of the data and establish correlations between a dependent variable (e.g., an isotherm parameter) and independent variables (e.g., chromatography conditions) that were measured during the experiments. Alternatively, explorative data analysis can be used to identify potential correlations within the data ex post, for example visual inspection by a data scientist and process engineer or mathematical approaches such as independent principal component analysis (IPCA) (Yao et al., 2012a). The results can guide the selection of suitable models for subsequent parameter fitting. For example, linear or non-linear functions (Sahinidis 2019a) may be identified that describe the shape of chromatogram peaks, as shown using an exponentially-modified Gauss (EMG) function (Kalambet et al., 2011a), and the multiscale optimization of an antibody purification process (Liu and Papageorgiou 2019b). Data-driven models can also be designed in a structured manner by defining the corresponding experiments ex ante. A prominent example is the design of experiment (DoE) approach (Mandenius and Brundin 2008a; Hibbert 2012a; Ganorkar and Shirkhedkar 2017a; Möller et al., 2019a), in which data points are optimally positioned in a multi-dimensional space constrained by the independent variables to facilitate the fitting of a multiple linear regression (MLR) model of pre-defined maximal complexity (e.g., a cubic model). Once the experimental data have been collected, an analysis of variance (ANOVA) is conducted to remove non-significant terms from the model, unless required to maintain hierarchy (Peixoto 1987b). The resulting models can be used for the simple optimization of chromatography conditions and other separation operations based on the specific product, feed or resin, with little experimental and analytical effort. However, DoE (or more precisely, the underlying ANOVA and quality control tools) typically does not work well with heterogeneous data (e.g., non-normally distributed or non-homoscedastic data) and/or large datasets (>200 data points) that contain multiple, local optima, resulting in a complex surface (Osberghaus et al., 2012c).
For complex datasets, unsupervised, supervised and reinforced ML methods tend to perform better than classical statistics (Bishop 2016). Reinforced ML methods are currently of little interest in chromatography modeling because they require a feedback loop between the ML model and a physical experimentation unit generating new data, although this may become possible in the near future. Unsupervised learning can use, for example, PCA or a support vector machine (SVM) to reveal the internal structure of a dataset, thus facilitating a reduction in dimensionality. Supervised learning is currently the most suitable ML approach for chromatography modeling. Here, an initial dataset of independent and dependent variables, for example in the context of quantitative structure–activity relationship (QSAR) modeling (Tropsha and Golbraikh 2007b), is divided into a training set and a test set. The training dataset is used to train a mathematical model, and the model predictions can then be compared with the test dataset to assess the quality of the trained model, for example to detect overfitting (Bishop 2016). The model can be build using various approaches, including clustering methods such as artificial neural networks (ANNs), random forests or decision trees, but may also make use of regression for some operations, such as partial least squares regression, support vector regression (SVR), least absolute shrinkage and selection operator (LASSO) regression or ridge regression (Tibshirani 1996b; Dasgupta et al., 2011a). In this context, a major difference between statistical analysis and ML is that the latter often sacrifices interpretability (or explainability) in favor of the model’s predictive power (Song et al., 2021b), even though both ML and statistical analysis may perform equally well on some datasets. For example, area under the receiver operation characteristic (AUROC) curves have been compared for models predicting various diseases, revealing values of 0.736 (ML) vs. 0.748 (logistic regression) when predicting acute kidney disease (Song et al., 2021b), 0.837 (neural net models) vs. 0.836 (regression models) when predicting infraction mortality (Piros et al., 2019a), and 0.926 (ANN) vs. 0.869 (Cox regression) when predicting the outcome of COVID-19 (Abdulaal et al., 2020b).
Data-driven models have been widely used in the context of chromatography. In one case, the separation of herbal extract compounds was modeled by first using a DoE approach to generate experimental data and then correlating the responses with the separation conditions using a regular MLR model but also a SVM and ANN, all of which yielded similar predictions with a Pearson’s correlation coefficient r > 0.99 (Ge et al., 2021b). In another study, SVR was used to link the properties of synthetic nucleotides (e.g., hairpin structures) with their retention times on a phenyl column (Enmark et al., 2022a). The root-mean-square error (RMSE) between observed and predicted peak maxima was used as a model quality indicator for different types of gradients, and the corresponding determination coefficients for the training (R2) and test (Q2) datasets were >0.99, whereas an empirical logarithmic model achieved values as low as 0.93 (R2) and 0.85 (Q2) depending on the chromatography setting. Similarly, ML has been used to model the purification of inclusion bodies (Walther et al., 2022a) and antibodies (Robinson et al., 2017b), to predict antibody retention on a hydrophobic interaction chromatography (HIC) resin (Jain et al., 2017b), to improve peak detection (Chetnik et al., 2020a), and to predict the elution behavior of host cell proteins (HCPs) from an ion-exchange matrix (Buyel et al., 2013) as well as to fit SMA isotherm parameters (Jäpel and Buyel 2022).
The validation of data-driven models is important to prevent overfitting. A detailed analysis of quality assessment procedures for data-driven models is beyond the scope of this review, but typical elements include bootstrapping (resampling with replacement), k-fold cross-validation (leave-x-out, resampling without replacement) (Kim 2009b), y-randomization (y-scrambling, random assignment of the dependent variables to the dependent ones) and the use of an additional external dataset (independent of the test dataset) (Tropsha et al., 2003). The prediction and extrapolation or applicability domains of the model should also be defined to prevent inappropriate use (Tropsha et al., 2003; Gramatica 2007). It is important to note that data-driven models are typically only valid within the parameter space (or a fraction thereof) constrained by the elements in the training dataset, so they do not allow extrapolation (Tropsha and Golbraikh 2007b). Specifically, data-driven models cannot make de novo predictions because they cannot go beyond the content of the underlying dataset (Tropsha and Golbraikh 2007b), as is the case for protein structure prediction using AlphaFold (Jumper et al., 2021). Accordingly, the test dataset should be within the applicability domain of the training dataset. Despite these quality assurance measures, it can be difficult to reproduce specific ML results because there are many different meta-parameters to select, which is why reproducibility standards are often necessary to ensure reliability (Heil et al., 2021b).
Data-driven models could be improved in several ways in the future. For example, PCA is currently limited to datasets with 1000–2000 entries, which is considered ‘large’ (Vogt and Tacke 2001a; Rachakonda et al., 2016a), but is probably small compared to the anticipated results of high-throughput experiments and the content of community-based databases. Therefore, efficient ways will be required to handle ‘big data’, such as healthcare patient data (Ahmed et al., 2021a; Dong et al., 2021b).
2.2 Mechanistic models
In contrast to purely data-driven descriptive models, mechanistic models aim to simulate actual physicochemical mechanisms based on mathematical equations and, once calibrated with a defined set of bind-and-elute gradients and breakthrough curves (Section 4.2), such models allow the extrapolation of separation processes in silico for conditions outside the parameter space tested experimentally (Benner et al., 2019; Kumar and Lenhoff 2020).
In order to set up a mechanistic chromatography model for a specific set of conditions, e.g., resin and ligand type, column dimensions and operation parameters as well as proteins to be separated, equations for mass transfer and sorption must be defined. Mass transfer has been studied in detail and can be described precisely using different formulae, such as the transport dispersive model (TDM), equilibrium dispersive model (EDM) or the general rate model (GRM), the latter probably being the most prominent and widely used (Schmidt-Traub 2006; Shekhawat and Rathore 2019). Other mechanistic models describing the mass transport include the transport model, reactive-dispersive model and modified versions of the GRM such as the Thomas model (also referred as kinetic model) (Table 1). For example, the Thomas model describes the convective transport and adsorption rate kinetics while neglecting axial dispersion and mass transfer kinetics such as external and internal diffusion (Cavazzini et al., 2002; Shekhawat and Rathore 2019). The GRM captures mass transport processes both outside resin pores (Eq. 1, inter-particle mass balance) and within them (Eq. 2, intra-particle mass balance) during packed-bed chromatography.
where ci is the concentration of colloid i, u is the linear inter-particle fluid velocity in the axial orientation z, Dax is the axial dispersion coefficient, εi is the inter-particle porosity, rp is the resin particle radius, factor 3/rp accounts for its surface-to-volume ratio, kf,i is the effective linear flux (i.e., volumetric flow rate divided by column cross-sectional area and inter-particle porosity) through the stagnant film zone around the stationary phase beads, and cp,i is the mobile phase concentration of particle i2.
where ∂cp,i/∂t is the concentration change of colloid i in the porous bead over time, Dp,i is the pore diffusion coefficient of component i, with resin particle radius r, εp is the intra-particle porosity, and ∂qi/∂t is the change in surface-bound component i over time. Whereas the inter-particle mass balance accounts for convection, dispersion and film mass transfer, the intra-particle mass balance represents pore diffusion processes inside the mostly spherical particles of the stationary phase and the sorption of colloid i to the surface, which is defined by the corresponding isotherms. The calculation becomes more complex if the two-dimensional general rate model (GRM2D) is used, which includes a radial coordinate to consider non-axial transport resulting from inhomogeneous resin packing or dispersion at the frits of the column inlet (Brhane et al., 2019). This mass transport model is already implemented in some modeling software3. The complexity can be reduced by using a modified lumped rate model that excludes intra-particle protein binding4.
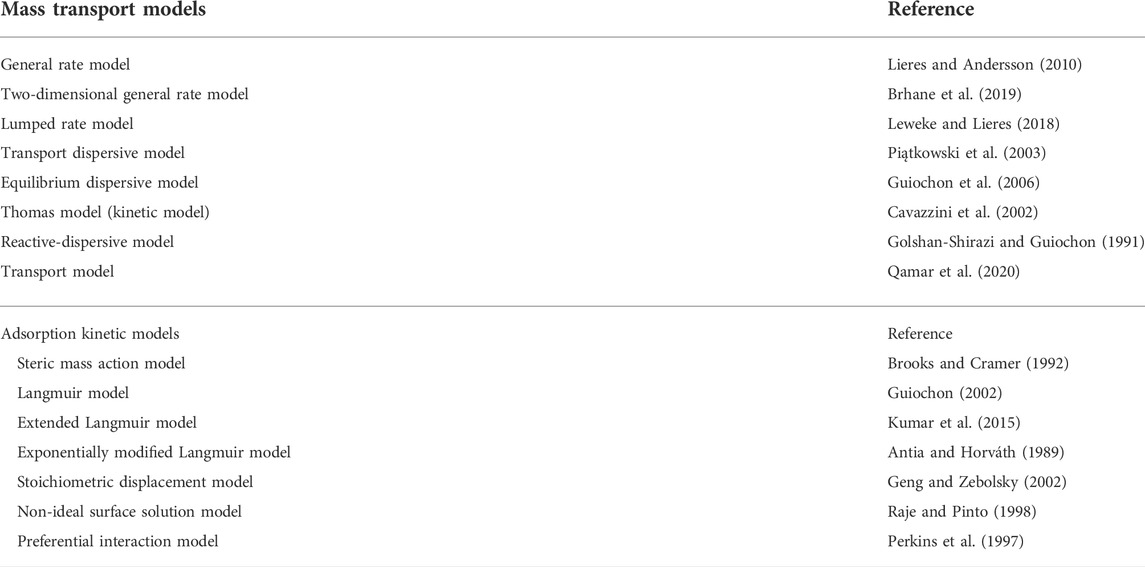
TABLE 1. List of mass transport models and adsorption kinetic models for the mechanistic modeling of the protein transport and adsorption during chromatography-based purification processes.
In addition to general isotherms such as the Freundlich formalism and Langmuir adsorption model, specific isotherms have been developed to account for different types of chromatography. Examples are the stoichiometric displacement model, the non-ideal surface solution model and preferential interaction model (Table 1). Often, modified versions of kinetic equations are used to reduce or increase the complexity of the mechanistic model e.g., as shown for the extended Langmuir model or exponentially modified Langmuir model (Table 1). The SMA model is often used to describe sorption during ion exchange chromatography (IEX) and specifically accounts for the salt concentration, number of interacting ligands, and steric shielding of the ligand by bound proteins (Parente and Wetlaufer 1986; Degerman et al., 2007; Osberghaus et al., 2012a; Bernau et al., 2021). Currently, more than 15 isotherms are available for the description of chromatography modalities such as IEX and HIC (Guo et al., 2020; Kumar and Lenhoff 2020; Saleh et al., 2021a; Saleh et al., 2021b; Kumar et al., 2021) as has been reviewed elsewhere (Wang et al., 2016; Shekhawat and Rathore 2019). In contrast, few isotherms are available for mixed-mode or multi-modal chromatography (MMC), probably due to the yet incomplete understanding of the mechanistic basis of this process (Kumar and Lenhoff 2020) and/or because the corresponding resins are often used in flow-through mode to bind HCPs.
The implementation of mathematical models requires software solutions in order to set up and calibrate the model before in silico prediction (Schmölder and Kaspereit 2020). The Chromatography Analysis and Design Toolkit (CADET) is a fast and accurate solver and chromatogram simulator that covers a wide range of models, including GRM variants such as GRM2D and reduced variants of the lumped rate model (Leweke and Lieres 2018; Leweke et al., 2020; Narayanan et al., 2021b). Commercially available counterparts include Cytiva’s GoSilico Chromatography Modeling Software (Briskot et al., 2021) and ChromWorks from YPSOFacto (Kaspereit and Schmidt-Traub 2020; Schmölder and Kaspereit 2020)5.
As for data driven models, performance can be assessed by comparing experimental data and simulation results, for example based on the sum of the squared errors (SSE) between the training and validation datasets. Other verification methods like the R2 and the RMSE have been described (Rajamanickam et al., 2021). Model predictions can be improved by augmenting chromatography models with parameters that account for specific physiochemical effects. For example, the SMA isotherm can be expanded to account explicitly for the impact of pH, and protein-specific pore accessibilities may be included in the GRM (Bowes et al., 2009; Coquebert de Neuville et al., 2013; Saleh et al., 2020; Frank et al., 2022)6. However, with an increasing number of model parameters even mechanistic models can be overfitted as experimental noise may unduly affect parameter calibration (Rajamanickam et al., 2021). Such overfitting often results in extreme model predictions and poor generalization (Steyerberg 2019). Furthermore, isotherm parameters may become difficult to identify unambiguously based on the experimental data, as discussed in the next section.
2.3 Hybrid models
It may be possible to combine ML with the knowledge-based components of mechanistic models to form hybrid models, as discussed for the multi-scale modeling of biological systems (Alber et al., 2019) and applied to the informed selection of DoE parameter ranges (Joshi et al., 2017; Möller et al., 2019a). A comparison of data-driven and mechanistic models in the context of chromatography has revealed that the former are fast and accurate within their design space with little experimental effort and simple analysis, but cannot extrapolate beyond these boundaries, whereas mechanistic models can extrapolate and achieve accurate predictions well beyond the characterized parameter space, but require much more effort to calibrate and solve (Osberghaus et al., 2012c).
Hybrid models combine data-driven, descriptive models with process knowledge captured in mechanistic models (Stosch et al., 2014). They provide better process understanding and allow extrapolation, with less demand for data quality and quantity compared to purely data-driven models (Glassey and Stosch 2018). Hybrid models also enable the use of mechanistic knowledge if the prerequisites for purely mechanistic models are not met, meaning that the mechanisms are insufficiently established in equations (Solle et al., 2017). Hybrid models described in the literature are predominantly used for upstream production (Stosch et al., 2016; Simutis and Lübbert 2017), with only a few examples of hybrid modeling in DSP (Narayanan et al., 2021b; Narayanan et al., 2021a): Namely, Narayanan et al. learned the chromatographic unit behavior by a combination of neural network and mechanistic model while fitting suitable experimental breakthrough curves (Narayanan et al., 2021b), Joshi et al. (Joshi et al., 2017) used a mechanistic model to simulate the analytical separation for the DOE and build with the results an empirical model, and Creasy et al. (Creasy et al., 2019) learned the adsorption isotherm model from batch isotherm data by using interpolation techniques.
During the development of chromatography-based purification processes, hybrid models can be used to accelerate the tedious experimental adjustment of parameters for mechanistic models (Narayanan et al., 2021a) or to reduce the quantity of data required for their calibration (Solle et al., 2017). For example, parameters of a mechanistic model such as the SMA isotherm can be predicted by a data-driven QSAR model using a small training dataset (∼30 proteins for which the SMA parameters have been determined experimentally).
3 Challenge I: Communication barriers can slow down interdisciplinary research
The implementation of chromatography models that account for the biochemical and physicochemical properties of a system while following the rules and operations of algebra requires a bidirectional exchange of knowledge between experimenters and data scientists. This can be hampered by differences in problem solving approaches, limited knowledge about the possibilities and limitations of the complementary scientific domain, and the use of discipline-specific terminology and jargon (Bracken and Oughton 2006; Bowman 2007; Monteiro and Keating 2009). For example, the term “transformation” has multiple distinct meanings in biology, chemistry, physics and mathematics, and it may not always be clear which sense is implied in a multidisciplinary context. There may also be differences in the interpretation of terms (e.g., a biologist may think of a certain descriptor as a scalar, whereas a data scientist may consider it also as a vector or a matrix) and in the conceptualization of tasks (e.g., experimenters typically do not think of scientific tasks as formulae, algorithms or models, whereas this is the typical expectation of mathematicians and data scientists). Finally, data scientists tend to focus on abstract, general and fundamental solutions to a (mathematical) problem, whereas process engineers focus on only those aspects of the solution that can be applied in practice. In the context of this review, interdisciplinary discussions were triggered by discrepancies affecting data quantity, quality and presentation, which can create fundamental tension in the design and analysis of experiments and subsequent model building (Pischke et al., 2017). Accordingly, high-quality models depend on a common language and the mutual understanding of interdisciplinary topics. Establishing such a language is probably the first challenge but also a major contributor to the success of chromatography modeling endeavors.
4 Challenge II: Obtaining experimental data to set up the model
4.1 Properties of the chromatography system and column
4.1.1 Porosity and pore size distribution
A fundamental understanding of mass transport and binding equilibria is needed to establish models that can predict protein separation in silico (Miyabe and Guiochon 2003; Buyel et al., 2013; Vecchiarello et al., 2019; Kumar and Lenhoff 2020). Importantly, the corresponding parameters are interdependent during model calibration. For example, an inaccurately determined column porosity can distorted the value calculated for the equilibrium constant when fitting a chromatography model to a given peak (Heymann et al., 2022). Various methods have been proposed to determine equilibrium parameters (Shukla et al., 1998; Osberghaus et al., 2012a; Bernau et al., 2021) but the experimental determination of different types of liquid volumes in columns remains challenging, especially for packed-bed chromatography using porous, spherical beads as the stationary phase. These liquid volumes consist of inter-particle and intra-particle components (Figure 1) (Frank et al., 2022). When combined with the total (geometric) column volume and the particle solid volume, they can be used to calculate the inter-particle porosity (also known as column porosity) and the intra-particle porosity (also known as particle porosity). The latter values are needed to solve the partial differential equations of rate models that describe mass transport around the stationary phase (Wiesel et al., 2003; Orellana et al., 2009; Ghosh et al., 2014) and they can be combined with isotherms to model the binding of proteins (Brooks and Cramer 1992; Wang et al., 2016).
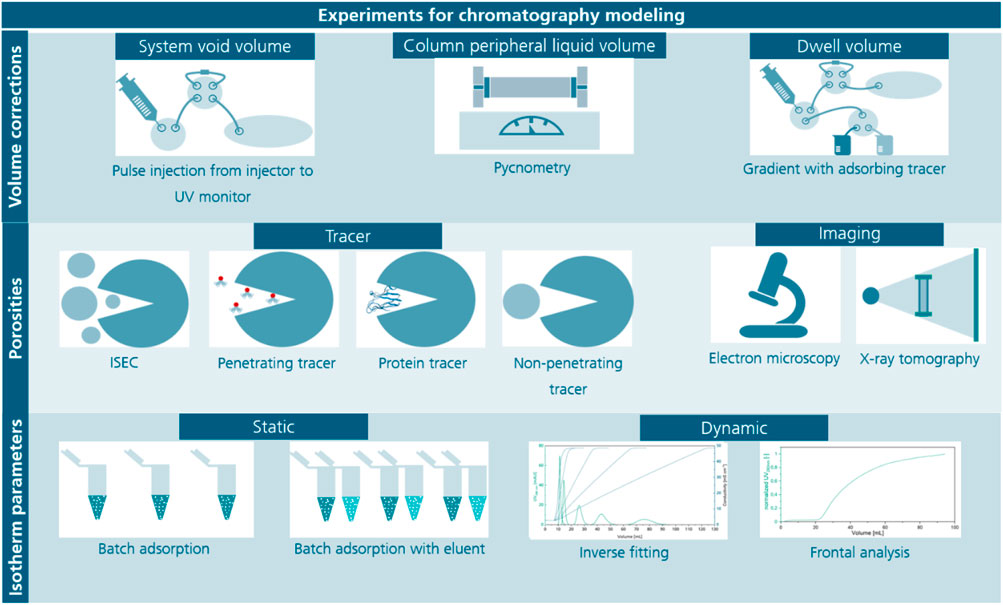
FIGURE 1. Overview of experiments for the determination of volume corrections of the chromatography system, porosities and isotherm parameters. Several volume corrections during chromatography modeling are necessary, here the most common methods are listed being pulse injections using an adsorbing tracer for the system void volume, pycnometry where the mass of the empty and water filled column is measured to determine the column peripheral liquid volume and the determination of the dwell volume using gradients with an adsorbing tracer while replacing the column with a zero-volume connector or a capillary restrictor. Methods for the determination of porosities are either a set of methods using different sized tracers, inverse size-exclusion chromatography (ISEC) or imaging methods such as electron microscopy or X-ray tomography, which require special equipment and complex evaluation. Tracers can be pore penetrating tracers or non-penetrating tracers either protein-based or synthetic. Lastly, methods for isotherm parameter determination mainly differ in static or dynamic approaches, which have individual advantages as suitability for screening (static) or high portion of information (dynamic).
Whereas mass transfer around the particles is considered rapid because the mobile phase has a velocity of up to 7 m h-1 (Hahn et al., 2003a; Hahn et al., 2003b; Boi et al., 2020), diffusion into the resin pores is often assumed to be the rate-limiting step when a protein binds to the stationary phase (Schultze-Jena et al., 2019). Accordingly, resin particles with large pores, such as POROS with a pore diameter of up to 0.22 µm (Zhang et al., 2017), have been developed to increase pore diffusion while reducing steric hindrance (Anspach et al., 1989; Matlschweiger et al., 2019). Some manufacturers have also added porosity data to their documented resin specifications, which previously reported only the (dynamic) binding capacity, approximate particle diameter and average pore size. However, the information may not be available beforehand (i.e., for appropriate column selection) or may be limited to specific column types, such as f(x) columns (Cytiva, Sweden). This is why many researchers determine porosities experimentally, for example by combining small fully-penetrating tracers that can access all resin pores (such as acetone or salts) with non-penetrating tracers (such as dextran or spherical nanoparticles) that do not penetrate the resin pores at all (Halász and Martin 1978; DePhillips and Lenhoff 2000; Frank et al., 2022). Although such experiments can determine absolute porosities, they generally do not fully represent the pore fraction and thus the resin surface area available for the binding of macromolecules such as proteins, which partially penetrate the pores during separation (Table 2) (Pfister et al., 2015).
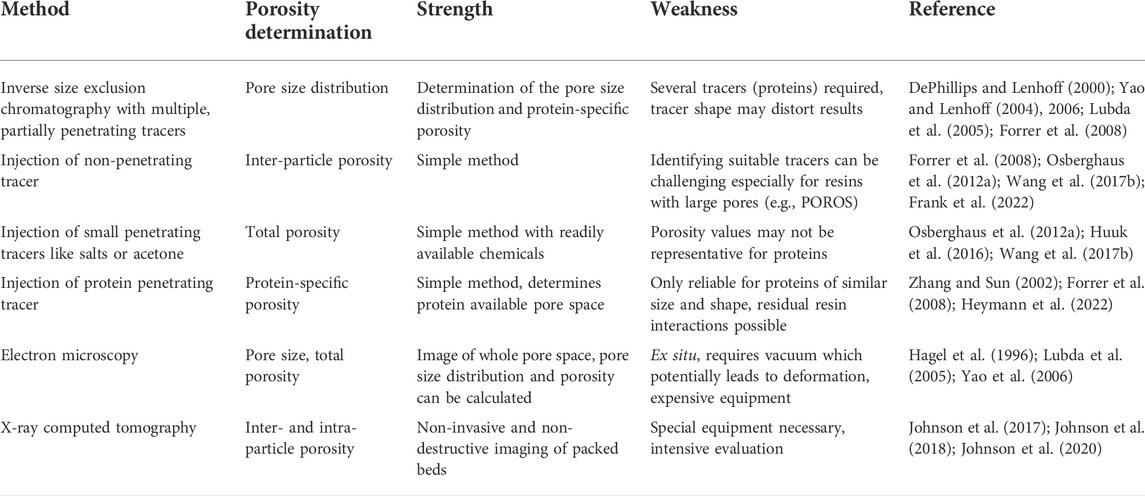
TABLE 2. Methods described in the literature for the determination of different column porosities.
Additional information is therefore required during modeling to make correct assumptions about parameters that are likely to be size-dependent and thus protein-specific, for example the ionic capacity (Λ) of the SMA model isotherm (Brooks and Cramer 1992). If not taken into account, the incorrect ionic capacity may be lumped into other parameters like the shielding factor σ (also known as the steric factor) during parameter fitting. This may be acceptable for certain chromatography settings, but could substantially distort model transfer during scale-up or switchover to another resin matrix. A pore size distribution would provide much more information in this context and has been determined for some resins (Yao and Lenhoff 2006).
Probing a packed column and resin with authentic proteins under non-binding conditions can provide information about the protein-specific accessible pore volume, which is essentially the same principle as size-exclusion chromatography (SEC) (Franke et al., 2010; Hong et al., 2012). One challenge during this type of analysis is the assignment of a size to the test proteins, due to (unexpected) oligomerization and/or non-spherical shapes, which might allow a protein to “squeeze” into pores smaller than their apparent hydrodynamic radius (Osberghaus et al., 2012b). The analysis of resins by electron microscopy can also reveal pore size distribution information (Zhu and Carta 2015), but the experimental conditions and results may not be comparable to those under authentic operational conditions due to the swelling, shrinking or deformation of the resin triggered by the media composition or compression during packing and operation (Conway and Sloane 1995; Nicoud 2015; Frank et al., 2022).
4.1.2 Resin packing and wall effects
The deformation of resin particles after column packing is indicated by the experimental inter-particle porosities of ∼12% (Frank et al., 2022), which is below the theoretical threshold of ∼26% for densely packed spheres (Conway and Sloane 1995). Such deformation can be expected because column packing typically involves linear flow rates of up to 7 m h−1 (Boi et al., 2020), which compress the resin particles beyond the point achieved by gravity settlement alone, typically by a factor of 1.15 for synthetic polymer resins (e.g., based on methacrylic polymers) that are considered to be semi-rigid (Baru 2003; Lee et al., 2015; Gebauer and Tschöp 2018). Although such packing stabilizes the chromatography bed (Dorn et al., 2017), it occurs predominantly at the inlet and outlet of the column (Dorn and Hekmat 2016; Dorn et al., 2017), thus distorting the flow regime in these regions. The analysis of fluid dynamics in packed beds can account for some degree of resin particle polydispersity (Shalliker et al., 2002; Püttmann et al., 2014) but the non-spherical shapes caused by dense packing are generally not considered (Bouhid de Aguiar et al., 2017). Importantly, ideal packing with uniform resin compression and the uniform arrangement of beads across the entire bed is impossible due to wall effects. These cause larger void volumes close to the column wall, where steric hindrance by the column corpus and friction increase the probability of random loose packing (Shalliker et al., 2000; Jin and Makse 2010; Bruns et al., 2012). In contrast, beads at the center of the columns can align freely and adopt a more ordered structure (Martinez et al., 2019). Accordingly, packing can be distorted in both the axial and radial directions (Figure 2). Such distortion is a topic of current research (Johnson et al., 2017; Dolamore et al., 2019; Johnson et al., 2020), and the results are included in some chromatography modeling environments such as CADET7. Anisotropic packing densities may limit the transferability of models calibrated on small-scale columns to process-scale equipment because the surface-to-volume ratio (and thus wall effects) will decrease with increasing scale (Püttmann et al., 2016). This scale effect is further aggravated by a decreasing column aspect ratio (height-to-diameter ratio) as the scale increases (Prentice et al., 2020).
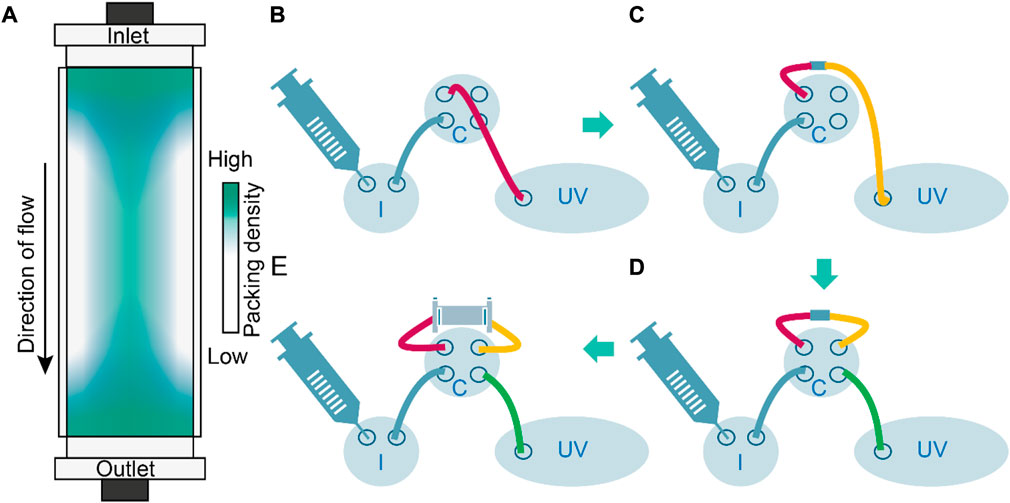
FIGURE 2. Column density distribution and analysis of pre and post-column void volumes to assess axial dispersion caused by instrument components. (A) Schematic representation of the resin density distribution in a packed-bed column. Packing is densest in the column center, especially at column inlet and outlet whereas wall effects reduce the density. (B) Determination of void volume and axial dispersion up to the column inlet by connecting injection valve I and column valve (C) through a column inlet tube (red) directly to the UV monitor (UV); Vpre-column = 21.7 × 10⁻⁵ L. (C) Determination of void volume and axial dispersion up to the column outlet by augmenting the setting in B with a column outlet tube (yellow) and a zero-volume connector; Vcolumn_outlet = 22.8 × 10⁻⁵ L. (D) Determination of void volume and axial dispersion using a bypass setting (zero volume connector instead of a column) including a connection from column valve to UV monitor (green); Vzero_volume_connector = 30.0 × 10⁻⁵ L. (E) Determination of axial dispersion using a regular flow path including the column including the column peripheral liquid volume; Vcolumn_outlet = 106.6 × 10⁻⁵ L.
4.1.3 Volume corrections in chromatography modeling
Axial dispersion of solute peaks occurs in the packed bed of a column but also in column and system void volumes, also known as the system dead volume or column extra volume (Marek et al., 2018). This encompasses the liquid volumes contained in the tubing connecting the injector to the column inlet, and the column outlet to the UV detector, and liquid volumes within valves. A high system void volume increases the axial dispersion of an ideal rectangular plug injection outside the column, causing it to broaden into a Gaussian curve, ultimately reducing column efficiency (Iurashev et al., 2019), which is often defined through a (hypothetical) plate number N, a concept derived from distillation (Eq. 3):
Where Ni is the number of plates in a column, tR,i is the retention time of compound i and w0.5,i is the corresponding peak width at half-height.
Based on a typical tubing diameter of 0.5 mm for fast protein liquid chromatography (FPLC) and a total tubing length of 321 mm, the system void volume contributed by the tubing is 6.3 × 10⁻⁵ L, which is minor compared to the system void volume contributed by injection and column valve (22.7 × 10⁻⁵ L ± 0.2 × 10⁻⁵, based on our measurements, n = 3) (Table 3). The dispersion caused by the system void volume is, however, negligible (<5%) for mass transfer parameters (e.g., molecular diffusion coefficient and effective particle diffusivity) (Gritti et al., 2006; Gritti and Guiochon 2014a). Still, this volume can become more relevant for efficient columns with >120,000 plates m−1, such as those used in ultra-high performance liquid chromatography (UHPLC), where it can reduce column efficiency 2.5-fold and ignoring it would substantially distort any chromatography model (Gritti and Guiochon 2014a). Accordingly, accounting for the individual sources of axial dispersion improves the scale-up and transferability properties of the models.
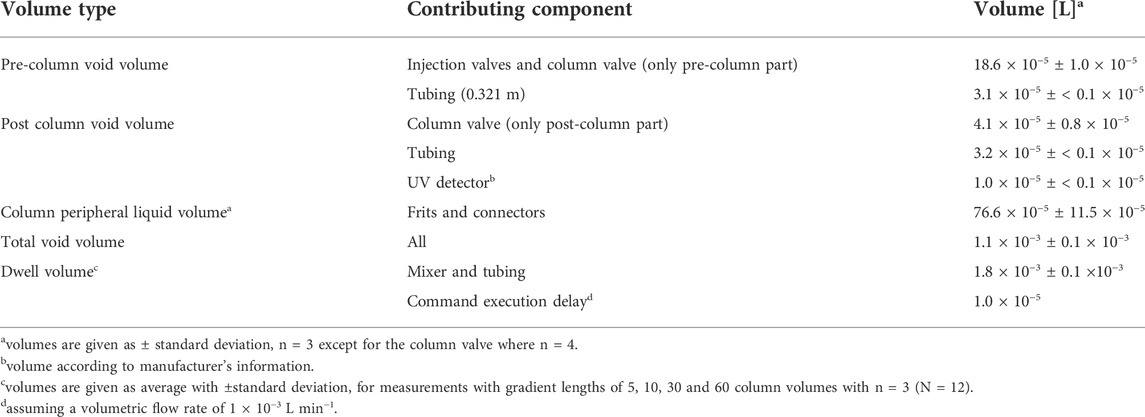
TABLE 3. Examples of system and column peripheral liquid volume as determined for an ÄKTA pure 25 L (nonstandard equipment: column valve kit V9-C and 5 mm UV flow cell) system equipped with an XK16/20 column (16 mm diameter, maximum bed height 200 mm).
The system void volume is usually determined by replacing the column with a zero-volume connector and then injecting an acetone pulse (Schmidt-Traub et al., 2012; Marek et al., 2018; Desmet and Broeckhoven 2019; Bernau et al., 2021). The system void volume can then be calculated by multiplying the time difference between injection and detection at a UV monitor by the volumetric flow rate. By repeated executions of an according experimental method we found that the system void volume was 30.0 × 10⁻⁵ ± 0.2 × 10⁻⁵ L (n = 3). The corresponding coefficient of variation of 0.6% indicated a high reproducibility. The zero-volume connector method lumps dispersion by pre-column and post-column volumes into a single value (Vanderheyden et al., 2016; Desmet and Broeckhoven 2019). This can cause a systematic error of up to 60% for the axial dispersion (Gritti and Guiochon 2014b; Vanderheyden et al., 2016). Nevertheless, this effect is reduced if the system is operated in bind-and-elute mode due to the peak focusing effect of the packed bed (Prüß et al., 2003; Hong and McConville 2018) increasing the relevance of the dispersion by post-column volumes.
Alternatively, the pre-column and post-column volumes can be determined separately by stepwise addition of instrument components and respective void volume measurements (Figure 3) (Gilar et al., 2017; Desmet and Broeckhoven 2019). Other approaches determine the column-based dispersion first, then subtracting it from the overall dispersion to calculate the system-related dispersion (Desmet and Broeckhoven 2019).
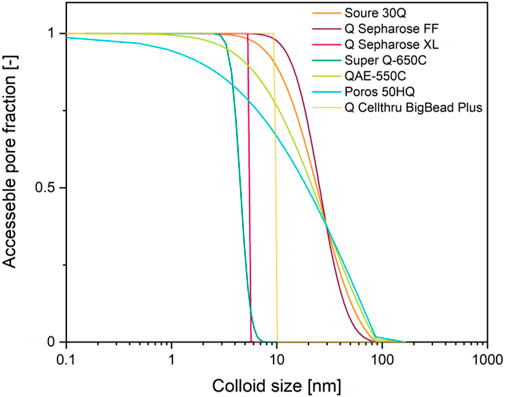
FIGURE 3. Accessible pore fraction as a function of colloid size and depending on the pore size distribution of common anion exchange resins. Pore size distribution data (Yao and Lenhoff 2006) were used to build a cumulative sum and then normalized using the highest value.
The column dispersion can be determined by injecting a fluorescent analyte onto a column and then quantifying the band broadening between column inlet and outlet (Evans and McGuffin 1988). The system dispersion can be obtained by measuring the total dispersion as a function of column bed height (i.e. for columns of different length) and extrapolating this function to a bed height of zero (i.e. the y-intercept) (Roper and Lightfoot 1995; Guo and Frey 2010). However, these methods require special equipment such as a pre-column fluorescence detector or several columns and are often labor intensive (Evans and McGuffin 1988; Desmet and Broeckhoven 2019).
An additional volume that is important but often overlooked during chromatography modeling is the column peripheral liquid volume (Table 3), which includes the liquid volume in the frits and connectors at the column inlet and outlet (Gritti et al., 2015). This volume can be measured by pycnometry, which in this case is weighing an empty column equipped with frits but devoid of resin and weighing the same column filled with water (Jiang et al., 2014). The column peripheral liquid volume then corresponds to the mass difference multiplied by the density of water at the experiment temperature, minus the packed-bed volume (Marek et al., 2018). This method is straightforward in principle but can be challenging in practice if the bed height needed to calculate the packed-bed volume is difficult to determine. For example, an uncertainty of 0.5 mm in bed height measurement for a column 16 mm in diameter with a bed height of 155 mm (3.1 × 10⁻² L bed volume) causes a volume difference of 2 × 10⁻⁴ L, which corresponds to ∼26.2% of the actual column peripheral liquid volume. The bed height may be well known for pre-packed columns but it may be difficult to obtain empty reference columns for comparison, i.e., empty but assembled columns in pre-packed format are often not available by manufacturers. Ultimately, the influence of the column peripheral liquid volume depends on the ratio of the column peripheral liquid volume to the bed volume. For an XK 16/20 column, i.e., a column with 16 mm diameter and a maximum bed height of 200 mm, this ratio can vary from 0.767 for a bed volume of 1 ml to 0.024 for the maximum bed volume of 3.1 × 10⁻² L.
Finally, the initiation of an elution gradient will involve some delay, also known as the dwell volume, between the execution of the command in the system control software and the formation of the elution gradient in the column (Guillarme et al., 2008). The processing time in the software is negligible [<50 ms (Aichernig et al., 2019)], so the delay predominantly results from the physical distance between the mixer outlet and the column inlet as well as the diameter of the tubing used to bridge this distance (Table 3). The dwell volume is often measured using two solutions, one with and one without a UV-adsorbing tracer. The latter is used at first to equilibrate the chromatography system with all columns detached. Then, the tracer-containing solution is injected to form a gradient of desired length (Bos et al., 2021). The time delay between gradient initiation and the increase in UV signal is multiplied by the volumetric flow rate to derive the dwell volume. This volume is then used to correct the time shift between the programmed and actual gradient onset in order to obtain retention volumes or times that are comparable in terms of the solvent composition across different system settings (Silver 2019).
4.2 Protein-specific isotherm parameters
The use of pure proteins for bind-and-elute experiments, which are needed to determine the protein-specific parameters of binding kinetics like the equilibrium constant between the protein and stationary phase, can improve the reliability of parameter determination (Borrmann et al., 2011; Wang et al., 2017a; Moreno-González et al., 2021). Such experiments can be conducted using static or dynamic methods (Figure 1). In static methods, protein dilution series of known concentrations are exposed to defined quantities of resin, for example in a 96-well plate format, for a period of time considered sufficient for protein binding to reach a steady-state equilibrium (Ghose et al., 2007; Moreno-González et al., 2021), often 24–48 h. The protein concentrations in the supernatant are then determined, and any differences compared to the starting concentrations are used to determine equilibrium constants of (static) binding (Guiochon 2002; Seidel-Morgenstern 2004). The calculation can be improved by closing the protein mass balance, for example by washing the resin, then adding an eluent and measuring the protein concentration in this liquid fraction (Seidel-Morgenstern 2004). Whereas the general workflow is simple, the implementation can be prone to errors because it is difficult to aliquot resins in a reproducible manner and to account for residual liquids that unintentionally cause dilution, for example due to the sedimentation of resin particles (Coffman et al., 2008). Such static methods often lack precision, but the main drawback is that, by design, the equilibrium constant is determined for static conditions that are not representative of the dynamic binding that occurs during process-scale chromatography, reflecting the continuous flux of the mobile phase through a packed-bed, monolithic or membrane-based column (Nachman et al., 1992; Ostryanina et al., 2002; Ghose et al., 2007; Carta 2012; Faraji et al., 2015). When comparing literature data (Table 4), binding capacities obtained from batch adsorption are ∼1.5-fold higher compared to the same constants determined under dynamic conditions. Therefore, batch adsorption is often used for initial screening experiments but not to calibrate the chromatography models (Khosravanipour Mostafazadeh et al., 2011; Moreno-González et al., 2021).
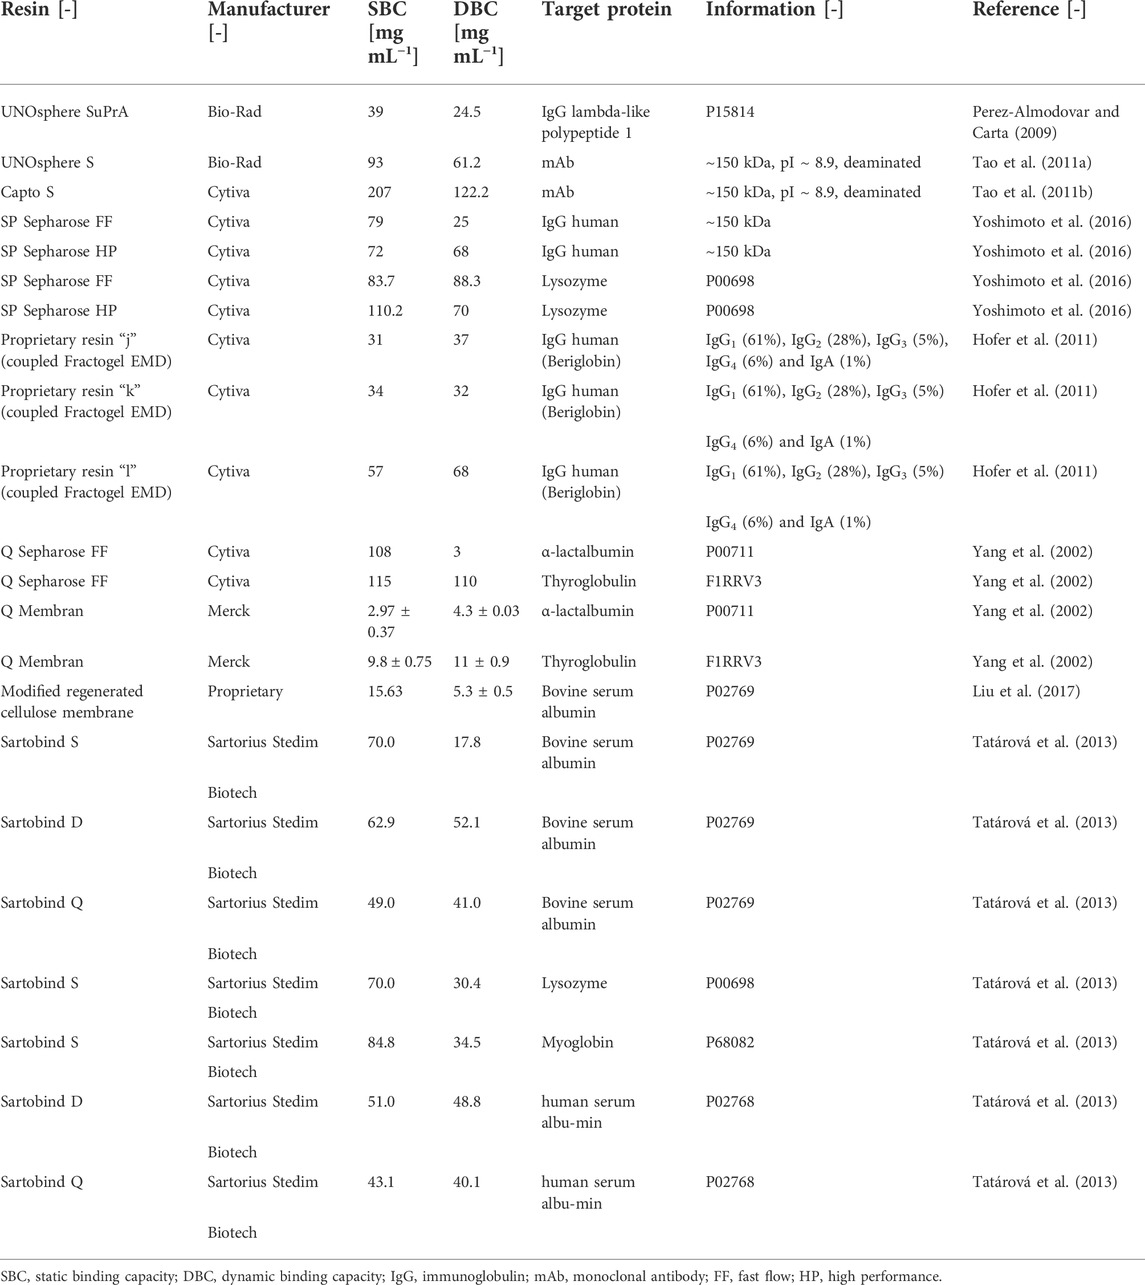
TABLE 4. Static and dynamic binding capacities obtained for different target proteins and chromatography resins.
Dynamic methods require fewer experiments than static methods, but rely on a continuous flux applied over the (packed-bed) column and the protein concentration at the column outlet must be measured over time, for example during elution. Expensive equipment is also necessary, typically an FPLC system (e.g., ÄKTA series devices) and corresponding analytics such as in-line UV and conductivity determination (Seidel-Morgenstern 2004; Luca et al., 2020; Kumar et al., 2021). One widely-used approach is the inverse method (Osberghaus et al., 2012a; Hahn et al., 2016a; Hahn et al., 2016b), which fits isotherm parameters to an experimental elution peak by minimizing the discrepancies between experimental and simulated peaks (Dose et al., 1991; Leweke and Lieres 2018). Typically, two chromatograms are necessary to fit, for example, the equilibrium constant keq and the characteristic charge ν of the SMA isotherm (Osberghaus et al., 2012a; Bernau et al., 2021). The amount of protein required for such an experimental series is ∼0.6 mg, depending on the quality of the UV monitor. Using competitive isotherms for multicomponent elution as well as fluorescent proteins or tags alleviates the need for highly pure protein during model calibration (Seidel-Morgenstern 2004; Baumann et al., 2015). In our hands, purities of >50% are typically required to obtain a Gaussian curve-shaped peak for fitting (Bernau et al., 2021), yet higher purities may be necessary depending on the type, number and individual abundance of non-target protein impurities. The presence of such impurities may result in shoulders or even several peak maxima, which in the simplest case can falsify the fitted transport parameters, and in the worst case can result in incorrect protein-specific isotherm parameters due to the selection of inappropriate peak properties, e.g., maxima, for fitting (Pirrung et al., 2018). Nevertheless, the inverse method can determine parameter values for multicomponent isotherms, even for separation factors of 0.9–1.1 (Kaczmarski 2007; Hahn et al., 2016a), if the corresponding proteins do not interact with each other.
Elution experiments for inverse fitting can be complemented with frontal experiments, where a column is loaded until protein breakthrough, to increase the precision of parameter values or to determine additional model parameters such as the shielding factor of the SMA isotherm (Osberghaus et al., 2012a). The latter requires no limitation on liquid film and pore diffusion mass transfer, which would otherwise distort the chromatogram shape and thus the isotherm parameter values (Persson et al., 2004; Seidel-Morgenstern 2004; German 2012). If frontal analysis alone is used for isotherm parameter determination, multiple breakthrough experiments are needed spanning a range of feed protein concentrations (e.g., 1–100 mM) to determine corresponding stationary phase concentrations at equilibrium (Andrzejewska et al., 2009; Kamarei et al., 2014). Each stationary phase concentration represents a data point for the fitting of isotherm parameters. However, frontal experiments often require 50–200 mg of pure protein per run (Yao and Lenhoff 2006; Hardin et al., 2009; Lin et al., 2016) when using common 1-ml columns, and this amount can be difficult to generate, especially during early process development. Data analysis is also more complex for dynamic methods. Typical office computation power can be sufficient for the parameter fitting task, but the specific approach can have a substantial impact on the precision and speed of the parameter fitting (Section 5.2.1) (Saleh et al., 2020; Jäpel and Buyel 2022).
5 Challenge III: Effects not yet represented in chromatography models
Until recently, chromatography modeling largely focused on the development of formulae that adequately describe mass transfer and protein sorption, such as mechanistic descriptions of isotherms, pore diffusion and film diffusion (Gotmar et al., 1999; Miyabe and Guiochon 2003; Kumar and Lenhoff 2020; Schmidt-Traub et al., 2020). As chromatography models evolve, attention is increasingly shifting from these broad topics to finer details such as resin batch-to-batch variability, scalability, and the transferability of models to resins with the same ligand but a different particle size, pore size (distribution), linker chemistry or base matrix (Bernau et al., 2021). These aspects influence model robustness, thus affecting regulatory compliance (Saleh et al., 2021c) and transferability, because the experiments required to set up such models are laborious (Saleh et al., 2020). For example, reducing the particle size by a factor of 0.6 will typically increase the resolution (Eq. 4) and separation factor by 1.4 (Eq. 5) (Biba et al., 2014), whereas inter-particle porosity is likely to decrease due to an increase in packing density reflecting the lower particle diameter (Sohn and Moreland 1968).
Where Rs is the resolution of the solutes achieved with the chromatography setting, tR1 and tR2 are the retention times of solutes 1 and 2 respectively, with solute 1 eluting first, wb1 and wb2 being the corresponding peak widths at baseline, and α is the separation factor.
However, correlations between particle size and changes in resolution can be predicted, for example by calibration using multiple columns packed with same resin of the same ligand and matrix type but different particle sizes. It can be difficult to account for changes in pore size (distribution) a priori because mass transfer into and within resin pores is a limiting factor, which in turn is highly specific to the molecules that are separated (Persson et al., 2004; Wang et al., 2017b). The effects of resin matrix chemistry, such as shortening the spacer arm of Sepharose FF to increase protein retention (DePhillips et al., 2004), should be addressed in future experiments because all chromatography model isotherms that we are aware of are limited to protein–ligand interactions, thus assuming resin matrix inertia (Brooks and Cramer 1992; Nfor et al., 2010; Wang et al., 2016; Schmidt-Traub et al., 2020). Accordingly, any matrix effect would be lumped into the isotherm parameters, limiting the transferability of the model as discussed above.
In this context, chromatography models also do not account for the indirect binding of proteins. For example, some host cell proteins (HCPs) bind to recombinant protein products such as monoclonal antibodies, and then co-purify during chromatography, not because the HCPs bind to the ligand, but due to their interaction with the recombinant protein, a phenomenon known as ‘hitchhiking’ (Baik et al., 2019). Unexpected mass transfer limitations due to the restricted pore diffusion may reflect the presence of a hitchhiking protein because the protein–protein interaction will increase the apparent size of the target protein. The modeling of hitchhiking phenomena would be useful in the context of biopharmaceutical process development because the abundance of hitchhiking HCPs in a purified recombinant protein can form part of the quality product profile, representing a critical quality attribute (Baik et al., 2019; Mouellef et al., 2021). Accounting for hitchhiking would require that protein–protein interactions are routinely included in chromatography models. This can be achieved to some extent using docking software as long as information is available about the structure of the HCP during separation (Busetta et al., 1983; Kitchen et al., 2004; Ciemny et al., 2018; Bitencourt-Ferreira et al., 2019), but this requires long computation times of up to 11 h (Moal et al., 2017; Porter et al., 2019). Although protein structures are increasingly accessible, for example a priori predictions generated by AlphaFold (Jumper et al., 2021), the entire workflow can be prohibitively time-consuming and expensive given that several hundred HCPs may be present in the feed in addition to the target protein, especially if the host cells have to be disrupted (Buyel et al., 2013; Joucla et al., 2013; Park et al., 2017).
Another effect that is rarely accommodated in modeling chromatography is a limited pore accessibility due to steric hindrance based on the size and shape of a protein or particle, for example a virus-like particle (Coquebert de Neuville et al., 2013; Pfister et al., 2015). If such colloids have a hydrodynamic diameter of ∼100 nm (>10,000 kDa) (Johnson 2000; Goicochea et al., 2011), almost all pores of widely-used resins such as Q Sepharose FF are inaccessible to them (Figure 4) (Hagel et al., 1996; DePhillips and Lenhoff 2000; Yao and Lenhoff 2006). As a result, the dynamic binding capacity can be unexpectedly low, for example 3.8 × 10⁻⁴ mg L−1 in case of Hepatitis B virus surface antigen virus-like particles binding to DEAE Sepharose FF (Yu et al., 2014). Similarly, mass transfer into, within and out of the pores can be slow for large colloids, causing extensive tailing during elution (Schmidt-Traub et al., 2012).

FIGURE 4. Comparison of data-driven, mechanistic and hybrid chromatography models. Color intensities correlate with the peculiarity/gravitas of the respective criterion for the respective model type. Here, complexity includes the mathematical frame of the model as well as efforts for model implementation, whereas robustness is defined by the accuracy of model predictions and the capability of extrapolation outside the calibration scale. Experimental data accounts for the number of experimental effort required for model calibration and validation and process knowledge summarizes the mechanistic information and process understanding provided by the model. DSP, Downstream processing; HCP, host cell protein; HTS, high-throughput screening; PAT, process analytical tools.
6 Challenge IV: Data driven modeling–Feature extraction and model quality assessment
Data-driven approaches, like QSAR modeling, are regression tasks associated with typical regression challenges. On one hand, regression relies on experimental data for calibration, which can be a limiting factor (e.g., proteins for which isotherm parameters have been determined). On the other hand, the number of features (descriptors) capturing protein properties can be much larger than the number of data points. This phenomenon is described as the ‘curse of dimensionality’ and leads to challenges such as data sparsity, multicollinearity, and overfitting (Altman and Krzywinski 2018). Feature reduction is therefore a typical first step in model building, and is based on feature selection or feature extraction. Feature extraction methods create new features by transforming the original feature space into a lower-dimensional space (Khalid et al., 2014), for example using the popular PCA approach, which is a simple non-parametric linear transformation. Feature extraction is especially useful if a feature set does not contain properties detectable by a given learning algorithm, because this method aggregates information from all features without risking the erroneous removal of relevant features, which can occur during feature selection. The downside of feature extraction is that the new features can be difficult to interpret, and the contribution of the original attributes is often lost (Janecek et al., 2008).
Feature selection chooses a suitable subset of features and is classified into 1) filter methods, which calculate a score for each feature separately and choose the features with the best score; 2) wrapper methods, which fit a supervised learning model onto feature subsets and choose the subset with the best performance; and 3) embedded methods, where the feature selection algorithm is integrated as part of the learning algorithm, e.g., by penalizing the usage of to many features (Bommert et al., 2020). Feature selection and feature extraction are widely used to reduce dimensionality and therefore reduce the risk of regression tasks to overfit, e.g., during QSAR modeling, ultimately improving model generalizability (Alsenan et al., 2020).
Experimental variability causes noise in some features (i.e., attributes, e.g., peak retention time) and target values (i.e., the regressand, e.g., SMA parameters) reducing the identifiability of relevant features by feature selection and correlation during feature extraction. Also, for the regression task, the predictive performance of a regression model depends on the model complexity (e.g., linear vs. non-linear), the amount of noise, and possible noise filtering methods. For example, Martin et al. compared 5 different regression algorithms on 20 real-world data sets and injected noise levels from 5% to 30% and found that the RMSE deteriorated by 67%–100% (Martin et al., 2021). Given that especially QSAR models are evaluated using a test dataset extracted from the same noisy primary dataset, QSAR model evaluation is error-prone and model performance may be underrated (Gupta and Gupta 2019; Kolmar and Grulke 2021). As a result, the predictive quality of QSAR models typically decreases with increasing noise (Janecek et al., 2008; Gupta and Gupta 2019).
Similarly, the choice of regression method can affect the model quality. Whereas MLR is a classical approach, easy to implement and interpret (Eriksson et al., 2003), other regression methods have been used in recent QSAR applications, including decision trees, ANNs, SVMs, random forests, and k-nearest neighbors algorithms, as well as deep learning approaches such as convolutional neural networks (Lin et al., 2020). For example, 77 regression approaches representing 19 families of methods were recently assessed on 83 data sets. The results showed that for small and difficult datasets (i.e., < 5000 entries, linear regression model R2 < 0.6) the penalized linear regression achieved the best results [Friedman-Rank of R2 score: 8.45, the score is explained elsewhere (López-Vázquez and Hochsztain 2019)] followed by a random forest (Friedman-Rank of R2 score: 15.3) (Fernández-Delgado et al., 2019). Sparse data, i.e. only one or a few data points within in each area of the feature space, pose another challenge for prediction tasks because for any new data point there are most likely no similar data points in the training set. One way to compensate for small datasets, and thus sparse data, is semi-supervised learning, where accessory unlabeled data (i.e., data points with known features but unknown target values) can improve predictions (van Engelen and Hoos 2020). Specifically, these unlabeled data are often available in large quantities and are incorporated into supervised models or the models are directly trained using both labeled and unlabeled data (Frumosu and Kulahci 2018). The idea of semi-supervised models is to use labeled data points in a supervised manner to update the model while unlabeled data points are used to minimize the difference in the predictions between similar training examples.
Regardless of the model building approach, the predictive power must be assessed. For one, cross-validation is a widely-used internal validation method that iteratively develops models on different data subsets (training datasets) while the remaining data points (test dataset) are used for validation. Leave-one-out cross-validation is the simplest and most popular approach because it makes best use of the underlying data, which is especially important in small datasets (Wu et al., 2010). However, leave-many-out cross-validation gives a more reliable estimate of model predictive accuracy by omitting ∼30% of the data points in small datasets (20–30 data points) and even more of the data points in larger datasets (Gramatica 2007). If enough reliable data are available, the best way to confirm model accuracy is to test the performance externally on a sufficiently large number of data points that have not been used for model building and internal validation (Gramatica 2007).
Finally, y-randomization or y-scrambling can be used to compare a regression model with other models using randomized target values, which allows the detection of overfitting (Kaneko 2019). For example, if a regression model has predictive properties similar to a y-scrambled counterpart, there is a strong likelihood of overfitting in the original model. The challenge with all evaluation methods is to define thresholds that would indicate a ‘good’ model, because the quality metrics are continuous and transitions between ‘good’ and ‘bad’ are therefore fluid (Schober et al., 2018). One option is to select different thresholds for external and internal validation metrics. For example, determination coefficient thresholds can be set to R2 > 0.7 for the training data set whereas a leave-one-out threshold of QLOO2 > 0.6 is defined for the test data set in order to obtain a high quality QSAR model (Chirico and Gramatica 2012).
7 Challenge V: Mechanistic model fitting–Parameter value optimization in multi-dimensional spaces
Parameters for mechanistic models can be determined using three different approaches: 1) correlation-based approaches using batch equilibrium data; 2) correlation-based approaches using chromatography data [applicable for specific isotherms only, e.g., SMA (Rüdt et al., 2015)]; and 3) inverse fitting using modeling software.
The first option, which is applicable only to isotherm parameters and not transport parameters, fits isotherm equations to measured batch adsorption data (Xu and Lenhoff 2008, 2009; Nfor et al., 2010). However, the setting is typically assessed at equilibrium state of adsorption and desorption, which can take more than a day to establish for some systems (Kumar and Lenhoff 2020) and is longer than the contact time for most column-based operations. Therefore, the transferability of batch adsorption results to dynamic chromatography conditions using a continuous mobile phase flux is often limited.
The second option estimates parameters based on the features of experimental chromatograms and theoretically derived equations without the use of modelling software. This includes the determination of porosities based on the retention volume of tracer experiments (Carta and Jungbauer 2010) as well as methods for the determination of isotherm binding parameters based on the peak positions during linear gradient elution (Yamamoto et al., 1983; Brooks and Cramer 1992; Shukla et al., 1998; Yamamoto and Miyagawa 1999; Rüdt et al., 2015; Lee et al., 2017).
The third option involves the use of modelling software to inversely fit parameters by incrementally adjusting model parameters within a mechanistic model simulation until the simulated chromatogram best matches the experimental target data (Osberghaus et al., 2012a; Heymann et al., 2022). This method is the most computationally expensive of the three, but it allows the creation of complete chromatogram predictions using the fitted parameter values and resulting model. It is also applicable to all chromatography conditions that can be modeled even if no correlation-based method is available (Saleh et al., 2020), including multicomponent competitive binding in the non-linear range of the SMA isotherm. Inverse fitting can become challenging however if the number of parameter values to be fitted simultaneously increases and may outnumber the features in the input data (e.g., peak shape properties of gradient elution chromatograms) or if inter-dependencies between parameters exist because the underlying numerical problem becomes ill-conditioned, as was encountered for pH-dependent SMA (Saleh et al., 2020), HIC (Wang et al., 2016) and MMC (Nfor et al., 2010) isotherms. This can be improved if individual parameters can be identified a priori using correlation approaches based on chromatography data, e.g., by applying the Yamamoto method that enabled the reduction of the number of parameters from 32 to 7 as described before (Saleh et al., 2020). A combination of approach 2) to estimate parameters in the linear range of the isotherm and the inverse fitting 3) to estimate the non-linear parameters has been proven as robust method for model calibration (Saleh et al., 2020). Parameter estimation algorithms can also get stuck in local minima and take impractically long timescales to converge, e.g., several days (Heymann et al., 2022). This can be overcome by using modern genetic algorithms (Heymann et al., 2022) or Bayesian inference (Briskot et al., 2019; Jäpel and Buyel 2022). The sum of squared differences between the simulated chromatogram and the experimental chromatogram is frequently used as an objective function to assess the quality of the model prediction. This objective function is sensitive to the relative timings of the elution peaks rather than their shapes, leading to recommendations for a new objective function system specifically designed for chromatography modeling (Heymann et al., 2022). This system utilizes the “shape” objective function, which is measured by the maximum of the Pearson correlation coefficient between the simulated and the experimental chromatogram over a continuous range of time offsets. The system also includes the difference in timing and peak height as objective functions. All three objective functions can be evaluated using chromatograms and/or over their first derivatives. The approach is more robust against experimental measurement errors such as dispersion in external hold-up volumes or systematic pump-delays compared to methods based on sum of squared differences (Heymann et al., 2022).
8 Conclusion
Chromatography modeling can be achieved by the application of descriptive, mechanistic or hybrid approaches, each with distinct advantages and limitations (Figure 4). The choice of modeling approach depends on the quantity and quality of available data, mechanistic understanding of the separation task and the type of expertise and resources accessible to a development project team. Purely data-driven descriptive models provide a fast-forward description of the process, but the resulting knowledge is difficult to extend beyond the design space or to other purification processes. A deep understanding of separation fundamentals is required for mechanistic models preventing an easy access but providing substantial gains once mastered. Hybrid models therefore seem to emerge as an attractive middle ground, replacing mechanistic aspects with data-driven counterparts where acceptable in terms of predictive quality while keeping the reliability of mechanistic models where necessary. We have identified several major challenges that should be considered when setting up chromatography models, and recommend further scientific evaluation to overcome the hurdles that currently restrict the broad application of modeling in industry settings and especially in academia.
The number of chromatography resins and modes of chromatography available commercially or established in academia is steadily increasing (Rühl et al., 2018; Tustian et al., 2018; Knödler et al., 2019), which will translate into an increasing number of isotherms to be deployed and modeling frameworks should be ready to implement such new isotherms quickly. The development of new isotherms for resin modalities not used as frequently as IEX, for example MMC and uncommon affinity resins, will be an interesting research area and application field for hybrid models. In this context, non-specific binding, including protein-matrix interactions but also protein-protein-matrix interactions will open up a whole new aspect of chromatography modeling.
Ultimately, combining individual chromatography models into models of multi-column chromatography processes will require an adaptation of the modeling approaches to handle the increased complexity, higher variability in experimental outcomes and therefore the additional experimental effort needed to generate suitable datasets for model validation (Behere and Yoon 2020; Guo et al., 2020). Similarly, the computational effort will increase for the modeling of more than one column due to a combinatorial explosion (Behere and Yoon 2020; Guo et al., 2020). All the more important will it be to establish standardized methodologies for model quality assessment that could form the basis for a good modeling practice (GMoP) complementing other GxP guidelines in the context of biopharmaceutical production (Rischawy et al., 2019; Roush et al., 2020; Saleh et al., 2021b; Rajamanickam et al., 2021). We think that such a standardization process will greatly profit from open access chromatography databases for sharing experimental data in a uniform and annotated manner suitable for model building and testing. Such a constantly growing dataset may ultimately facilitate precise characterizations for PAT applications or QbD implementation once predictive errors are sufficiently low.
9 Future perspectives
Modeling chromatography is a highly interdisciplinary approach that has attracted great interest, especially when applied in biopharmaceutical DSP, which requires a profound understanding of the process and adaptability based on the precise prediction of altered process conditions (Saleh et al., 2021c). Within the last decade, interest in such models has increased, mainly due to the QbD initiative but also due to the economic advantages for companies in the pharmaceutical sector (Shekhawat et al., 2016). The application of data-driven, mechanistic and hybrid models requires adequate software-based solutions e.g., for the implementation of the mass transport and adsorption models in order to characterize particle movement and interaction with ligands. This can be achieved using software tools like CADET (Leweke and Lieres 2018) or Cytiva’s GoSilico Chromatography Modeling Software, which will surely become more versatile and accessible in the future. The body of literature presenting valuable mechanistic modeling reports for late-stage DSP steps is increasing (Wang et al., 2016; Saleh et al., 2020; Saleh et al. 2020; Saleh et al. 2021b; Saleh et al. 2021c; Kumar et al., 2021) and so is the market for customer-friendly modeling solutions. The applicability of chromatography models may further increase in the future, for example through hybrid models that use a mechanistic framework for mass transport and sorption but implement descriptive models for the respective calibration. Ultimately, chromatography modeling has the potential to accelerate bioprocess development and reduce the associated costs.
Author contributions
All authors wrote sections of the original draft. JB revised the manuscript and secured the funding.
Funding
This work was funded in part by the Fraunhofer-Gesellschaft Internal Programs under grant no. Attract 125-600164 and the state of North-Rhine-Westphalia under the Leistungszentrum grant no. 423 “Networked, adaptive production”. This work was supported by the Deutsche Forschungsgemeinschaft (DFG) in the framework of the Research Training Group “Tumor-targeted Drug Delivery” grant 331065168.
Acknowledgments
We wish to thank Richard M. Twyman for editorial assistance.
Conflict of interest
The authors declare that the research was conducted in the absence of any commercial or financial relationships that could be construed as a potential conflict of interest.
Publisher’s note
All claims expressed in this article are solely those of the authors and do not necessarily represent those of their affiliated organizations, or those of the publisher, the editors and the reviewers. Any product that may be evaluated in this article, or claim that may be made by its manufacturer, is not guaranteed or endorsed by the publisher.
Abbreviations
DoE, design of experiments; DSP, downstream processing; EMA, European Medicines Agency; FDA, US Food and Drug Administration; HCP, host cell proteins; HIC, hydrophobic interaction chromatography; MCC, multi-column chromatography; MMC, multi-modal chromatography; MPC, model-predictive control; PAT, process analytical technology; QbD, quality by design; QSAR, quantitative structure–activity relationship; RMSE, root-mean-square error; SDM, scale down model; USP, upstream processing; UV, ultraviolet.
Footnotes
1www.cytivalifesciences.com/en/us/news-center/cytiva-acquires-gosilico-to-strengthen-digital-capabilities-in-bioprocessing-10001.
2https://cadet.github.io/master/modelling/unit_operations/general_rate_model.html.
3https://cadet.github.io/master/modelling/unit_operations/2d_general_rate_model.html.
4https://cadet.github.io/master/modelling/binding/index.html.
5https://www.ypsofacto.com/services-chemical-software-chromworks.
6https://github.com/modsim/CADET/issues/14.
7https://www.sartorius.com/download/549152/poster-multi-column-chromatography-process-modelling-for-process- performance-prediction-data.pdf.
References
Abdulaal, A, Patel, A, Charani, E, Denny, S, Alqahtani, S A., Davies, G W., et al. (2020b). Comparison of deep learning with regression analysis in creating predictive models for SARS-CoV-2 outcomes. BMC Med. Inf. Decis. Mak. 20 (1), 299. doi:10.1186/s12911-020-01316-6
Ahmed, A E., Allen, J M., Bhat, T, Burra, P, Fliege, C E., Hart, S N., et al. (2021a). Design considerations for workflow management systems use in production genomics research and the clinic. Sci. Rep. 11 (1), 21680. doi:10.1038/s41598-021-99288-8
Aichernig, B K., Bauerstätter, P, Jöbstl, E, Kann, S, Korošec, R, Krenn, W, et al. (2019). Learning and statistical model checking of system response times. Softw. Qual. J. 27 (2), 757–795. doi:10.1007/s11219-018-9432-8
Alber, M, Tepole, B, Cannon, W R., De, S, Dura-Bernal, S, Garikipati, K, et al. (2019). Integrating machine learning and multiscale modeling-perspectives, challenges, and opportunities in the biological, biomedical, and behavioral sciences. npj Digit. Med. 2, 115. doi:10.1038/s41746-019-0193-y
Alsenan, S A., Al-Turaiki, I M., and Hafez, A M. (2020). Feature extraction methods in quantitative structure–activity relationship modeling: A comparative study. IEEE Access 8, 78737–78752. doi:10.1109/ACCESS.2020.2990375
Altman, N, and Krzywinski, M (2018). The curse(s) of dimensionality. Nat. Methods 15 (6), 399–400. doi:10.1038/s41592-018-0019-x
Andris, S, and Hubbuch, J (2020). Modeling of hydrophobic interaction chromatography for the separation of antibody-drug conjugates and its application towards quality by design. J. Biotechnol. 317, 48–58. doi:10.1016/j.jbiotec.2020.04.018
Andrzejewska, A, Kaczmarski, K, and Guiochon, G (2009). Theoretical study of the accuracy of the pulse method, frontal analysis, and frontal analysis by characteristic points for the determination of single component adsorption isotherms. J. Chromatogr. A 1216 (7), 1067–1083. doi:10.1016/j.chroma.2008.12.021
Anspach, F. B., Johnston, A., Wirth, H.-J., Unger, K. K., and Hearn, M. T. W. (1989). High-performance liquid chromatography of amino acids, peptides and proteins. J. Chromatogr. A 476, 205–225. doi:10.1016/S0021-9673(01)93870-1
Antia, Firoz D., and Horváth, Csaba (1989). Gradient elution in non-linear preparative liquid chromatography. J. Chromatogr. A 484, 1–27. doi:10.1016/S0021-9673(01)88960-3
Baik, J Y, Guo, J, and Lee, K H. (2019). Host cell proteins during biomanufacturing, 295–311. doi:10.1002/9783527811410.ch12
Baru, M. (2003). Size exclusion chromatography on soft and semi-rigid packing materials in the dynamic axial compression mode. J. Biochem. Biophysical Methods 57 (2), 115–142. doi:10.1016/S0165-022X(03)00084-8
Baumann, P., Hahn, T., and Hubbuch, J. (2015). High-throughput micro-scale cultivations and chromatography modeling. Powerful tools for integrated process development. Biotechnol. Bioeng. 112 (10), 2123–2133. doi:10.1002/bit.25630
Bayer, B., Diaz, D., Roger, , Melcher, M., Striedner, G., and Duerkop, M. (2021). Digital twin application for model-based DoE to rapidly identify ideal process conditions for space-time yield optimization. Processes 9 (7), 1109. doi:10.3390/pr9071109
Behere, K., and Yoon, S. (2020). Chromatography bioseparation technologies and in-silico modelings for continuous production of biotherapeutics. J. Chromatogr. A 1627, 461376. doi:10.1016/j.chroma.2020.461376
Benner, S W., Welsh, J P., Rauscher, M A., and Pollard, J M. (2019). Prediction of lab and manufacturing scale chromatography performance using mini-columns and mechanistic modeling. J. Chromatogr. A 1593, 54–62. doi:10.1016/j.chroma.2019.01.063
Bernau, C. R., Jäpel, R. C., Hübbers, J. W., Nölting, S., Opdensteinen, P., and Buyel, J. F. (2021). Precision analysis for the determination of steric mass action parameters using eight tobacco host cell proteins. J. Chromatogr. A 1652, 462379. doi:10.1016/j.chroma.2021.462379
Biba, M., Regalado, E. L., Wu, N., and Welch, C. J. (2014). Effect of particle size on the speed and resolution of chiral separations using supercritical fluid chromatography. J. Chromatogr. A 1363, 250–256. doi:10.1016/j.chroma.2014.07.010
Bishop, C. M. (2016). “Pattern recognition and machine learning,” in Reprint of the original. 1st ed (New York: Springer Information science and statistics).
Bitencourt-Ferreira, G., Pintro, V.O., and de Azevedo, W.F. (2019). “Docking with AutoDock4,” in Docking Screens for Drug Discovery. Methods in Molecular Biology. 2nd Edn, Editor de Azevedo, and W Jr (Clifton, N.J., Humana, New York, NY), 2053, 125–148. doi:10.1007/978-1-4939-9752-7_9
Boi, C, Malavasi, A, Carbonell, R G., and Gilleskie, G (2020). A direct comparison between membrane adsorber and packed column chromatography performance. J. Chromatogr. A 1612, 460629. doi:10.1016/j.chroma.2019.460629
Bommert, A, Sun, X, Bischl, B, Rahnenführer, J, and Lang, M (2020). Benchmark for filter methods for feature selection in high-dimensional classification data. Comput. Statistics Data Analysis 143, 106839. doi:10.1016/j.csda.2019.106839
Borrmann, C., Helling, C., Lohrmann, M., Sommerfeld, S., and Strube, J. (2011). Phenomena and modeling of hydrophobic interaction chromatography. Sep. Sci. Technol. 46 (8), 1289–1305. doi:10.1080/01496395.2011.561515
Bos, T S., Niezen, L E., Uijl, M J. d, Molenaar, S R. A., Lege, S, Schoenmakers, P J., et al. (2021). Reducing the influence of geometry-induced gradient deformation in liquid chromatographic retention modelling. J. Chromatogr. A 1635, 461714. doi:10.1016/j.chroma.2020.461714
Bouhid de Aguiar, I., van de Laar, T., Meireles, M., Bouchoux, A., Sprakel, J., and Schroën, K. (2017). Deswelling and deformation of microgels in concentrated packings. Sci. Rep. 7 (1), 10223. doi:10.1038/s41598-017-10788-y
Bowes, B D., Koku, H, Czymmek, K J., and Lenhoff, A M. (2009). Protein adsorption and transport in dextran-modified ion-exchange media. I: Adsorption. J. Chromatogr. A 1216 (45), 7774–7784. doi:10.1016/j.chroma.2009.09.014
Bowman, A W. (2007). Interdisciplinary research: The importance of learning other people’s language. AStA 91 (4), 361–365. doi:10.1007/s10182-007-0039-9
Bracken, L. J., and Oughton, E. A. (2006). What do you mean?' the importance of language in developing interdisciplinary research. Trans. Inst. Br. Geog. 31 (3), 371–382. doi:10.1111/j.1475-5661.2006.00218.x
Brhane, K. W., Qamar, S., and Seidel-Morgenstern, A. (2019). Two-dimensional general rate model of liquid chromatography incorporating finite rates of adsorption–desorption kinetics and core–shell particles. Ind. Eng. Chem. Res. 58 (19), 8296–8308. doi:10.1021/acs.iecr.9b00364
Briskot, T, Hahn, T, Huuk, T, and Hubbuch, J (2021). Protein adsorption on ion exchange adsorbers: A comparison of a stoichiometric and non-stoichiometric modeling approach. J. Chromatogr. A 1653, 462397. doi:10.1016/j.chroma.2021.462397
Briskot, T, Stückler, F, Wittkopp, F, Williams, C, Yang, J, Konrad, S, et al. (2019). Prediction uncertainty assessment of chromatography models using Bayesian inference. J. Chromatogr. A 1587, 101–110. doi:10.1016/j.chroma.2018.11.076
Brooks, C A., and Cramer, S M. (1992). Steric mass-action ion exchange. Displacement profiles and induced salt gradients. AIChE J. 38 (12), 1969–1978. doi:10.1002/aic.690381212
Bruns, S, Stoeckel, D, Smarsly, B M., and Tallarek, U (2012). Influence of particle properties on the wall region in packed capillaries. J. Chromatogr. A 1268, 53–63. doi:10.1016/j.chroma.2012.10.027
Busetta, B., Tickle, I. J., and Blundell, T. L. (1983). DOCKER, an interactive program for simulating protein receptor and substrate interactions. J. Appl. Crystallogr. 16 (4), 432–437. doi:10.1107/S002188988301078X
Buyel, J. F., and Fischer, R. (2014). Generic chromatography-based purification strategies accelerate the development of downstream processes for biopharmaceutical proteins produced in plants. Biotechnol. J. 9 (4), 566–577. doi:10.1002/biot.201300548
Buyel, J. F., Woo, J. A., Cramer, S. M., and Fischer, R. (2013). The use of quantitative structure-activity relationship models to develop optimized processes for the removal of tobacco host cell proteins during biopharmaceutical production. J. Chromatogr. A 1322, 18–28. doi:10.1016/j.chroma.2013.10.076
Carta, G, and Jungbauer, A (2010). Protein Chromatography. A practical guide to good chromatographic data. Weinheim: Wiley.
Carta, Giorgio (2012). Predicting protein dynamic binding capacity from batch adsorption tests. Biotechnol. J. 7 (10), 1216–1220. doi:10.1002/biot.201200136
Cavazzini, A, Dondi, Fo, Jaulmes, A, Vidal-Madjar, C, and Felinger, A (2002). Monte Carlo model of nonlinear chromatography: Correspondence between the microscopic stochastic model and the macroscopic Thomas kinetic model. Anal. Chem. 74 (24), 6269–6278. doi:10.1021/ac025998q
Chetnik, K, Petrick, L, and Pandey, G (2020a). MetaClean: A machine learning-based classifier for reduced false positive peak detection in untargeted LC-MS metabolomics data. Metabolomics Los. Angel. 16 (11), 117. doi:10.1007/s11306-020-01738-3
Chirico, Na, and Gramatica, P (2012). Real external predictivity of QSAR models. Part 2. New intercomparable thresholds for different validation criteria and the need for scatter plot inspection. J. Chem. Inf. Model. 52 (8), 2044–2058. doi:10.1021/ci300084j
Ciemny, M, Kurcinski, M, Kamel, K, Kolinski, A, Alam, N, Schueler-Furman, O, et al. (2018). Protein-peptide docking: Opportunities and challenges. Drug Discov. today 23 (8), 1530–1537. doi:10.1016/j.drudis.2018.05.006
Close, E J (2015). The derivation of bioprocess understanding from mechanistic models of chromatography. Dissertation. University College London. The Advanced Centre for Biochemical Engineering, Department of Biochemical Engineering, London. Available online at https://discovery.ucl.ac.uk/id/eprint/1466256/2/E_J_Close__The_derivation_of_bioproces_understanding_from_ mechanistic_models_of_chromatography.pdf.
Coffman, J L., Kramarczyk, J F., and Kelley, B D. (2008). High-throughput screening of chromatographic separations: I. Method development and column modeling. Biotechnol. Bioeng. 100 (4), 605–618. doi:10.1002/bit.21904
Conway, J. H., and Sloane, N. J. A. (1995). What are all the best sphere packings in low dimensions? Discrete Comput. Geom. 13 (3-4), 383–403. doi:10.1007/BF02574051
Coquebert de Neuville, B, Tarafder, A, and Morbidelli, M (2013). Distributed pore model for bio-molecule chromatography. J. Chromatogr. A 1298, 26–34. doi:10.1016/j.chroma.2013.04.074
Creasy, A, Reck, J, Pabst, T, Hunter, A, Barker, G, and Carta, G (2019). Systematic interpolation method predicts antibody monomer-dimer separation by gradient elution chromatography at high protein loads. Biotechnol. J. 14 (3), e1800132. doi:10.1002/biot.201800132
Dasgupta, A, Sun, Y V., König, I R., Bailey-Wilson, J. E., and Malley, J D. (2011a). Brief review of regression-based and machine learning methods in genetic epidemiology: The genetic analysis workshop 17 experience. Genet. Epidemiol. 35 (1), S5–S11. doi:10.1002/gepi.20642
Degerman, M, Jakobsson, N, and Nilsson, B (2007). Modeling and optimization of preparative reversed-phase liquid chromatography for insulin purification. J. Chromatogr. A 1162 (1), 41–49. doi:10.1016/j.chroma.2007.02.062
DePhillips, P, Lagerlund, I, Färenmark, J, and Lenhoff, A M. (2004). Effect of spacer arm length on protein retention on a strong cation exchange adsorbent. Anal. Chem. 76 (19), 5816–5822. doi:10.1021/ac049462b
DePhillips, P, and Lenhoff, A M. (2000). Pore size distributions of cation-exchange adsorbents determined by inverse size-exclusion chromatography. J. Chromatogr. A 883 (1-2), 39–54. doi:10.1016/s0021-9673(00)00420-9
Desmet, G, and Broeckhoven, K (2019). Extra-column band broadening effects in contemporary liquid chromatography: Causes and solutions. TrAC Trends Anal. Chem. 119, 115619. doi:10.1016/j.trac.2019.115619
Djuris, J, and Djuric, Z (2017). Modeling in the quality by design environment: Regulatory requirements and recommendations for design space and control strategy appointment. Int. J. Pharm. 533 (2), 346–356. doi:10.1016/j.ijpharm.2017.05.070
Dolamore, F, Dimartino, S, and Fee, C J. (2019). Numerical elucidation of flow and dispersion in ordered packed beds: Nonspherical polygons and the effect of particle overlap on chromatographic performance. Anal. Chem. 91 (23), 15009–15016. doi:10.1021/acs.analchem.9b03598
Dong, L, Li, J, Zou, Q, Zhang, Y, Zhao, L, Wen, X, et al. (2021b). WeBrain: A web-based brainformatics platform of computational ecosystem for eeg big data analysis. NeuroImage 245, 118713. doi:10.1016/j.neuroimage.2021.118713
Dorn, M., Eschbach, F., Hekmat, D., and Weuster-Botz, D. (2017). Influence of different packing methods on the hydrodynamic stability of chromatography columns. J. Chromatogr. A 1516, 89–101. doi:10.1016/j.chroma.2017.08.019
Dorn, M., and Hekmat, D. (2016). Simulation of the dynamic packing behavior of preparative chromatography columns via discrete particle modeling. Biotechnol. Prog. 32 (2), 363–371. doi:10.1002/btpr.2210
Dose, E V., Jacobson, S., and Guiochon, G. (1991). Determination of isotherms from chromatographic peak shapes. Anal. Chem. 63 (8), 833–839. doi:10.1021/ac00008a020
Enmark, M, Häggström, J, Samuelsson, J, and Fornstedt, T (2022a). Building machine-learning-based models for retention time and resolution predictions in ion pair chromatography of oligonucleotides. J. Chromatogr. A 1671, 462999. doi:10.1016/j.chroma.2022.462999
Eriksson, L, Jaworska, J, Worth, A P., Cronin, M T. D., McDowell, R M., and Gramatica, P (2003). Methods for reliability and uncertainty assessment and for applicability evaluations of classification- and regression-based QSARs. Environ. health Perspect. 111 (10), 1361–1375. doi:10.1289/ehp.5758
Evans, C E., and McGuffin, V L. (1988). Dual on-column fluorescence detection scheme for characterization of chromatographic peaks. Anal. Chem. 60 (6), 573–577. doi:10.1021/ac00157a016
Faraji, N, Zhang, Y, and Ray, A K. (2015). Determination of adsorption isotherm parameters for minor whey proteins by gradient elution preparative liquid chromatography. J. Chromatogr. A 1412, 67–74. doi:10.1016/j.chroma.2015.08.004
Fernández-Delgado, M., Sirsat, M. S., Cernadas, E., Alawadi, S., Barro, S., and Febrero-Bande, M. (2019). An extensive experimental survey of regression methods. Neural Netw. 111, 11–34. doi:10.1016/j.neunet.2018.12.010
Forrer, N, Kartachova, O, Butté, A, and Morbidelli, M (2008). Investigation of the porosity variation during chromatographic experiments. Ind. Eng. Chem. Res. 47 (23), 9133–9140. doi:10.1021/ie800131t
Frank, K., Bernau, C. R., and Buyel, J. F. (2022). Spherical nanoparticles can be used as non-penetrating tracers to determine the extra-particle void volume in packed-bed chromatography columns. J. Chromatogr. A 1675, 463174. doi:10.1016/j.chroma.2022.463174
Franke, A, Forrer, N, Butté, A, Cvijetić, B, Morbidelli, M, Jöhnck, M, et al. (2010). Role of the ligand density in cation exchange materials for the purification of proteins. J. Chromatogr. A 1217 (15), 2216–2225. doi:10.1016/j.chroma.2010.02.002
Frumosu, F D., and Kulahci, M (2018). Big data analytics using semi-supervised learning methods. Qual. Reliab. Eng. Int. 34 (7), 1413–1423. doi:10.1002/qre.2338
Ganorkar, S B., and Shirkhedkar, A A. (2017a). Design of experiments in liquid chromatography (HPLC) analysis of pharmaceuticals: Analytics, applications, implications and future prospects. Rev. Anal. Chem. 36 (3). doi:10.1515/revac-2016-0025
Ge, Z, Zhang, K, Chen, D, David, Y, and Yan, B (2021b). Data-driven development of liquid chromatography-mass spectrometry methods for combined sample matrices. Talanta 224, 121880. doi:10.1016/j.talanta.2020.121880
Gebauer, K, and Tschöp, J (2018). “Chromatography columns,” in Biopharmaceutical processing (Elsevier), 493–511.
Geigert, J (2013). The challenge of CMC regulatory compliance for biopharmaceuticals and other biologics. New York, NYNew York: Springer.
Geng, X, and Zebolsky, D M. (2002). The stoichiometric displacement model and Langmuir and Freundlich adsorption. J. Chem. Educ. 79 (3), 385. doi:10.1021/ed079p385
German, P G (2012). Simulation of frontal protein affinity chromatography using MATLAB. J. Chem. Eng. Process Technol. 03 (03). doi:10.4172/2157-7048.1000138
Ghose, S, Hubbard, B, and Cramer, S M. (2007). Binding capacity differences for antibodies and Fc-fusion proteins on protein A chromatographic materials. Biotechnol. Bioeng. 96 (4), 768–779. doi:10.1002/bit.21044
Ghosh, P, Lin, M, Vogel, Jens H., Choy, D, Haynes, C, and Lieres, E v (2014). Zonal rate model for axial and radial flow membrane chromatography, part II: Model-based scale-up. Biotechnol. Bioeng. 111 (8), 1587–1594. doi:10.1002/bit.25217
Gilar, M, McDonald, T S., and Gritti, F (2017). Impact of instrument and column parameters on high-throughput liquid chromatography performance. J. Chromatogr. A 1523, 215–223. doi:10.1016/j.chroma.2017.07.035
Glassey, J, and Stosch, M (2018). Hybrid modeling in process industries. CRC Press, Boca Raton, Florida.
Goicochea, N L., Datta, S A. K., Ayaluru, M, Kao, C, Rein, A, and Dragnea, B (2011). Structure and stoichiometry of template-directed recombinant HIV-1 Gag particles. J. Mol. Biol. 410 (4), 667–680. doi:10.1016/j.jmb.2011.04.012
Golshan-Shirazi, S, and Guiochon, G (1991). Combined effects of finite axial dispersion and slow adsorption desorption kinetics on band profiles in nonlinear chromatography. J. Phys. Chem. 95 (16), 6390–6395. doi:10.1021/j100169a057
Gotmar, Gustaf, Fornstedt, Torgny, and Guiochon, Georges (1999). Peak tailing and mass transfer kinetics in linear chromatography. J. Chromatogr. A 831 (1), 17–35. doi:10.1016/S0021-9673(98)00648-7
Gramatica, P (2007). Principles of QSAR models validation. internal and external. QSAR Comb. Sci. 26 (5), 694–701. doi:10.1002/qsar.200610151
Gritti, F, Felinger, A, and Guiochon, G (2006). Influence of the errors made in the measurement of the extra-column volume on the accuracies of estimates of the column efficiency and the mass transfer kinetics parameters. J. Chromatogr. A 1136 (1), 57–72. doi:10.1016/j.chroma.2006.09.074
Gritti, F, and Guiochon, G (2014a). Accurate measurements of the true column efficiency and of the instrument band broadening contributions in the presence of a chromatographic column. J. Chromatogr. A 1327, 49–56. doi:10.1016/j.chroma.2013.12.003
Gritti, F, and Guiochon, G (2014b). Rapid development of core-shell column technology: Accurate measurements of the intrinsic column efficiency of narrow-bore columns packed with 4.6 down to 1.3 μm superficially porous particles. J. Chromatogr. A 1333, 60–69. doi:10.1016/j.chroma.2014.01.061
Gritti, F, McDonald, T, and Gilar, M (2015). Impact of the column hardware volume on resolution in very high pressure liquid chromatography non-invasive investigations. J. Chromatogr. A 1420, 54–65. doi:10.1016/j.chroma.2015.09.079
Guillarme, D, Nguyen, D T. T., Rudaz, S, and VeutheyJean-Luc, (2008). Method transfer for fast liquid chromatography in pharmaceutical analysis: Application to short columns packed with small particle. Part II: Gradient experiments. Eur. J. Pharm. Biopharm. 68 (2), 430–440. doi:10.1016/j.ejpb.2007.06.018
Guiochon, G (2002). Preparative liquid chromatography. J. Chromatogr. A 965 (1-2), 129–161. doi:10.1016/s0021-9673(01)01471-6
Guiochon, G, Shirazi, D G., Felinger, A, and Katti, A M. (2006). Fundamentals of preparative and nonlinear chromatography. 2nd ed. Boston: Academic Press.
Guo, H, and Frey, D D. (2010). Interpreting the difference between conventional and bi-directional plate-height measurements in liquid chromatography. J. Chromatogr. A 1217 (40), 6214–6229. doi:10.1016/j.chroma.2010.08.010
Guo, J, Jin, M, and Kanani, D (2020). Optimization of single-column batch and multicolumn continuous protein A chromatography and performance comparison based on mechanistic model. Biotechnol. J. 15 (10), e2000192. doi:10.1002/biot.202000192
Gupta, Shivani, and Gupta, Atul (2019). Dealing with noise problem in machine learning data-sets: A systematic review. Procedia Comput. Sci. 161, 466–474. doi:10.1016/j.procs.2019.11.146
Hagel, L, Östberg, M, and Andersson, T (1996). Apparent pore size distributions of chromatography media. J. Chromatogr. A 743 (1), 33–42. doi:10.1016/0021-9673(96)00130-6
Hahn, R, Deinhofer, K, Machold, C, and Jungbauer, A (2003a). Hydrophobic interaction chromatography of proteins. J. Chromatogr. B 790 (1-2), 99–114. doi:10.1016/S1570-0232(03)00080-1
Hahn, Rainer, Schlegel, Robert, and Jungbauer, Alois (2003b). Comparison of protein A affinity sorbents. J. Chromatogr. B 790 (1-2), 35–51. doi:10.1016/S1570-0232(03)00092-8
Hahn, T., Heuveline, V., and Hubbuch, J. (2012). ChromX - a powerful and user-friendly software package for modeling liquid chromatography processes. Chem. Ing. Tech. 84 (8), 1342. doi:10.1002/cite.201250071
Hahn, T, Baumann, P, Huuk, T, Heuveline, V, and Hubbuch, J (2016a). UV absorption-based inverse modeling of protein chromatography. Eng. Life Sci. 16 (2), 99–106. doi:10.1002/elsc.201400247
Hahn, T, Huuk, T, Osberghaus, A, Doninger, K, Nath, S, Hepbildikler, S, et al. (2016b). Calibration-free inverse modeling of ion-exchange chromatography in industrial antibody purification. Eng. Life Sci. 16 (2), 107–113. doi:10.1002/elsc.201400248
Halász, I, and Martin, K (1978). Pore sizes of solids. Angew. Chem. Int. Ed. Engl. 17 (12), 901–908. doi:10.1002/anie.197809011
Hanke, Alexander T., and Ottens, Marcel (2014). Purifying biopharmaceuticals: Knowledge-based chromatographic process development. Trends Biotechnol. 32 (4), 210–220. doi:10.1016/j.tibtech.2014.02.001
Hardin, A M, Harinarayan, C, Malmquist, G, Axén, A, van Reis, , and Robert, (2009). Ion exchange chromatography of monoclonal antibodies: Effect of resin ligand density on dynamic binding capacity. J. Chromatogr. A 1216 (20), 4366–4371. doi:10.1016/j.chroma.2008.08.047
Heil, B J., Hoffman, M M., Markowetz, F, Lee, S, Greene, C S., and Hicks, S C. (2021b). Reproducibility standards for machine learning in the life sciences. Nat. Methods 18 (10), 1132–1135. doi:10.1038/s41592-021-01256-7
Heymann, W, Glaser, J, Schlegel, F, Johnson, W, Rolandi, P, and Lieres, E (2022). Advanced score system and automated search strategies for parameter estimation in mechanistic chromatography modeling. J. Chromatogr. A 1661, 462693. doi:10.1016/j.chroma.2021.462693
Hibbert, D. (2012). Experimental design in chromatography: A tutorial review. J. Chromatogr. B 910, 2–13. doi:10.1016/j.jchromb.2012.01.020
Hofer, S, Ronacher, A, Horak, J, Graalfs, H, and Lindner, W (2011). Static and dynamic binding capacities of human immunoglobulin G on polymethacrylate based mixed-modal, thiophilic and hydrophobic cation exchangers. J. Chromatogr. A 1218 (49), 8925–8936. doi:10.1016/j.chroma.2011.06.012
Holm, P., Allesø, M, Bryder, M C., and Holm, R (2017). “Q8(R2),” in ICH quality guidelines. Editors A. Teasdale, D. Elder, and R. W. Nims (Hoboken, NJ, USA: John Wiley & Sons), 535–577.
Hong, P, Koza, S, and Bouvier, E S. P. (2012). Size-exclusion chromatography for the analysis of protein biotherapeutics and their aggregates. J. Liq. Chromatogr. Relat. Technol. 35 (20), 2923–2950. doi:10.1080/10826076.2012.743724
Hong, P, and McConville, P R. (2018). Dwell volume and extra-column volume: What are they and how do they impact method transfer. Water corporation. Milford USA. Available online atchecked on May 2022 https://www.waters.com/webassets/cms/library/docs/720005723en.pdf.
Huuk, T C., Briskot, T, Hahn, T, and Hubbuch, J (2016). A versatile noninvasive method for adsorber quantification in batch and column chromatography based on the ionic capacity. Biotechnol. Prog. 32 (3), 666–677. doi:10.1002/btpr.2228
Huuk, T C., Hahn, T, Osberghaus, A, and Hubbuch, J (2014). Model-based integrated optimization and evaluation of a multi-step ion exchange chromatography. Sep. Purif. Technol. 136, 207–222. doi:10.1016/j.seppur.2014.09.012
Iurashev, D, Schweiger, S, Jungbauer, A, and Zanghellini, J (2019). Dissecting peak broadening in chromatography columns under non-binding conditions. J. Chromatogr. A 1599, 55–65. doi:10.1016/j.chroma.2019.03.065
Jain, T, Boland, T, Lilov, A, Burnina, I, Brown, M, Xu, Y, et al. (2017b). Prediction of delayed retention of antibodies in hydrophobic interaction chromatography from sequence using machine learning. Bioinformatics 33 (23), 3758–3766. doi:10.1093/bioinformatics/btx519
Janecek, W, Gansterer, N., Demel, M A., and Ecker, G F. (2008). FSDM'08: Proceedings of the 2008 International Conference on New Challenges for Feature Selection in Data Mining and Knowledge Discovery, Vol. 4. JMLR, Antwerp, Belgium, 90–105.
Jäpel, R C, and Buyel, J F (2022). Bayesian optimization using multiple directional objective functions allows the rapid inverse fitting of parameters for chromatography simulations. J. Chromatogr. A 1679, 463408. doi:10.1016/j.chroma.2022.463408
Jiang, P, Wu, D, and Lucy, C A. (2014). Determination of void volume in normal phase liquid chromatography. J. Chromatogr. A 1324, 63–70. doi:10.1016/j.chroma.2013.11.019
Jin, Y, and Makse, H A. (2010). A first-order phase transition defines the random close packing of hard spheres. Phys. A Stat. Mech. its Appl. 389 (23), 5362–5379. doi:10.1016/j.physa.2010.08.010
Johnson, J. (2000). Structures of virus and virus-like particles. Curr. Opin. Struct. Biol. 10 (2), 229–235. doi:10.1016/S0959-440X(00)00073-7
Johnson, T. F., Bailey, J. J., Iacoviello, F., Welsh, J. H., Levison, P. R., Shearing, P. R., et al. (2018). Three dimensional characterisation of chromatography bead internal structure using X-ray computed tomography and focused ion beam microscopy. J. Chromatogr. A 1566, 79–88. doi:10.1016/j.chroma.2018.06.054
Johnson, T. F., Iacoviello, F., Hayden, D. J., Welsh, J. H., Levison, P. R., Shearing, P. R., et al. (2020). Packed bed compression visualisation and flow simulation using an erosion-dilation approach. J. Chromatogr. A 1611, 460601. doi:10.1016/j.chroma.2019.460601
Johnson, T. F., Levison, P. R., Shearing, P. R., and Bracewell, D. G. (2017). X-ray computed tomography of packed bed chromatography columns for three dimensional imaging and analysis. J. Chromatogr. A 1487, 108–115. doi:10.1016/j.chroma.2017.01.013
Jolliffe, I T., and Cadima, J (2016a2065). Principal component analysis: A review and recent developments. Phil. Trans. R. Soc. A 374, 20150202. doi:10.1098/rsta.2015.0202
Joshi, V S., Kumar, V, and Rathore, A S. (2017). Optimization of ion exchange sigmoidal gradients using hybrid models: Implementation of quality by design in analytical method development. J. Chromatogr. A 1491, 145–152. doi:10.1016/j.chroma.2017.02.058
Joucla, G., Le Sénéchal, C., Bégorre, M., Garbay, B., Santarelli, X., and Cabanne, C. (2013). Cation exchange versus multimodal cation exchange resins for antibody capture from CHO supernatants: Identification of contaminating host cell proteins by mass spectrometry. J. Chromatogr. B 942-943, 126–133. doi:10.1016/j.jchromb.2013.10.033
Juliane Dorothea Diedrich (2019). Quantitative modeling and in-depth analysis of multi-state binding and buffer equilibria in chromatography. Dissertation. RWTH Aachen University, Aachen, Germany. ehrstuhl für Computational Systems Biotechnology (FZ Jülich). Available online at http://publications.rwth-aachen.de/record/781426/files/781426.pdf.
Jumper, J, Evans, R, Pritzel, A, Green, T, Figurnov, M, Ronneberger, O, et al. (2021). Highly accurate protein structure prediction with AlphaFold. Nature 596 (7873), 583–589. doi:10.1038/s41586-021-03819-2
Kaczmarski, K(2007). Estimation of adsorption isotherm parameters with inverse method--possible problems. J. Chromatogr. A 1176 (1-2), 57–68. doi:10.1016/j.chroma.2007.08.005
Kalambet, Y, Kozmin, Y, Mikhailova, K, Nagaev, I, and Tikhonov, P (2011a). Reconstruction of chromatographic peaks using the exponentially modified Gaussian function. J. Chemom. 25 (7), 352–356. doi:10.1002/cem.1343
Kamarei, F, Gritti, F, Guiochon, G, and Burchell, J (2014). Accurate measurements of frontal analysis for the determination of adsorption isotherms in supercritical fluid chromatography. J. Chromatogr. A 1329, 71–77. doi:10.1016/j.chroma.2013.12.033
Kaneko, H (2019). Estimation of predictive performance for test data in applicability domains using y‐randomization. J. Chemom. 33 (9). doi:10.1002/cem.3171
Kaspereit, M, and Schmidt‐Traub, H (2020). “Process concepts,” in Preparative chromatography. Editors H. Schmidt‐Traub, M. Schulte, and A. Seidel‐Morgenstern (Wiley), 251–310.
Kawajiri, Y (2021). Model-based optimization strategies for chromatographic processes: A review. Adsorption 27 (1), 1–26. doi:10.1007/s10450-020-00251-2
Khalid, S, Khalil, T, and Nasreen, S (2014). A survey of feature selection and feature extraction techniques in machine learning. In 2014 science and information conference. 2014 science and information conference (SAI) 27. London, UK: 08IEEE, 372–29378.
Khosravanipour Mostafazadeh, A., Sarshar, M., Javadian, Sh., Zarefard, M. R., and Amirifard Haghighi, Z. (2011). Separation of fructose and glucose from date syrup using resin chromatographic method: Experimental data and mathematical modeling. Sep. Purif. Technol. 79 (1), 72–78. doi:10.1016/j.seppur.2011.03.014
Kim, J-H (2009b). Estimating classification error rate: Repeated cross-validation, repeated hold-out and bootstrap. Comput. Statistics Data Analysis 53 (11), 3735–3745. doi:10.1016/j.csda.2009.04.009
Kitchen, D B., Decornez, H, Furr, J R., and Bajorath, J (2004). Docking and scoring in virtual screening for drug discovery: Methods and applications. Nat. Rev. Drug Discov. 3 (11), 935–949. doi:10.1038/nrd1549
Knödler, M, Rühl, C, Opdensteinen, P, and Buyel, J F. (2019). Activated cross-linked agarose for the rapid development of affinity chromatography resins - antibody capture as a case study. J. Vis. Exp. (150). doi:10.3791/59933
KolmarScott, S., and Grulke, C M. (2021). The effect of noise on the predictive limit of QSAR models. J. Cheminform. 13 (1), 92. doi:10.1186/s13321-021-00571-7
Kumar, V, and Lenhoff, A M. (2020). Mechanistic modeling of preparative column chromatography for biotherapeutics. Annu. Rev. Chem. Biomol. Eng. 11, 235–255. doi:10.1146/annurev-chembioeng-102419-125430
Kumar, V, Leweke, S, Heymann, W, Lieres, E, Schlegel, F, Westerberg, K, et al. (2021). Robust mechanistic modeling of protein ion-exchange chromatography. J. Chromatogr. A 1660, 462669. doi:10.1016/j.chroma.2021.462669
Kumar, V, Leweke, S, Lieres, E v, and Rathore, A S. (2015). Mechanistic modeling of ion-exchange process chromatography of charge variants of monoclonal antibody products. J. Chromatogr. A 1426, 140–153. doi:10.1016/j.chroma.2015.11.062
Lee, S, Ryu, K-H, Kim, Y-G, Ahn, J O, Lee, H, Jung, J-K, et al. (2015). Radial scale-down of packed bed chromatography in a thin cylindrical tube for preparative media. Process Biochem. 50 (5), 839–845. doi:10.1016/j.procbio.2015.01.024
Lee, Y F, Kluters, S, Hillmann, M, Hirschheydt, T v, and Frech, C (2017). Modeling of bispecific antibody elution in mixed-mode cation-exchange chromatography. J. Sep. Sci. 40 (18), 3632–3645. doi:10.1002/jssc.201700313
Leweke, Sl, and Lieres, E v (2018). Chromatography analysis and design Toolkit (CADET). Comput. Chem. Eng. 113, 274–294. doi:10.1016/j.compchemeng.2018.02.025
Leweke, S., Heymann, W., and Lieres, E. von (2020). Current capabilities and future development of the CADET platform for chromatography modeling. Chem. Ing. Tech. 92 (9), 1241. doi:10.1002/cite.202055401
Lieres, E v, and Andersson, J (2010). A fast and accurate solver for the general rate model of column liquid chromatography. Comput. Chem. Eng. 34 (8), 1180–1191. doi:10.1016/j.compchemeng.2010.03.008
Lin, C-P, Saito, K, Boysen, R I., Campi, E M., and Hearn, M T. W. (2016). Static and dynamic binding behavior of an IgG2 monoclonal antibody with several new mixed mode affinity adsorbents. Sep. Purif. Technol. 163, 199–205. doi:10.1016/j.seppur.2016.02.048
Lin, X, Li, X, and Lin, X (2020). A review on applications of computational methods in drug screening and design. Molecules 25 (6), 1375. doi:10.3390/molecules25061375
Liu, S, and Papageorgiou, L G. (2019b). Optimal antibody purification strategies using data-driven models. Engineering 5 (6), 1077–1092. doi:10.1016/j.eng.2019.10.011
Liu, Z, Wickramasinghe, S. R, and Qian, X (2017). Ion-specificity in protein binding and recovery for the responsive hydrophobic poly(vinylcaprolactam) ligand. RSC Adv. 7 (58), 36351–36360. doi:10.1039/C7RA06022J
López-Vázquez, C, and Hochsztain, E (2019). Extended and updated tables for the Friedman rank test. Commun. Statistics - Theory Methods 48 (2), 268–281. doi:10.1080/03610926.2017.1408829
Lubda, D., Lindner, W., Quaglia, M., du Fresne von Hohenesche, C., and Unger, K. K. (2005). Comprehensive pore structure characterization of silica monoliths with controlled mesopore size and macropore size by nitrogen sorption, mercury porosimetry, transmission electron microscopy and inverse size exclusion chromatography. J. Chromatogr. A 1083 (1-2), 14–22. doi:10.1016/j.chroma.2005.05.033
Luca, C d, Felletti, S, Macis, M, Cabri, W, Lievore, G, Chenet, T, et al. (2020). Modeling the nonlinear behavior of a bioactive peptide in reversed-phase gradient elution chromatography. J. Chromatogr. A 1616, 460789. doi:10.1016/j.chroma.2019.460789
Madabhushi, S R., Gavin, J, Xu, S, Cutler, C, Chmielowski, R, Rayfield, W, et al. (2018). Quantitative assessment of environmental impact of biologics manufacturing using process mass intensity analysis. Biotechnol. Prog. 34 (6), 1566–1573. doi:10.1002/btpr.2702
Mandenius, C. F., and Brundin, A. (2008a). Bioprocess optimization using design-of-experiments methodology. Biotechnol. Prog. 24 (6), 1191–1203. doi:10.1002/btpr.67
Marek, W K, Sauer, D, Dürauer, A, Jungbauer, A, Piątkowski, W, and Antos, D (2018). Prediction tool for loading, isocratic elution, gradient elution and scaling up of ion exchange chromatography of proteins. J. Chromatogr. A 1566, 89–101. doi:10.1016/j.chroma.2018.06.057
Martin, J, Saez, J A., and Corchado, E (2021). On the regressand noise problem: Model robustness and synergy with regression-adapted noise filters. IEEE Access 9, 145800–145816. doi:10.1109/ACCESS.2021.3123151
Martinez, A., Kuhn, M., Briesen, H., and Hekmat, D. (2019). Enhancing the X-ray contrast of polymeric biochromatography particles for three-dimensional imaging. J. Chromatogr. A 1590, 65–72. doi:10.1016/j.chroma.2018.12.065
Matlschweiger, A, Fuks, P, Carta, G, and Hahn, R (2019). Hindered diffusion of proteins in mixture adsorption on porous anion exchangers and impact on flow-through purification of large proteins. J. Chromatogr. A 1585, 121–130. doi:10.1016/j.chroma.2018.11.060
Mitchel, T (1997a). Machine learning (Mcgraw-Hill international edit). International ed. New York: McGraw-Hill Education.
Miyabe, K, and Guiochon, G (2003). Measurement of the parameters of the mass transfer kinetics in high performance liquid chromatography. J. Sep. Sci. 26 (3-4), 155–173. doi:10.1002/jssc.200390024
Moal, I H., Barradas-Bautista, D, Jiménez-García, B, Torchala, M., van der Velde, A., et al. (2017). IRaPPA: Information retrieval based integration of biophysical models for protein assembly selection. Bioinforma. Oxf. Engl. 33 (12), 1806–1813. doi:10.1093/bioinformatics/btx068
Möller, , Kuchemüller, K B., Steinmetz, T, Koopmann, K S., and Pörtner, R (2019a). Model-assisted Design of Experiments as a concept for knowledge-based bioprocess development. Bioprocess Biosyst. Eng. 42 (5), 867–882. doi:10.1007/s00449-019-02089-7
Mollerup, J M., Hansen, T B, Kidal, S, and Staby, A (2008). Quality by design--thermodynamic modelling of chromatographic separation of proteins. J. Chromatogr. A 1177 (2), 200–206. doi:10.1016/j.chroma.2007.08.059
Monteiro, M, and Keating, E (2009). Managing misunderstandings. Sci. Commun. 31 (1), 6–28. doi:10.1177/1075547008330922
Moreno-González, M, Chuekitkumchorn, P, Silva, M, Groenewoud, R, and Ottens, M (2021). High throughput process development for the purification of rapeseed proteins napin and cruciferin by ion exchange chromatography. Food Bioprod. Process. 125, 228–241. doi:10.1016/j.fbp.2020.11.011
Moser, A, Appl, C, Brüning, S, and Hass, V C. (2021). Mechanistic mathematical models as a basis for digital twins. Adv. Biochem. Eng. Biotechnol. 176, 133–180. doi:10.1007/10_2020_152
Mouellef, M, Vetter, F L, Zobel-Roos, S, and Strube, J (2021). Fast and versatile chromatography process design and operation optimization with the aid of artificial intelligence. Processes 9 (12), 2121. doi:10.3390/pr9122121
Nachman, M, Azad, A R. M., and Bailon, P (1992). Membrane-based receptor affinity chromatography. J. Chromatogr. A 597 (1-2), 155–166. doi:10.1016/0021-9673(92)80105-4
Narayanan, H, Luna, M, Sokolov, M, Arosio, P, Butté, A, and Morbidelli, M (2021a). Hybrid models based on machine learning and an increasing degree of process knowledge: Application to capture chromatographic step. Ind. Eng. Chem. Res. 60 (29), 10466–10478. doi:10.1021/acs.iecr.1c01317
Narayanan, H, Seidler, T, Luna, , Francisco, M, Sokolov, M, Morbidelli, M, et al. (2021b). Hybrid Models for the simulation and prediction of chromatographic processes for protein capture. J. Chromatogr. A 1650, 462248. doi:10.1016/j.chroma.2021.462248
Nfor, B. K., Noverraz, M., Chilamkurthi, S., Verhaert, P. D., van der Wielen, L. A., and Ottens, M. (2010). High-throughput isotherm determination and thermodynamic modeling of protein adsorption on mixed mode adsorbents. J. Chromatogr. A 1217 (44), 6829–6850. doi:10.1016/j.chroma.2010.07.069
Orellana, C. A., Shene, C., and Asenjo, J. A. (2009). Mathematical modeling of elution curves for a protein mixture in ion exchange chromatography applied to high protein concentration. Biotechnol. Bioeng. 104 (3), 572–581. doi:10.1002/bit.22422
Osberghaus, A., Hepbildikler, S., Nath, S., Haindl, M., Lieres, E. von, and Hubbuch, J. (2012a). Determination of parameters for the steric mass action model--a comparison between two approaches. J. Chromatogr. A 1233, 54–65. doi:10.1016/j.chroma.2012.02.004
Osberghaus, A., Hepbildikler, S., Nath, S., Haindl, M., Lieres, E. von, and Hubbuch, J. (2012b). Determination of parameters for the steric mass action model-A comparison between two approaches. J. Chromatogr. A 1233, 54–65. doi:10.1016/j.chroma.2012.02.004
Osberghaus, A., Hepbildikler, S., Nath, S., Haindl, M., Lieres, E. von, and Hubbuch, J. (2012c). Optimizing a chromatographic three component separation: A comparison of mechanistic and empiric modeling approaches. J. Chromatogr. A 1237, 86–95. doi:10.1016/j.chroma.2012.03.029
Ostryanina, N D., Il’ina, O V., and Tennikova, T B. (2002). Effect of experimental conditions on strong biocomplimentary pairing in high-performance monolithic disk affinity chromatography. J. Chromatogr. B 770 (1-2), 35–43. doi:10.1016/S1570-0232(01)00597-9
Parente, E S., and Wetlaufer, Dd B. (1986). Relationship between isocratic and gradient retention times in the high-performance ion-exchange chromatography of proteins. J. Chromatogr. A 355, 29–40. doi:10.1016/S0021-9673(01)97301-7
Park, J H, Jin, J H, Lim, , Sin, M, An, H J, Kim, J W, et al. (2017). Proteomic analysis of host cell protein dynamics in the culture supernatants of antibody-producing CHO cells. Sci. Rep. 7, 44246. doi:10.1038/srep44246
Peixoto, J L. (1987b). Hierarchical variable selection in polynomial regression models. Am. Stat. 41 (4), 311. doi:10.2307/2684752
Perez-Almodovar, E. X., and Carta, G. (2009). IgG adsorption on a new protein A adsorbent based on macroporous hydrophilic polymers. I. Adsorption equilibrium and kinetics. J. Chromatogr. A 1216 (47), 8339–8347. doi:10.1016/j.chroma.2009.09.017
Perkins, T. W., Mak, D S., Root, T. W., and Lightfoot, E N. (1997). Protein retention in hydrophobic interaction chromatography: Modeling variation with buffer ionic strength and column hydrophobicity. J. Chromatogr. A 766 (1-2), 1–14. doi:10.1016/S0021-9673(96)00978-8
Persson, P., Kempe, H., Zacchi, G., and Nilsson, B. (2004). A methodology for estimation of mass transfer parameters in a detailed chromatography model based on frontal experiments. Chem. Eng. Res. Des. 82 (4), 517–526. doi:10.1205/026387604323050236
Pfister, D, Steinebach, F, and Morbidelli, M (2015). Linear isotherm determination from linear gradient elution experiments. J. Chromatogr. A 1375, 33–41. doi:10.1016/j.chroma.2014.11.067
Piątkowski, W, Antos, D, and Kaczmarski, K (2003). Modeling of preparative chromatography processes with slow intraparticle mass transport kinetics. J. Chromatogr. A 988 (2), 219–231. doi:10.1016/s0021-9673(02)02060-5
Piros, P, Ferenci, T, Fleiner, R, Andréka, P, Fujita, H, Főző, L, et al. (2019a). Comparing machine learning and regression models for mortality prediction based on the Hungarian Myocardial Infarction Registry. Knowledge-Based Syst. 179, 1–7. doi:10.1016/j.knosys.2019.04.027
Pirrung, S M., Da Parruca Cruz, D, Hanke, A T., Berends, C, van Beckhoven, R. F. W. C., et al. (2018). Chromatographic parameter determination for complex biological feedstocks. Biotechnol. Prog. 34 (4), 1006–1018. doi:10.1002/btpr.2642
Pischke, E C., Knowlton, J L., Phifer, C C., Gutierrez Lopez, J, Propato, T S., Eastmond, A, et al. (2017). Barriers and solutions to conducting large international, interdisciplinary research projects. Environ. Manag. 60 (6), 1011–1021. doi:10.1007/s00267-017-0939-8
Porter, K A., Desta, I, Kozakov, D, and Vajda, S (2019). What method to use for protein-protein docking? Curr. Opin. Struct. Biol. 55, 1–7. doi:10.1016/j.sbi.2018.12.010
Prentice, J, Evans, S T., Robbins, D, and Ferreira, G (2020). Pressure-Flow experiments, packing, and modeling for scale-up of a mixed mode chromatography column for biopharmaceutical manufacturing. J. Chromatogr. A 1625, 461117. doi:10.1016/j.chroma.2020.461117
Prüß, A, Kempter, C, Gysler, J, and Jira, T (2003). Extracolumn band broadening in capillary liquid chromatography. J. Chromatogr. A 1016 (2), 129–141. doi:10.1016/S0021-9673(03)01290-1
Püttmann, A, Nicolai, M, Behr, M, and Lieres, E v (2014). Stabilized space–time finite elements for high-definition simulation of packed bed chromatography. Finite Elem. Analysis Des. 86, 1–11. doi:10.1016/j.finel.2014.03.001
Püttmann, A, Schnittert, S, Leweke, S, and Lieres, E v (2016). Utilizing algorithmic differentiation to efficiently compute chromatograms and parameter sensitivities. Chem. Eng. Sci. 139, 152–162. doi:10.1016/j.ces.2015.08.050
Püttmann, A, Schnittert, S, Naumann, U, and Lieres, E v (2013). Fast and accurate parameter sensitivities for the general rate model of column liquid chromatography. Comput. Chem. Eng. 56, 46–57. doi:10.1016/j.compchemeng.2013.04.021
Qamar, S, Rehman, N, Carta, G, and Seidel-Morgenstern, A (2020). Analysis of gradient elution chromatography using the transport model. Chem. Eng. Sci. 225, 115809. doi:10.1016/j.ces.2020.115809
Rachakonda, S, Silva, R F., Liu, J, and Calhoun, V D. (2016a). Memory efficient PCA methods for large Group ICA. Front. Neurosci. 10, 17. doi:10.3389/fnins.2016.00017
Rajamanickam, V, Babel, H, Montano-Herrera, Liliana, Ehsani, A, Stiefel, F, Haider, S, et al. (2021). About model validation in bioprocessing. Processes 9 (6), 961. doi:10.3390/pr9060961
Raje, P, and Pinto, N G. (1998). Importance of heat of adsorption in modeling protein equilibria for overloaded chromatography. J. Chromatogr. A 796 (1), 141–156. doi:10.1016/s0021-9673(97)01071-6
Rischawy, F, Saleh, D, Hahn, T, Oelmeier, S, Spitz, J, and Kluters, S (2019). Good modeling practice for industrial chromatography: Mechanistic modeling of ion exchange chromatography of a bispecific antibody. Comput. Chem. Eng. 130, 106532. doi:10.1016/j.compchemeng.2019.106532
Robinson, J R., Karkov, H S., Woo, J A., Krogh, B O., and Cramer, S M. (2017b). QSAR models for prediction of chromatographic behavior of homologous Fab variants. Biotechnol. Bioeng. 114 (6), 1231–1240. doi:10.1002/bit.26236
Roper, D. K, and Lightfoot, E N. (1995). Estimating plate heights in stacked-membrane chromatography by flow reversal. J. Chromatogr. A 702 (1-2), 69–80. doi:10.1016/0021-9673(94)01068-P
Roush, D, Asthagiri, D, Babi, D K., Benner, S, Bilodeau, C, Carta, G, et al. (2020). Toward in silico CMC: An industrial collaborative approach to model-based process development. Biotechnol. Bioeng. 117 (12), 3986–4000. doi:10.1002/bit.27520
Rüdt, M, Gillet, F, Heege, S, Hitzler, J, Kalbfuss, B, and Guélat, B (2015). Combined Yamamoto approach for simultaneous estimation of adsorption isotherm and kinetic parameters in ion-exchange chromatography. J. Chromatogr. A 1413, 68–76. doi:10.1016/j.chroma.2015.08.025
Rühl, C., Knödler, M., Opdensteinen, P., and Buyel, J. F. (2018). A linear epitope coupled to DsRed provides an affinity ligand for the capture of monoclonal antibodies. J. Chromatogr. A 1571, 55–64. doi:10.1016/j.chroma.2018.08.014
Sahinidis, N V. (2019a). Mixed-integer nonlinear programming 2018. Optim. Eng. 20 (2), 301–306. doi:10.1007/s11081-019-09438-1
Saleh, D, Hess, R, Ahlers-Hesse, M, Beckert, N, Schönberger, M, Rischawy, F, et al. (2021a). Modeling the impact of amino acid substitution in a monoclonal antibody on cation exchange chromatography. Biotechnol. Bioeng. 118 (8), 2923–2933. doi:10.1002/bit.27798
Saleh, D, Wang, G, Mueller, B, Rischawy, F, Kluters, Simon, Studts, J, et al. (2021b). Cross-scale quality assessment of a mechanistic cation exchange chromatography model. Biotechnol. Prog. 37 (1), e3081. doi:10.1002/btpr.3081
Saleh, D, Wang, G, Müller, B, Rischawy, F, Kluters, S, Studts, J, et al. (2020). Straightforward method for calibration of mechanistic cation exchange chromatography models for industrial applications. Biotechnol. Prog. 36 (4), e2984. doi:10.1002/btpr.2984
Saleh, D, Wang, G, Rischawy, F, Kluters, S, Studts, J, and Hubbuch, J (2021c). In silico process characterization for biopharmaceutical development following the quality by design concept. Biotechnol. Prog. 37 (6), e3196. doi:10.1002/btpr.3196
H. Schmidt-Traub (Editor) (2006). Preparative chromatography. Of fine chemicals and pharmaceutical agents. 1., auflage (Weinheim: Wiley VCH).
Schmidt-Traub, H., Schulte, Michael, and Seidel-Morgenstern, Andreas (2012). Preparative chromatography. Concepts and contrasts. 2., completely revised and updated. Weinheim, Germany: Wiley VCH. Available online at http://onlinelibrary.wiley.com/book/10.1002/9780471980582.
H Schmidt‐Traub, M Schulte, and A Seidel‐Morgenstern (Editors) (2020). Preparative chromatography (Wiley).
Schmölder, J, and Kaspereit, M (2020). A modular framework for the modelling and optimization of advanced chromatographic processes. Processes 8 (1), 65. doi:10.3390/pr8010065
Schober, P, Boer, C, and Schwarte, L A. (2018). Correlation coefficients: Appropriate use and interpretation. Anesth. Analg. 126 (5), 1763–1768. doi:10.1213/ANE.0000000000002864
Schultze-Jena, A., Boon, M. A., Winter, D. A. M. de, Bussmann, P. J. Th., Janssen, A. E. M., and van der Padt, A. (2019). Predicting intraparticle diffusivity as function of stationary phase characteristics in preparative chromatography. J. Chromatogr. A 1613, 460688. doi:10.1016/j.chroma.2019.460688
Seidel-Morgenstern, A. (2004). Experimental determination of single solute and competitive adsorption isotherms. J. Chromatogr. A 1037 (1-2), 255–272. doi:10.1016/j.chroma.2003.11.108
Shalliker, R. A, BroylesScott, B., and Guiochon, G (2000). Physical evidence of two wall effects in liquid chromatography. J. Chromatogr. A 888 (1-2), 1–12. doi:10.1016/S0021-9673(00)00517-3
Shalliker, R. A, Wong, V, BroylesScott, B., and Guiochon, G (2002). Visualization of bed compression in an axial compression liquid chromatography column. J. Chromatogr. A 977 (2), 213–223. doi:10.1016/S0021-9673(02)01273-6
Shekhawat, L K., Manvar, A P., and Rathore, A S. (2016). Enablers for QbD implementation: Mechanistic modeling for ion-exchange membrane chromatography. J. Membr. Sci. 500, 86–98. doi:10.1016/j.memsci.2015.10.063
Shekhawat, L K., and Rathore, A S. (2019). An overview of mechanistic modeling of liquid chromatography. Prep. Biochem. Biotechnol. 49 (6), 623–638. doi:10.1080/10826068.2019.1615504
Shukla, A A., Bae, S S, Moore, J. A., Barnthouse, K A., and Cramer, S M. (1998). Synthesis and characterization of high-affinity, low molecular weight displacers for cation-exchange chromatography. Ind. Eng. Chem. Res. 37 (10), 4090–4098. doi:10.1021/ie9801756
Silver, J (2019). Overview of analytical-to-preparative liquid chromatography method development. ACS Comb. Sci. 21 (9), 609–613. doi:10.1021/acscombsci.8b00187
Simutis, R, and Lübbert, A (2017). Hybrid approach to state estimation for bioprocess control. Bioengineering 4 (1), 21. doi:10.3390/bioengineering4010021
Sohn, H. Y., and Moreland, C. (1968). The effect of particle size distribution on packing density. Can. J. Chem. Eng. 46 (3), 162–167. doi:10.1002/cjce.5450460305
Solle, D, Hitzmann, B, Herwig, C, Pereira, R M, Ulonska, S, Wuerth, L, et al. (2017). Between the Poles of data-driven and mechanistic modeling for process operation. Chem. Ing. Tech. 89 (5), 542–561. doi:10.1002/cite.201600175
Song, X, Liu, X, Liu, F, and Wang, C (2021b). Comparison of machine learning and logistic regression models in predicting acute kidney injury: A systematic review and meta-analysis. Int. J. Med. Inf. 151, 104484. doi:10.1016/j.ijmedinf.2021.104484
Stattner, E, and Collard, M (2015a). Descriptive modeling of social networks. Procedia Comput. Sci. 52, 226–233. doi:10.1016/j.procs.2015.05.505
Steyerberg, E W. (2019). “Overfitting and optimism in prediction models,” in Clinical prediction models. Editor E W. Steyerberg (Cham: Springer International Publishing Statistics for Biology and Health), 95–112.
Stosch, M v, Davy, S, Francois, K, Galvanauskas, V, Hamelink, J-M, Luebbert, A, et al. (2014). Hybrid modeling for quality by design and PAT-benefits and challenges of applications in biopharmaceutical industry. Biotechnol. J. 9 (6), 719–726. doi:10.1002/biot.201300385
Stosch, M v, Hamelink, J-M, and Oliveira, R (2016). Hybrid modeling as a QbD/PAT tool in process development: An industrial E. coli case study. Bioprocess Biosyst. Eng. 39 (5), 773–784. doi:10.1007/s00449-016-1557-1
Tao, Y, Carta, G, Ferreira, G, and Robbins, D (2011a). Adsorption of deamidated antibody variants on macroporous and dextran-grafted cation exchangers: I. Adsorption equilibrium. J. Chromatogr. A 1218 (11), 1519–1529. doi:10.1016/j.chroma.2011.01.049
Tao, Y, Carta, G, Ferreira, G, and Robbins, D (2011b). Adsorption of deamidated antibody variants on macroporous and dextran-grafted cation exchangers: II. Adsorption kinetics. J. Chromatogr. A 1218 (11), 1530–1537. doi:10.1016/j.chroma.2011.01.050
Tatárová, I, Dreveňák, P, Kosior, A, and Polakovič, M (2013). Equilibrium and kinetics of protein binding on ion-exchange cellulose membranes with grafted polymer layer. Chem. Pap. 67 (12). doi:10.2478/s11696-012-0269-5
Tibshirani, R (1996b). Regression shrinkage and selection via the lasso. J. R. Stat. Soc. Ser. B Methodol. 58 (1), 267–288. doi:10.1111/j.2517-6161.1996.tb02080.x
Tropsha, A., Gramatica, P., and Gombar, V. K. (2003). The importance of being earnest. Validation is the absolute essential for successful application and interpretation of QSPR models. QSAR Comb. Sci. 22 (1), 69–77. doi:10.1002/qsar.200390007
Tropsha, A, and Golbraikh, A (2007b). Predictive QSAR modeling workflow, model applicability domains, and virtual screening. Curr. Pharm. Des. 13 (34), 3494–3504. doi:10.2174/138161207782794257
Tustian, A D., Laurin, L, Ihre, H, Tran, T, Stairs, R, and Bak, H (2018). Development of a novel affinity chromatography resin for platform purification of bispecific antibodies with modified protein a binding avidity. Biotechnol. Prog. 34 (3), 650–658. doi:10.1002/btpr.2622
van Engelen, J. E., and Hoos, H. H. (2020). A survey on semi-supervised learning. Mach. Learn. 109 (2), 373–440. doi:10.1007/s10994-019-05855-6
Vanderheyden, Y, Broeckhoven, K, and Desmet, G (2016). Peak deconvolution to correctly assess the band broadening of chromatographic columns. J. Chromatogr. A 1465, 126–142. doi:10.1016/j.chroma.2016.08.058
Vecchiarello, N, Timmick, S M., Goodwine, C, Crowell, L E., Love, K R., Love, J. C, et al. (2019). A combined screening and in silico strategy for the rapid design of integrated downstream processes for process and product-related impurity removal. Biotechnol. Bioeng. 116 (9), 2178–2190. doi:10.1002/bit.27018
Vidakovic, B (2011). Statistics for bioengineering sciences. With MATLAB and WinBUGS support. 1st ed. New York, NY: Springer Science+Business Media, LLC (Springer. Texts in Statistics).
Vogt, F., and Tacke, M. (2001a). Fast principal component analysis of large data sets. Chemom. Intell. Lab. Syst. 59 (1-2), 1–18. doi:10.1016/S0169-7439(01)00130-7
Walther, C, Voigtmann, M, Bruna, E., Abusnina, A., Tscheließnig, A.-L., Allmer, M., et al. (2022a). Smart process development: Application of machine-learning and integrated process modeling for inclusion body purification processes. Biotechnol. Prog. 38, e3249. doi:10.1002/btpr.3249
Wang, G, Briskot, T, Hahn, T, Baumann, P, and Hubbuch, J (2017a). Estimation of adsorption isotherm and mass transfer parameters in protein chromatography using artificial neural networks. J. Chromatogr. A 1487, 211–217. doi:10.1016/j.chroma.2017.01.068
Wang, G, Briskot, T, Hahn, T, Baumann, P, and Hubbuch, J (2017b). Root cause investigation of deviations in protein chromatography based on mechanistic models and artificial neural networks. J. Chromatogr. A 1515, 146–153. doi:10.1016/j.chroma.2017.07.089
Wang, G., Hahn, T., and Hubbuch, J. (2016). Water on hydrophobic surfaces. Mechanistic modeling of hydrophobic interaction chromatography. J. Chromatogr. A 1465, 71–78. doi:10.1016/j.chroma.2016.07.085
Wiesel, A., Schmidt-Traub, H., Lenz, J., and Strube, J. (2003). Modelling gradient elution of bioactive multicomponent systems in non-linear ion-exchange chromatography. J. Chromatogr. A 1006 (1-2), 101–120. doi:10.1016/S0021-9673(03)00554-5
Wu, J, Mei, J, Wen, S, Liao, S, Chen, J, and Shen, Y (2010). A self-adaptive genetic algorithm-artificial neural network algorithm with leave-one-out cross validation for descriptor selection in QSAR study. J. Comput. Chem. 31 (10), 1956–1968. doi:10.1002/jcc.21471
Xu, X, and Lenhoff, A M. (2008). A predictive approach to correlating protein adsorption isotherms on ion-exchange media. J. Phys. Chem. B 112 (3), 1028–1040. doi:10.1021/jp0754233
Xu, X, and Lenhoff, A M. (2009). Binary adsorption of globular proteins on ion-exchange media. J. Chromatogr. A 1216 (34), 6177–6195. doi:10.1016/j.chroma.2009.06.082
Yamamoto, S, and Miyagawa, E (1999). Retention behavior of very large biomolecules in ion-exchange chromatography. J. Chromatogr. A 852 (1), 25–30. doi:10.1016/S0021-9673(99)00594-4
Yamamoto, S., Nakanishi, K., Matsuno, R., and Kamijubo, T. (1983). Ion exchange chromatography of proteins-predictions of elution curves and operating conditions. II. Experimental verification. Biotechnol. Bioeng. 25 (5), 1373–1391. doi:10.1002/bit.260250516
Yang, H, Viera, C, Fischer, J, and Etzel, M R. (2002). Purification of a large protein using ion-exchange membranes. Ind. Eng. Chem. Res. 41 (6), 1597–1602. doi:10.1021/ie010585l
Yao, F., Coquery, J., and Kim-Anh, L. C. (2012a). Independent Principal Component Analysis for biologically meaningful dimension reduction of large biological data sets. BMC Bioinforma. 13, 24. doi:10.1186/1471-2105-13-24
Yao, Yan, Czymmek, Kirk J., Pazhianur, Rajesh, and Lenhoff, Abraham M. (2006). Three-dimensional pore structure of chromatographic adsorbents from electron tomography. Langmuir 22 (26), 11148–11157. doi:10.1021/la0613225
Yao, Y, and Lenhoff, A M. (2004). Determination of pore size distributions of porous chromatographic adsorbents by inverse size-exclusion chromatography. J. Chromatogr. A 1037 (1-2), 273–282. doi:10.1016/j.chroma.2004.02.054
Yao, Y, and Lenhoff, A M. (2006). Pore size distributions of ion exchangers and relation to protein binding capacity. J. Chromatogr. A 1126 (1-2), 107–119. doi:10.1016/j.chroma.2006.06.057
Yoshimoto, N, Yada, T, and Yamamoto, S (2016). A simple method for predicting the adsorption performance of capture chromatography of proteins. Jpn. J. Food Eng. 17 (3), 95–98. doi:10.11301/jsfe.17.95
Yu, M, Li, Y, Zhang, S, Li, X, Yang, Y, Chen, Y, et al. (2014). Improving stability of virus-like particles by ion-exchange chromatographic supports with large pore size: Advantages of gigaporous media beyond enhanced binding capacity. J. Chromatogr. A 1331, 69–79. doi:10.1016/j.chroma.2014.01.027
Zhang, S, Iskra, T, Daniels, W, Salm, J, Gallo, C, Godavarti, R, et al. (2017). Structural and performance characteristics of representative anion exchange resins used for weak partitioning chromatography. Biotechnol. Prog. 33 (2), 425–434. doi:10.1002/btpr.2412
Zhang, S, and Sun, Y (2002). Ionic strength dependence of protein adsorption to dye-ligand adsorbents. AIChE J. 48 (1), 178–186. doi:10.1002/aic.690480118
Keywords: biopharmaceutical production process, Data-driven models, downstream processing design, experiment quality, hybrid model validation, mechanistic modeling, protein separation, quality by design
Citation: Bernau CR, Knödler M, Emonts J, Jäpel RC and Buyel JF (2022) The use of predictive models to develop chromatography-based purification processes. Front. Bioeng. Biotechnol. 10:1009102. doi: 10.3389/fbioe.2022.1009102
Received: 01 August 2022; Accepted: 23 September 2022;
Published: 12 October 2022.
Edited by:
Ligia R. Rodrigues, University of Minho, PortugalReviewed by:
Ricardo J. S. Silva, Instituto de Biologia e Tecnologia Experimental (iBET), PortugalMartina Catani, University of Ferrara, Italy
Songsong Liu, Harbin Institute of Technology, China
Copyright © 2022 Bernau, Knödler, Emonts, Jäpel and Buyel. This is an open-access article distributed under the terms of the Creative Commons Attribution License (CC BY). The use, distribution or reproduction in other forums is permitted, provided the original author(s) and the copyright owner(s) are credited and that the original publication in this journal is cited, in accordance with accepted academic practice. No use, distribution or reproduction is permitted which does not comply with these terms.
*Correspondence: J. F. Buyel, am9oYW5uZXMuYnV5ZWxAcnd0aC1hYWNoZW4uZGU=
†These authors have contributed equally to this work