- 1Jiangsu Province Engineering Research Center of Smart Wearable and Rehabilitation Devices, School of Biomedical Engineering and Informatics, Nanjing Medical University, Nanjing, China
- 2The State Key Laboratory of Bioelectronics, School of Instrument Science and Engineering, Southeast University, Nanjing, China
- 3Changzhou Medical Center, The Affiliated Changzhou Second People’s Hospital of Nanjing Medical University, Changzhou Second People’s Hospital, Nanjing Medical University, Changzhou, China
The rapid classification of micro-particles has a vast range of applications in biomedical sciences and technology. In the given study, a prototype has been developed for the rapid detection of particle size using multi-angle dynamic light scattering and a machine learning approach by applying a support vector machine. The device consisted of three major parts: a laser light, an assembly of twelve sensors, and a data acquisition system. The laser light with a wavelength of 660 nm was directed towards the prepared sample. The twelve different photosensors were arranged symmetrically surrounding the testing sample to acquire the scattered light. The position of the photosensor was based on the Mie scattering theory to detect the maximum light scattering. In this study, three different spherical microparticles with sizes of 1, 2, and 4 μm were analyzed for the classification. The real-time light scattering signals were collected from each sample for 30 min. The power spectrum feature was evaluated from the acquired waveforms, and then recursive feature elimination was utilized to filter the features with the highest correlation. The machine learning classifiers were trained using the features with optimum conditions and the classification accuracies were evaluated. The results showed higher classification accuracies of 94.41%, 94.20%, and 96.12% for the particle sizes of 1, 2, and 4 μm, respectively. The given method depicted an overall classification accuracy of 95.38%. The acquired results showed that the developed system can detect microparticles within the range of 1–4 μm, with detection limit of 0.025 mg/ml. Therefore, the current study validated the performance of the device, and the given technique can be further applied in clinical applications for the detection of microbial particles.
1 Introduction
Microparticles are small spherical particles with different size ranges within 1–1,000 μm (Li et al., 2013; Veremchuk et al., 2021). In the atmosphere, particles with a diameter less than 2.5 μm have the characteristics of strong activity, long residence time, and transport distance, which significantly harms human health and the quality of the atmosphere. The application of rapid classification of microparticles is to prevent damage to humans from airborne pollution and food contamination (Wieland et al., 2022). Particles can also be used as an effective drug delivery transmitter in cancer treatment and prevention (Nakane, 2012; Gong et al., 2015; Kumar et al., 2015). Light obscuration test (LOT) is an analytical method in which particles in a liquid are placed between a laser light source and a detector. A laser light source is used to illuminate the particles, thus creating a blocking light. The system processes the detected signal to display a calibration curve. The calibration curve quantifies the particles and determines their size (Hawe et al., 2013). Microparticle detection instruments commonly use LOT to detect insoluble particles in intravenous fluids for drug detection. The rapid classification of particles with different sizes is crucial for the human environment and the timely identification of microorganisms (Kumar et al., 2015). In the last decade, many microparticle detection techniques have been developed (Zhao et al., 2011; Dalili et al., 2019; Lengyel et al., 2019; Lerche, 2019), such as flow microscopy, spectroscopy, mass spectrometry (Zwicker, 2010; McNay et al., 2011; Kreimer et al., 2015). Recently, classifying particles using high-speed microscopy to acquire particle images by artificial intelligence algorithms has become a mainstream research method. Luo et al. (2020) developed a pipeline based on machine learning to identify images obtained from Charge Coupled Device (CCD) imaging and improved the accuracy of particle identification. Lugnan et al. (2020) developed a machine learning method for high-throughput single particle analysis using flow cytometry to achieve interference pattern classification of transparent PMMA microparticles with diameters of 15.2 and 18.6 μm. Bals et al. (2022) used scanning electron microscopy images to record contrast ratio and resolution, then classified the acquired images by machine learning based on the shape and size of micro-particles. The above methods are limited to imaging analysis and require more space for expensive detection instruments (Klug et al., 2019; Di et al., 2022; Yue et al., 2022).
In this study, we proposed an application of multi-angle dynamic light scattering (MDLS) method based on machine learning. The initial sample was diluted by mixing 1 μl of the original sample (25 mg/ml) with deionized water (DI). The prepared sample was placed in the device to collect scattered light for 30 min. The surrounding photodetector acquired the multi-angle dynamic light scattering signal and converted the acquired scattered light signal into a voltage wave. The power spectrum features were obtained from the signal waveform, and the principal component analysis (PCA) and recursive feature elimination (RFE) methods were applied to select the optimum features. Machine learning (ML) is an artificial intelligence technique that enables fast and automated classification of input features. ML has been widely applied in various applications, such as biomedical engineering and optical-based instruments (Lussier et al., 2020; Shin et al., 2020). Three machine learning algorithms, including logistic regression (LR), random forest (RF), and support vector machines (SVM) were applied for classifying features. The accuracy, precision, recall, and F1-score were used as evaluation metrics for classification performance. The overall schematic representation of the experiments and detection principle has been illustrated in Figure 1. The results demonstrated that the proposed technique is effective for the rapid detection and classification of microparticles. The proposed research aimed to shorten detection time, reduce detection costs, and simplify operation methods for classifying microparticles. The detection process did not require expensive equipment and complex operations to perform non-contact, non-invasive, and rapid detection of samples, which had great potential for optical and clinical applications.
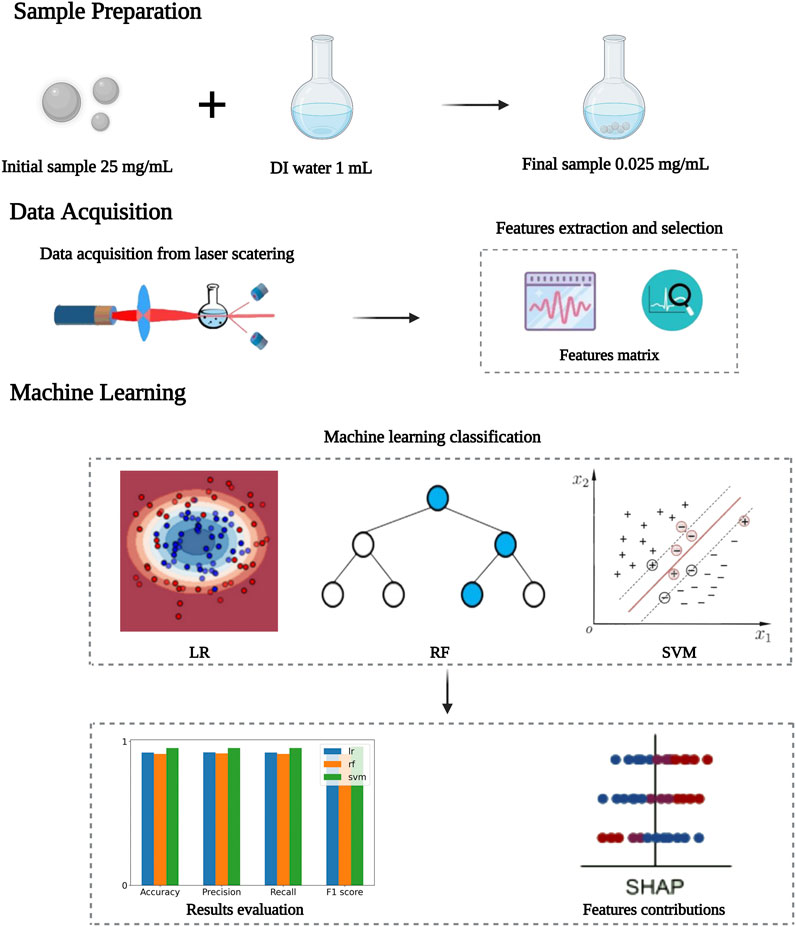
FIGURE 1. The flowchart for the detection principle for classifying microparticles based on MDLS and machine learning.
2 Materials and methods
2.1 Micro-particles characteristics
Lumisphere polystyrene fluorescent microspheres from Tianjin Bessler Chromatography Technology Development Center (Tianjin, China) were used with a concentration of 25 mg/ml. The microscopic images of the microparticles with three different sizes were taken by scanning electron microscopy (SEM), as shown in Figure 2. The testing samples of different concentrations were prepared using series dilution to find the optimum concentration for acquiring data. The optimum concentration of the testing sample was obtained by getting the highest number of peaks/variations in the acquired waveform of respective sample. The testing samples with concentrations of 0.0125, 0.025, 0.05, 0.075, 0.1, and 0.125 mg/ml were mixed with DI water to acquire the optimal concentration. The solution was vortexed and centrifuged at 1,000 rpm for 10 min. The residue was removed from the sample to remove unwanted impurities. Then 1 ml of DI water was mixed with the supernatant to prepare the final sample for the experiment. All the experiments were performed at a room temperature (25–28°C).

FIGURE 2. Images of three particles scanning under electron microscope (A) 1 µm (B) 2 µm and (C) 4 µm.
2.2 MDLS prototype
Mie scattering theory describes the elastic scattering of light when the wavelength of the incident light is similar or smaller than the diameter size of spherical particles. Mie theory has been widely applied to laser diffraction analysis to detect particle size effects (Altug et al., 2022). MDLS combines the angular information of Mie scattering with dynamic light scattering to measure particle size. MDLS shows that the intensity of the scattered light fluctuates in a particular direction with time because the tiny particles in solution are in Brownian motion, and the distance between each scattered particle constantly changes with time. MDLS is a common method for detecting particle size and has been used in many medical detection devices (Guo et al., 2018). Optical methods were widely used as an important research tool for particle classification and qualitative detection (Fan et al., 2014; Olson et al., 2015).
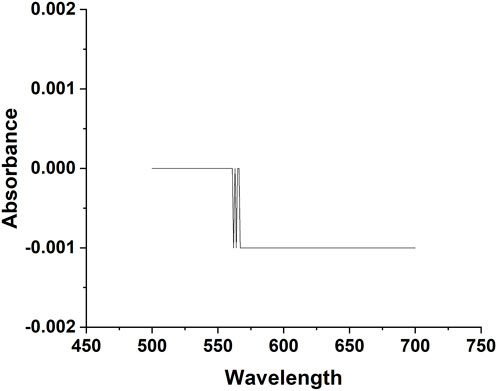
The prototype contains three main parts: 1) a laser source, 2) an assembly of the photosensitive sensor, and 3) a data acquisition system (Hussain et al., 2020a). The designed prototype and the laser hardware were assembled by the Nanjing Institute of Advanced Laser Technology, Chinese Academy of Sciences (Nanjing, China). The laser source of the device has a wavelength of 660 nm at a rated power of 150 mW. The power rating of the laser source was measured by PM320E and S130C instruments developed by Thorlabs (New Jersey, United States). When the laser passes through the sample, the scattering light was detected by the high-speed silicon photodiodes FDS100 (wavelength ranges from 350 to 1,100 nm with rise time of 10 ns) manufactured by Thorlabs (New Jersey, United States). The AD8675 manufactured by Analog Devices (Massachusetts, United States) operational amplifier was used in the system to amplify the weak signal. A small flask made of round bottom silicon was used in the experiment (Celo Measure & Control Technology Co., Hefei). UV-1800 Spectrophotometer (SHIMADZU, Japan) measured the absorbance of the glass (Figure 3), which was approximately zero between 500–700 nm wavelength.
The original prototype was designed with 32 photoelectric sensors for signal acquisition (Hussain et al., 2020b). However, the initial number of 32 sensors consumed more computational power. The redundant data acquisition channels did not provide enough information, significantly deteriorating the classification results. The intensity of scattering light depends on the shape, size, and characteristics of the particles based on the Mie scattering theory. Particles of different sizes exhibited different scattered light patterns. The maximum scattering light intensity occurs in the incoming light’s forward direction (Lock and Laven, 2011). Therefore, the number of sensors was tested and reduced from 32 to 12.
The 3D assembly of the developed prototype was designed using Solidworks 2020 software, as shown in Figure 4. The 3-axis positioning table controlled the “XYZ” 3-axial alignment of the light source to ensure that the laser is focused on the center of the sample. The laser beam positioning unit, laser collimator, sample flask and the direction of the incident light to the sample were optimized to acquire maximum signal energy from the forward scattering light. The calibrated system guarantees that no interference from external factors appears throughout the detection experiments. The signals were collected by NI data acquisition card (PCI-6225). The system showed zero voltage in the dark environment. The data collector maintained the calibrated zero signal waveform when the flask was filled with DI water as an empty sample. The collected data were further processed for features evaluation and data classification using MatlabR 2018a software.
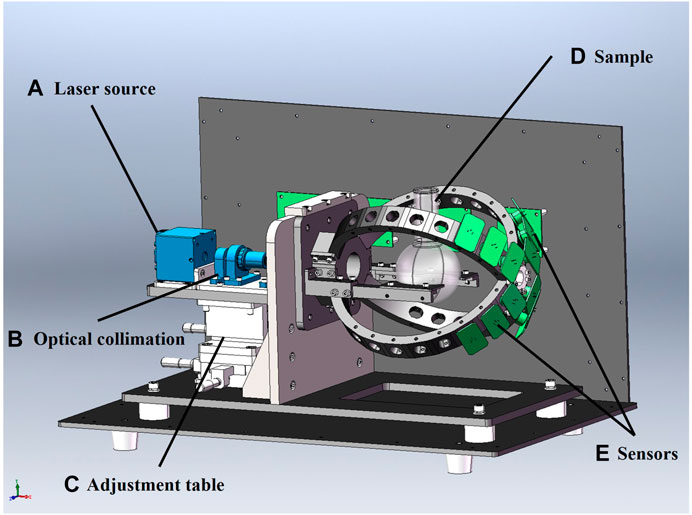
FIGURE 4. Prototype of the optical system designed by Soildworks 2020. (A) Laser source: Laser source with wavelength of 660 nm and power rating of 150 mW laser sources was used to emit laser beam; (B) Optical collimation: The optimized collimation system was used to ensure that the scattering light signal from the micro-particles was fully transmitted to the detector unit in real time. (C) Adjustment table: The 3-axis positioning system was used to adjust the position of the horizontal x and y axis and the vertical z axis so that the laser beam can be focused on the center of the sample. (D) Sample: Different concentrations of microparticle samples mixed with DI water was prepared as experimental samples. (E) Sensors: A photodiode with wavelength range of 350–1,100 nm and rise time of 10 ns was implemented to convert the light signal to an electrical signal.
2.3 Features extraction and features selection
2.3.1 Features extraction
Signal-to-noise ratio (SNR) gives the ratio between the power of the information signal carried in the acquired signal to the noise signal and measures the quality of the signal. Higher SNR indicates better signal quality and provides valid information for computational analysis (Szkulmowska et al., 2005). The SNR calculated the quality of the signal, where
Various time-domain feature extraction algorithms have been developed for signal classification tasks (pahuja et al., 2022; Wang et al., 2022). Rami et al. developed an Electromyography (EMG) signal-based feature extraction method to extract power spectrum features from the non-stationary signal in time domain (Khushaba et al., 2014). The acquired data from the prototype also showed non-stationary behavior. In the feature extraction technique, the MDLS signal is denoted by x [j], the length of the signal is represented by N, and the sampling frequency is fs. The MDLS scattered signal can be expressed over time by a function of X [k] after the discrete Fourier transform (DFT). According to Parseval’s theorem, the power contained in the signal is equal to the sum of the powers of the components of the signal from the complete orthogonal set. The Parseval’s theorem is applied to the derivation of the power spectral characteristics:
The power spectrum characteristic P [k] is calculated by multiplying
According to the symmetry of the Fourier transform, all positive and negative frequencies were included to handle the whole spectrum. The given method used the time domain signal to evaluate the power spectrum features. All odd moments were set to zero by the FT. Therefore, according to the definition of the nth order moment m of the power spectral density P [k], all odd moments will be calculated as zero, which is defined as:
Based on Eq. 2, Parseval’s theorem can be used when n = 0. According to the time-differentiation property of the FT, when n ≠ 0, the nth order derivative of the discrete time signal equals the spectrum multiplied by the nth power of k as follows:
Therefore, the number of extracted features is defined by the following properties:
2.3.1.1 Zero-order moments
The zero-order moment represented the total power in the frequency domain:
2.3.1.2 Second-order moments and fourth-order moments
The second-order moment indicates the magnitude of the fluctuation of the power spectrum corresponding to the mean value. In the power spectrum characteristics, the power spectrum with
Similarly, the fourth-order moments can be expressed by the following equation:
The features were normalized (
Thus, the first three extracted features
2.3.1.3 Sparsity
Sparsity defines the energy contained in a vector which is represented by:
2.3.1.4 Wavelength ratio
The waveform length characteristic defines the sum of the absolute values of the second and fourth-order derivatives of the signal:
However, the sampling frequency of the data acquisition was set to 1 kHz for the 12 channels. The five features were collected from each channel to form the feature vector
2.3.2 Features selection method
The dimensionality of features affects the classification results, and irrelevant features may degrade the performance of the classifier (Li et al., 2017). Feature selection methods optimize the feature set and remove low relevance and redundant features. Feature selection methods are useful for removing irrelevant features affecting the training model and improving the classification accuracy of the model (Khaire and Dhanalakshmi, 2022). The PCA and RFE were used as dimensionality reduction algorithms.
2.3.2.1 PCA
PCA is a commonly used algorithm for data dimensionality reduction. PCA can project each data point onto only the first few principal components to obtain low-dimensional data while preserving as much variation as possible. In PCA, high-dimensional features are determined based on the eigenvectors and eigenvalues of the covariance matrix for K principal components and mapped to the K-dimensional space (K < N), where K-dimensional features are associated as new eigenvectors based on the magnitude of the eigenvalues (Yang et al., 2004).
2.3.2.2 RFE
Removing several features at a time often negatively impacts classifier performance, while using a small subset may yield better results. Therefore, RFE was introduced to overcome the drawback (Guyon et al., 2002). REF is a feature selection method with good generalization performance based on backward search of the model as features were removed in each iteration by using the feature importance metric within the model as a metric. RFE searches for a subset of features by starting with all features in the training dataset and successfully removing features until the desired numbers are obtained.
2.4 Machine learning
Machine learning represents a class of algorithms for data classification. With the development of artificial intelligence, machine learning technology has been widely applied in various fields, especially in biomedical engineering and life science (Goodswen et al., 2021). Among different machine learning algorithms, LR is a probabilistic non-linear regression with applications in prediction and discrimination. RF is an integrated learning model that contains multiple decision trees, and the output category is determined by the plurality of the categories output from the individual trees. SVM is a typical supervised learning classification algorithm in machine learning, which classifies data by finding the maximum interval in the feature space (Ghannam and Techtmann, 2021).
After acquiring the experimental data, the machine learning classification algorithms were applied based on Sklearn 0.19.0 package (Intel Core i7-10700 CPU processor, 2.90 Ghz, 32 GB RAM, RXT 3070). The SVM classifier acquired the highest classification accuracy compared with other classifiers. The machine learning classification process is presented in Figure 5, where the data set was divided into a training set and a test set in the ratio of 7:3. After denoising, the data was segmented by adding a sliding window length of 250 ms and slid over the data signal with an increment of 150 ms. The power spectrum features were extracted for the signals in each window. The features extracted from three particle sizes of 1, 2, and 4 µm were labeled before training the machine learning classifier.
2.5 Performing analysis and features contribution
2.5.1 Performing analysis
Model evaluation metrics were applied to select a model with high generalization ability for machine learning classification tasks. Models with high generalization ability tend to adapt the unknown samples. Cross-validation is used to assess machine learning classifiers on the training set for checking their performance. In 5-fold cross-validation, the dataset is divided into 5 subsets that are not utilized in training the classifier. The 5-subsets were used for testing the model to evaluate the classifier (Bergmeir and Benitez, 2012; Wong and Yeh, 2020). The performance was assessed based on the average value generated from each result of the subset. In this research, the 5-fold cross-validation was performed to optimize the parameters of the classifier. The generalization performance of the model was tested on the test set.
The confusion matrix was plotted for subsequent computation of performance evaluation metrics. The confusion matrix is a class of tables used to visualize the classification results and evaluate classification performance. The values from the confusion matrix were represented by True Positive (TP), True Negative (TN), False Positive (FP), and False Negative (FN). The given characteristics were applied to evaluate the performance metrics, in which TP and TN denote the results of particle size that had been correctly classified, while FP and FN represent the results of particle size data classified incorrectly by the classifier. These parameters constituted the confusion matrix were used to evaluate the performance metrics, including precision, accuracy, recall, and F1 score. Precision represents the percentage of correctly predicted results to total outcomes. Recall is the probability that the predicted positive samples were positive samples. The F1 score was obtained from the weighted average of precision and recall.
The above metrics were used to evaluate the performance of the classifier and defined respectively:
2.5.2 Features contribution
Shapley value is a solution concept that involves the equitable distribution of benefits and costs to several actors working jointly in the game theory (Ribeiro et al., 2016; Lundberg and Lee, 2017). Shapley values are mainly applied to situations where the contribution of each actor is not equal but cooperates to obtain a benefit or reward. Shapley values have been widely used in artificial intelligence to provide good interpretability for machine learning and deep learning black box models (Rozemberczki et al., 2022). The proposed method can attribute the output value of the model to each Shapley value in the dataset at each sample level. Shapley values provide a natural way to calculate which features contribute to predictions, interpreting a model trained on a set of features as a coalition of players’ value functions. The Shapley value explains the degree of contribution of each feature to the outcome.
3 Results
3.1 Prototype design
The prototype was successfully developed with a dimension of 50 cm × 30 cm × 30 cm. The testing sample was placed in the chamber of the prototype, as shown in Figure 6A. The sample was placed to focus the laser light on the center of the flask, as shown in Figure 6B. The particles that randomly moved in the flask scattered the detection beam while the sensor received the scattered signal in real-time. The pattern of scattering light was affected by the size and shape of the microparticles (Hussain et al., 2019). A black box was used to avoid external interference, improving the quality of the acquired signal, as shown in Figure 6C.
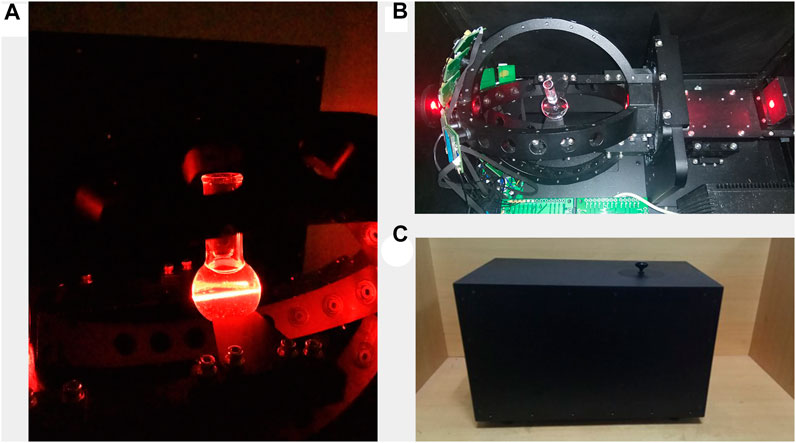
FIGURE 6. (A) Internal status of the prototype during the operation; (B) photodetectors are distributed in the backward direction; and (C) an external cover of the system is used to avoid external light (dimension: 50 cm × 30 cm × 30 cm).
3.2 Optimized condition experiments
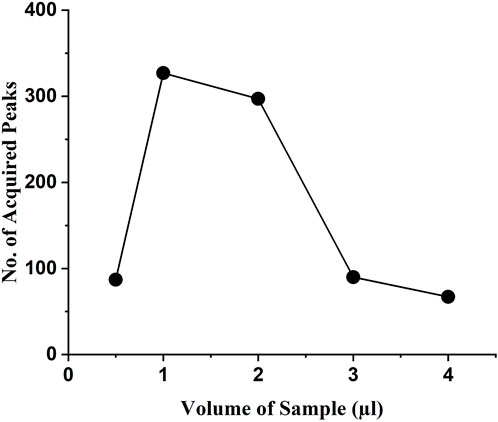
The testing samples with concentrations of 0.0125, 0.025, 0.05, 0.075, 0.1, and 0.125 mg/ml were mixed with DI water to acquire the optimal concentration. Each of the experiments was performed for 30 min. Samples with different concentrations were tested to obtain the average number of peaks (Figure 7). The scattering of the light was weak when the concentration was too low, so the number of detected peaks was less. At higher concentrations, the number of detected characteristic peaks was also too low due to particle-to-particle interaction. Overall, the experimental results showed that a higher number of peaks in the waveform were generated at a sample concentration of 0.025 mg/ml. The classification outcomes showed incorrect results for samples with concentrations below 0.025 mg/ml. Therefore, the sample concentration of 0.025 mg/ml is considered as the detection limit.
3.3 Signal testing
The prepared samples with an optimum concentration were used to detect the MDLS. The time-domain light scattering signals from three different particles were obtained for 30 min. The SNR of the signal increased from 2.98 to 6.698 after applying the second order Butterworth filter to the acquired raw data. Figures 8A–C shows the test signal obtained from 12 channels for three particles with time duration of 3 min. An output signal shows significant variations in the peak values obtained from different particles sizes. The peak values represent the time when the particles pass through the detection beam. The signal test significantly revealed the similarity of the particle signals of the three different particle sizes in terms of peak features and combinations of detection channels, so the feature extraction and machine learning approach can significantly improve the effectiveness of the classification task.
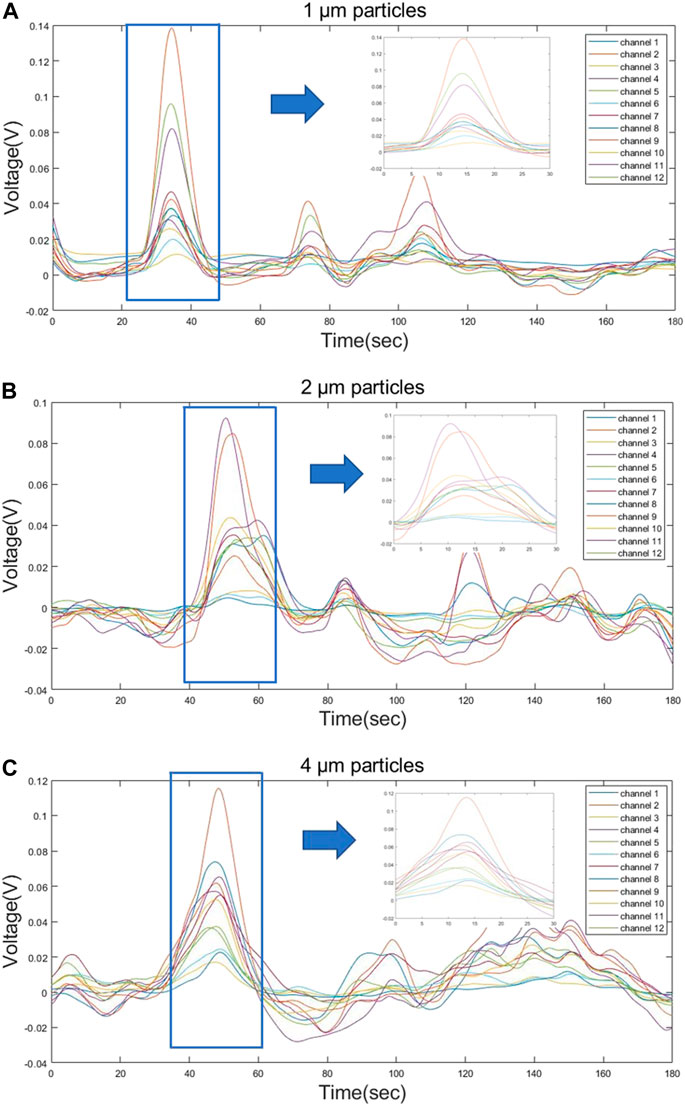
FIGURE 8. Partial waveform signals from three different sizes of particles (A) 1 µm (B) 2 µm and (C) 4 µm appeared during the 180 s of detection, during which the particles passing through the beam showed a significant voltage signal on the sensor.
3.4 Features reduction and classification algorithms
PCA and RFE were used as feature selection algorithms, and then 5-fold cross-validation was applied to the features. Before training and testing the classifiers, the features matrix were labeled as 1 µm (class 0 label), 2 µm (class 1 label), and 4 µm (class 2 label). The number of features varied from 5 to 60, with an increment of 5 in each iteration. A 5-fold cross-validation evaluated the results of each feature selection. The highest accuracies of LR, RF, and SVM classifiers using 50 selected features with PCA were 91.97%, 88.89%, and 91.74%, respectively (Figure 9A). Similarly, the highest accuracies of LR, RF classifiers were 92.08%, 91.52%, using 30 selected features, the highest accuracy of SVM classifier were 95.38% using 50 selected features with RFE, (Figure 9B). Overall, the classification results using RFE were more accurate than PCA. The RFE feature selection method selected a subset of 50 features to obtain the highest classification accuracy.
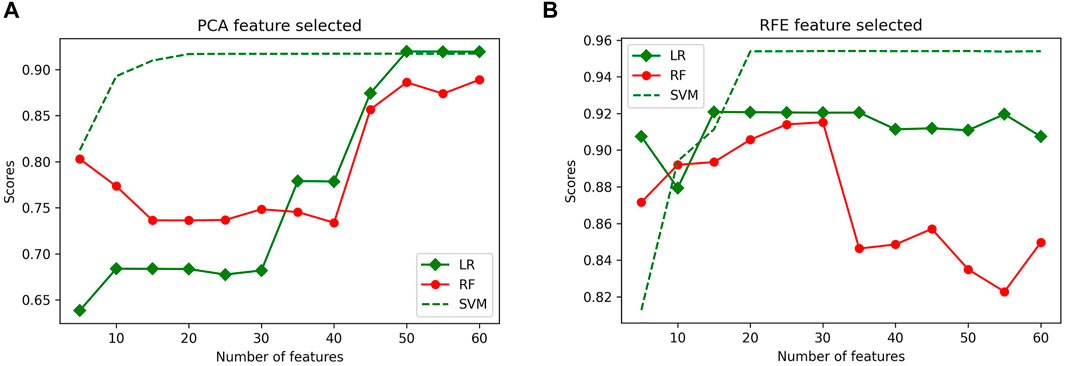
FIGURE 9. Average classification scores obtained from LR, RF and SVM classifiers using (A) PCA and (B) RFE for feature selection after 5-fold cross-validation.
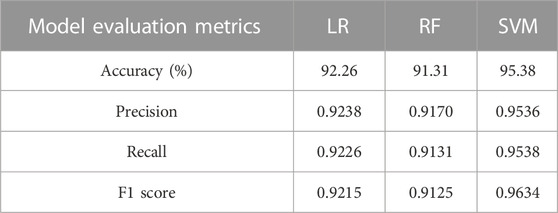
The confusion matrix was plotted from the outcomes to evaluate the performance of the three classifiers. The row of the confusion matrix represented the actual sample classes, and the column represented the predicted sample classes (Figure 10). The green boxes in the diagonal line represented the outcomes that were correctly classified. The remaining feature data points represented the incorrectly classified values. The identification accuracy, precision, recall, and F1 score of the testing dataset were evaluated using Eqs 14–17, and the results are presented in Table 1. Overall, the SVM(kernel = “linear”, decision_function_shape = “ovr”,C = 100, gamma = 0.0001, probability = True) classifier achieved higher classification accuracy than LR and RF classifiers.

FIGURE 10. Confusion matrix of three different classifiers (A) RFE-LR (B) RFE-RF (C) RFE-SVM on testing set.
3.5 Features contributions
The Shapley values were used to validate whether the 50 power spectrum features subset influenced the prediction results. We computed the Shapely values that were contributed from the power spectral features of the SVM classification model. The average Shapely values from each feature and the corresponding Shapley values for each data point were calculated and counted. The bar chart on the left (Figure 11A) showed the average Shapley values for the three classifiers, indicating each feature’s average contribution to the final output. The scatter plot on the right (Figure 11B) demonstrated the distribution of Shapley values and their contribution to the model output structure. The color of each point represented the intensity of the feature value. Blue data points indicated low features, while red represented the opposite. The results showed a significant contribution of the first 12 features to the results, consistent with the proposed channel arrangement for the acquisition system. The first 12 features that corresponded to the zero-order moment features of the 12 channels played a crucial role in the contribution of the classification results.
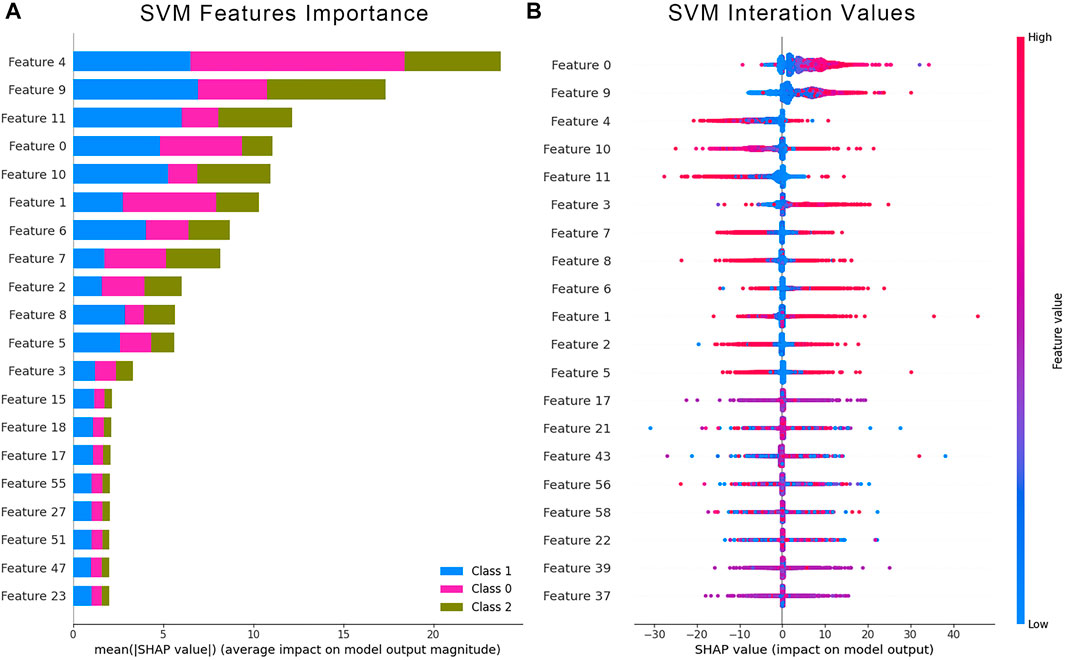
FIGURE 11. Quantification of feature impact on prediction through analysis of Shapley additive explanations (SHAP) values of the 20 most impactful features. (A) Averaged Shapley values of features with higher contribution indicate an average effect of these features on the output amplitude. (B) The scatter plot represents the distribution of Shapley values and the effect on the model output of all test samples.
4 Discussion
The objective of this paper is to develop a new system and to verify the ability of the proposed technique for the identification of different particle sizes. With the continuous development of point-of-care testing (POCT) technology, detection techniques are gradually evolving with high accuracy and simplicity. The developed system can identify the size of microparticles with high accuracy in a short time. The given analysis was conducted by collecting a large amount of data based on the scattering light from particle samples of different sizes (1, 2, and 4 μm). The time-domain features were obtained from the acquired data, and the features were reduced the number of features to acquire higher classification accuracy. The RFE feature selection method selected a subset of 50 features, and gave best results compared with PCA features selection method. The selected features were trained using machine learning to automate the detection procedure. The logistic regression classifier gave classification accuracies of 95.30%, 92.38%, 89.17% for particle sizes of 1, 2 , and 4 μm, respectively. The random forest classifier gave classification accuracies of 92.59%, 96.71%, 76.62% for particle sizes of 1, 2, and 4 μm, respectively. The SVM classifier showed higher identification accuracy with prominent classification parameters. The SVM classifier gave the highest classification accuracies of 94.41%, 94.20%, 96.12% for particle sizes of 1, 2, and 4 μm, respectively. The trained SVM classifier gives an average classification accuracy of 95.38%. The detection limit of the given method is 0.025 mg/ml. The contribution and effect of each feature to the results were analyzed by features selection methods. Selected features identified by the RFE feature filter have shown superior classification results. The Shapley values of these features described a significant contribution to the results. In summary, the developed system based on MDLS and machine learning can quickly and accurately detect microparticles. Furthermore, the prototype was highly integrated, and the developed method did not require lengthy sample preparation. The given technique requires further validation for practical applications that can be applied to detect microbial particles within the range of 1–4 µm.
Data availability statement
The raw data supporting the conclusion of this article will be made available by the authors, without undue reservation.
Author contributions
Writing—original draft preparation original manuscript writing and algorithm: XH; investigation and methodology: CW; visualization: YW; language embellishment and algorithm: JY; validation: YZ; literature research and validation: JL; sample preparation and data acquisition: MH; project administration and supervision: BL. All authors have read and agreed to the published version of the manuscript.
Funding
This research was funded by NSFC (61401217, 62075098), the Key Research and Development Program of Jiangsu (BE2022160). NSFC (61401217, 62075098) provided funded for sample acquisition and the design of the light scattering prototype for this experiment. The Key Research and Development Program of Jiangsu (BE2022160) provided computer hardware support for this experiment.
Acknowledgments
We are thankful to MH and BL for providing technical guidance for this experiment. The authors are also very grateful to Southeast University for providing the instrumentation support for this experiment.
Conflict of interest
The authors declare that the research was conducted in the absence of any commercial or financial relationships that could be construed as a potential conflict of interest.
Publisher’s note
All claims expressed in this article are solely those of the authors and do not necessarily represent those of their affiliated organizations, or those of the publisher, the editors and the reviewers. Any product that may be evaluated in this article, or claim that may be made by its manufacturer, is not guaranteed or endorsed by the publisher.
References
Altug, H., Oh, S., Maier, S. A., and Homola, J. (2022). Advances and applications of nanophotonic biosensors. Nat. Nanotechnol. 17, 5–16. doi:10.1038/s41565-021-01045-5
Bals, J., Loza, K., Epple, P., Kircher, T., and Epple, M. (2022). Automated and manual classification of metallic nanoparticles with respect to size and shape by analysis of scanning electron micrographs. Materialwiss. Werkst. 53, 270–283. doi:10.1002/mawe.202100285
Bergmeir, C., and Benitez, J. M. (2012). On the use of cross-validation for time series predictor evaluation. Inf. Sci. 191, 192–213. doi:10.1016/j.ins.2011.12.028
Dalili, A., Samiei, E., and Hoorfar, M. (2019). A review of sorting, separation and isolation of cells and microbeads for biomedical applications: Microfluidic approaches. Analyst 144, 87–113. doi:10.1039/c8an01061g
Di, K., Fan, B., Gu, X., Huang, R., Khan, A., Liu, C., et al. (2022). Highly efficient and automated isolation technology for extracellular vesicles microRNA. Front. Bioeng. Biotechnol. 10, 948757. doi:10.3389/fbioe.2022.948757
Fan, X., Zheng, W., and Singh, D. J. (2014). Light scattering and surface plasmons on small spherical particles. Light. Sci. Appl. 3, e179. doi:10.1038/lsa.2014.60
Ghannam, R. B., and Techtmann, S. M. (2021). Machine learning applications in microbial ecology, human microbiome studies, and environmental monitoring. Comput. Struct. Biotechnol. J. 19, 1092–1107. doi:10.1016/j.csbj.2021.01.028
Gong, J., Jaiswal, R., Dalla, P., Luk, F., and Bebawy, M. (2015). Microparticles in cancer: A review of recent developments and the potential for clinical application. Seminars Cell & Dev. Biol. 40, 35–40. doi:10.1016/j.semcdb.2015.03.009
Goodswen, S. J., Barratt, J. L. N., Kennedy, P. J., Kaufer, A., Calarco, L., and Ellis, J. T. (2021). Machine learning and applications in microbiology. FEMS Microbiol. Rev. 45, fuab015. fuab0155. doi:10.1093/femsre/fuab015
Guo, L., Wang, T., Chen, Z., He, N., Chen, Y., and Yuan, T. (2018). Light scattering based analyses of the effects of bovine serum proteins on interactions of magnetite spherical particles with cells. Chin. Chem. Lett. 29, 1291–1295. doi:10.1016/j.cclet.2017.11.017
Guyon, I., Weston, J., Barnhill, S., and Vapnik, V. (2002). Gene selection for cancer classification using support vector machines. Mach. Learn 46, 389–422. doi:10.1023/A:1012487302797
Hawe, A., Schaubhut, F., Geidobler, R., Wiggenhorn, M., Friess, W., Rast, M., et al. (2013). Pharmaceutical feasibility of sub-visible particle analysis in parenterals with reduced volume light obscuration methods. Eur. J. Pharm. Biopharm. 85, 1084–1087. doi:10.1016/j.ejpb.2013.02.004
Hussain, M., Chen, Z., Lv, M., Xu, J., Dong, X., Zhao, J., et al. (2020a). Rapid and label-free classification of pathogens based on light scattering, reduced power spectral features and support vector machine. Chin. Chem. Lett. 31, 3163–3167. doi:10.1016/j.cclet.2020.04.038
Hussain, M., Lv, M., Dong, X., Shen, H., Wang, W., Li, S., et al. (2020b). Design of rapid bacterial identification system based on scattering of laser light and classification of binned plots. J. Nanosci. Nanotechnol. 20, 4047–4056. doi:10.1166/jnn.2020.17491
Hussain, M., Lv, M., Xu, J., Dong, X., Wang, T., Wang, Z., et al. (2019). “Rapid identification of pathogens based on MIE light scattering and machine learning approach,” in IEEE International Symposium on Medical Measurements and Applications (MeMeA), Messina, Italy, June 22, 2022 – June 24, 2022 (IEEE Press), 1–5. doi:10.1109/MeMeA.2019.8802228
Khaire, U. M., and Dhanalakshmi, R. (2022). Stability of feature selection algorithm: A review. J. King Saud Univ. - Comput. Inf. Sci. 34, 1060–1073. doi:10.1016/j.jksuci.2019.06.012
Khushaba, R. N., Takruri, M., Miro, J. V., and Kodagoda, S. (2014). Towards limb position invariant myoelectric pattern recognition using time-dependent spectral features. Neural Netw. 55, 42–58. doi:10.1016/j.neunet.2014.03.010
Klug, K. E., Jennings, C. M., Lytal, N., An, L., and Yoon, J. (2019). Mie scattering and microparticle-based characterization of heavy metal ions and classification by statistical inference methods. R. Soc. open Sci. 6, 190001. doi:10.1098/rsos.190001
Kreimer, S., Belov, A. M., Ghiran, I., Murthy, S. K., Frank, D. A., and Ivanov, A. R. (2015). Mass-spectrometry-based molecular characterization of extracellular vesicles: Lipidomics and proteomics. J. Proteome Res. 14, 2367–2384. doi:10.1021/pr501279t
Kumar, M., Singh, R. S., and Banerjee, T. (2015). Associating airborne particulates and human health: Exploring possibilities. Environ. Int. 84, 201–202. doi:10.1016/j.envint.2015.06.002
Lengyel, M., Kállai-Szabó, N., Antal, V., Laki, A. J., and Antal, I. (2019). Microparticles, microspheres, and microcapsules for advanced drug delivery. Sci. Pharm. 87, 20. doi:10.3390/scipharm87030020
Lerche, D. (2019). Comprehensive characterization of nano- and microparticles by iIn-sSitu visualization of particle movement using advanced sedimentation techniques. Kona 36, 156–186. doi:10.14356/kona.2019012
Li, J., Fu, C., and Yang, C. F. (2013). Recent advances in micro/nano-particles for clinical detection of cancer biomarkers. Anal. Methods 5, 5862–5874. doi:10.1039/C3AY40791H
Li, Y., Li, T., and Liu, H. (2017). Recent advances in feature selection and its applications. Knowl. Inf. Syst. 53, 551–577. doi:10.1007/s10115-017-1059-8
Lock, J. A., and Laven, P. (2011). Mie scattering in the time domain. Part 1. The role of surface waves. J. Opt. Soc. Am. A 28, 1086–1095. doi:10.1364/JOSAA.28.001086
Lugnan, A., Gooskens, E., Vatin, J., Dambre, J., and Bienstman, P. (2020). Machine learning issues and opportunities in ultrafast particle classification for label-free microflow cytometry. Sci. Rep. 10, 20724. doi:10.1038/s41598-020-77765-w
Lundberg, S. M., and Lee, S. (2017). A unified approach to interpreting model predictions. NeurIPS 30, 4768–4777. doi:10.3390/mi11121084
Luo, S., Zhang, Y., Nguyen, K. T., Feng, S., Shi, Y., Liu, Y., et al. (2020). Machine learning-based pipeline for high accuracy bioparticle sizing. Micromachines 11, 1084. doi:10.3390/mi11121084
Lussier, F., Thibault, V., Charron, B., Wallace, G. Q., and Masson, J. (2020). Deep learning and artificial intelligence methods for Raman and surface-enhanced Raman scattering. TrAC Trends Anal. Chem. 124, 115796. doi:10.1016/j.trac.2019.115796
Mcnay, G., Eustace, D., Smith, W. E., Faulds, K., and Graham, D. (2011). Surface-Enhanced Raman scattering (sers) and surface-enhanced resonance Raman scattering (serrs): A review of applications. Appl. Spectrosc. 65, 825–837. doi:10.1366/11-06365
Nakane, H. (2012). Translocation of particles deposited in the respiratory system: A systematic review and statistical analysis. Environ. Health Prev. Med. 17, 263–274. doi:10.1007/s12199-011-0252-8
Olson, J., Dominguez-Medina, S., Hoggard, A., Wang, L., Chang, W., and Link, S. (2015). Optical characterization of single plasmonic nanoparticles. Chem. Soc. Rev. 44, 40–57. doi:10.1039/c4cs00131a
Pahuja, S. K., and Veer, K. (2022), "Recent approaches on classification and feature extraction of eeg signal: A review", Robotica. 40, 77–101. doi:10.1017/S0263574721000382
Ribeiro, M. T., Singh, S., and Guestrin, C. (2016). “Why should I trust you? Explaining the predictions of any classifier,” in Proceedings of the 22nd ACM SIGKDD international conference on knowledge discovery and data mining (San Francisco, California, USA: Association for Computing Machinery), 1135–1144. doi:10.1145/2939672.2939778
Rozemberczki, B., Watson, L., Bayer, P., Yang, H., Kiss, O., Nilsson, S., et al. (2022), "The shapley value in machine learning", arXiv e-prints. arXiv:2202.05594.
Shin, H., Oh, S., Hong, S., Kang, M., Kang, D., Ji, Y., et al. (2020). Early-stage lung cancer diagnosis by deep learning-based spectroscopic analysis of circulating exosomes. ACS Nano 14, 5435–5444. doi:10.1021/acsnano.9b09119
Szkulmowska, A., Wojtkowski, M., Gorczynska, I., Bajraszewski, T., Szkulmowski, M., Targowski, P., et al. (2005). Coherent noise-free ophthalmic imaging by spectral optical coherence tomography. J. Phys. D. Appl. Phys. 38, 2606–2611. doi:10.1088/0022-3727/38/15/011
Veremchuk, L. V., Vitkina, T. I., Barskova, L. S., Gvozdenko, T. A., and Mineeva, E. E. (2021). Estimation of the size distribution of suspended particulate matters in the urban atmospheric surface layer and its influence on bronchopulmonary pathology. Atmosphere 12, 1010. doi:10.3390/atmos12081010
Wang, M., Yin, X., Zhu, Y., and Hu, J. (2022). Representation learning and pattern recognition in cognitive biometrics: A survey. Sensors 22, 5111. doi:10.3390/s22145111
Wieland, S., Balmes, A., Bender, J., Kitzinger, J., Meyer, F., Ramsperger, A. F. R. M., et al. (2022). From properties to toxicity: Comparing microplastics to other airborne microparticles. J. Hazard. Mater. 428, 128151. doi:10.1016/j.jhazmat.2021.128151
Wong, T., and Yeh, P. (2020). Reliable accuracy estimates from k-fold cross validation. IEEE Trans. Knowl. Data Eng. 32, 1586–1594. doi:10.1109/TKDE.2019.2912815
Yang, J., Zhang, D., Frangi, A. F., and Yang, J. Y. (2004). Two-dimensional PCA: A new approach to appearance-based face representation and recognition. IEEE Trans. Pattern Anal. Mach. Intell. 26, 131–137. doi:10.1109/TPAMI.2004.1261097
Yue, S., Fang, J., and Xu, Z. (2022). Advances in droplet microfluidics for SERS and Raman analysis. Biosens. Bioelectron. 198, 113822. doi:10.1016/j.bios.2021.113822
Zhao, X., Zhao, Y., and Gu, Z. (2011). Advances of multiplex and high throughput biomolecular detection technologies based on encoding microparticles. Sci. China Chem. 54, 1185–1201. doi:10.1007/s11426-011-4343-6
Keywords: micro-particles detection, dynamic light scattering, MIE scattering, machine learning, features selection, shapley value
Citation: He X, Wang C, Wang Y, Yu J, Zhao Y, Li J, Hussain M and Liu B (2022) Rapid classification of micro-particles using multi-angle dynamic light scatting and machine learning approach. Front. Bioeng. Biotechnol. 10:1097363. doi: 10.3389/fbioe.2022.1097363
Received: 13 November 2022; Accepted: 06 December 2022;
Published: 16 December 2022.
Edited by:
Guangli Li, Hunan University of Technology, ChinaReviewed by:
Jinghua Chen, Jiangnan University, ChinaWenzhong Liu, Huazhong University of Science and Technology, China
Copyright © 2022 He, Wang, Wang, Yu, Zhao, Li, Hussain and Liu. This is an open-access article distributed under the terms of the Creative Commons Attribution License (CC BY). The use, distribution or reproduction in other forums is permitted, provided the original author(s) and the copyright owner(s) are credited and that the original publication in this journal is cited, in accordance with accepted academic practice. No use, distribution or reproduction is permitted which does not comply with these terms.
*Correspondence: Mubashir Hussain, bXViYXNoaXJAYWEuc2V1LmVkdS5jbg==; Bin Liu, bGl1YmluQG5qbXUuZWR1LmNu
†These authors have contributed equally to this work
 Xu He
Xu He Chao Wang
 Yichuan Wang
 Junxiao Yu
 Yanfeng Zhao1
 Mubashir Hussain
 Bin Liu