- 1Beijing Key Laboratory of Fundamental Research on Biomechanics in Clinical Application, School of Biomedical Engineering, Capital Medical University, Beijing, China
- 2Medical Science Research Center, Department of Otolaryngology, Peking Union Medical College Hospital, Shuaifuyuan 1, Dongcheng District, Beijing, China
- 3Beijing Institute of Ophthalmology, Beijing Tongren Eye Center, Beijing Tongren Hospital, Capital Medical University, Beijing Ophthalmology & Visual Sciences Key Laboratory, Beijing, China
- 4Beijing Advanced Innovation Center for Big Data-Based Precision Medicine, Beihang University and Capital Medical University, Beijing Tongren Hospital, Beijing, China
Purpose: The Ocular Response Analyzer (ORA) is one of the most commonly used devices to measure corneal biomechanics in vivo. Until now, the relationship between the output parameters and corneal typical biomechanical parameters was not clear. Hence, we defined the output parameters of ORA as ORA output parameters. This study aims to propose a method to determine corneal biomechanical parameters based on ORA measurements by finite element simulation and parametric analysis.
Methods: Finite element analysis was used to simulate the mechanics process of ORA measurements with different intraocular pressure (IOP), corneal geometrical parameters and corneal biomechanical parameters. A simplified geometrical optics model was built to simulate the optical process of the measurements to extract ORA output parameters. After that, 70% of the simulated data was used to establish the quantitative relationship between corneal biomechanical parameters and ORA output parameters by parametric analysis and 30% of the simulated data was used to validate the established model. Besides, ten normal subjects were included to evaluate the normal range of corneal biomechanical parameters calculated from ORA.
Results: The quantitative relationship between corneal biomechanical parameters and ORA output parameters is established by combining parametric analysis with finite element simulation. The elastic modulus (E) and relaxation limit (G∞) of the ten normal subjects were 0.65 ± 0.07 MPa and 0.26 ± 0.15, respectively.
Conclusions: A method was proposed to determine corneal biomechanical parameters based on the results of ORA measurements. The magnitude of the corneal biomechanical parameters calculated according to our method was reasonable.
Introduction
The cornea is one of the most important refractive media of the eyeball providing 70% ocular refractive power (Hjortdal and Jensen, 1995). The maintenance of corneal refractive function depends on the normal corneal geometry. Abnormal corneal geometry is usually closely related to its biomechanical characteristics (Viswanathan et al., 2015). Therefore, studying corneal biomechanical properties in vivo has great significance in diagnosing corneal disease such as keratoconus (Scarcelli et al., 2015; Vellara and Patel, 2015; Elham et al., 2017), individualized surgical design, such as corneal refractive correction (Wang B. et al., 2016; Yildirim et al., 2016; Hwang et al., 2017; Zhang et al., 2017) and corneal cross-linking surgery (Steinberg et al., 2014; Matteoli et al., 2016; Subasinghe et al., 2018).
Ocular Response Analyzer (ORA) and Corneal Visualization Scheimpflug Technology (Corvis ST) are two of the most commonly used devices to evaluate corneal biomechanics in clinic. Both of these two devices assess corneal biomechanical properties based on corneal response under rapid air-puff. Parameters provided by these devices are valuable in diagnosing preliminarily keratoconus (Ayar et al., 2015; Elham et al., 2017; Atalay et al., 2019; Koc et al., 2019). Parameters of these two devices doe not only relate to corneal biomechanics but are also influenced by corneal geometrical parameters and intraocular pressure (IOP) (Wang L.-K. et al., 2016; Vinciguerra et al., 2016; Wu et al., 2016; Nemeth et al., 2017; Herber et al., 2019). The limitation of ORA and Corvis ST in clinical applications make it difficult for researchers to obtain corneal biomechanical parameters to diagnose ocular diseases and evaluate corneal treatment effects. Biomechanically speaking, the morphology of the cornea under the external load depends on its biomechanical properties (Mercatelli et al., 2019), which in turn relies on the inherent properties of corneal tissue. Within the range of the physiological IOP, the cornea is likely a linear elastic and viscoelastic tissue (Zhang et al., 2017; Zhang et al., 2018a; Zhang et al., 2018b), and the corneal biomechanical properties can be determined by the corneal elastic modulus (E) and corneal relaxation parameters. We call these parameters “corneal biomechanical parameters”. If the corneal biomechanical parameters can be obtained from these in vivo measurements directly, the ORA and Corvis can be used in basic and clinical research more conveniently.
At present, the biomechanical interpretations of ORA output parameters and dynamic corneal response paremeters (DCRs) from Corvis ST have not reached a consensus. Alternatively, appropriate and effective methods to determine corneal biomechanical parameters based on the results of ORA/Corvis ST measurements need to be further explored and verified.
The researchers have explored the mechanical significance of ORA output parameters and DCRs through the following methods: a. analyzing the influencing factors of ORA output parameters and DCRs by ex vivo eye globe tests (Bao et al., 2015; Zheng et al., 2016); b. suggesting the correlation between ORA output parameters, DCRs and corneal biomechanical parameters (Glass et al., 2008; Han et al., 2014) based on an ideal simplified model or simulating the process of corneal air-puff test by finite element analysis (Elsheikh et al., 2015); and c. providing new corneal biomechanics-related parameters based on corneal air-puff test (Wang L.-K. et al., 2016; Roberts et al., 2017; Shih et al., 2017; Eliasy et al., 2019). In previous studies, we suggested a method to explore the mechanical interpretation of output parameters of ORA (Qin et al., 2019b) and proposed a method to determine corneal elastic modulus based on Corvis measurements (Qin et al., 2019a). However, an effective method to obtain corneal biomechanical parameters directly from ORA output parameters is still lacking. To this end, the present study proposes a method to determine corneal typical biomechanical parameters from ORA measurements.
Actually, it is very sophisticated and difficult to establish a theoretical formula. It is expensive and impractical to establish this relationship based on a large number of ORA measurements and biomechanical tests of the cornea in vitro. A feasible and economical way is finite element simulation with the advantage of calculating various loading conditions with the same model. Finite element analysis is used increasingly in the field of corneal biomechanics research (Elsheikh et al., 2011; Kling et al., 2014; Elsheikh et al., 2015; Lago et al., 2015; Sinha Roy et al., 2015; Jannesari et al., 2019). In this study, finite element analysis was used to simulate the corneal response with different corneal biomechanical parameters, corneal geometrical parameters and intraocular pressures (IOP). Additionally, parametric analysis was applied to establish the relationship between ORA output parameters and corneal biomechanical parameters based on a geometrical optics model that computes the ORA output parameters from finite element calculation results. Besides, ten normal subjects were included to evaluate the normal range of corneal biomechanical parameters calculated from ORA.
Methods
Finite Element Simulation of ORA Measurements
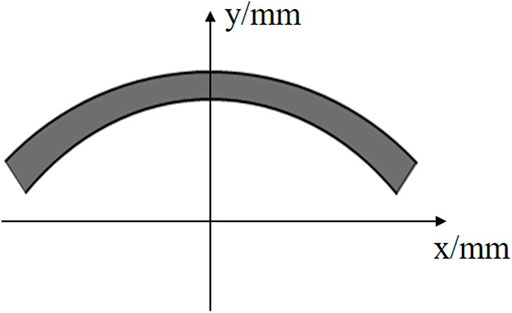
A large number of research results show that both the corneal anterior and posterior surfaces can be described with an elliptic equation (Zhang et al., 2006; Elsheikh, 2010). Therefore, in this study we established an ellipsoidal axisymmetric corneal geometrical model (Figure 1) to carry out dynamic finite element analysis of ORA measurements. The corneal anterior and posterior surfaces can be described as Equation 1 and 2, respectively.
In Eqs. 1, 2, R was the corneal central curvature radius, CCT was the central corneal thickness, p was the ellipse shape factor of the corneal anterior surface. Set x to be R0 in Eqn. 1 we can get the coordinates (R0, y0) of anterior corneal limbus. Substitute (R0, y0-PCT) into Eqn. 2 we can get a in Eqn. 2. R0 was the X coordinate of corneal limbus, PCT was the thickness of corneal thickness which was set to be 100 μm larger than CCT (Dubbelman, et al., 2009; Elsheikh, et al., 2011; HirjiLarke, 1978).
In the finite element model, the cornea was hypothesized to be linear elastic and viscoelastic material. Corneal elastic modulus (E) and Poisson’s ratio (ν = 0.49) were used to characterize the corneal linear elastic properties. Third-order Prony model (Eqn. 3) was used to characterize the corneal viscoelastic properties (Qin et al., 2019b). In Eqn. 3, a1, a2, a3, τ1, τ2, τ3 are corneal viscoelastic parameters, G was the normalized stress during stress relaxation experiment. As corneal topography is measured at a specific intraocular pressure IOP and is distinct from the unloaded shape that would be obtained at an IOP of 0 mm Hg, the undeformed state was solved by a custom finite element model at first. Air-puff force was applied on corneal apex as a 25 ms surface traction with temporal (Eqn. 4) and spatial (Eqn. 5) normal distribution. Eqn. 4 was obtained by fitting the force-time curve, and Eqn. 5 was obtained by fitting the curve provided by Ref (Elsheikh, 2010). x was the distance from the node on the cornea to the corneal symmetry axis. The displacements of limbus are constrained. Cornea was meshed with C3D8R mesh and explicit dynamic analysis was used to simulate the measurements. The finite element analysis was conducted on ABAQUS/Explicit. The variation of corneal anterior surface coordinate along the air-puff force during the measurements was extracted.
Geometrical Optics Simulation of ORA Measurements
According to the principle of ORA measurement, we constructed the ideal geometrical optics model shown in Figure 2. Transmitter S1 and a receiver S2 are on the plane 11 cm away from the corneal apex. The distances between S1 and corneal apex, S2 and corneal apex were both
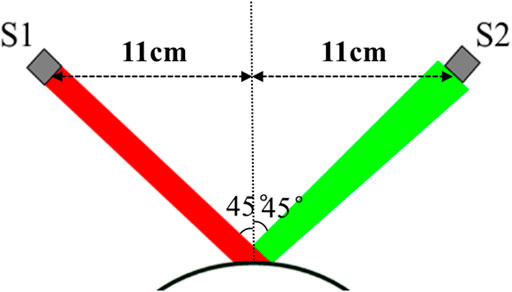
FIGURE 2. Geometrical optics model of ORA measurement. S1 is a transmitter and S2 is a receiver with a diameter of 3 mm S1 and S2 were on the plane 11 cm away from the corneal apex. The incident angle is 45°. The incident light was reflected by corneal anterior surface and part of the light is received by the receiver S2.
Determining Corneal Biomechanical Parameters by Parametric Analysis
Corneal central curvature radius (R), central corneal thickness (CCT) and intraocular pressure (IOP) are important factors affecting ORA measurement results. Therefore, in this study, we set the R, CCT, IOP to be ranged in 6–8 mm, 450–650 μm, 10–30 mmHg, respectively. The corneal biomechanical parameters were mostly reported by biomechanical experiments in vitro, such as corneal tensile tests or corneal expansion test. Compared to these in vitro experiments, an ORA test was completed within 30 ms, which made there be significant differences between uniaxial tensile test and ORA test in loading mode and magnitude. Corneal non-linear elastic and viscoelastic properties suggest that we adjust the range of corneal biomechanical parameters to make the simulation results consistent with the experimental results. Our previous study (Qin et al., 2019b) found that the simulated Corneal Hysteresis (CH) and Corneal Resistance Factor (CRF) have a similar amplitude with the experimental results when we set the corneal elastic (E) to be 1/3 of corneal physiological elastic modulus obtained from the uniaxial tensile test and set the parameters τ1, τ2 and τ3 of third-order Prony series to be 1/10 of the uniaxial tensile test results. According to the reported range of corneal biomechanical parameters, the corneal elastic modulus was varied in the range of 0.2–0.6 MPa (Elsheikh et al., 2008; Shih et al., 2017; Wang et al., 2017; Qin et al., 2019b), a1 and τ1 of the third-order Prony series varied in the range of 0.25–0.6 and 0.001–0.1 s, respectively, when we carried out parametric analysis. a2 and a3 were set to be 0.1. τ2, τ3 were set to be 0.0001 s (Yang et al., 1999).
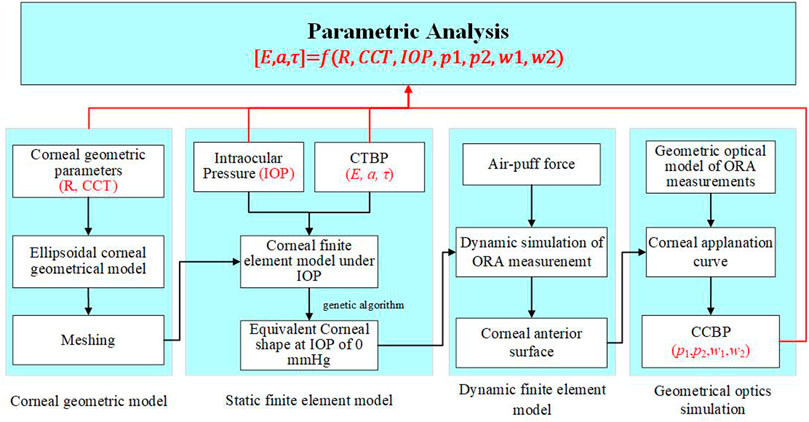
The flowchart to determine corneal biomechanical parameters based on ORA measurement is shown in Figure 4. For any a given set of parameters R, CCT, IOP, E, a1 and τ1, the finite element analysis was used to simulate the corneal response to an air-puff. The normalized corneal applanation curve was obtained by geometrical optic simulation. According to our previous studies and the reported results, the first applanation time (t1), the second applanation time (t2), the width at the 50% height of the peak of the first peak (w1) and second peak (w2) can reflect corneal biomechanical properties. Therefore, in this study, these four parameters were recorded as ORA output parameters for parametrical analysis.
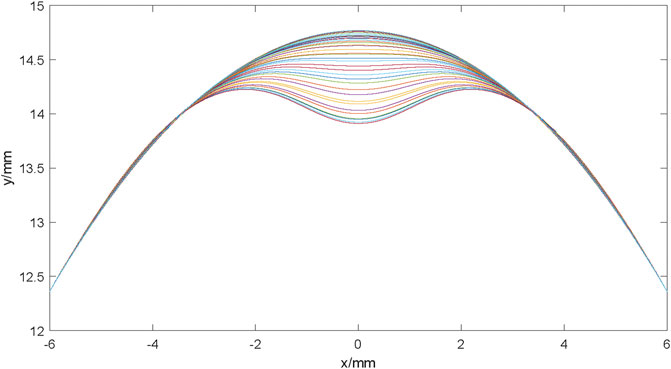
FIGURE 4. The corneal anterior surface contour at different times during ORA measurements. The cornea gradually deforms from the initial state to the first applanation state, and then to the concave state during the 25 ms measurement. With the air puff pressure removed gradually, the cornea deformed to the initial state gradually.
The produce started with a generation of a random matrix of 2000 × 6 with MATLAB, representing 2,000 times input for 6 parameters (R, CCT, IOP, E, a1 and τ1) with uniform distribution in the range of each parameter (shown above). After that, the geometric model of the cornea was constructed, followed a start-up of ABAQUS to fulfill the calculation automatically. The relationship model between corneal biomechanical parameters and ORA output parameters, corneal geometric parameters and IOP was established by multiple quadratic regression model. We took 70% of the data randomly to train the model and the other 30% data were used to verify the established model.
Subjects and Measurements
Ten healthy subjects (10 eyes) were included in this study. The age of subjects was between 20 and 25 years old. No subject had any eye diseases, history of corneal or eye surgery and systemic diseases affecting their eye functions. All subjects took off soft contact lenses or hard contact lenses at least 1 month before the examination. For each subject, one eye was selected randomly and included in the study. All subjects were informed the consent and had signed the informed consent form before the examination. The informed consent form was in compliance with the tenets of the Declaration of Helsinki. This study was approved by the institutional review board of the Beijing Tongren Hospital, Beijing Institute of Ophthalmology, Beijing, China.
Since the ORA test did not provide corneal geometrical parameters such as CCT and R, this study conducted three ORA tests and one Corvis test for all subjects. All ORA and Corvis measurements were performed by the same technician. During the ORA test, any measurement result with a waveform score (WS) exceeding 3.5 was included. The Corvis test result was included when the reading of “alignment” was “OK”. Otherwise, the measurements were repeated until the reading was “OK”. The edge of the first undeformed corneal image obtained by Corvis test is extracted to obtain the CCT and R (Qin et al., 2019a), and the corneal biomechanical corrected IOP (bIOP) was read from the Corvis test results for the subsequent calculating of corneal biomechanical parameters.
Results
From the output database of the finite element simulation model of ORA measurements, we obtained the coordinate files of the anterior corneal surface at different times. The profile of the anterior corneal surface at different times during ORA measurements was drawn by using the file reading and writing function, as well as the drawing function of MATLAB for the subsequent geometrical optical simulation. The results are shown in Figure 5.

FIGURE 5. Optical paths at different times during ORA measurements. (A) initial state; (B) the first applanation state; (C) the maximum indentation state; (D) the second applanation state; (E) the end state.
The results of the geometrical optical simulation are shown in Figure 6. Due to the variation of the corneal apical position and the corneal shape during ORA measurements, the reflected light changes accordingly. Figure 6 (a–f) represents the typical optical path at different times during ORA measurements.
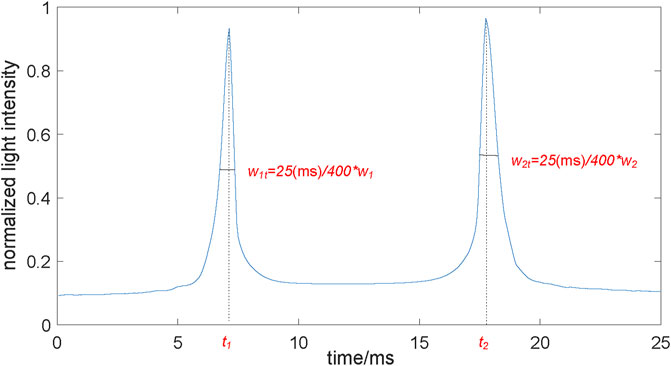
FIGURE 6. The normalized corneal applanation curve. The normalized lighted intensity was the ratio of the number of light rays received by the receiver to the total number of incident light rays. When the cornea reached the applanation during the load and unload state, the curve reaches at a peak, respectively. t1, t2, were the two applanation time. w1t, w2t were the two peak widths, which were proportional to w1, w2 of the ORA output.
According to the ratio of the number of light rays received by the receiver to the total number of incident light rays during the ORA test (Figure 6), the normalized corneal applanation curve was obtained (Figure 3). The two applanation times t1 and t2 and the two peak widths w1 and w2 can be extracted from the normalized corneal applanation curve. The two applanation pressures p1 and p2 can be calculated according to Eqn. 4.
Figures 7A–D shows the variation of the simulated ORA output parameters with corneal biomechanical parameters, CCT, R and IOP. In Figure 7, the vertical axis shows the simulated ORA output parameters while the horizontal axes represent the independent variables. The green solid curves simulate the variation of the average simulated ORA output parameters with one independent variable when other parameters were set to the value in the small boxes below. (i.e., the green curve in the first plot in Figure 7A represented the variation of the simulated w1 with E, when the a1, lgτ1, R, CCT, IOP were set to be 0.4, −2.5, 7.0 mm, 550 μm, 20 mm Hg, respectively). The red dotted curves are the ranges of the simulated ORA output parameters. Results shown in Figure 7 suggest that w2, p1 and p2 are positively correlated with the corneal elastic modulus (E) while w1, w2, and p1 are significantly positively correlated with a1. Furthermore, w1, w2 are likely significantly positively correlated with τ1. Also, p2 and a1, τ1, IOP have a parabolic relationship, while w2 are positively and p1 negatively correlated with IOP. The correlations between other parameters were not significant.
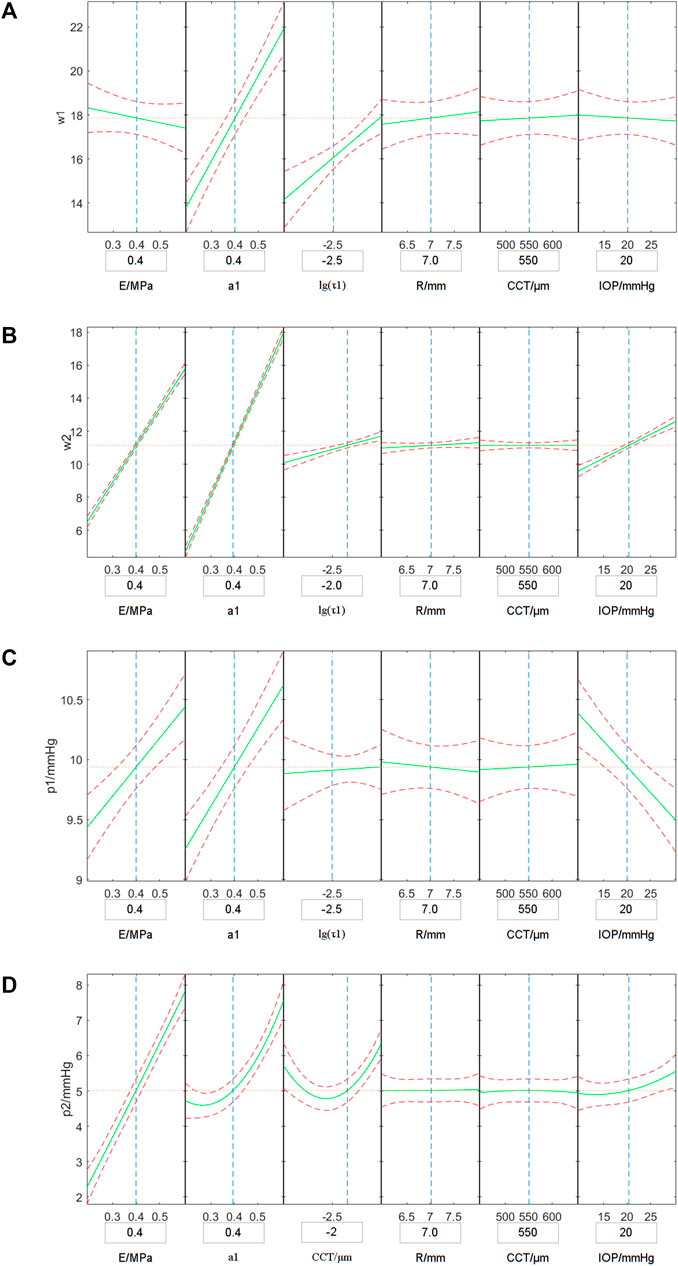
FIGURE 7. Variations of the simulated w1 (A), w2 (B), p1 (C) and p2 (D) with corneal biomechanical parameters, CCT, R and IOP. The vertical axis represents the simulated ORA output parameters and the horizontal axes shows independent variables. The green solid curves simulate the variation of the average simulated ORA output parameters with one independent variable when other parameters set to the value in the boxes under the horizontal axis, and the red dotted curves are the range of the simulated ORA output parameters.
The relationship model based on the 70% of the simulated data was established by multiple quadratic regression model. The results are shown in Eqs. 6—8. In the equations, we take the mean value of each parameter (E0 = 0.4 MPa, τ10 = 0.001 s, R0 = 7 mm, IOP0 = 15 mmHg, w10 = 10, w20 = 17, p10 = 10 mmHg, p20 = 5 mmHg) to make the parameters dimensionless.
Figure 8 shows the results of the comparison between the predicted value of corneal biomechanical parameters calculated according to Eqs. 6–8 and the set corneal biomechanical parameters using the remaining 30% data. The results show that there was good consistency for the corneal elastic modulus E, corneal viscoelastic parameter a1, τ1 between the predicted value and the true value. This indicates that the multiple regression model might be enough to describe the relationship between corneal biomechanical parameters and ORA output parameters.
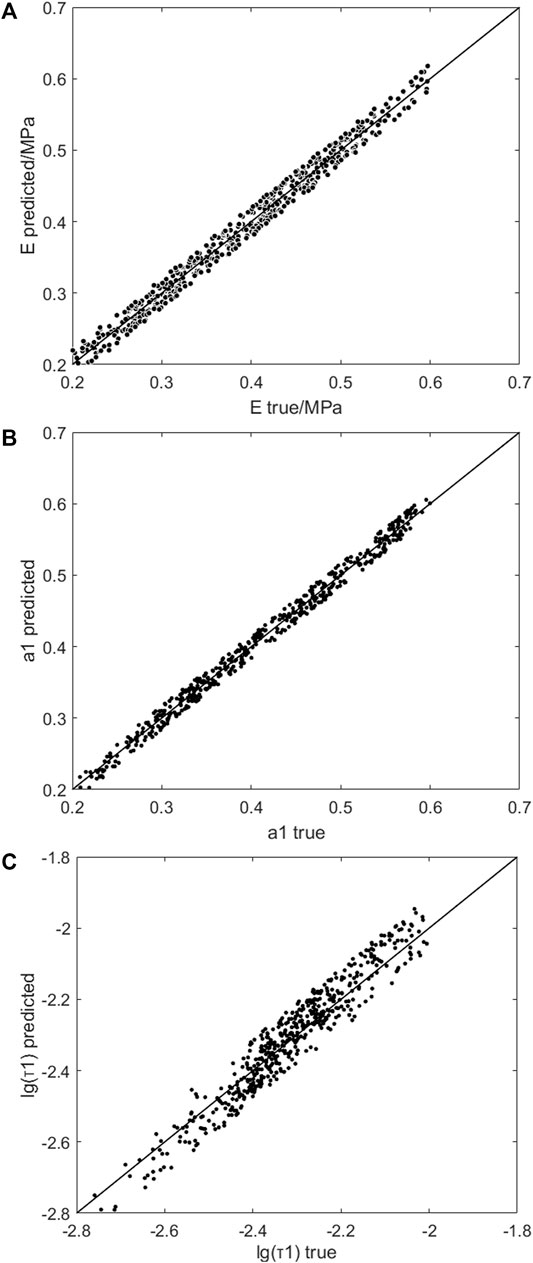
FIGURE 8. The comparison of the predicted and set E (A), a1 (B) and τ1 (C). The horizontal axis was the true value in finite element simulation, and the vertical axis was the predicted value of the multiple quadratic regression model.
For the ten healthy subjects, the CCT, R, and corneal biomechanics corrected intraocular pressure (bIOP) were 526.1 ± 31.1 μm, 7.77 ± 0.47 mm and 18.7 ± 2.4 mmHg, respectively. For each one, t1, t2, w1 and w2 were extracted from the ORA database. The p1, p2 were calculated from t1, t2 according to Eqn. 4. The average of the three ORA measurement results was used to calculate the corneal biomechanical parameters The ORA test results are shown in Table 1, which also provides the results of corneal biomechanical parameters calculated according to Eqs. 6–8. We can see that the a1 of normal subjects were 0.54 ± 0.15, as the a2 and a3 were set to 0.1 in the third-order Prony series. The relaxation limit (G∞ = 1-a1-a2-a3) of the normal subjects were 0.26 ± 0.15. The magnitude of E and G∞ were basically consistent with the results of corneal uniaxial tensile test (Elsheikh et al., 2008; Wang et al., 2017).

TABLE 1. Results of ORA measurements and the calculated corneal biomechanical parameters in healthy subjects.
Discussion
In this study, the dynamic finite element simulation and geometric optical simulation of the ORA measurement process with different geometric parameters (CCT and R), intraocular pressure (IOP) and corneal biomechanical parameters (E, a1 τ1) were carried out to obtain ORA output parameters. Through a parametric study, we proposed a method to determine the corneal biomechanical parameters based on ORA measurements. The results of these studies are of great significance for the further promotion of ORA in clinical applications.
It is important to determine the range of the parameters in parametric analysis. The range of corneal geometrical parameters and IOP can be get from the reports on corneal Corvis or Pentacam measurements conveniently. The corneal biomechanical parameters were mostly reported by biomechanical experiments in vitro, such as corneal tensile tests or corneal expansion test. Compared to these in vitro experiments, an ORA test was completed within 30 ms, which made there be significant differences between uniaxial tensile test and ORA test in loading mode and magnitude. Corneal non-linear elastic and viscoelastic properties suggest that we adjust the range of corneal biomechanical parameters to make the simulation results consistent with the experimental results. The results in our previous study showed that when the cornea elastic modulus was set to be 1/3 of the corneal elastic modulus in physiological range obtained by uniaxial tensile test, and τ1, τ2 and τ3 were set to be 1/10 of the corneal stress relaxation results, the amplitudes of ORA output parameters obtained by finite element simulation was basically consistent with the measured values. In this study, we set the E to the range of 0.2–0.6 MPa, a1 and τ1 of the third-order Prony series varied in the range of 0.25–0.6 and 0.001–0.01 s, respectively, when we carried out parametric analysis referred to these results (Qin et al., 2019b).
Although CH and CRF are two of the comprehensive ORA output parameters obtained directly from the ORA test, which were derived from the linear combination of the two applanation pressure (p1 and p2) (Luce, 2005), there is no consistent report on the relationship between CH, CRF and p1, p2. Both ORA test and finite element simulation can easily obtain p1 and p2, therefore, this study directly used p1 and p2 as ORA output parameters for parametric analysis. In geometric optics simulation of ORA test, corneal surface was regarded as smooth surface. The influence of corneal surface roughness, tear film and other factors were ignored. These factors may affect some of the applanation curve waveform parameters such as the applanation peaks height h1, h2, etc. Yet, the influence on the width of peaks (w1 and w2) were relatively small (Nakao et al., 2017). Our previous study also found that w1, w2 were significantly correlated with corneal biomechanical parameters. Therefore, in this study, w1 and w2 were used to determine the corneal biomechanical parameters.
Cornea is a nonlinear elastic and viscoelastic biological soft tissue. As the cornea is still within the physiological range under the action of fast air-puff (Wang et al., 2017; Zhang et al., 2018a; Zhang et al., 2018b), the cornea was regarded as linear elastic and viscoelastic material for the finite element simulation in this study. As can be seen in Figure 7, with an increase of corneal elastic modulus (E), the simulated values of p1 and p2 also increased. Also, with the increase of the viscoelastic parameter a1, the parameters w1, w2, p1 and p2 showed upward trends. With the increase of the viscoelastic parameter τ1, the simulated values of w1 and w2 increased, and the simulated values of p2 decreased first and then increased. These results indicate that the four ORA test parameters we selected can reflect the biomechanical properties of the cornea.
In addition to the corneal biomechanical parameters, corneal geometric parameters such as central corneal curvature radius (R), central corneal thickness (CCT) and intraocular pressure (IOP) can also affect the ORA measurement results (Terai et al., 2012; Hwang et al., 2013; Sharifipour et al., 2016; Fujishiro et al., 2020). Therefore, this study further examined the influence of these parameters on the finite element simulation results to obtain more accurate corneal biomechanical parameters. The results showed that with the increase of IOP, the simulated values of w2 and p2 increased, while the simulated values of p1 decreased. With the increase of R, the simulated values of w1 and w2 increased.
Based on the finite element simulation results of corneal ORA tests with different corneal geometric parameters, IOP, and corneal biomechanical parameters we established a multiple quadratic regression model to determine corneal biomechanical parameters As shown in Eqs. 6–8, E was negatively correlated with w1 and w2 while being positively correlated with p2. This, however, was basically consistent with the negative correlation between E and w1, w2 reported in our previous study (Qin et al., 2019a). As high IOP and R will lead to overestimation of corneal elastic modulus, the coefficients of IOP and R in Eqn. 6 were negative, thus weakening the influence of intraocular pressure and corneal radius of curvature on the calculation results of E. According to Eqs. 7, 8, the viscoelastic parameter a1 has a postive correlation with w2, p1 and a nonlinear relationship with w1 and p2. The viscoelastic parameter τ1 is negatively correlated with w1, p1 and p2 while being positively correlated with w2. If one disregarded the differences of IOP and R, the viscoelastic parameter a1 of subjects with high IOP and R would be overestimated.
The amplitude of air-puff pressure provided by ORA varied among different subjects according to corneal conditions. However, the pattern of air-puff amplitude provided by ORA has not been reported. In this study, the finite element simulation of ORA test ignored the difference of air-puff pressure, and the obtained corneal elastic modulus E ranged from 0.3 to 0.8 MPa, which was basically consistent with the order of magnitude of human corneal elastic modulus reported in literature (Wang et al., 2017). The viscoelastic parameters a1 and τ1 ranged from 0.3–0.6 and 0.002–0.005 s, respectively. Since both a2 and a3 were set to be 0.1 in the third-order Prony series, the relaxation limit (G∞) ranged from 0.2 to 0.5, which was basically consistent with the results of corneal uniaxial tensile test (Elsheikh et al., 2008). In addition, it can be seen in Figure 8 that the CTBP calculated by Eqs 6–8 are in good consistency with the corneal classical biomechanical parameters input in finite element simulation. Besides, there was a good consistency between the corneal elastic modulus E, a1, τ1 between the predicted value and the set value (Figure 8). These results reflect the validity of the proposed method for determining corneal biomechanical parameters.
One of the limitations was that when geometric optics simulation, the corneal surface was regarded as a smooth surface, influence of corneal surface roughness, tear film and other factors was ignored. Comparing the applanation curves obtained from ORA test and optical simulation, these factors may affect the peak heights h1 and h2 in the waveform parameters, and have relatively little effect on the peak widths w1 and w2. Therefore, w1 and w2 were extracted for analysis. A more accurate optical model considering the refraction and reflection of the tear film on cornea and the unsmooth corneal surface may be established, which will help us obtain more real waveform parameters and establish a more accurate quantitative relationship between corneal biomechanical parameters and ORA output parameters. Another limitation was that the sample size was limited, future studies should be conducted based on a larger number of clinical data for better clinical application. Besides, the finite element simulation of ORA test ignored the difference of air-puff pressure as the pattern of air-puff amplitude provided by ORA has not been reported. According to our previous study (Qin et al., 2019b), the simulated CH and CRF have same magnitude with the experimental results although we have ignored the variation of air-puff amplitude. This reminded us the influence of ignoring the air-puff pressure difference may be ignored.
In conclusion, this study provides a method to determine linear elastic and viscoelastic material parameters of human cornea based on ORA measurements. The corneal biomechanical parameters identified by the present method need to be verified further with a great number of data. The clinic applications of this method we shall also explore, such as in diagnosis of keratoconus.
Data Availability Statement
The original contributions presented in the study are included in the article/Supplementary Material, further inquiries can be directed to the corresponding authors.
Ethics Statement
The studies involving human participants were reviewed and approved by institutional review board of the Beijing Tongren Hospital, Beijing Institute of Ophthalmology, Beijing, China. The patients/participants provided their written informed consent to participate in this study.
Author Contributions
XQ and LT contributed equally to this work. LL, H-XZ, YJ: Corresponding author, conception and design of the study, revising the manuscript. XQ and LT: acquisition of the data, drafting the article. H-XZ and DZ: analysis and interpretation of the data.
Funding
This research was supported by Grants from the National Natural Science Foundation of China (Nos. 32171304, 31370952, 82171101); Beijing Nova Program (Z181100006218099); the Open Research Fund from Beijing Advanced Innovation Center for Big Data-Based Precision Medicine, Beijing Tongren Hospital, Beihang University and Capital Medical University (BHTR-KFJJ-202001).
Conflict of Interest
The authors declare that the research was conducted in the absence of any commercial or financial relationships that could be construed as a potential conflict of interest.
Publisher’s Note
All claims expressed in this article are solely those of the authors and do not necessarily represent those of their affiliated organizations, or those of the publisher, the editors and the reviewers. Any product that may be evaluated in this article, or claim that may be made by its manufacturer, is not guaranteed or endorsed by the publisher.
References
Atalay, E., Ozalp, O., Erol, M. A., Bilgin, M., and Yildirim, N. (2019). A Combined Biomechanical and Tomographic Model for Identifying Cases of Subclinical Keratoconus. Cornea 39 (4), 461–467. doi:10.1097/ico.0000000000002205
Ayar, O., Ozmen, M. C., Muftuoglu, O., Akdemir, M. O., Koc, M., and Ozulken, K. (2015). In-vivo Corneal Biomechanical Analysis of Unilateral Keratoconus. Int. J. Ophthalmol. 8, 1141–1145. doi:10.3980/j.issn.2222-3959.2015.06.11
Bao, F., Deng, M., Wang, Q., Huang, J., Yang, J., Whitford, C., et al. (2015). Evaluation of the Relationship of Corneal Biomechanical Metrics with Physical Intraocular Pressure and central Corneal Thickness in Ex Vivo Rabbit Eye Globes. Exp. Eye Res. 137, 11–17. doi:10.1016/j.exer.2015.05.018
Dubbelman, M., Weeber, H. A., van der Heijde, R. G. L., and Völker-Dieben, H. J. (2009). Radius and Asphericity of the Posterior Corneal Surface Determined by Corrected Scheimpflug Photography. Acta Ophthalmol. Scand. 80, 379–383. doi:10.1034/j.1600-0420.2002.800406.x
Elham, R., Jafarzadehpur, E., Hashemi, H., Amanzadeh, K., Shokrollahzadeh, F., Yekta, A., et al. (2017). Keratoconus Diagnosis Using Corvis ST Measured Biomechanical Parameters. J. Curr. Ophthalmol. 29, 175–181. doi:10.1016/j.joco.2017.05.002
Eliasy, A., Chen, K. J., Vinciguerra, R., Lopes, B. T., Abass, A., Vinciguerra, P., et al. (2019). Determination of Corneal Biomechanical Behavior In-Vivo for Healthy Eyes Using CorVis ST Tonometry: Stress-Strain Index. Front. Bioeng. Biotechnol. 7, 105. doi:10.3389/fbioe.2019.00105
Elsheikh, A., Alhasso, D., Gunvant, P., and Garway-Heath, D. (2011). Multiparameter Correction Equation for Goldmann Applanation Tonometry. Optom. Vis. Sci. 88, E102–E112. doi:10.1097/opx.0b013e3181fc3453
Elsheikh, A., Alhasso, D., and Rama, P. (2008). Biomechanical Properties of Human and Porcine Corneas. Exp. Eye Res. 86, 783–790. doi:10.1016/j.exer.2008.02.006
Elsheikh, A. (2010). Finite Element Modeling of Corneal Biomechanical Behavior. J. Refract Surg. 26, 289–300. doi:10.3928/1081597x-20090710-01
Elsheikh, A., Joda, A., Abass, A., and Garway-Heath, D. (2015). Assessment of the Ocular Response Analyzer as an Instrument for Measurement of Intraocular Pressure and Corneal Biomechanics. Curr. Eye Res. 40, 1111–1119. doi:10.3109/02713683.2014.978479
Fujishiro, T., Matsuura, M., Fujino, Y., Murata, H., Tokumo, K., Nakakura, S., et al. (2020). The Relationship between Corvis ST Tonometry Parameters and Ocular Response Analyzer Corneal Hysteresis. J. Glaucoma 29, 479–484. doi:10.1097/ijg.0000000000001486
Glass, D. H., Roberts, C. J., Litsky, A. S., and Weber, P. A. (2008). A Viscoelastic Biomechanical Model of the Cornea Describing the Effect of Viscosity and Elasticity on Hysteresis. Invest. Ophthalmol. Vis. Sci. 49, 3919–3926. doi:10.1167/iovs.07-1321
Han, Z., Tao, C., Zhou, D., Sun, Y., Zhou, C., Ren, Q., et al. (2014). Air Puff Induced Corneal Vibrations: Theoretical Simulations and Clinical Observations. J. Refract Surg. 30, 208–213. doi:10.3928/1081597x-20140212-02
Herber, R., Ramm, L., Spoerl, E., Raiskup, F., Pillunat, L. E., and Terai, N. (2019). Assessment of Corneal Biomechanical Parameters in Healthy and Keratoconic Eyes Using Dynamic Bidirectional Applanation Device and Dynamic Scheimpflug Analyzer. J. Cataract Refract Surg. 45, 778–788. doi:10.1016/j.jcrs.2018.12.015
HirjiLarke, N. K., and Larke, J. R. (1978). Thickness of Human Cornea Measured by Topographic Pachometry. Optom. Vis. Sci. 55, 97–100. doi:10.1097/00006324-197802000-00006
Hjortdal, J. O., and Jensen, P. K. (1995). In Vitro measurement of Corneal Strain, Thickness, and Curvature Using Digital Image Processing. Acta Ophthalmol. Scand. 73, 5–11. doi:10.1111/j.1600-0420.1995.tb00004.x
Hwang, E. S., Stagg, B. C., Swan, R., Fenzl, C. R., Mcfadden, M., Muthappan, V., et al. (2017). Corneal Biomechanical Properties after Laser-Assisted In Situ Keratomileusis and Photorefractive Keratectomy. Opth Vol. 11, 1785–1789. doi:10.2147/opth.s142821
Hwang, H. S., Park, S. K., and Kim, M. S. (2013). The Biomechanical Properties of the Cornea and Anterior Segment Parameters. BMC Ophthalmol. 13, 49. doi:10.1186/1471-2415-13-49
Jannesari, M., Mosaddegh, P., Kadkhodaei, M., Kasprzak, H., and Jabbarvand Behrouz, M. (2019). Numerical and Clinical Investigation on the Material Model of the Cornea in Corvis Tonometry Tests: Differentiation between Hyperelasticity and Viscoelasticity. Mech. Time-depend Mater. 23, 373–384. doi:10.1007/s11043-018-9390-3
Kling, S., Bekesi, N., Dorronsoro, C., Pascual, D., and Marcos, S. (2014). Corneal Viscoelastic Properties from Finite-Element Analysis of In Vivo Air-Puff Deformation. PLoS One 9, e104904. doi:10.1371/journal.pone.0104904
Koc, M., Aydemir, E., Tekin, K., Inanc, M., Kosekahya, P., and Kiziltoprak, H. (2019). Biomechanical Analysis of Subclinical Keratoconus with Normal Topographic, Topometric, and Tomographic Findings. J. Refract Surg. 35, 247–252. doi:10.3928/1081597x-20190226-01
Lago, M. A., Rupérez, M. J., Martínez-Martínez, F., Monserrat, C., Larra, E., Güell, J. L., et al. (2015). A New Methodology for the In Vivo Estimation of the Elastic Constants that Characterize the Patient-specific Biomechanical Behavior of the Human Cornea. J. Biomech. 48, 38–43. doi:10.1016/j.jbiomech.2014.11.009
Luce, D. A. (2005). Determining In Vivo Biomechanical Properties of the Cornea with an Ocular Response Analyzer. J. Cataract Refract Surg. 31, 156–162. doi:10.1016/j.jcrs.2004.10.044
Matteoli, S., Virga, A., Paladini, I., Mencucci, R., and Corvi, A. (2016). Investigation into the Elastic Properties of Ex Vivo Porcine Corneas Subjected to Inflation Test after Cross-Linking Treatment. J. Appl. Biomater. Funct. Mater. 14, E163–E170. doi:10.5301/jabfm.5000262
Mercatelli, R., Mattana, S., Capozzoli, L., Ratto, F., Rossi, F., Pini, R., et al. (2019). Morpho-mechanics of Human Collagen Superstructures Revealed by All-Optical Correlative Micro-spectroscopies. Commun. Biol. 2, 117. doi:10.1038/s42003-019-0357-y
Nakao, Y., Kiuchi, Y., and Okimoto, S. (2017). A Comparison of the Corrected Intraocular Pressure Obtained by the Corvis ST and Reichert 7CR Tonometers in Glaucoma Patients. Plos One 12, e0170206. doi:10.1371/journal.pone.0170206
Nemeth, G., Szalai, E., Hassan, Z., Lipecz, A., Flasko, Z., and Modis, L. (2017). Corneal Biomechanical Data and Biometric Parameters Measured with Scheimpflug-Based Devices on normal Corneas. Int. J. Ophthalmol. 10, 217–222. doi:10.18240/ijo.2017.02.06
Qin, X., Yu, M., Zhang, H., Chen, X., and Li, L. (2019b). The Mechanical Interpretation of Ocular Response Analyzer Parameters. Biomed. Res. Int. 2019, 5701236. doi:10.1155/2019/5701236
Qin, X., Tian, L., Zhang, H., Chen, X., and Li, L. (2019a). Evaluation of Corneal Elastic Modulus Based on Corneal Visualization Scheimpflug Technology. Biomed. Eng. Online 18, 42. doi:10.1186/s12938-019-0662-1
Roberts, C. J., Mahmoud, A. M., Bons, J. P., Hossain, A., Elsheikh, A., Vinciguerra, R., et al. (2017). Introduction of Two Novel Stiffness Parameters and Interpretation of Air Puff-Induced Biomechanical Deformation Parameters with a Dynamic Scheimpflug Analyzer. J. Refract Surg. 33, 266–273. doi:10.3928/1081597x-20161221-03
Scarcelli, G., Besner, S., Pineda, R., Kalout, P., and Yun, S. H. (2015). In Vivo biomechanical Mapping of normal and Keratoconus Corneas. JAMA Ophthalmol. 133, 480–482. doi:10.1001/jamaophthalmol.2014.5641
Sharifipour, F., Panahi-Bazaz, M., Bidar, R., Idani, A., and Cheraghian, B. (2016). Age-related Variations in Corneal Biomechanical Properties. J. Curr. Ophthalmol. 28, 117–122. doi:10.1016/j.joco.2016.05.004
Shih, P. J., Huang, C. J., Huang, T. H., Lin, H. C., Yen, J. Y., Wang, I. J., et al. (2017). Estimation of the Corneal Young's Modulus In Vivo Based on a Fluid-Filled Spherical-Shell Model with Scheimpflug Imaging. J. Ophthalmol. 2017, 5410143. doi:10.1155/2017/5410143
Sinha Roy, A., Kurian, M., Matalia, H., and Shetty, R. (2015). Air-puff Associated Quantification of Non-linear Biomechanical Properties of the Human Cornea In Vivo. J. Mech. Behav. Biomed. Mater. 48, 173–182. doi:10.1016/j.jmbbm.2015.04.010
Steinberg, J., Katz, T., Mousli, A., Frings, A., Casagrande, M. K., Druchkiv, V., et al. (2014). Corneal Biomechanical Changes after Crosslinking for Progressive Keratoconus with the Corneal Visualization Scheimpflug Technology. J. Ophthalmol. 2014, 579190. doi:10.1155/2014/579190
Subasinghe, S. K., Ogbuehi, K. C., and Dias, G. J. (2018). Current Perspectives on Corneal Collagen Crosslinking (CXL). Graefes Arch. Clin. Exp. Ophthalmol. 256, 1363–1384. doi:10.1007/s00417-018-3966-0
Terai, N., Raiskup, F., Haustein, M., Pillunat, L. E., and Spoerl, E. (2012). Identification of Biomechanical Properties of the Cornea: the Ocular Response Analyzer. Curr. Eye Res. 37, 553–562. doi:10.3109/02713683.2012.669007
Vellara, H. R., and Patel, D. V. (2015). Biomechanical Properties of the Keratoconic Cornea: a Review. Clin. Exp. Optom. 98, 31–38. doi:10.1111/cxo.12211
Vinciguerra, R., Elsheikh, A., Roberts, C. J., Ambrósio, R., Kang, D. S. Y., Lopes, B. T., et al. (2016). Influence of Pachymetry and Intraocular Pressure on Dynamic Corneal Response Parameters in Healthy Patients. J. Refract Surg. 32, 550–561. doi:10.3928/1081597x-20160524-01
Viswanathan, D., Kumar, N. L., Males, J. J., and Graham, S. L. (2015). Relationship of Structural Characteristics to Biomechanical Profile in Normal, Keratoconic, and Crosslinked Eyes. Cornea 34, 791–796. doi:10.1097/ico.0000000000000434
Wang, B., Zhang, Z., Naidu, R. K., Chu, R., Dai, J., Qu, X., et al. (2016). Comparison of the Change in Posterior Corneal Elevation and Corneal Biomechanical Parameters after Small Incision Lenticule Extraction and Femtosecond Laser-Assisted LASIK for High Myopia Correction. Contact Lens and Anterior Eye 39, 191–196. doi:10.1016/j.clae.2016.01.007
Wang, L.-K., Tian, L., and Zheng, Y.-P. (2016). Determiningin Vivoelasticity and Viscosity with Dynamic Scheimpflug Imaging Analysis in Keratoconic and Healthy Eyes. J. Biophoton 9, 454–463. doi:10.1002/jbio.201500245
Wang, X., Li, X., Chen, W., He, R., Gao, Z., and Feng, P. (2017). Effects of Ablation Depth and Repair Time on the Corneal Elastic Modulus after Laser In Situ Keratomileusis. Biomed. Eng. Online 16, 20. doi:10.1186/s12938-017-0311-5
Wu, Y., Tian, L., and Huang, Y. F. (2016). In Vivo Corneal Biomechanical Properties with Corneal Visualization Scheimpflug Technology in Chinese Population. Biomed. Res. Int. 2016, 7840284. doi:10.1155/2016/7840284
Yang, J., Zeng, Y., and Li, Z. (1999). Biomechanical Properties of Human Cornea. Acta Biophys. sinica.
Yildirim, Y., Olcucu, O., Basci, A., Agca, A., Ozgurhan, E.B., Alagoz, C., et al. (2016). Comparison of Changes in Corneal Biomechanical Properties after Photorefractive Keratectomy and Small Incision Lenticule Extraction. Turk J. Ophthalmol. 46, 47–51.
Zhang, H.X., Khan, M.A., Zhang, D., Qin, X., Lin, D., and Li, L. (2018a). Corneal Biomechanical Properties after FS-LASIK with Residual Bed Thickness Less Than 50% of the Original Corneal Thickness. J. Ophthalmol. 2018, 2752945. doi:10.1155/2018/2752945
Zhang, H.X., Qian, X.Q., Li, L., and Liu, Z.C. (2017). Understanding the Viscoelastic Properties of Rabbit Cornea Based on Stress Relaxation Tests and Cyclic Uniaxial Tests. J. Mech. Med. Biol. 17. doi:10.1142/s0219519417400358
Zhang, H.X., Zhang, D., Qin, X., Wang, H., and Li, L. (2018b). Study of the Transversal Deformation of Corneal Strip under Uniaxial Loading. J. Mech. Med. Biol. 18. doi:10.1142/s0219519418400183
Zhang, Y. L., Shao, T. T., and Shi, M. G. (2006). A Study on the Space Form of the Schematic Cornea of the normal Adult Eye-ball. Zhonghua Yan Ke Za Zhi 42, 992–997.
Keywords: ocular response analyzer (ORA), finite element simulation, parametric analysis, corneal biomechanical parameters, ORA output parameters
Citation: Qin X, Tian L, Zhang H, Zhang D, Jie Y, Zhang H-X and Li L (2022) Determine Corneal Biomechanical Parameters by Finite Element Simulation and Parametric Analysis Based on ORA Measurements. Front. Bioeng. Biotechnol. 10:862947. doi: 10.3389/fbioe.2022.862947
Received: 26 January 2022; Accepted: 23 March 2022;
Published: 13 April 2022.
Edited by:
Weiyi Chen, Taiyuan University of Technology, ChinaReviewed by:
Fulvio Ratto, National Research Council (CNR), ItalyJunjie Wang, Wenzhou Medical University, China
Copyright © 2022 Qin, Tian, Zhang, Zhang, Jie, Zhang and Li. This is an open-access article distributed under the terms of the Creative Commons Attribution License (CC BY). The use, distribution or reproduction in other forums is permitted, provided the original author(s) and the copyright owner(s) are credited and that the original publication in this journal is cited, in accordance with accepted academic practice. No use, distribution or reproduction is permitted which does not comply with these terms.
*Correspondence: Ying Jie, amllX3lpbmdjbkBhbGl5dW4uY29t; Hai-Xia Zhang, emhhbmdoeEBjY211LmVkdS5jbg==; Lin Li, bGlsQGNjbXUuZWR1LmNu
†These authors have contributed equally to this work and share first authorship
 Xiao Qin1,2†
 Lei Tian
 Ying Jie
 Hai-Xia Zhang
 Lin Li