 Alberto Saccardo
 Fabrizio Bezzo
 Eleonora Sforza
- 1CAPE-Lab (Computer-Aided Process Engineering Laboratory), Department of Industrial Engineering, University of Padova, Padova, Italy
- 2Department of Industrial Engineering, University of Padova, Padova, Italy
To disclose the net effect of light on microalgal growth in photobioreactors, self-shading and mixing-induced light–dark cycles must be minimized and discerned from the transient phenomena of acclimation. In this work, we performed experiments of continuous microalgal cultivation in small-scale photobioreactors with different thicknesses (from 2 to 35 mm): working at a steady state allowed us to describe the effect of light after acclimation, while the geometry of the reactor was adjusted to find the threshold light path that can discriminate different phenomena. Experiments showed an increased inhibition under smaller culture light paths, suggesting a strong shading effect at thicknesses higher than 8 mm where mixing-induced light–dark cycles may occur. A Haldane-like model was applied and kinetic parameters retrieved, showing possible issues in the scalability of experimental results at different light paths if mixing-induced light–dark cycles are not considered. To further highlight the influence of mixing cycles, we proposed an analogy between small-scale operations with continuous light and PBR operations with pulsed light, with the computation of characteristic parameters from pulsed-light microalgae growth mathematical modeling.
1 Introduction
Among all the factors that affect microalgae productivity and growth, light covers a major role since it provides all the energy required for metabolism. The effect of light on microalgal photosynthesis has been the subject of a number of studies in the past that identify three different light-dependent regions for microalgal growth: photolimitation, photosaturation, and photoinhibition.
The experimental observation of these three regions in photobioreactors is influenced by two adverse phenomena that hinder the true photosynthetic response to light: self-shading and mixing-induced light–dark cycles (Barbosa et al., 2003; Graham et al., 2015). Self-shading is light attenuation by microalgae cell absorption that reduces light availability in the inner parts of the photobioreactors (Flynn, 2021). Moreover, microalgae are exposed to light–dark cycles because of the light gradient induced by the self-shading and the turbulent mixing in the reactor; due to these conditions, cells receive light intermittently (Barbosa et al., 2003; Zarmi et al., 2013). A strategy to minimize these adverse phenomena is to decrease the culture light path (Castaldello et al., 2019).
Decreasing the scale of photobioreactors (to microphotobioreactors) can lead to multiple advantages, such as faster experiments in large numbers of replicas with the possibility to precisely control growth conditions (Perin et al., 2016; Kim et al., 2018). Microphotobioreactors can reach scale volumes down to the pico-liter (Kim et al., 2018) and have been used to cultivate microalgae in droplet-based flow systems (Saad et al., 2019a; 2019b), single-cell layer microfluidic chips (Luke et al., 2016; Westerwalbesloh et al., 2019), or fed-batch microwell systems (Perin et al., 2016; Castaldello et al., 2019). Recently, microphotobioreactors have been especially used to investigate light effects on microalgal growth, that is, applications include microalgal growth under irradiance and nitrate stress conditions (Saad et al., 2019a; 2019b) and the evaluation of light effects on microalgae culture under non-limiting CO2 conditions (Castaldello et al., 2019). A limitation of the aforementioned works is that due to the micro-scale, continuous operations are not possible. This could be achieved by operating on a small scale (instead of a micro-scale) that represents an intermediate between microphotobioreactors and traditional “high-scale” systems. Several attempts have been made in previous literature, such as using a flat plate photobioreactor of 2 cm thickness by Busnel et al. (2021) or Pfaffinger et al. (2019). Other studies researched steady-state reactors of 1.2–1.5 cm deep (Sforza et al., 2014, 2015a, 2015b, 2018; Barbera et al., 2017), finding remarkably high concentrations, confirming that self-shading is limited. However, it is not clear if a light path of 1.5–2 cm is actually able to avoid the self-shading effect.
The objective of this work was to capture the net effect of light on microalgal growth in photobioreactors by minimizing phenomena of self-shading and mixing-induced light–dark cycles in acclimated cultures. For this purpose, we designed small-scale continuous closed photobioreactors with different reactor thicknesses of 2, 5, and 8 mm, where Tetradesmus obliquus was cultivated at a steady state. The employment of such a small scale (2–8 mm thickness of the light path) in a continuous mode represents a novelty of this work; to our knowledge, few attempts of microalgae cultivations in closed photobioreactors with these light paths are reported in the literature and none in the continuous mode. Thin-layer cascade (TLC) photobioreactors can exhibit light paths of a few millimeters, with the possibility of semi-continuous or continuous operation (Grivalský et al., 2019). However, TLCs are generally operated via flow recirculation usually comprising a retention chamber (Grivalský et al., 2019). This operation mode determines that microalgae are not continuously exposed to light and make TLCs significantly different from continuous ultrathin flat-plate photobioreactors.
We compared our experimental data at 2–8 mm with those at 15 and 35 mm for the same species and similar cultivation systems (Sforza et al., 2015b; Barbera et al., 2017; Borella et al., 2021) to highlight the effect of self-shading and mixing-induced light cycles. A modeling approach was then used on all the experimental data to better assess the impact of self-shading with reference to the available light path.
2 Materials and methods
2.1 Microalga and cultivation systems
Tetradesmus obliquus 276–7 was cultivated in a sterile BG11 medium (Stanier et al., 1979) (modified to have a double concentration of all the nutrients in order to avoid limitation and ensure that light was the only limiting factor), buffered with 10 mM HEPES pH 8 to keep pH of the culture between 7 and 8 and minimize the acidification provided by CO2. The exact composition of the growth medium is reported in Supplementary Material. We provided CO2 in excess in a 5% volumetric air flowrate from the bottom of the reactors. The reactors were kept in a refrigerated incubator at a constant temperature of 24 °C. An LED lamp (Light Source SL3500, Photon System Instruments, Czech Republic) was used to supply light, with tunable intensities measured by an HD of 2102.1 photoradiometer (Delta OHM, Italy).
All the photobioreactors were operated in the same CSTR (continuous stirred tank reactor) mode and have the same inlet–outlet structure, with an inlet liquid stream for nutrients, an inlet gaseous stream of CO2 in a 5% volumetric air flowrate, and a liquid outlet stream to maintain the same liquid level over time. However, the shape of the reactors can be different for building purposes. The reactors of 2 mm thickness and 1.5 ml volume were made of PDMS and have a V shape, with a bottom inlet for air, a lateral inlet for nutrients, and an overflow liquid exit. Mixing was ensured by bubbling. The reactors of 5 and 8 mm and 10 ml volumes were made of polycarbonate with a bottom U shape. Stainless steel needles were used for the gaseous and liquid inlets and sampling outlets. The liquid overflow outlet was connected to a peristaltic pump for better level control. Mixing was obtained through bubbling and with the aid of a small magnetic stirrer. For all reactors, a liquid inlet for the continuous supply of a fresh medium was ensured by a two-way PHD ULTRA syringe pump (Harvard apparatus, United States). Pictures of the reactors are shown in Supplementary Material. Cultivation systems in Barbera et al. (2017) (15 mm, 700 ml), Borella et al. (2021) (35 mm, 200 ml), and Sforza et al. (2015b) (15 mm, 250 ml) are similar to the aforementioned ones, with the exception that 1.5 and 3.5 cm light path reactors have a flat bottom rectangular shape.
2.2 Experiments and analytical procedures
With reactors from 2 to 8 mm, we performed experiments with different conditions of light and residence time as inputs and measured cell concentration as the output. The cell concentration was monitored daily through manual cell counting using a Bürker counting Chamber (Optik Labor, Germany). Data were recorded for at least 3 days since the culture reached a steady state. Since the small scale of the reactors did not allow performing reliable dry weight measurements, we converted measurements of cell concentration (cell/volume) into ponderal concentrations (mass of biomass/volume) by using a linear correlation with experimental cellular weight.
2.3 Mathematical model
To interpret our experimental data, we used a model by Bernard and Rémond (2012) presented in Barbera et al. (2020). Assuming a rectangular geometry, the light extinction profile is predicted by the Lambert–Beer law as:
where
Since nutrients and CO2 are provided in excess, the biomass growth rate
In Eq. 2,
where
where
where
Inputs of the model of Eqs. 1–5 are
With the model in Eqs. 1–5, we fitted experimental data presented in the following section. For parametric regression, we used a maximum likelihood algorithm on the software gPROMS (by Siemens Process Systems Engineering).
3 Results
3.1 Experimental results
Biomass concentration was measured at a steady state in reactors with different light paths and as a function of light intensity and residence time, depending on the volume of the photobioreactor and the technological limits of the pumps used; experimental results are reported in Figure 1. Continuous small-scale photobioreactors opened new possibilities for the investigation of light-driven effects but require particular attention when operated. Due to the small volume, microalgae cultivation is highly sensitive to perturbations of the system that can eventually lead to the failure of the experiment. According to our experience, failures can occur either because of washout or because of the formation of irreversible biofouling. The arrangement of the reactor is critical: segregated zones should be avoided; materials must be biocompatible, with optimal optical properties and not sticky to minimize biofouling; and the mixing system (e.g., the magnetic stirrer or intensive bubbling) must not damage cells. Furthermore, monitoring operations must be performed carefully, and the sampling volumes should be carefully chosen in order to avoid introducing harmful perturbances (e.g., during the residence time) and exposing the culture to contaminations. What is mentioned earlier becomes more and more critical as the light path and volume of the reactor decrease. For instance, we were unable to reach steady-state conditions for light paths below 2 mm and reactor volumes below 1.5 ml.
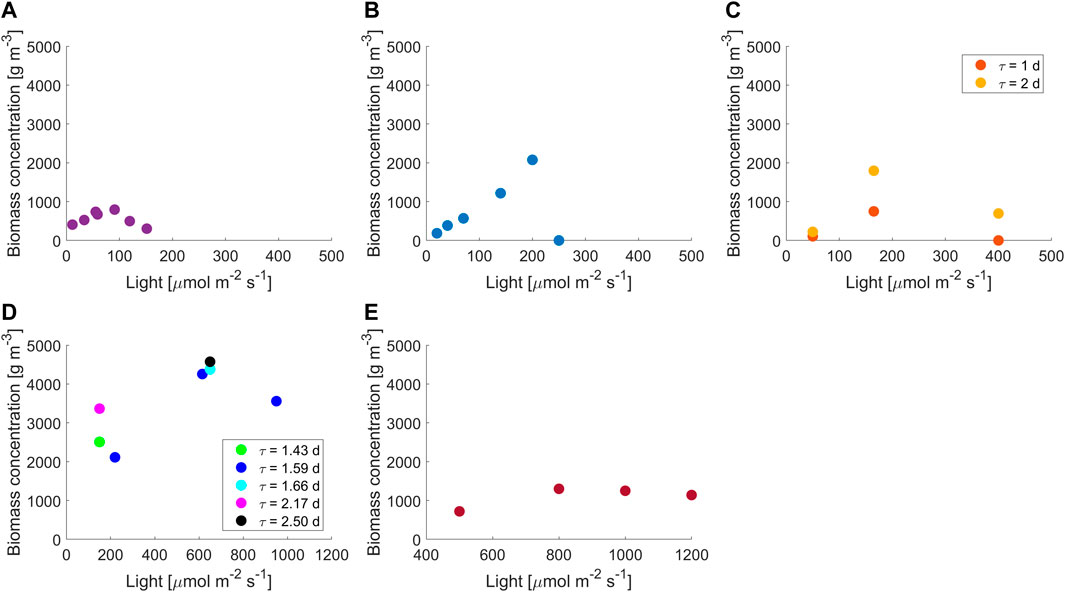
FIGURE 1. Experimental results at different light intensities and residence times for reactor thicknesses of (A) 2 mm, 1.5 days; (B) 5 mm, 1 day; (C) 8 mm, 1–2 days; (D) 15 mm, 1.43–2.5 days (E) 35 mm, 1.05 days. Data at 15 mm are from Barbera et al. (2017) and Sforza et al. (2015b); data at 35 mm are from Borella et al. (2021).
The stability of the small-scale reactor (2 mm) was tested by measuring the establishment of a steady state in two separate reactors working under the same operating conditions and with different preinocula. The steady-state concentration obtained was equal for the two reactors, and it was found to be stable over time (Supplementary Figure S4). With volume and thickness smaller than those used in this case, it was not possible to reach a steady state due to the reasons explained before. To the author’s knowledge, this is the first example of a continuously working photobioreactor for microalgal cultivation on such a small scale.
Accordingly, in these configurations, where a very small light path is present, it should be possible to discriminate the effect of light without the self-shading effect and mixing-induced light/dark cycle. From common knowledge, in reactors with high light paths, photoinhibition is visible from a certain critical value of light intensity. However, Figure 1 shows that photoinhibition occurs at lower values of light intensities as we move to shorter light paths. Moreover, the trend of the concentration vs. light curve changed with the light path; data at low light paths (from 2 to 8 mm) showed a steeper decrease in the biomass concentration for inhibition than those at high reactor depths (15 and 35 mm), suggesting that inhibition is heavily augmented in PBRs with short light path. For convenience, in Figure 1, 2–8 mm data are plotted on a 0–500 µmol m−2 s−1 x-axis while 15–35 mm on 0–1200 µmol m−2 s−1.
The decrease in reactor thickness from 35 to 15 mm turned into higher biomass concentrations at photosaturation. This behavior is well-confirmed by the literature (Richmond, 1996; Qiang et al., 1998; Zou and Richmond, 2000; Lee 2001; Richmond et al., 2003); at higher scales, a decrease in the light path corresponds to higher cell concentrations until a lower limit of 1–1.3 cm thickness. We found that this value represents a turning point since a further decrease in ultra-thin light paths (2–8 mm) showed a decrease in biomass concentration, confirming again a higher influence of inhibition than that expected at these scales. This is also reported by Zou and Richmond (2000), where higher inhibition was found in a thickness of 1 cm than in 3 cm. In the literature, there are no reports on biomass growth in continuous systems with light paths lower than 1–1.3 cm. For a batch cultivation system, Qiang et al. (1998) found an increase in biomass productivity from 200 to 7.5 mm; however, we experimentally verified that the behavior of batch and continuous systems at ultra-thin light paths is considerably different. Experimental results and previous considerations show that an indefinite decrease in the reactor thickness cannot lead to an increase in cultivating performances in continuous systems and suggest the existence of an optimal light path value (as conceptualized in other studies (Richmond et al., 2003; Zarmi et al., 2020).
3.2 Parameter estimation results and modeling
To better describe the data obtained, a model was used to ascertain if the common growth modeling approach can be used at different light paths. As the model used was not able to reproduce, with a unique set of parameters, all the data at different thicknesses, the model parameters were retrieved separately for sets of data obtained with the same light paths. The values of
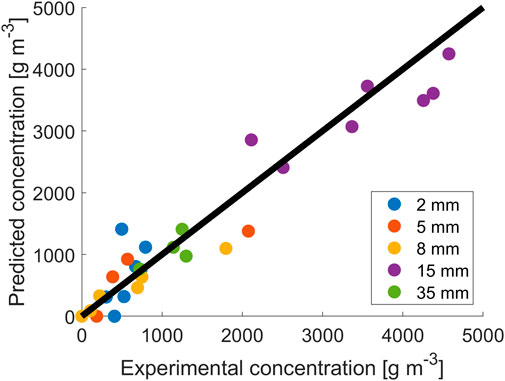
FIGURE 2. Fitting results for data at different reactor thicknesses.
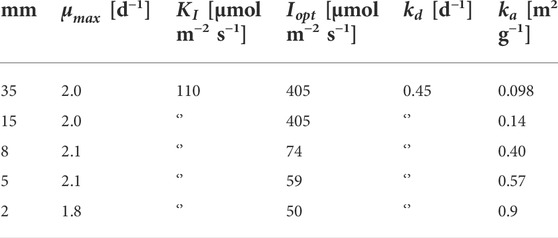
TABLE 1. Fitted parameters for data at all reactor thicknesses.
Interestingly, the values of
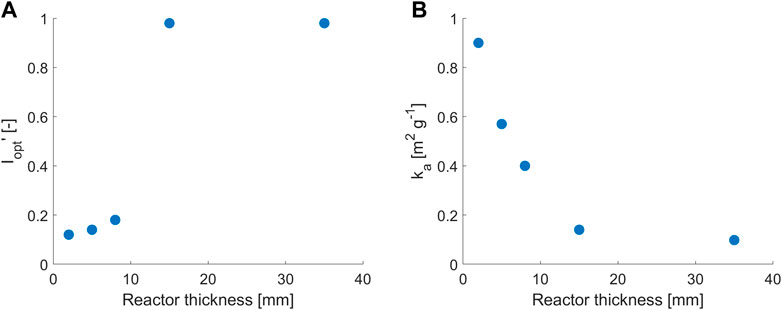
FIGURE 3. Trends of the non-dimensional value of (A)
This behavior in ultra-thin PBRs is close to what is encountered in the outer layers of mass microalgal culture; cells in the outer layers are exposed to the highest irradiating conditions and subtract a considerable amount of light to the other layers (Kumar et al., 2021). In order to reduce this phenomenon, an extensive research effort has been performed to develop microalgae mutants with reduced light-harvesting apparatuses (Kumar et al., 2021). This also suggests that the standard Lambert–Beer law may not be able to represent the behavior at different light paths within a Haldane-like light model when the behavior of very thin photobioreactors needs to be described and that it may be inappropriate to scale down experimental results below some light path threshold.
4 Discussion
To understand the aforementioned limitations, we recall the two main adverse phenomena that hinder the net effect of light on microalgal growth: self-shading and mixing-induced light–dark cycles. In the model, self-shading is approached through light attenuation in the Lambert–Beer law (Eq. 1), while the effect of light–dark cycles is not considered. To obtain a measure of this phenomenon, Richmond et al. (2003) introduced the concept of cell travel time, that is, the average time required for cells to move back and forth in the reactor thickness, where they are exposed to different light conditions along the light attenuation profile. Richmond et al. (2003) defined some characteristic cell travel times, based either on random, diffusion-like motions or on back and forth movement through the optical path. The latter, which is called regular motion time, is more relevant in the context of this work and is defined as follows:
where
Cell travel time does not affect photosynthesis if it is one or two orders of magnitude higher than a characteristic PSU turnover time (about 10 ms for Richmond et al., 2003). Usually, this is not an issue. However, for very thin reactors, cell travel time starts to approach photosynthetic unit (PSU) turnover time, influencing light–cell interaction. Table 2 shows the cell travel times for the different reactor thicknesses used in our work. From 2 to 8 mm, travel times are very close to the PSU turnover time and are significantly smaller than travel times at 15 and 35 mm. This highlights that the behavior at 2–8 mm is different from that in 15–35 mm, and in the smaller scales, mixing-induced light–dark cycles could have a significant impact.

TABLE 2. Cell travel times for all reactor thicknesses.
In an ideal situation for efficient light exploitation, cells should be exposed to high light conditions in the photic zone for a duration required for light reactions to occur and then move to the dark zone, being replaced by other cells from the dark zone ready to receive incoming photons (Richmond et al., 2003). However, if the time spent by cells in the dark zone is too low, dark reactions do not have enough time to occur and photosynthetic efficiency decreases (Zarmi et al., 2020). As introduced before, cells in ultra-thin reactors are exposed to strong illumination but, due to the flatter light profile and the absence of a proper dark zone, they do not fully recover from this strong light absorption, causing the photosynthetic efficiency to decrease. This is not the case in thick reactors, where cells are able to migrate to a dark zone and recover; this explains why photoinhibition in these systems is observed only under very high light conditions (or never, in some cases). Previous considerations suggest that not only light conditions cells are exposed to but also the duration of exposure of light along the attenuation light profile is necessary for the comprehension of cell–light interaction phenomena. To provide a systematic description, we can use the theory of the mathematical modeling of pulsed-light effects on microalgae: when cells move between zones with different irradiation, they are exposed to an effective illumination regime close to a pulsed light one (Zarmi et al., 2020). As in the study by Schulze et al. (2017), pulsed-light models have different inputs: intensity of the pulse, time of the light phase (
Light phase time for cell regular motion is calculated as
Corresponding dark phase time is calculated as
where
With light and dark phase times, the duty cycle
In our case,
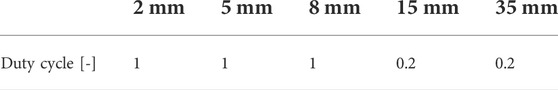
TABLE 3. Duty cycle (non-dimensional) for all reactor thicknesses, computed for
Previous considerations also show a touchpoint between thin-milli reactors and pulsed-light experiments toward the understanding and modeling of the effect of light on cell growth and confirm the importance of considering light–dark mixing cycles to ensure the scalability of laboratory results to higher-scale systems. Indeed, Eqs. 7–10 may represent a starting point to integrate the effect of mixing cycles in traditional light modeling in microalgal growth.
5 Conclusion
In high-scale microalgal cultivation systems, self-shading and mixing-induced light–dark cycles heavily hinder the true effect of light interaction with cells. To minimize these phenomena, we designed, built, and operated ultra-thin continuous photobioreactors. Experiments showed that at very low light paths (2–8 mm), high inhibition occurred at low irradiance values. We used experimental data from different reactor thicknesses to retrieve parameters of a Haldane-like model, and the trend of the fitted Lambert–Beer constant shows that there could be issues in the capability of the model to scale up experimental results at ultra-thin light paths. We infer that this is due to the averaged nature of the model that does not consider the effect of mixing-induced light–dark cycles. Indeed, the computation of parameters from the theory of mathematical modeling of pulsed-light effects on microalgae suggested that only in ultra-thin light paths (2–8 mm), the “real” continuous light regimen occurs, while in thicker light paths (15–35 mm) cells are subjected to an effective pulsed light one due to mixing-induced light–dark cycles.
Data availability statement
The raw data supporting the conclusion of this article will be made available by the authors, upon request. Requests to access these datasets should be directed to Eleonora Sforza, eleonora.sforza@unipd.it.
Author contributions
AS: formal analysis, experimental investigation, data curation, modeling, and writing—original draft. FB: conceptualization, methodology, supervision, and writing—review and editing. ES: conceptualization, formal analysis, methodology, supervision, and writing—review and editing.
Acknowledgments
Authors gratefully acknowledge Ms. Anna Fagnol, Ms. Virginia Jannuzzi, and Dr. Christopher Castaldello for their support in the preliminary experimental activity.
Conflict of interest
The authors declare that the research was conducted in the absence of any commercial or financial relationships that could be construed as a potential conflict of interest.
Publisher’s note
All claims expressed in this article are solely those of the authors and do not necessarily represent those of their affiliated organizations, or those of the publisher, the editors, and the reviewers. Any product that may be evaluated in this article, or claim that may be made by its manufacturer, is not guaranteed or endorsed by the publisher.
Supplementary material
The Supplementary Material for this article can be found online at: https://www.frontiersin.org/articles/10.3389/fbioe.2022.977429/full#supplementary-material
References
Barbera, E., Sforza, E., Guidobaldi, A., Di Carlo, A., and Bertucco, A. (2017). Integration of dye-sensitized solar cells (DSC) on photobioreactors for improved photoconversion efficiency in microalgal cultivation. Renew. Energy 109, 13–21. doi:10.1016/j.renene.2017.03.013
Barbera, E., Sforza, E., Grandi, A., and Bertucco, A. (2020). Uncoupling solid and hydraulic retention time in photobioreactors for microalgae mass production: A model-based analysis. Chem. Eng. Sci. 218, 115578. doi:10.1016/j.ces.2020.115578
Barbosa, M. J., Janssen, M., Ham, N., Tramper, J., and Wijffels, R. H. (2003). Microalgae cultivation in air-lift reactors: Modeling biomass yield and growth rate as a function of mixing frequency. Biotechnol. Bioeng. 82, 170–179. doi:10.1002/bit.10563
Bernard, O., and Rémond, B. (2012). Validation of a simple model accounting for light and temperature effect on microalgal growth. Bioresour. Technol. 123, 520–527. doi:10.1016/j.biortech.2012.07.022
Borella, L., Sforza, E., and Bertucco, A. (2021). Effect of residence time in continuous photobioreactor on mass and energy balance of microalgal protein production. N. Biotechnol. 64, 46–53. doi:10.1016/j.nbt.2021.05.006
Busnel, A., Samhat, K., Gérard, E., Kazbar, A., Marec, H., Dechandol, E., et al. (2021). Development and validation of a screening system for characterizing and modeling biomass production from cyanobacteria and microalgae: Application to Arthrospira platensis and Haematococcus pluvialis. Algal Res. 58, 102386. doi:10.1016/j.algal.2021.102386
Castaldello, C., Sforza, E., Cimetta, E., Morosinotto, T., and Bezzo, F. (2019). Microfluidic platform for microalgae cultivation under non-limiting CO2 conditions. Ind. Eng. Chem. Res. 58, 18036–18045. doi:10.1021/acs.iecr.9b02888
Flynn, K. J. (2021). Enhancing Microalgal Production - constructing decision support tools using system dynamics modelling. Zenodo. doi:10.5281/zenodo.5036605
Graham, P. J., Riordon, J., and Sinton, D. (2015). Microalgae on display: A microfluidic pixel-based irradiance assay for photosynthetic growth. Lab. Chip 15, 3116–3124. doi:10.1039/c5lc00527b
Grivalský, T., Ranglová, K., da Câmara Manoel, J. A., Lakatos, G. E., Lhotský, R., Masojídek, J., et al. (2019). Development of thin-layer cascades for microalgae cultivation: Milestones (review). Folia Microbiol. (Praha) 64, 603–614. doi:10.1007/s12223-019-00739-7
Kim, H. S., Devarenne, T. P., and Han, A. (2018). Microfluidic systems for microalgal biotechnology: A review. Algal Res. 30, 149–161. doi:10.1016/j.algal.2017.11.020
Kumar, V., Sharma, N., Jaiswal, K. K., Vlaskin, M. S., Nanda, M., Tripathi, M. K., et al. (2021). Microalgae with a truncated light-harvesting antenna to maximize photosynthetic efficiency and biomass productivity: Recent advances and current challenges. Process Biochem. 104, 83–91. doi:10.1016/j.procbio.2021.03.006
Lee, Y. K. (2001). Microalgal mass culture systems and methods: Their limitation and potential. J. Appl. Phycol. 13, 307–315. doi:10.1023/A:1017560006941
Luke, C. S., Selimkhanov, J., Baumgart, L., Cohen, S. E., Golden, S. S., Cookson, N. A., et al. (2016). A microfluidic platform for long-term monitoring of algae in a dynamic environment. ACS Synth. Biol. 5, 8–14. doi:10.1021/acssynbio.5b00094
Perin, G., Cimetta, E., Monetti, F., Morosinotto, T., and Bezzo, F. (2016). Novel micro-photobioreactor design and monitoring method for assessing microalgae response to light intensity. Algal Res. 19, 69–76. doi:10.1016/j.algal.2016.07.015
Pfaffinger, C. E., Severin, T. S., Apel, A. C., Göbel, J., Sauter, J., Weuster-Botz, D., et al. (2019). Light-dependent growth kinetics enable scale-up of well-mixed phototrophic bioprocesses in different types of photobioreactors. J. Biotechnol. 297, 41–48. doi:10.1016/j.jbiotec.2019.03.003
Qiang, H., Richmond, A., and Zarmi, Y. (1998). Combined effects of light intensity, light-path and culture density on output rate of spirulina platensis (cyanobacteria). Eur. J. Phycol. 33, 165–171. doi:10.1080/09670269810001736663
Richmond, A., Cheng-Wu, Z., and Zarmi, Y. (2003). Efficient use of strong light for high photosynthetic productivity: Interrelationships between the optical path, the optimal population density and cell-growth inhibition. Biomol. Eng. 20, 229–236. doi:10.1016/S1389-0344(03)00060-1
Richmond, A. (1996). Efficient utilization of high irradiance for production of photoautotropic cell mass: A survey. J. Appl. Phycol. 8, 381–387. doi:10.1007/BF02178581
Saad, M. G., Dosoky, N. S., Khan, M. S., Zoromba, M. S., Mekki, L., El-Bana, M., et al. (2019a). High-throughput screening of Chlorella Vulgaris growth kinetics inside a droplet-based microfluidic device under irradiance and nitrate stress conditions. Biomolecules 9, 276. doi:10.3390/biom9070276
Saad, M. G., Selahi, A., Zoromba, M. S., Mekki, L., El-Bana, M., Dosoky, N. S., et al. (2019b). A droplet-based gradient microfluidic to monitor and evaluate the growth of Chlorella vulgaris under different levels of nitrogen and temperatures. Algal Res. 44, 101657. doi:10.1016/j.algal.2019.101657
Schulze, P. S. C., Guerra, R., Pereira, H., Schüler, L. M., and Varela, J. C. S. (2017). Flashing LEDs for microalgal production. Trends Biotechnol. 35, 1088–1101. doi:10.1016/j.tibtech.2017.07.011
Sforza, E., Barbera, E., and Bertucco, A. (2015a). Improving the photoconversion efficiency: An integrated photovoltaic-photobioreactor system for microalgal cultivation. Algal Res. 10, 202–209. doi:10.1016/j.algal.2015.05.005
Sforza, E., Calvaruso, C., La Rocca, N., and Bertucco, A. (2018). Luxury uptake of phosphorus in Nannochloropsis salina: Effect of P concentration and light on P uptake in batch and continuous cultures. Biochem. Eng. J. 134, 69–79. doi:10.1016/j.bej.2018.03.008
Sforza, E., Enzo, M., and Bertucco, A. (2014). Design of microalgal biomass production in a continuous photobioreactor: An integrated experimental and modeling approach. Chem. Eng. Res. Des. 92, 1153–1162. doi:10.1016/j.cherd.2013.08.017
Sforza, E., Urbani, S., and Bertucco, A. (2015b). Evaluation of maintenance energy requirements in the cultivation of Scenedesmus obliquus: Effect of light intensity and regime. J. Appl. Phycol. 27, 1453–1462. doi:10.1007/s10811-014-0460-x
Stanier, R. Y., Deruelles, J., Rippka, R., Herdman, M., and Waterbury, J. B. (1979). Generic assignments, strain histories and properties of pure cultures of cyanobacteria. Microbiology 111, 1–61. doi:10.1099/00221287-111-1-1
Westerwalbesloh, C., Brehl, C., Weber, S., Probst, C., Widzgowski, J., Grünberger, A., et al. (2019). A microfluidic photobioreactor for simultaneous observation and cultivation of single microalgal cells or cell aggregates. PLoS One 14, e0216093. doi:10.1371/journal.pone.0216093
Zarmi, Y., Bel, G., and Aflalo, C. (2013). “Theoretical analysis of culture growth in flat-plate bioreactors: The essential role of timescales,” in Handb. Microalgal cult. Appl. Phycol. Biotechnol. Second Ed. (New Jersey, United States: Wiley-Blackwell), 205–224. doi:10.1002/9781118567166.ch12
Zarmi, Y., Gordon, J. M., Mahulkar, A., Khopkar, A. R., Patil, S. D., Banerjee, A., et al. (2020). Enhanced algal photosynthetic photon efficiency by pulsed light. iScience 23, 101115. doi:10.1016/j.isci.2020.101115
Zou, N., and Richmond, A. (2000). Light-path length and population density in photoacclimation of Nannochloropsis sp. (Eustigmatophyceae). J. Appl. Phycol. 12, 349–354. doi:10.1023/a:1008151004317
Nomenclature
Greek letters
Abbreviations
CSTR Continuous stirred tank reactor
PBR Photobioreactor
PSU Photosynthetic unit
TLC Thin-layer cascade
Keywords: Scenedesmus obliquus, Tetradesmus obliquus, mixing cycles, light path, growth modeling, continuous photobioreactor
Citation: Saccardo A, Bezzo F and Sforza E (2022) Microalgae growth in ultra-thin steady-state continuous photobioreactors: assessing self-shading effects. Front. Bioeng. Biotechnol. 10:977429. doi: 10.3389/fbioe.2022.977429
Received: 24 June 2022; Accepted: 08 July 2022;
Published: 11 August 2022.
Edited by:
Ashutosh Pandey, AKS University, IndiaReviewed by:
Saswat Kumar Pradhan, Birla Institute of Technology and Science, IndiaAshwini Waoo, AKS University, India
Copyright © 2022 Saccardo, Bezzo and Sforza. This is an open-access article distributed under the terms of the Creative Commons Attribution License (CC BY). The use, distribution or reproduction in other forums is permitted, provided the original author(s) and the copyright owner(s) are credited and that the original publication in this journal is cited, in accordance with accepted academic practice. No use, distribution or reproduction is permitted which does not comply with these terms.
*Correspondence: Eleonora Sforza, ZWxlb25vcmEuc2ZvcnphQHVuaXBkLml0