 Grégoire B. L. Henry1*
 Florent Awedem Wobiwo1Arnaud Isenborghs1Thomas Nicolay1Bruno Godin2
 Benoit A. Stenuit1Patrick A. Gerin1*
- 1Laboratory of Bioengineering and Biorefining, Earth and Life Institute—Applied Microbiology, Université Catholique de Louvain, Louvain-La-Neuve, Belgium
- 2Walloon Agricultural Research Center (CRA-W), Valorization of Agricultural Products Department, Gembloux, Belgium
Brewer’s spent grain (BSG) is an undervalorized organic feedstock residue composed of fermentable macromolecules, such as proteins, starch, and residual soluble carbohydrates. It also contains at least 50% (as dry weight) of lignocellulose. Methane-arrested anaerobic digestion is one of the promising microbial technologies to valorize such complex organic feedstock into value-added metabolic intermediates, such as ethanol, H2, and short-chain carboxylates (SCC). Under specific fermentation conditions, these intermediates can be microbially transformed into medium-chain carboxylates through a chain elongation pathway. Medium-chain carboxylates are of great interest as they can be used as bio-based pesticides, food additives, or components of drug formulations. They can also be easily upgraded by classical organic chemistry into bio-based fuels and chemicals. This study investigates the production potential of medium-chain carboxylates driven by a mixed microbial culture in the presence of BSG as an organic substrate. Because the conversion of complex organic feedstock to medium-chain carboxylates is limited by the electron donor content, we assessed the supplementation of H2 in the headspace to improve the chain elongation yield and increase the production of medium-chain carboxylates. The supply of CO2 as a carbon source was tested as well. The additions of H2 alone, CO2 alone, and both H2 and CO2 were compared. The exogenous supply of H2 alone allowed CO2 produced during acidogenesis to be consumed and nearly doubled the medium-chain carboxylate production yield. The exogenous supply of CO2 alone inhibited the whole fermentation. The supplementation of both H2 and CO2 allowed a second elongation phase when the organic feedstock was exhausted, which increased the medium-chain carboxylate production by 285% compared to the N2 reference condition. Carbon- and electron-equivalent balances, and the stoichiometric ratio of 3 observed for the consumed H2/CO2, suggest an H2- and CO2-driven second elongation phase, converting SCC to medium-chain carboxylates without an organic electron donor. The thermodynamic assessment confirmed the feasibility of such elongation.
1 Introduction
The current environmental crisis, triggered by the overuse of non-renewable resources and overexploitation of natural ecosystems by an ever-growing population, gave a compelling impetus for the development of bio-based circular economy. Shaping a sustainable society requires an economically viable bio-based chemical industry. Nowadays, scientists and engineers are developing various biorefinery processes to valorize biomass into biofuels and chemicals in order to decrease our dependence on fossil carbon resources (Yaoyang and Boeing, 2013; Obileke et al., 2022). Among all the biomass available, the low-cost organic residues that do not compete with food production, such as wood residues, agricultural and agro-industrial wastes, municipal solid wastes, food wastes, or sewage sludges, have been highlighted as relevant feedstocks to produce a variety of platform molecules. Different conversion processes can be followed depending on the physicochemical properties of the biomass (e.g., chemical composition, moisture content, and heterogeneity) and the final targeted products (Holtzapple et al., 2021). Holtzapple and Granda (2009) compared thermochemical, sugar, and carboxylate biorefinery platforms to valorize lignocellulosic biomass containing polysaccharides (68.3%) and lignin (31.7%). The in silico highest product yield in liquid biofuels was obtained for the carboxylate platform. Once carboxylates are microbially obtained from organic feedstocks, they can easily be converted by conventional chemistry into fuels and chemicals (Holtzapple and Granda, 2009; Agler et al., 2011; Albuquerque et al., 2011; Lee et al., 2014; Stamatopoulou et al., 2020; Holtzapple et al., 2021).
The carboxylate platform aims at transforming biomass to carboxylates, thanks to microbial communities. This process is also identified as methane-arrested anaerobic digestion operating like the anaerobic digestion pathway except that the last step of methanogenesis must be completely inhibited to keep a mixture of short-chain carboxylates (SCC), short-chain alcohols (SCA), lactate, and H2 as final products (Holtzapple et al., 2021). These molecules have better economic value than methane (Perimenis et al., 2018). In recent years, there has been increasing interest in the transformation of these intermediate compounds into medium-chain carboxylates (MCC) by chain elongation metabolism (CE). MCC are structurally composed of an aliphatic carbon chain of 6–10 carbon atoms, with a carboxylic acid group on a terminal carbon. Due to their longer aliphatic carbon chain, MCC are less water soluble than SCC. Thus, they are easier to recover from the aqueous fermentation broth (Spirito et al., 2014).
The identified CE pathway corresponds to the reverse β-oxidation (RBO) mechanism, that is, the addition to an existing carboxylate of a two-carbon acetyl-CoA derived from ethanol or lactate. The investigation of the RBO pathway with pure cultures and simple substrates allowed for identifying two main conditions required to promote microbial-driven chain elongation: a) the presence of an energy-rich electron donor, such as ethanol (EtOH, six electron-equivalents/moleC), lactate (four electron-equivalents/moleC), or H2 (two electron-equivalents/moleH2) as a precursor of acetyl-CoA and b) the maintenance of a reducing environment (Agler et al., 2011; Zhang et al., 2013; Spirito et al., 2014; Angenent et al., 2016; Bengelsdorf et al., 2018; Holtzapple et al., 2021). Usually, laboratory-scale studies opted for the supplementation of pure substrates, such as ethanol, lactate, or glucose, to increase MCC production (Grootscholten et al., 2014; Roghair et al., 2018). Indeed, the use of complex biomass as organic substrates, even with a high degree of reduction, enables limited MCC production rates and yields (Baleeiro et al., 2021). On an industrial scale, a biorefinery process must use low-cost feedstocks and be independent of the expensive supply of electron donors, such as chemical-grade reagents.
Low-cost organic feedstocks available to develop biorefining processes, such as woody or herbaceous biomass, are mainly composed of non-fermentable lignocellulosic compounds (Holtzapple et al., 2021). Conversely, brewer’s spent grain (BSG) is a promising feedstock alternative, with a world production estimated at 36.4 million tons in 2021 (Zeko-Pivač et al., 2022). It comprises at least 50% (as dry weight) of lignocellulose and contains proteins, soluble carbohydrates, and residual starch as fermentable molecules (Mussatto et al., 2006; Mussatto, 2014; Bachmann et al., 2022; Miranda et al., 2022). The use of BSG as an organic feedstock to produce carboxylates could be of great interest from an industrial bioprocess perspective. In order to increase the production of MCC in an integrated bioprocess from BSG, the fermentable fraction could be directly used in a methane-arrested anaerobic digestion process to produce the metabolic intermediates (SCC, alcohols, lactate, H2, and CO2), whereas the unfermented lignocellulosic fraction would be recovered at the end of the fermentation and valorized, for example, by gasification to generate syngas (mainly CO2, CO, and H2) and water-gas shifted syngas (CO2 and H2) (Baleeiro et al., 2019; Giuliano et al., 2020).
To promote CE, CO2, CO, and H2 gases would be used as a second source of carbon and electron donors through the Wood–Ljungdahl pathway catalyzed by acetogens (Bengelsdorf et al., 2018). This pathway, also called the reductive acetyl-CoA pathway, converts these gases into acetyl-CoA which can be converted into different products such as acetate or ethanol. Like acetate and ethanol, acetyl-CoA is a key metabolite in the CE process. Baleeiro et al. (2019), Baleeiro et al. (2021), and Baleeiro et al. (2022) hypothesized to promote MCC production by combining syngas fermentation with biomass fermentation. Some studies showed that H2 positively affects MCC production (Steinbusch et al., 2011; Nzeteu et al., 2018). Nevertheless, only a few studies have focused on the effect of the combination of organic substrate, H2, and CO2 for medium-chain carboxylate production catalyzed by microbial communities (Arslan et al., 2012; Zhang et al., 2013; Darvekar et al., 2019; González-Tenorio et al., 2020; Baleeiro et al., 2021).
The aim of this study is i) to determine the fermentation profiles and conversion yields that can be obtained from BSG as complex organic feedstock, ii) to compare the titers, rates, and yields of fermentation products when BSG is supplemented with exogenous H2 and CO2, individually or together, as secondary, inorganic electron and carbon sources, iii) to investigate the role of H2 partial pressure on MCC production, and iv) to have a better understanding of the MCC production mechanisms when both organic and inorganic (H2 and CO2) feedstocks are supplied to microbial ecosystems.
2 Materials and methods
2.1 Substrate
BSG was used as an organic substrate for microbial fermentation. It was supplied by the Bertinchamps craft brewery in Gembloux, Belgium. BSG was received fresh the day of the brew, directly divided into 1 kg bags, and stored in the freezer at −20°C before use for fermentation. A fraction of the wet BSG was directly dried at 50°C for further chemical composition analyses.
The chemical composition of the initially dried BSG was analyzed. Polysaccharides were quantified by the Van Soest method (Godin et al., 2011), with the addition of thermotolerant alpha-amylase to degrade starch. Hydrolysates were quantified by liquid chromatography using the method described by Godin et al. (2011), which uses a refractive index detector. Lignin content was quantified by the Van Soest gravimetric method described in Godin et al. (2016). The protein content was determined by the Dumas method using 6.25 gprotein g−1N as the conversion factor of nitrogen to protein. The content of mineral compounds was determined gravimetrically after organic matter oxidation in a muffle furnace set at 550°C up to constant mass. The composition of the initial BSG is presented in Table 1.
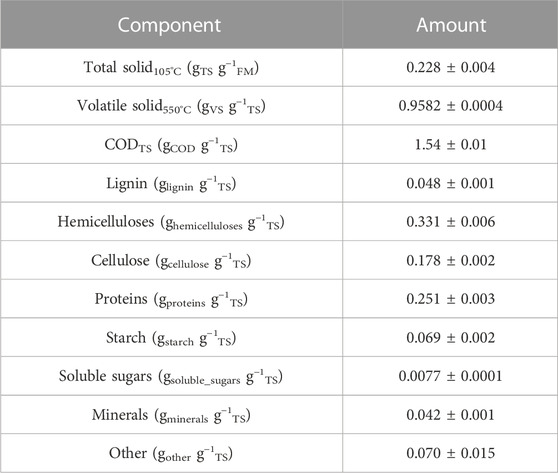
TABLE 1. Composition of the BSG used for fermentation. FM, fresh matter; TS, total solids; VS, volatile solids; COD, chemical oxygen demand.
2.2 Inoculum
Return-activated sludge samples from the municipal wastewater treatment plant in Mont-Saint-Guibert, Belgium, were used as primary inoculum for fermentation. The treatment plant combines enhanced biological phosphorus removal and the nitrification–denitrification process. The sludge did not receive any pretreatment or concentration before use. The average properties of sludge were analyzed in triplicate: total solids (TS) in the fresh matter (FM) at 0.0092 ± 0.0002 gTS g−1FM, volatile solids (VS) at 0.467 ± 0.003 gVS g−1TS, and chemical oxygen demand (COD) at 7.87 ± 0.49 gCOD kg−1FM.
2.3 Reagents
A mineral medium was supplemented to the broth from three concentrated stock solutions (a., b., c.) containing a. NH4H2PO4; b. MgCl2.6H2O, MgSO4.7H2O, CaCl2.2H2O, KCl; and c. H3BO3, FeCl2.4H2O, ZnSO4, MnCl2, CoCl2, CuCl2, NiCl2, Na2MoO4, Na2Se2O3.
The final concentrations in the bioreactor were NH4H2PO4 = 3.6 g L−1, MgCl2.6H2O = 0.6 g L−1, MgSO4.7H2O = 0.2 g L−1, CaCl2.2H2O = 0.2 g L−1, KCl = 0.15 g L−1, H3BO3 = 3 mg L−1, FeCl2.4H2O = 15 mg L−1, ZnSO4 = 1 mg L−1, MnCl2 = 0.3 mg L−1, CoCl2 = 2 mg L−1, CuCl2 = 0.1 mg L−1, NiCl2 = 0.2 mg L−1, Na2MoO4 = 0.3 mg L−1, and Na2Se2O3 = 0.1 mg L−1.
Solutions of 2 M KOH and 1 M H3PO4 were used to adjust the pH.
2.4 Bioreactor preparation and monitoring
Fermentations were performed in 2-L Scott Duran® GL45 glass bottles as a bioreactor, with a mixed liquor working volume of 0.22 L (Figure 1). The GL45 cap was made of a stainless steel headpiece with a two-tube nozzle. The headpiece was pressed on a rubber O-ring seal by a GL45 PBT screw cap with an aperture. Each tube of the headpiece was connected to a flexible PVC tube outside the bottle. The first tube was sealed with a three-way Luer lock valve for gas sampling or supplementation and the second tube with a Mohr pinchcock for liquid sampling or supplementation. The inside part of the tube dedicated to liquid sampling was sealed with a PVC tube long enough to reach the mixed liquor (ML) (Figure 1). The bioreactor was weighed empty and full of water, and the difference between the values allowed for determining the specific headspace volume of each bioreactor.
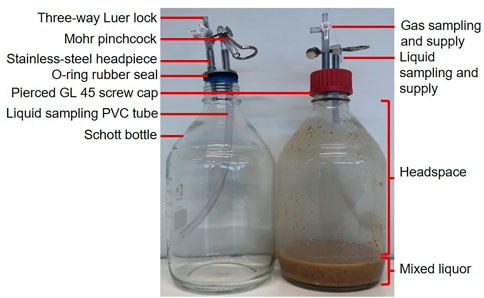
FIGURE 1. Picture of assembled and filled bioreactors.
The ML contained a BSG concentration of 87 gCOD L−1ML in an initial total volume of 0.22 L. This was achieved by adding 54 gFM_BSG, 20 mL of inoculum (7.9 gCOD L−1), 11 mL of the mineral stock solutions, and 153 mL of water into each bioreactor. The initial ML pH was 5.28 ± 0.12. It was adjusted to pH 7.07 ± 0.03 by adding 3 mL of 2 M KOH to each bioreactor before the beginning of the fermentation. The pH were checked with a pH-meter (WTW pH-Electrode SenTix® 41, WTW Multiline P4 universal meter). Each supply was weighed with a scale (OHAUS navigator NVT6201) and recorded after each addition to the bioreactor. A total of 10 mL of mixed liquor was taken with a 50-mL polypropylene syringe (BD Plastipack, United States) to analyze the ML initial composition. Bioreactors were then sealed and flushed for 5 min at a 4 L min−1 flow rate with the appropriate gas depending on the conditions tested (Table 2). Then, 20 mL gaseous samples were taken to analyze the starting headspace gas composition to ensure no trace of remaining O2. The gas pressure was measured with a hand manometer (UNIK 5,000 manometer, GE, United States) and adjusted by gas addition to the desired value with the desired gas (Table 2). Bioreactors were incubated in the dark, in a thermostated room at 35°C on an orbital shaker at 120 rpm for 21 days (Kühner Shaker Lab-Shaker).
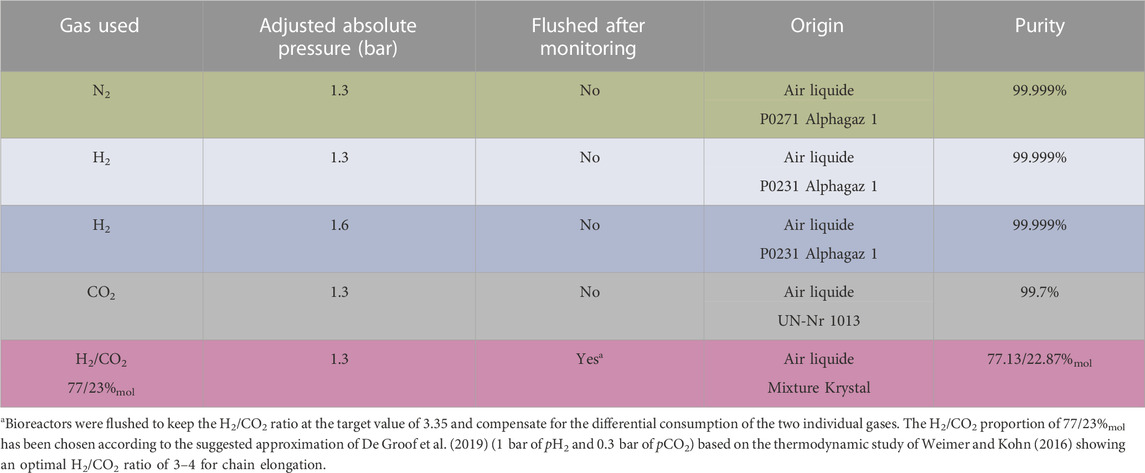
TABLE 2. Headspace gas used for the different tested conditions.
The bioreactor monitoring routine on each measurement day was performed as illustrated in Supplementary Figure S8. In the thermostated room, for each bioreactor, the initial bioreactor mass was recorded, the initial pressure was measured, an initial gas sample was analyzed, and a liquid sample was collected with a 50-mL syringe (BD Plastipack). Sampling and supply of liquid and gas took place without external air entry or release of gas from the headspace, thanks to the three-way Luer lock and Mohr pinchcock device (Figure 1).
The syringes containing ML were weighed to determine the mass of the ML sample by subtraction of the tare. The remaining ML in the bioreactors was calculated by weight difference. A 2-mL sampled ML was transferred to a glass tube for pH measurement and titration. According to the titration and the remaining bioreactor ML quantities, the adequate volume of 2 M KOH or 1 M H3PO4 was added to each reinjection syringe for bioreactor pH adjustment to 7.0 (see next paragraph). The remaining ML was centrifuged (Thermo Scientific Heraeus Megafuge 40 centrifuge), and the liquid and solid phases were separated and weighed separately in 15-mL Falcon® tubes. Adequate volumes were collected from the liquid fractions to carry out soluble chemical oxygen demand (COD) measurements and extract organic soluble metabolites. The solid fractions and the remaining liquid fractions were stored at −20°C.
The content of reinjection syringes was introduced into the appropriate bioreactors for pH adjustment. Depending on the condition (Table 2), a flush of the headspace or simple supplementation of the appropriate gas was operated to reach 20 mbar above the desired pressure. A final gas sample was collected to determine the final gas composition and check for the absence of O2 in the headspace. Then, the resulting pressure was measured. The variation of composition and pressure between the two monitoring days allowed for calculating the gas consumption/production through the ideal gas law. The bioreactor monitoring routine was finalized by a final mass measurement of each bioreactor to determine the remaining ML mass in the bioreactor.
At the end of the 21 days of fermentation, the remaining ML was weighed by difference with the mass of empty bioreactors. After ML centrifugation, the supernatant and pellet fractions were weighed and analyzed for total solids, volatile solids, ash content, soluble COD content, metabolite composition, and total COD (CODt) of the solid fraction.
The mean of the final ML volume on day 21 was 198 ± 19 mL. The differences between bioreactors resulted from the different sampling and neutralization solution volumes taken and added. Therefore, the metabolite mass production was normalized by the actual volume of the ML and expressed as kgCOD normalized by the initial volume of the mixed liquor (kgCOD m−3ML).
2.5 Analytical method
Total solids (TS), volatile solids (VS), ash content, and CODt were measured according to standard methods (APHA, 1998). Soluble COD was measured using the COD Cell Test method (Spectroquant® kits 1.14555.0001, Spectroquant Pharo 300, Merck KGaA, Germany) according to the provider’s instructions.
The headspace gas composition was analyzed by gas chromatography (CompactGC3.0, Global Analyser Solution) with a thermal conductivity detector (GC-TCD). This gas analyzer was calibrated to quantify the proportion of H2, N2, O2, CO2, CH4, and H2O present in the sample. The chromatograph combined two channels. The front channel was equipped with an Rt-QBond column (10 m × 0.32 mm), which separated CO2 and H2O from the other gases. The back channel included two columns in series: one similar to the front channel (Restek, France, Rt-QBond, 2 m × 0.32 mm), which retained CO2, followed by a Molsieve 5A column (7 m × 0.32 mm, Restek, France) that separated the other gases. A three-way valve between the two columns allowed for back-flushing CO2 so that it did not enter the Molsieve column. The elution was performed under isotherm conditions at 60°C with helium as carrier gas at 1 mL min−1 and a pressure of 80 kPa for the front channel and at 70°C with argon as carrier gas at 1 mL min−1 and a pressure of 70 kPa for the back channel. Detectors were heated at 90°C and the filaments at 170°C.
Soluble metabolites were extracted from ML supernatant with liquid–liquid extraction in diethyl ether for GC analysis (Andersen et al., 2017). Extractions were carried out in glass screw top Pyrex test tubes, with approximately 1 g of NaCl (for salting out), 1.5 mL of distilled water, 0.5 mL of the sample or calibrating solution, 0.2 mL of the 4-methyl valerate (4-MV) as internal standard (1 g L−1 stock solution). Finally, 1 mL of 2 M H2SO4, immediately followed by 2 mL of pure diethyl ether (Sigma-Aldrich), was added to each test tube before quickly closing them. The tubes were then manually vigorously shaken for 1 min and centrifuged for 1 min at 3,000 rpm to reach perfect phase separation. Once centrifuged, the organic phase of each test tube was collected with a micropipette and transferred to a glass vial sealed with a PTFE/silicone screw cap (VWR, Germany).
Ether extracts were analyzed by gas chromatography (Trace GC, Thermo Scientific). The samples were injected using an automated sampler. The injector was in a split mode (1:10; split flow 12 mL min−1) and maintained at 250°C. N2 was used as carrier gas at a constant flow of 1.2 mL min−1. Separation was performed by a 30 m, 0.25 mm ID, polar column (DB-WAX Ultra Inert GC Columns, Agilent). Detection was performed using a flame ionization detector (FID) at 260°C. The run time was 43 min. The oven temperature was set at 40°C and increased after 1 min by 10°C min−1 for 20 min. It remained at 240°C for 22 min. Chromeleon 7 was used as identification and quantification software. Chromatograms were automatically integrated; each peak area was normalized by the peak area of the 4-MV internal standard and finally converted to concentration using the corresponding calibration factor. Two stock solutions with alternating component concentrations were used to determine the calibration lines. These stock solutions were diluted with three dilution factors (2/3, 4, and 20) and injected to obtain a final calibration line containing nine points for each component [(0; 0) included]. The components detected and quantified were ethanol (EtOH), propanol (PropOH), isopropanol (iPropOH), butanol (ButOH), isobutanol (iButOH), acetate (C2), propionate (C3), butyrate (C4), isobutyrate (iC4); pentanoate (C5), isopentanoate (iC5), hexanoate (C6), heptanoate (C7), octanoate (C8), nonanoate (C9), decanoate (C10), phenylacetate (PhC2), and phenylpropionate (PhC3).
2.6 Statistics
The experiment started with three biological replicates for the N2, H2 1.3 bar, and H2&CO2 conditions; only duplicates were available for the CO2 and H2 1.6 bar conditions. For the H2&CO2 condition, one replicate was affected by methanogenesis and excluded. Results are based on the mean with standard deviations for the triplicates and average deviation for duplicates.
3 Results
BSG was fermented by a mixed microbial inoculum under N2 at 1.3 bar as a reference condition. In the tested conditions, the headspace was fed with a mixture of H2 and CO2 at 1.3 bar, H2 alone at 1.3 and 1.6 bar, and CO2 alone at 1.3 bar to investigate the influence of the supplementation of inorganic carbon and reducing equivalent sources on the methane-arrested anaerobic digestion of BSG (Table 2).
3.1 Biomass solubilization and fermentation kinetics
Figure 2 presents the evolution of the soluble COD and identified total metabolites over time. Up to day 7, all conditions led to similar total metabolites and soluble COD concentrations. After day 7, the evolution of these concentrations was affected by the headspace composition (Figure 2B). At the end of the fermentation, the soluble COD and total metabolite concentrations under the H2&CO2 condition led to the highest concentrations of 41.9 ± 4.3 gCOD L−1ML and 34.5 ± 3.8 gCOD L−1ML, respectively (Figure 2). The CO2 condition led to the lowest soluble COD concentration and total metabolite concentrations. Both H2 conditions reached similar soluble COD concentrations in the range of 31 gCOD L−1ML and similar total metabolite concentrations in the range of 22 gCOD L−1ML. The N2 reference condition reached a soluble COD concentration of 29.1 ± 1.0 gCOD L−1ML and a total metabolite concentration of 21.6 ± 0.1 gCOD L−1ML (Figure 2).
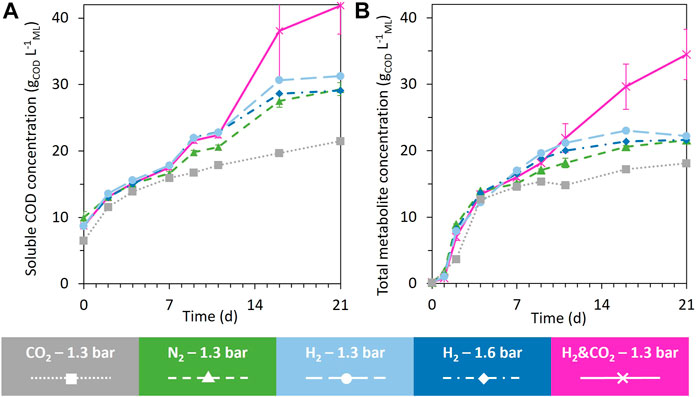
FIGURE 2. Evolution of the soluble COD concentration (A) and the total identified metabolites (B) during the 21 days of fermentation under all tested conditions. When error bars are not visible, they are present but smaller than the dot symbol.
Figure 3 compares the evolution of the composition of the residual solid fraction during fermentation for the H2&CO2 and N2 conditions. Starch and soluble carbohydrates (included in the polysaccharide results) were totally consumed over the first 9 days of fermentation, as well as most fermentable proteins and polysaccharides (about 59% and 50%, respectively). After day 9, proteins were consumed much more slowly for both conditions. Further polysaccharide degradation was limited to only about 17% of the initial content. The apparent lignin content increased under both conditions during fermentation. An overestimation of lignin proportion after day 0 is likely due to analytical inaccuracy resulting from limited sample size and the contribution of humic-like substances formed by microbial digestion behaving like lignin in the analysis method. The final solid residue contained 37%–45% of the initial protein content and 29%–33% of the initial polysaccharide content (Figure 3).
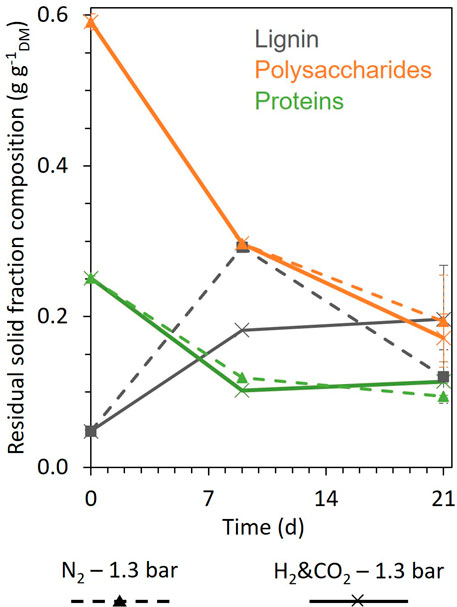
FIGURE 3. Evolution of the composition of the residual biomass solid fraction on days 0, 9, and 21 for the conditions H2 and CO2, 1.3 bar (cross, full line), and N2, 1.3 bar (triangle, dashed line). Polysaccharides are the sum of all carbohydrates (starch, hemicellulose, cellulose, and soluble carbohydrates). When error bars are not visible, they are present but smaller than the dot symbol; on day 9, no uncertainty bar is shown because the samples were too small to carry out replicates.
3.2 Gaseous and soluble metabolite production and consumption
3.2.1 Background fermentation profile of BSG under the N2 reference condition
The acidogenic fermentation of BSG began with a quick and large pH drop during the first two days, accompanied by H2 and CO2 production (Figures 4A, B; Supplementary Figure S1A). The acidogenic H2 was then consumed from day 2 to day 9, unlike acidogenic CO2, which did not show a net consumption during the whole fermentation (Figures 4A, B). Alcohols (mainly ethanol reaching a maximal concentration of 2.2 ± 0.2 gCOD L−1ML) and SCC (mainly acetate) were produced from day 0 to day 4 (Figures 4C, D; Supplementary Figure S2). From day 4 to day 7, the ethanol produced during acidogenesis was sharply consumed, simultaneously with the production of MCC (sum of the C6, C7, C8, C9, and C10) (Figure 4C; Figure 5B). MCC were produced only during this period and reached a production of 3.0 ± 0.1 kgCOD m−³ML (Figure 4C). Hexanoate and heptanoate were the main MCC reaching a production of 1.7 and 1.2 kgCOD m−³ML, respectively (Figure 5B). After day 7 to the end of the fermentation, only a small amount of acetate was produced, accompanied by a slight acidification of the mixed liquor (Figure 5A; Supplementary Figure S1).
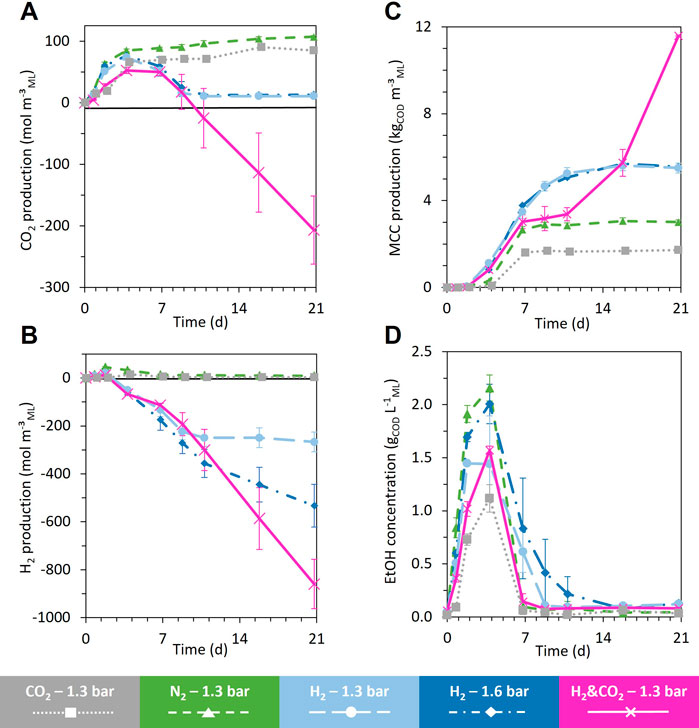
FIGURE 4. Evolution of CO2 production (negative value = consumption) (A), H2 production (B), aggregated MCC production [sum of hexanoate (C6), heptanoate (C7), octanoate (C8), nonanoate (C9), decanoate (C10)], (C) and ethanol (EtOH) concentration (D) during the 21 days fermentation for all the headspace gas conditions, H2 and CO2, 1.3 bar; H2, 1.3 bar; H2, 1.6 bar; CO2, 1.3 bar; and N2, 1.3 bar, respectively, in pink, light blue, blue, gray, and green. When error bars are not visible, they are present but smaller than the dot symbol.
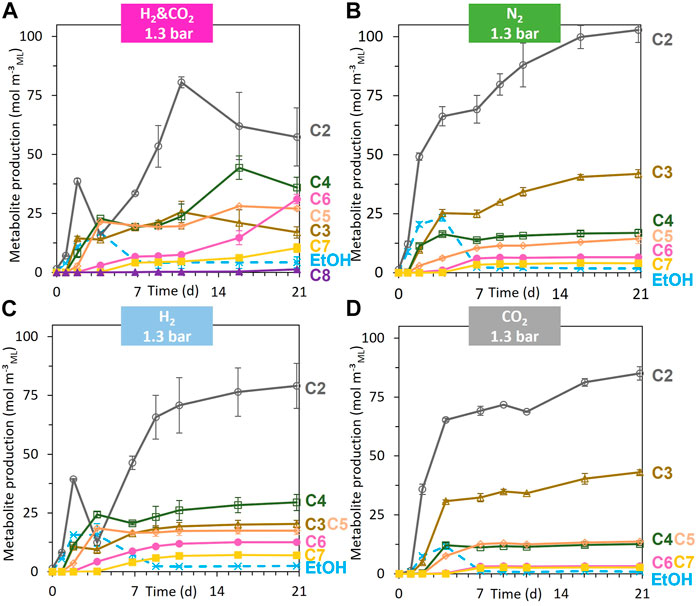
FIGURE 5. Evolution of the individual metabolite production (negative value = consumption) [acetate (C2), propionate (C3), butyrate (C4), pentanoate (C5), hexanoate (C6), heptanoate (C7), and octanoate (C8)] for the headspace gas condition, H2 and CO2, 1.3 bar (A); N2, 1.3 bar (B); H2, 1.3 bar (C); CO2, 1.3 bar (D) during the 21 days of fermentation. When error bars are not visible, they are present but smaller than the dot symbol.
At the end of the fermentation, the total metabolites produced by BSG fermentation under N2 reached a production of 21.6 kgCOD m−³ML from the initial concentration of 87 gCOD_BSG L−1ML and 0.7 gCOD_Inoculum L−1ML, leading to a metabolite/substrate conversion yield of 24.6 ± 0.9% COD (Figure 6; Supplementary Figure S3). The N2 reference condition led to an MCC production of 3.0 ± 0.1 kgCOD m−³ML (Figure 4C). The MCC represented only 14.1 ± 1.1% COD_metabolites, whereas SCC represented 84.7 ± 1.4% COD_metabolites, mainly as acetate and propionate (Figure 6; Supplementary Figure S4). The final total COD recovered at the end of the fermentation represented more than 88% of the total COD added to the bioreactor (Supplementary Figure S3).
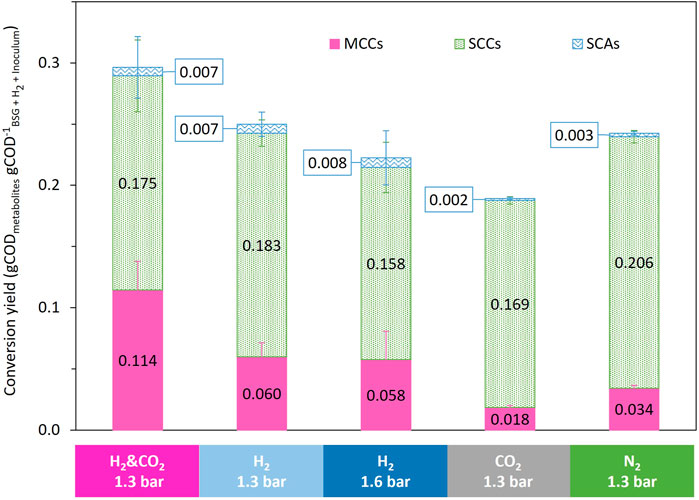
FIGURE 6. Comparison of the influence of the headspace gas composition on biomass conversion yield to identified metabolites.
3.2.2 Fermentation profile of BSG supplemented with H2, CO2, and a mixture of H2 and CO2
All fermentations started with the same profile as the reference condition under N2 (Section 3.2.1), regardless of the nature and pressure of the gas supplied in the headspace. The general trend was a quick and large drop in pH, accompanied by the production of H2, CO2, ethanol, and SCC within the first four days of fermentation (Figures 4A, B, D, Supplementary Figures S1A, S2). Then, a net consumption of the ethanol and H2 occurred concomitantly with a production of MCC until day 7 (Figures 4C, D). After day 7, the fermentation profiles evolved differently depending on the headspace gas nature and pressure.
3.2.2.1 CO2 supplementation during BSG fermentation
When only CO2 was supplied, the soluble COD concentration, the total metabolites, the production of SCC and MCC, the production of acidogenic H2 and CO2, and the maximal ethanol concentration during the fermentation were lower than those for the reference condition under the N2 atmosphere (Figures 2A, B, Figures 4A–D; Supplementary Figure S2). The total metabolites and the hexanoate, heptanoate, and octanoate production were the lowest of all the tested conditions (Figures 2B, 5D). The MCC production stopped after day 7, when acidogenic H2 was no longer consumed, and ethanol concentration decreased below 0.06 gCOD L−1ML, similar to the N2 reference condition (Figures 4C, D). After day 7, only a slight increase in C2 and C3 production occurred (Figure 5D).
The addition of CO2 in the bioreactor headspace led to a decrease in COD conversion yield to 18.9% COD and an MCC proportion of 9.5% COD_metabolites, compared to 24.3% COD and 13.9% COD_metabolites for the N2 reference condition (Figure 6). The final total COD recovered at the end of the fermentation represented more than 83.5% of the total COD added to the bioreactor (Supplementary Figure S3).
3.2.2.2 H2 supplementation of BSG fermentation
When H2 was supplied in the bioreactor headspace, consumption of acidogenic CO2 produced during biomass acidogenesis occurred from day 4 to day 11 (Figure 4A). H2 consumption stopped completely when no more acidogenic CO2 was available in the headspace of bioreactors under 1.3 bar H2. The H2 consumption rate changed significantly for bioreactors under 1.6 bar H2 (Figures 4A, B).
Unlike the reference and CO2 conditions, MCC were produced from day 2 to day 11 for both conditions under the H2 atmosphere. Net consumption of C2 occurred from day 2 to day 4 without a significant increase in ethanol production but an earlier start in MCC production compared to the reference condition (Figure 5C). From day 7 to day 11, MCC were significantly produced (mainly C6 and C7) (Figure 5C). MCC production stopped on day 11, concomitantly with the exhaustion of acidogenic CO2 and when ethanol concentration decreased below 0.2 gCOD L−1ML (Figures 4A–C). After day 11 and until the end of the fermentation, C2 and C4 were slightly produced for both H2 conditions (Figure 5C; Supplementary Figure S5).
The supplementation of H2 led to an MCC production of 5.5 ± 0.2 kgCOD m−³ML and 5.6 ± 0.3 kgCOD m−³ML for the 1.3 and 1.6 bar conditions, respectively (Figure 4C). Compared to the N2 reference condition, the supplementation of H2 increased the MCC production by 83% for both conditions. The MCC proportion increased to 23.9% COD_metabolites and 25.8% COD_metabolites, respectively, for the 1.3 and 1.6 bar conditions compared to 14.1% COD_metabolites for the reference condition under N2 (Figure 6). The SCC proportion decreased to 73.1% COD_metabolites and 70.6% COD_metabolites, respectively, for the 1.3 and 1.6 bar conditions compared to 84.7% COD_metabolites for the reference N2 condition (Figure 6). The total COD recovered at the end of the fermentation represented more than 96.2% and 90.7% of the total COD added to the bioreactor (COD of added H2 included) for the 1.3 and 1.6 bar conditions, respectively (Supplementary Figure S3).
3.2.2.3 H2 and CO2 mixture supplementation of BSG fermentation
This condition also produced acidogenic H2 and CO2 at the beginning of the fermentation until days 2 and 7, respectively (Figures 4A, B). All acidogenic H2 and CO2 were quickly consumed during the following days. H2 and CO2 were continuously consumed until the end of fermentation.
The three biological replicates behaved differently. Because methanogenesis was detected in one replicate (bioreactor 3, Figure 7), the latter was excluded from this series and only considered a negative control for the discussion in Section 4.3. A delay in the onset of gas consumption and MCC production (Figure 7A) in the two other bioreactors explains the large standard deviation in Figure 4.
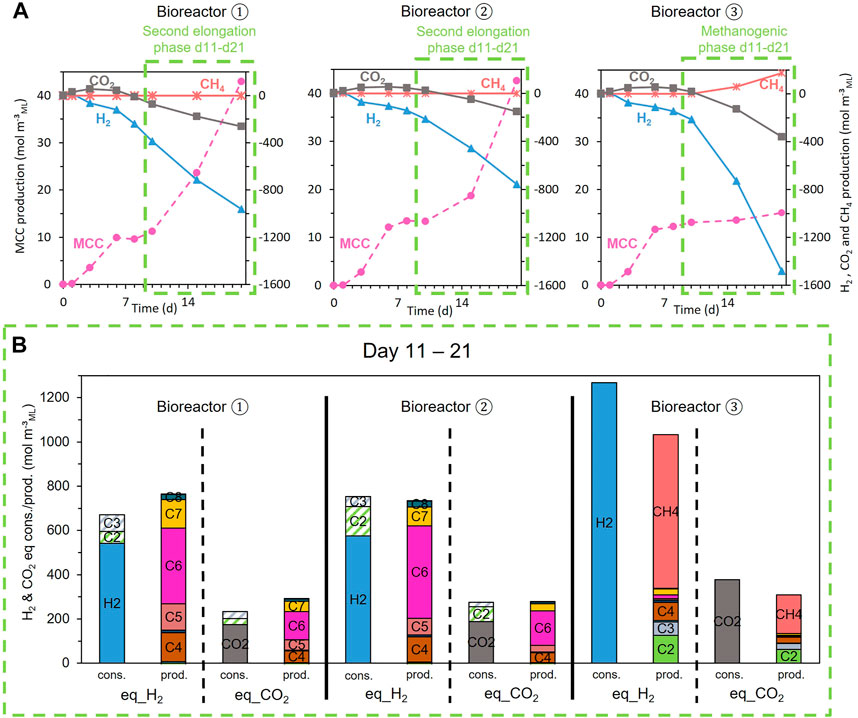
FIGURE 7. (A) Evolution of the CO2, H2, CH4 (right axes, origin on top), and MCC (left axes, origin at the bottom) consumption (negative values) and production (positive values) during the fermentation for each replicate of the H2 and CO2 condition; (B) reducing equivalent and carbon balances expressed in consumed (cons.) and produced (prod.) equivalent_H2 and equivalent_CO2 during the second phase (green dotted boxes).
MCC production followed two elongation phases, the first one from day 2 to day 7 and the second one from day 11 to the end of fermentation (Figure 4C). The first phase was concomitant with the ethanol consumption and stopped when the ethanol concentration decreased to 0.2 gCOD L−1ML (2 mM) on day 7. This kinetic profile is similar to the N2 reference condition and the CO2 condition (Figure 4D). The MCC production achieved after 7 days of fermentation reached a level intermediate between the MCC production observed under a pure H2 atmosphere and pure CO2 atmosphere, respectively (Figure 4C). From day 7 to day 11, MCC production stopped, unlike SCC production, which exhibited the highest production of all tested conditions (Figure 4C; Supplementary Figure S2). The second elongation phase started on day 11, whereas the ethanol concentration remained below 0.08 gCOD L−1ML (0.8 mM) and H2 and CO2 were consumed (Figures 4A–D). From day 11 to day 16, a simultaneity between the C2 and C3 consumption with the C4, C5, C6, and C7 production could be observed. From day 16 to day 21, C2, C3, C4, and C5 were consumed, whereas C6, C7, and C8 were produced. The final production of C6, C7, and C8 reach 7.9 ± 0.5 kgCOD m-3ML, 3.1 ± 0.5 kgCOD m−3ML, and 0.466 ± 0.006 kgCOD m−3ML, respectively (corresponding to 3.6 ± 0.2 g L−1ML, 1.3 ± 0.2 g L−1ML, and 0.191 ± 0.002 g L−1ML, respectively) (Supplementary Figure S4).
The supplementation of H2 and CO2 led to an MCC production of 11.6 ± 0.3 kgCOD m−³ML (Figure 4C). Compared to the reference condition, the supplementation of H2 and CO2 increased MCC production by 285%. The addition of H2 and CO2 in the bioreactor headspace enabled a substrate to metabolite COD conversion yields of 29.6% COD, compared to 24.3% COD for the reference condition under N2 (Figure 6). The MCC proportion increased to 38.5% COD_metabolites compared to 14.1% COD_metabolites for the reference condition under N2 (Figure 6). The SCC proportion decreased to 59.1% COD_metabolites compared to 84.7% COD_metabolites for the reference condition under N2 (Figure 6). The total COD recovered at the end of the fermentation represented more than 94.7% COD of the total COD added to the bioreactor (COD of added H2 included) (Supplementary Figure S3).
3.3 H2 & CO2 condition, second elongation phase: molar consumption ratio
Figure 7A shows that H2 and CO2 were continuously consumed for the three replicates during the second phase but in different proportions. MCC were continuously produced for two bioreactors (1 and 2) during the second elongation phase, whereas the third bioreactor (3) started methanogenesis without any production of MCC (Figure 7A).
Figure 7B presents the electron and carbon balances in terms of H2 (H2 = 2 H+ + 2 e−) and CO2 during the second phase (days 11–21). The carboxylates produced or consumed are presented as equivalent H2 and CO2 (eq_H2 and eq_CO2), calculated following Eq. 1. Figure 7B shows that electron and carbon balances are nearly closed for each bioreactor.
Bioreactors 1 and 2 have mainly produced MCC (C6, C7, and C8) and have significantly consumed C2 and C3, whereas bioreactor 3 has consumed nearly twice more H2 and CO2 than the bioreactors 1 and 2 to produce mainly methane without any consumption of SCC (Figure 7B):
The H2/CO2 molar ratio of the exogenous gas mixture supplemented to the bioreactors was 77/23 (%mol), which represents supplemented 3.35 molH2 mol−1CO2. The net consumption of exogenous H2 and CO2 supplemented in the three bioreactors and the H2/CO2 molar consumption ratio are summarized in Table 3. Bioreactors 1 and 2 had consumption molar ratios close to 3, whereas bioreactor 3 had a molar ratio very similar to the 3.35 molH2 mol−1CO2 in the initially supplied gas.
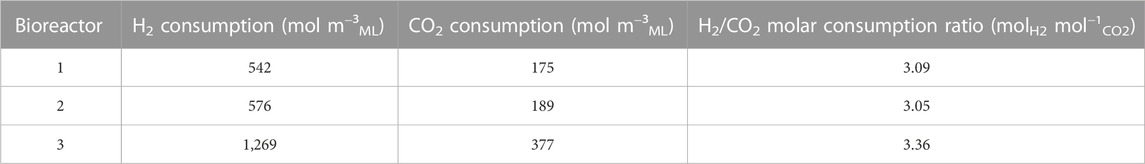
TABLE 3. Net H2 and CO2 consumptions and consumed H2/CO2 molar ratio during the second phase (days 11–21) for each bioreactor supplemented with H2 and CO2 in the headspace.
4 Discussion
4.1 BSG acidogenic profile until day 11
4.1.1 Most of the BSG fermentable fraction is digested within 11 days
During the first nine days of BSG fermentation, microorganisms have solubilized and partially transformed starch, fermentable proteins, soluble sugar, and 50% of the initially present structural polysaccharides into known metabolites (Figure 3). Under the N2 reference condition, on day 11, the total identified metabolite concentration had already reached 86% ± 1% of the final total metabolites achieved after 21 days of fermentation (Figure 2B). After day 11, the remaining part of identified metabolites (only C2 and C3) continued to accumulate but at a much slower rate (Figure 5B). After day 11, the decoupling of the total metabolites and the soluble COD suggests that a non-identified part of the soluble COD is increasing, which could be attributed to further solubilization of BSG components that were not or were hardly fermentable and not converted in the mainstream metabolites covered by our analytical monitoring (Figures 2A, B). The acidogenic CO2 produced was not consumed during fermentation, and all the produced acidogenic H2 had already been consumed on day 11 (Figures 4A, B). These results suggest that BSG was almost exhausted as an organic substrate within the first 11 days of fermentation and that most BSG fermentable fractions were transformed into known metabolites.
The residual solid matter and the soluble COD concentration evolved in a similar way for both the H2 & CO2 and the reference N2 conditions (Figures 2A, 3). These results suggest that BSG solubilization by the microorganisms was independent of the gas supplied. This does not agree with Arslan et al. (2012), who observed a decrease in the hydrolysis degree of potato wastes after 1 week of fermentation when a mixture of H2 and CO2 (1:1%mol) replaced the N2 in the headspace.
Nevertheless, a significant increase of 60% higher total metabolites was observed on day 21 when both H2 and CO2 were supplied compared to the N2 reference condition (Figure 2B). This increase in identified metabolites occurred essentially after day 9 and can be attributed to H2 and CO2 conversion to soluble metabolites (see Section 4.2).
Starting from BSG as a unique feedstock, the metabolite production obtained after 9 days of fermentation is similar to those obtained by Liang and Wan (2015), who obtained approximately 90% of the final total metabolites in 10 days at pH 7. Perimenis et al. (2018) obtained 90% of the maximal volatile fatty acid concentration in 15 days.
4.1.2 BSG feeds a first chain elongation phase (days 2–11) through acidogenic ethanol and H2 consumption
Under all tested conditions, MCC production began slowly from day 2 to day 4, with the main production occurring between day 4 and day 7 (Figure 4C). During the first elongation phase, the MCC production was concomitant with ethanol and H2 consumption. It stopped when ethanol concentration decreased below 0.2 gCOD L−1ML (2 mM) and when the produced acidogenic H2 was consumed (Figures 4B–D).
Under the N2 reference condition, the distinctly consumed CODethanol was equivalent to 68% of the total CODMCC produced. The acidogenic H2 consumed represented 19% of the total CODMCC produced. Ethanol and H2 correspond to 87% of the total produced CODMCC. Some of the acidogenic ethanol and produced H2 may have been directly converted to MCC and thus not monitored, which could further increase these COD ratios. Most probably, the remaining non-identified 13% of the total CODMCC could be related to the elongated SCC. This is consistent with the kinetic and thermodynamic study of González-Cabaleiro et al. (2013), which evidenced the feasibility of the production of C6 (or MCC) through the reduction of acetate or butyrate with ethanol but also based on ethanol only. Some parts of the consumed H2 COD could have contributed to the production of SCC by acetogens (Bengelsdorf et al., 2018).
Lactate could also have been produced in the early days of the BSG acidogenesis stage and used as acetyl-CoA and reduced cofactor precursors to generate MCC through lactate-based RBO (Zhu et al., 2015; Liu et al., 2020). The lactate-based RBO generates 1 mole of CO2 for each mole of pyruvate decarboxylated to acetyl-CoA (Cavalcante et al., 2017). For the N2 reference condition, Figures 4A, C show that CO2 production stopped after day 4 concomitantly with a slight production of MCC to reach 0.3 kgCOD m−³ML. This slight increase in MCC production could be due to lactate-based RBO. The production of MCC from lactate could have occurred during the first 4 days of fermentation but does not appear to be a dominant MCC production route. These assumptions are consistent with the observed CO2 evolution. However, they cannot be definitely demonstrated as CO2 can be involved in several simultaneous biological and physicochemical processes. Moreover, this slight increase could also result from the start of ethanol-based RBO as ethanol concentration reached its maximum on day 4 and started to be distinctly consumed afterward.
These results suggest that ethanol produced by the BSG acidogenesis is the main electron donor and carbon source for the first chain elongation phase. Acidogenic H2 might also play a role in the production of MCC. These results also suggest that both ethanol concentration and H2 partial pressure could be limiting factors for MCC production.
4.1.3 Supplying CO2 and H2 affects the CE process
4.1.3.1 Supplying CO2 alone inhibits the whole fermentation and ethanol-based CE pathway
When only CO2 was exogenously supplied to the culture broth, the total metabolite, including the produced MCC, was the lowest of all tested conditions (Figures 2B, 4). The stronger acidification of the medium observed for the CO2 condition (Supplementary Figure S1) compared to the other conditions possibly resulted from an insufficient buffer capacity of the BSG and mineral medium to resist both the acidogenic fermentation and the solubilization of CO2. Although the first acidification step lasted less than 16 h, a selection of more acid-resistant microorganisms at the beginning of fermentation could have occurred. This selection could explain the lower total metabolite production. Moreover, the lack of a reductive atmosphere could explain the poor MCC production.
Compared to the other non-reductive condition under the N2 atmosphere, the maximal ethanol concentration achieved for the CO2 condition was two times lower (Figure 4D). Excessive ethanol oxidation could have been promoted in these acidic and non-reductive conditions with low H2 partial pressure (Roghair et al., 2018). Ethanol-oxidizing microorganisms could have oxidized ethanol to acetate, decreasing the ethanol availability for the ethanol-based RBO pathway. This could explain the low MCC production under this condition.
Different effects of CO2 supplementation during complex organic feedstock fermentation were reported in the literature. The present study shows that CO2 supplementation inhibits the entire BSG fermentation and does not select any specific metabolite production. However, Arslan et al. (2012) and Arslan et al. (2013) observed that CO2 drives the organic waste stream fermentation to the production of n-butyrate. Conversely, Darvekar et al. (2019) reported that from lignocellulosic substrates, CO2 supplementation decreased the total metabolite production and moved carboxylate production toward MCC production.
4.1.3.2 Supplying H2 alone promotes CE and allows acidogenic CO2 consumption
Compared to the N2 reference condition, the supply of H2 during the BSG fermentation allowed a quicker start in MCC production and nearly doubled the final amount produced (Figure 4C). Thus, H2 played an important role in MCC production from raw biomass. When supplying H2, the H2 consumption was concomitant to acidogenic CO2 consumption and MCC production. Elongation stopped when acidogenic CO2 was exhausted and ethanol concentration reached 0.06 gCOD L−1ML (or 0.625 mM) (Figures 4A–D).
On the one hand, H2 can feed the elongation process through acetate reduction to ethanol (Steinbusch et al., 2008; González-Cabaleiro et al., 2013; Spirito et al., 2014). Compared to the N2 control condition, a net consumption of acetate occurred when H2 was supplied, but no increase in ethanol concentration during this period was detected (Figures 4D, Figures 5B, C). As the MCC production started before the N2 reference condition, this potential H2- and acetate-based ethanol could be directly converted to MCC, resulting in no detectable increase in ethanol production. This could partially explain the increase in MCC production but does not explain the consumption of acidogenic CO2.
On the other hand, the MCC production was concomitant with the acidogenic CO2 and H2 consumption (Figures 4A–C). This suggests that acidogenic CO2 could be linked to the MCC production probably through homoacetogenesis and the resulting acetate and/or acetyl-CoA production (Section 4.3).
The results obtained for both H2 conditions (with a H2 partial pressure of 1.3 and 1.6 bar) are similar in terms of the acidogenic and elongation phases. Compared to the results of Steinbusch et al. (2008) obtained at pH 5.0, in this study at pH 7.0, the sole increase in H2 partial pressure from 1.3 to 1.6 bar did not increase the reduction of carboxylates to their corresponding alcohols nor allowed a better MCC production (Figures 4C, 6; Supplementary Figure S4). In other words, at pH 7.0, the single increase in H2 partial pressure did not stimulate the microbial reduction of acetate to ethanol or its direct assimilation to produce elongated carboxylates. Nevertheless, for both H2 conditions, H2 consumption stopped concomitantly with the MCC production when no more CO2 was available. Therefore, the CO2 availability in the headspace could be the limiting factor for MCC production when H2 is supplied.
4.2 H2 and CO2 together feed a second elongation phase after day 11
After day 11, both H2 and CO2 continued to be consumed, as well as acetate, but the ethanol concentration remained at a concentration below 0.08 gCOD L−1ML (0.8 mM), while the production of MCC restarted (Figures 4A–D, Figure 5A). Considering that the BSG solubilization and fermentation were mainly exhausted within the first 9–11 days of fermentation (see above) and that ethanol concentration remained around 1 mM, the recovery of MCC production after day 11 would be fed only by the exogenous H2 and CO2 supply.
During this second elongation phase (days 11–21), if H2 and CO2 are considered the only reactants for carboxylate production, then Eq. 1 can be considered. In addition, it can be assumed that all the moles of carboxylates produced or consumed during this period can be expressed as their H2 molar equivalent and CO2 molar equivalent, following the stoichiometry of Eq. 1. Following these assumptions, electron and carbon balances were calculated in terms of eq_H2 and eq_CO2 from the produced and consumed carboxylates. Figure 7B shows that almost all the net consumed H2, CO2, and carboxylates are recovered in terms of eq_H2 and eq_CO2 in the produced carboxylates for replicates 1 and 2. Balances are not perfectly closed, but it can be assumed that other microbial activities misroute the electron equivalents from H2 and carbon from CO2 toward microbial cell synthesis and other unknown organic end-products. Moreover, even if most of the BSG fermentable fraction was solubilized, some residual soluble fraction could also be transformed into metabolites. Nevertheless, as the balances are quite complete, the later processes can only be considered secondary.
The increase in MCC production by 285% when both H2 and CO2 are supplied to the microorganisms compared to the N2 reference condition was consistent with the observations made by Darvekar et al. (2019), who showed that the final concentration of C6 was 186% higher when both H2 and CO2 were supplied [H2:CO2 (1:1)] than the N2 reference condition.
4.3 Consumed H2/CO2 molar ratio of 3 as a signature of CE based on H2, CO2, and SCC
Table 3 presents H2/CO2 molar ratios of consumed H2 and CO2 for each replicate from day 11 to the end of fermentation. Reactors 1 and 2 hosted a second elongation phase (Figure 7A), with H2/CO2 molar ratios of 3.09 and 3.05, respectively (Table 3). Table 4 presents the H2/CO2 molar ratio expected following Eq. 1. According to Eq. 1, the H2/CO2 consumption molar ratio depends on the number of carbon atoms (n) of the produced carboxylates and never reaches the value of 3. In other words, as electron and carbon balances are nearly closed and the H2/CO2 molar ratio exceeds 3, the carboxylate production cannot be explained by the stoichiometry of Eq. 1.

TABLE 4. The H2/CO2 molar ratio following Eq. 1 depends on the number of carbon atoms in the produced carboxylate.
Figure 5A shows a net consumption of SCC (i.e., C2, C3, C4, and C5) concomitantly with the production of MCC (C6, C7, and C8), without detectable net consumption of ethanol during the second elongation phase. These SCC are then expected to be part of the reactants in addition to H2 and CO2. If there is a simultaneous consumption of SCC, H2, and CO2 with an H2/CO2 molar ratio of 3 during the production of MCC, then Eq. 2 can be considered.
Eq. 2 does not exclude that H2 and CO2 are first converted to ethanol following Eq. 3 as ethanol production from H2 and CO2 is thermodynamically favorable (ΔG° = −97.6 kJ mol−1ethanol) and follows an H2/CO2 consumption molar ratio of 3 (Eq. 3). Therefore, the second elongation phase can be ethanol-based, assuming a low pseudo-steady-state concentration of extracellular ethanol, as it could be consumed as fast as it was produced. Ethanol can contribute to elongating SCC (Eq. 4) or be directly converted to carboxylates (Eq. 5):
All these reactions are consistent with the Wood–Ljungdahl pathway, which consumes H2 and CO2 to produce acetyl-CoA. Acetyl-CoA can be the precursor of ethanol or acetate and can be directly used in the RBO pathway for acyl-chain elongation (Bengelsdorf et al., 2018). The H2 reductive atmosphere could maintain a sufficiently high NADH/NAD+ ratio for activating the RBO pathway, which will regenerate the NAD+ oxidized cofactor (Rodríguez et al., 2006; Spirito et al., 2014). A positive ATP balance could be reached considering that ATP generation is due to the electron-transport phosphorylation occurring with the electro-chemical gradients (H+ and Na+) across the cytoplasmic membrane linked to the reduction of NAD+ (Rodríguez et al., 2006; González-Cabaleiro et al., 2013; Liew et al., 2016).
Figure 8 summarizes the thermodynamically feasible elongation reactions based on H2 and CO2. On the right side, the blue reactions describe the n-carbon elongation of initially present carboxylates. This pathway can directly use 3n H2, n CO2, and n/2 carboxylate for carboxylate elongation (Eq. 2) or ethanol as a metabolic intermediate (Eq. 4'). On the left side of Figure 8, the orange reactions are based only on H2 and CO2 as reactants with no consumption of shorter carboxylates for carboxylate elongation, passing by ethanol as a metabolic intermediate (Eq. 5') or not (Eq. 1'). Eq. 1', Eq. 4', and Eq. 5' are stoichiometrically equivalent to Eq. 1, Eq. 4, and Eq. 5, respectively (Supplementary Excel). Both the orange pathway (Figure 9A; function of n) and the blue pathway (Figure 9B; function of m, with n = 2) are thermodynamically favorable.
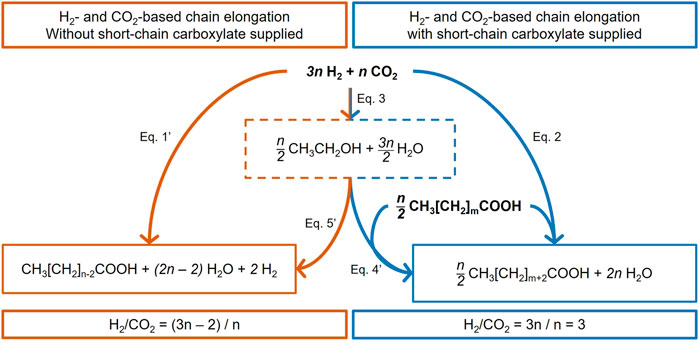
FIGURE 8. Stoichiometric balances of the H2 and CO2 conversion that can lead to MCC, either as the only reactant (left, orange pathway) or supplemented with shorter-chain carboxylates (right, blue pathway). n is a multiple of 2. Eq. 1', Eq. 4', and Eq. 5' are stoichiometrically equivalent to Eq. 1, Eq. 4, and Eq. 5, respectively (Supplementary Excel).
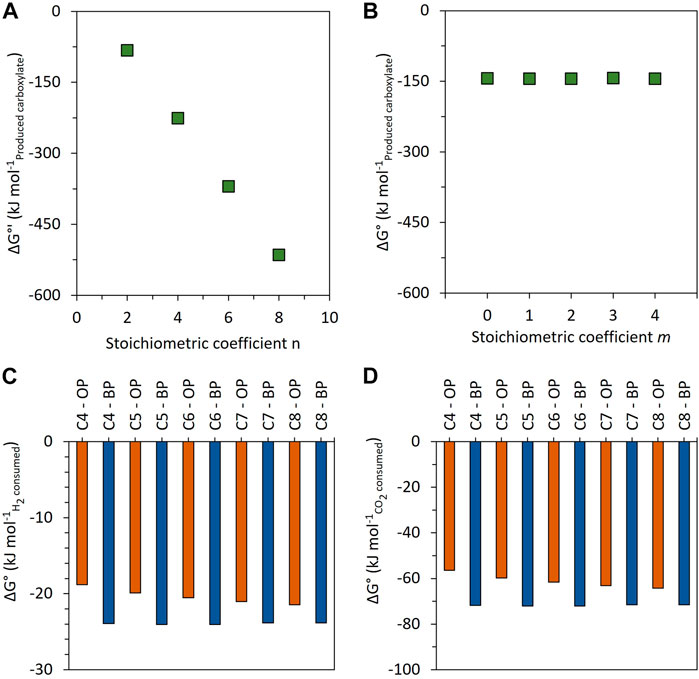
FIGURE 9. Change in standard Gibbs free energy for carboxylate production as a function of n (without shorter-chain carboxylate consumption—orange pathway of Figure 8) (A) and as a function of m (with shorter-chain carboxylate consumption (n = 2)—blue pathway of Figure 8) (B). Comparison of the change in Gibbs free energy for carboxylate production (C4, C5, C6, C7, and C8) between the orange pathway (OP) and the blue pathway (BP), normalized by the consumed H2 (C) and consumed CO2 (D).
The orange reactions of Figure 8 (Eq. 1' or the sequence of Eq. 3 + Eq. 5') show a ΔG° increasingly favorable with increasing the n stoichiometric value (Figure 9A). However, they do not explain the experimentally measured H2/CO2 consumption molar ratios of 3.05 and 3.09 (Table 3). Indeed, the stoichiometric ratio of the orange reactions is n-dependent due to the presence of H2 on the product side. This is consistent with the first paragraph of Section 4.3. Therefore, the observed carboxylate production cannot be explained by the stoichiometry of the orange reactions.
The blue reactions of Figure 8 describe the elongation of initially present carboxylate to elongated carboxylate from H2 and CO2 as reactants, with (Eq. 4') or without (Eq. 2) ethanol as the identified intermediate. These reactions are consistent with the RBO pathway for a stoichiometric coefficient n equal to a multiple of 2. Stoichiometrically, the elongation of n moles of carboxylates needs 3n moles of H2 and n moles of CO2 and gives a constant value of 3 as the stoichiometric H2/CO2 ratio consumed (3n/n = 3). This stoichiometry is consistent with the experimentally measured H2/CO2 molar ratio in this study (Table 3). These reactions are thermodynamically feasible and show a constant value of ΔG° = −143.9 ± 0.6 kJ mol−1carboxylate, independent of m, the carbon number in the initial carboxylate elongated (Figure 9B).
Thermodynamically, when comparing the carboxylate elongation of two carbon atoms from H2 and CO2, either with already formed carboxylates (blue pathway) or without carboxylates as a precursor (orange pathway), the changes of standard Gibbs free energy per mole of consumed H2 (Figure 9C) and per mole of consumed CO2 (Figure 9D) show that the blue pathway is more thermodynamically favorable. Therefore, it can be expected to be preferred by microorganisms. Altogether, the stoichiometric and thermodynamic analyses of the second elongation phase are consistent with a chain elongation based on the initially present carboxylates and with H2 and CO2 consumption. Nevertheless, it cannot be clarified whether this pathway passes or not through ethanol as a metabolic intermediate [(Eq.3 + Eq.4') vs. (Eq.2)].
This elongation based on SCC, H2, and CO2 can also explain the increase in MCC production observed in this study when only H2 was supplied to the microorganisms (Section 4.1.3.2). Indeed, the supplementation of H2 allowed acidogenic CO2 to be consumed and can explain a nearly doubled production of MCC compared to the N2 reference condition. As the elongation stopped concomitantly with the lack of CO2, this confirms the crucial role of both H2 and CO2 in mixed microbial chain elongation with or without supplementation of organic feedstock.
More details on the potential SCC-, H2-, and CO2-driven elongation pathway catalyzed by microbial communities would be obtained by carrying long-term cyclic, fixed-volume semi-batch fed reactor fermentation with H2 and CO2 supply, with or without organic feedstock addition. Other challenges to overcome are the full inhibition of methanogenesis and increasing the concentration of the produced MCC while maintaining a stable production without inhibition of the microorganisms due to the MCC toxicity. The analysis of microbial community dynamics during the fermentation will provide new insights into the MCC production process and if different microbial populations are responsible for the different detected fermentation profiles.
5 Conclusion
Two elongation phases were distinguished when organic feedstock, H2, and CO2 were fed together to microorganisms. The first phase seems mainly based on the ethanol conversion generated by the acidogenic phase. The second elongation phase occurred when the organic feedstock was almost completely consumed. Further metabolite production could only result from the consumption of the H2 and the CO2 supplied to the system.
Based on the carbon and reducing equivalent balances, thermodynamic calculations, and a specific H2/CO2-molar consumption ratio of 3 molH2/molCO2 (experimentally measured and stoichiometrically confirmed), this study suggests that the second elongation phase results from the elongation of accumulated SCC fed by H2 and CO2. According to our knowledge, this is the first time that an elongation phase based only on SCC, H2, and CO2 with such a well-determined H2/CO2 molar consumption ratio is described. Ethanol can be a non-detected intermediate metabolite synthesized from H2 and CO2, contributing to the elongation of accumulated SCC. This process also fits an H2/CO2 molar ratio of 3. However, ethanol could not act as the only intermediate reactant as the stoichiometry of ethanol-only elongation does not fit the observed H2/CO2 molar ratio of 3.
When various reducing equivalent and carbon sources are supplied to microorganisms, MCC production profiles are more difficult to interpret because of diverse metabolic pathways occurring simultaneously. Nevertheless, the supplementation of H2 during the organic substrate conversion allowed acidogenic CO2 to be consumed and nearly doubled the MCC production. This confirms that MCC production from organic feedstock fermentation is also dependent on H2 and CO2 consumption.
Data availability statement
The raw data supporting the conclusion of this article will be made available by the authors, without undue reservation.
Author contributions
GH, FA, and PG: experiment conceptualization and methodology; GH, TN, and FA: fermentation experiment execution; BG: biomass chemical composition experiment execution; GH and TN: data treatments; GH and AI: investigations and data analyses; GH: data visualization and original draft writing; BS and PG: supervision and draft review. All authors listed have made a substantial, direct, and intellectual contribution to the work and approved it for publication.
Funding
This work was supported by the projects eBIO2CHEM, ENERBIO, and RE4BRU, respectively, funded by the Walloon Region (DGO3), Europe and Walloon Region (FEDER), and the Brussels Capital Region (Innoviris).
Acknowledgments
The Bertinchamps craft brewery in Gembloux is gratefully acknowledged for providing brewer’s spent grain.
Conflict of interest
The authors declare that the research was conducted in the absence of any commercial or financial relationships that could be construed as a potential conflict of interest.
Publisher’s note
All claims expressed in this article are solely those of the authors and do not necessarily represent those of their affiliated organizations, or those of the publisher, the editors, and the reviewers. Any product that may be evaluated in this article, or claim that may be made by its manufacturer, is not guaranteed or endorsed by the publisher.
Supplementary material
The Supplementary Material for this article can be found online at: https://www.frontiersin.org/articles/10.3389/fbioe.2023.1165197/full#supplementary-material
Abbreviations
BSG, brewer’s spent grain; CE, chain elongation; COD, chemical oxygen demand; CRAW, Walloon agricultural research center; EtOH, ethanol; FM, fresh matter; MCC, medium-chain carboxylates; ML, mixed liquor; RBO, reverse β-oxidation; SCA, short-chain alcohols; SCC, short-chain carboxylates; TS, total solid; VS, volatile solid; PropOH, propanol; ButOH, butanol; C2, acetate/acetic acid; C3, propionate/propionic acid; C4, butyrate/butyric acid; iC4, isobutyrate/isobutyric acid; C5, pentanoate/pentanoic acid; iC5, isopentanoate/isopentanoic acid; C6, hexanoate/hexanoic acid; C7, heptanoate/heptanoic acid; C8, octanoate/octanoic acid; C9, nonanoate/nonanoic acid; C10, decanoate/decanoic acid; PhC2, phenylacetate/phenylacetic acid; PhC3, phenylpropionate/phenylpropanoic acid.
References
Agler, M. T., Wrenn, B. A., Zinder, S. H., and Angenent, L. T. (2011). Waste to bioproduct conversion with undefined mixed cultures: The carboxylate platform. Trends Biotechnol. 29, 70–78. doi:10.1016/j.tibtech.2010.11.006
Albuquerque, M. G. E., Martino, V., Pollet, E., Avérous, L., and Reis, M. A. M. (2011). Mixed culture polyhydroxyalkanoate (PHA) production from volatile fatty acid (VFA)-rich streams: Effect of substrate composition and feeding regime on PHA productivity, composition and properties. J. Biotechnol. 151, 66–76. doi:10.1016/j.jbiotec.2010.10.070
Andersen, S. J., De Groof, V., Khor, W. C., Roume, H., Props, R., Coma, M., et al. (2017). A Clostridium group IV species dominates and suppresses a mixed culture fermentation by tolerance to medium chain fatty acids products. Front. Bioeng. Biotechnol. 5, 8. doi:10.3389/fbioe.2017.00008
Angenent, L. T., Richter, H., Buckel, W., Spirito, C. M., Steinbusch, K. J. J., Plugge, C. M., et al. (2016). Chain elongation with reactor microbiomes: Open-culture biotechnology to produce biochemicals. Environ. Sci. Technol. 50, 2796–2810. doi:10.1021/acs.est.5b04847
Arslan, D., Steinbusch, K. J. J., Diels, L., De Wever, H., Buisman, C. J. N., and Hamelers, H. V. M. (2012). Effect of hydrogen and carbon dioxide on carboxylic acids patterns in mixed culture fermentation. Bioresour. Technol. 118, 227–234. doi:10.1016/j.biortech.2012.05.003
Arslan, D., Steinbusch, K. J. J., Diels, L., De Wever, H., Hamelers, H. V. M., and Buisman, C. J. N. (2013). Selective carboxylate production by controlling hydrogen, carbon dioxide and substrate concentrations in mixed culture fermentation. Bioresour. Technol. 136, 452–460. doi:10.1016/j.biortech.2013.03.063
Bachmann, S. A. L., Calvete, T., and Féris, L. A. (2022). Potential applications of brewery spent grain: Critical an overview. J. Environ. Chem. Eng. 10, 106951. doi:10.1016/j.jece.2021.106951
Baleeiro, F. C. F., Kleinsteuber, S., Neumann, A., and Sträuber, H. (2019). Syngas-aided anaerobic fermentation for medium-chain carboxylate and alcohol production: The case for microbial communities. Appl. Microbiol. Biotechnol. 103, 8689–8709. doi:10.1007/s00253-019-10086-9
Baleeiro, F. C. F., Kleinsteuber, S., and Sträuber, H. (2021). Hydrogen as a co-electron donor for chain elongation with complex communities. Front. Bioeng. Biotechnol. 9, 650631. doi:10.3389/fbioe.2021.650631
Baleeiro, F. C. F., Raab, J., Kleinsteuber, S., Neumann, A., and Sträuber, H. (2022). Mixotrophic chain elongation with syngas and lactate as electron donors. Microb. Biotechnol. 16, 322–336. doi:10.1111/1751-7915.14163
Bengelsdorf, F. R., Beck, M. H., Erz, C., Hoffmeister, S., Karl, M. M., Riegler, P., et al. (2018). “Bacterial anaerobic synthesis gas (Syngas) and CO2 + H2 fermentation,” in Advances in applied microbiology (Amsterdam: Elsevier), 143–221. doi:10.1016/bs.aambs.2018.01.002
Cavalcante, W. de A., Leitão, R. C., Gehring, T. A., Angenent, L. T., and Santaella, S. T. (2017). Anaerobic fermentation for n-caproic acid production: A review. Process Biochem. 54, 106–119. doi:10.1016/j.procbio.2016.12.024
Darvekar, P., Liang, C., Karim, M. N., and Holtzapple, M. T. (2019). Effect of headspace gas composition on carboxylates production in open-culture fermentation of corn stover. Biomass Bioenergy 126, 57–61. doi:10.1016/j.biombioe.2019.04.019
De Groof, V., Coma, M., Arnot, T., Leak, D. J., and Lanham, A. B. (2019). Medium chain carboxylic acids from complex organic feedstocks by mixed culture fermentation. Molecules 24, 398. doi:10.3390/molecules24030398
Giuliano, A., Freda, C., and Catizzone, E. (2020). Techno-economic assessment of bio-syngas production for methanol synthesis: A focus on the water–gas shift and carbon capture sections. Bioengineering 7, 70. doi:10.3390/bioengineering7030070
Godin, B., Agneessens, R., Gerin, P. A., and Delcarte, J. (2011). Composition of structural carbohydrates in biomass: Precision of a liquid chromatography method using a neutral detergent extraction and a charged aerosol detector. Talanta 85, 2014–2026. doi:10.1016/j.talanta.2011.07.044
Godin, B., Nagle, N., Sattler, S., Agneessens, R., Delcarte, J., and Wolfrum, E. (2016). Improved sugar yields from biomass sorghum feedstocks: Comparing low-lignin mutants and pretreatment chemistries. Biotechnol. Biofuels 9, 251. doi:10.1186/s13068-016-0667-y
González-Cabaleiro, R., Lema, J. M., Rodríguez, J., and Kleerebezem, R. (2013). Linking thermodynamics and kinetics to assess pathway reversibility in anaerobic bioprocesses. Energy Environ. Sci. 6, 3780. doi:10.1039/c3ee42754d
González-Tenorio, D., Muñoz-Páez, K. M., Buitrón, G., and Valdez-Vazquez, I. (2020). Fermentation of organic wastes and CO2 + H2 off-gas by microbiotas provides short-chain fatty acids and ethanol for n-caproate production. J. CO2 Util. 42, 101314. doi:10.1016/j.jcou.2020.101314
Grootscholten, T. I. M., Strik, D. P. B. T. B., Steinbusch, K. J. J., Buisman, C. J. N., and Hamelers, H. V. M. (2014). Two-stage medium chain fatty acid (MCFA) production from municipal solid waste and ethanol. Appl. Energy 116, 223–229. doi:10.1016/j.apenergy.2013.11.061
Holtzapple, M. T., and Granda, C. B. (2009). Carboxylate platform: The MixAlco process part 1: Comparison of three biomass conversion platforms. Appl. Biochem. Biotechnol. 156, 95–106. doi:10.1007/s12010-008-8466-y
Holtzapple, M. T., Wu, H., Weimer, P. J., Dalke, R., Granda, C. B., Mai, J., et al. (2021). Microbial communities for valorizing biomass using the carboxylate platform to produce volatile fatty acids: A review. Bioresour. Technol. 344, 126253. doi:10.1016/j.biortech.2021.126253
Lee, W. S., Chua, A. S. M., Yeoh, H. K., and Ngoh, G. C. (2014). A review of the production and applications of waste-derived volatile fatty acids. Chem. Eng. J. 235, 83–99. doi:10.1016/j.cej.2013.09.002
Liang, S., and Wan, C. (2015). Carboxylic acid production from brewer’s spent grain via mixed culture fermentation. Bioresour. Technol. 182, 179–183. doi:10.1016/j.biortech.2015.01.082
Liew, F., Martin, M. E., Tappel, R. C., Heijstra, B. D., Mihalcea, C., and Köpke, M. (2016). Gas fermentation—a flexible platform for commercial scale production of low-carbon-fuels and chemicals from waste and renewable feedstocks. Front. Microbiol. 7, 694. doi:10.3389/fmicb.2016.00694
Liu, B., Popp, D., Sträuber, H., Harms, H., and Kleinsteuber, S. (2020). Lactate-based microbial chain elongation for n-caproate and iso-butyrate production: Genomic and metabolic features of three novel clostridia isolates. In Review. doi:10.21203/rs.3.rs-50186/v1
Miranda, E. M., Severson, C., Reep, J. K., Hood, D., Hansen, S., Santisteban, L., et al. (2022). Continuous-mode acclimation and operation of lignocellulosic sulfate-reducing bioreactors for enhanced metal immobilization from acidic mining-influenced water. J. Hazard. Mater. 425, 128054. doi:10.1016/j.jhazmat.2021.128054
Mussatto, S. I. (2014). Brewer’s spent grain: A valuable feedstock for industrial applications: Brewer’s spent grain and its potential applications. J. Sci. Food Agric. 94, 1264–1275. doi:10.1002/jsfa.6486
Mussatto, S. I., Dragone, G., and Roberto, I. C. (2006). Brewers’ spent grain: Generation, characteristics and potential applications. J. Cereal Sci. 43, 1–14. doi:10.1016/j.jcs.2005.06.001
Nzeteu, C. O., Trego, A. C., Abram, F., and O’Flaherty, V. (2018). Reproducible, high-yielding, biological caproate production from food waste using a single-phase anaerobic reactor system. Biotechnol. Biofuels 11, 108. doi:10.1186/s13068-018-1101-4
Obileke, K., Onyeaka, H., Omoregbe, O., Makaka, G., Nwokolo, N., and Mukumba, P. (2022). Bioenergy from bio-waste: A bibliometric analysis of the trend in scientific research from 1998–2018. Biomass Conv. bioref. 12, 1077–1092. doi:10.1007/s13399-020-00832-9
Perimenis, A., Nicolay, T., Leclercq, M., and Gerin, P. A. (2018). Comparison of the acidogenic and methanogenic potential of agroindustrial residues. Waste Manage. 72, 178–185. doi:10.1016/j.wasman.2017.11.033
Rodríguez, J., Kleerebezem, R., Lema, J. M., and van Loosdrecht, M. C. M. (2006). Modeling product formation in anaerobic mixed culture fermentations. Biotechnol. Bioeng. 93, 592–606. doi:10.1002/bit.20765
Roghair, M., Hoogstad, T., Strik, D. P. B. T. B., Plugge, C. M., Timmers, P. H. A., Weusthuis, R. A., et al. (2018). Controlling ethanol use in chain elongation by CO2 loading rate. Environ. Sci. Technol. 52, 1496–1505. doi:10.1021/acs.est.7b04904
Spirito, C. M., Richter, H., Rabaey, K., Stams, A. J., and Angenent, L. T. (2014). Chain elongation in anaerobic reactor microbiomes to recover resources from waste. Curr. Opin. Biotechnol. 27, 115–122. doi:10.1016/j.copbio.2014.01.003
Stamatopoulou, P., Malkowski, J., Conrado, L., Brown, K., and Scarborough, M. (2020). Fermentation of organic residues to beneficial chemicals: A review of medium-chain fatty acid production. Processes 8, 1571. doi:10.3390/pr8121571
Steinbusch, K. J. J., Hamelers, H. V. M., and Buisman, C. J. N. (2008). Alcohol production through volatile fatty acids reduction with hydrogen as electron donor by mixed cultures. Water Res. 42, 4059–4066. doi:10.1016/j.watres.2008.05.032
Steinbusch, K. J. J., Hamelers, H. V. M., Plugge, C. M., and Buisman, C. J. N. (2011). Biological formation of caproate and caprylate from acetate: Fuel and chemical production from low grade biomass. Energy Environ. Sci. 4, 216–224. doi:10.1039/C0EE00282H
Weimer, P. J., and Kohn, R. A. (2016). Impacts of ruminal microorganisms on the production of fuels: How can we intercede from the outside? Appl. Microbiol. Biotechnol. 100, 3389–3398. doi:10.1007/s00253-016-7358-2
Yaoyang, X., and Boeing, W. J. (2013). Mapping biofuel field: A bibliometric evaluation of research output. Renew. Sustain. Energy Rev. 28, 82–91. doi:10.1016/j.rser.2013.07.027
Zeko-Pivač, A., Tišma, M., Žnidaršič-Plazl, P., Kulisic, B., Sakellaris, G., Hao, J., et al. (2022). The potential of brewer’s spent grain in the circular bioeconomy: State of the art and future perspectives. Front. Bioeng. Biotechnol. 10, 870744. doi:10.3389/fbioe.2022.870744
Zhang, F., Ding, J., Zhang, Y., Chen, M., Ding, Z.-W., van Loosdrecht, M. C. M., et al. (2013). Fatty acids production from hydrogen and carbon dioxide by mixed culture in the membrane biofilm reactor. Water Res. 47, 6122–6129. doi:10.1016/j.watres.2013.07.033
Keywords: complex organic feedstock, acidogenic fermentation, methane-arrested anaerobic digestion, medium-chain carboxylates, H2/CO2 conversion, Wood-Ljungdahl pathway, reverse β-oxidation
Citation: Henry GBL, Awedem Wobiwo F, Isenborghs A, Nicolay T, Godin B, Stenuit BA and Gerin PA (2023) A specific H2/CO2 consumption molar ratio of 3 as a signature for the chain elongation of carboxylates from brewer’s spent grain acidogenesis. Front. Bioeng. Biotechnol. 11:1165197. doi: 10.3389/fbioe.2023.1165197
Received: 13 February 2023; Accepted: 09 May 2023;
Published: 01 June 2023.
Edited by:
David Strik, Wageningen University and Research, NetherlandsReviewed by:
Flávio C. F. Baleeiro, Helmholtz Association of German Research Centres (HZ), GermanyAnca G. Delgado, Arizona State University, United States
Marika Kokko, Tampere University, Finland
Copyright © 2023 Henry, Awedem Wobiwo, Isenborghs, Nicolay, Godin, Stenuit and Gerin. This is an open-access article distributed under the terms of the Creative Commons Attribution License (CC BY). The use, distribution or reproduction in other forums is permitted, provided the original author(s) and the copyright owner(s) are credited and that the original publication in this journal is cited, in accordance with accepted academic practice. No use, distribution or reproduction is permitted which does not comply with these terms.
*Correspondence: Grégoire B. L. Henry, Z3JlZ29pcmUuaGVucnlAdWNsb3V2YWluLmJl; Patrick A. Gerin, cGF0cmljay5nZXJpbkB1Y2xvdXZhaW4uYmU=