 Ida Nikkilä
 Maria Waldén1
 Ndegwa H. Maina
 Maija Tenkanen
 Kirsi S. Mikkonen
- 1Department of Food and Nutrition, University of Helsinki, Helsinki, Finland
- 2Helsinki Institute of Sustainability Science (HELSUS), University of Helsinki, Helsinki, Finland
Industrial enzyme production yields vast amounts of cell biomass as by-product that is treated as waste, which brings costs and causes an environmental burden. Nonetheless with the current drive toward resource efficiency, conversion of the cell biomass into value-added products would provide an economically viable alternative for the industry. The biomass is composed of fungal cells, containing potentially valuable heteropolysaccharides and glycoproteins, but a technology is lacking to valorize them. For the first time, we characterized the composition of the biomass, extracted biopolymers by aqueous and alkaline treatments, and studied their behavior as novel hydrocolloids in multiphase systems. Alkaline extraction yielded a carbohydrate content of 37.5% and an amino acid content of 27.6%, whereas water extraction yielded 6.6 and 61.3%, respectively. Emulsions prepared with alkaline extracts were relatively stable during a 15-day storage period. We demonstrated that the costly waste management in enzyme production can be replaced by sustainable fractioning, and these fractions can be valorized.
Introduction
Awareness of global environmental challenges is driving societies toward bio-based economy in which renewable biomaterials are used to replace non-renewable resources, like fossil fuels (Yamakawa et al., 2018; Shogren et al., 2019). Moreover, biorefineries are being established to produce various types of such renewable materials (Dragone et al., 2020). In the biorefinery concept, value-added products, like ethanol, polymers, and bioactive compounds, are converted from biomass, with the help of biotechnology (Chandel et al., 2018; Yamakawa et al., 2018).
Enzymes play a key role in converting biomass into value-added products (Cho et al., 2020). Using enzymes as industrial catalysts allows greener processing conditions compared to chemical conversion. Therefore, enzymes are widely used across several industries, such as household care, food and feed, technical, chemical, and pharmaceutical industries (Adrio and Demain, 2014). The total market size for industrial enzymes reached USD 4.6 billion in 2016 and it is estimated to grow at a compound annual growth rate (CAGR) of 5.8% from 2017 and reach a value of USD 6.30 billion by 2022 (Markets and Markets, 2016). At the same time, increasing enzyme production yields large amounts of fungal cell biomass as by-product, which is currently being disposed of as waste. An average size enzyme production facility produces several thousands of tons of cell biomass per year.
The cell biomass is produced during the down-stream processing in which the produced enzymes are separated from the spent cultivation medium. Separation can be achieved through various methods, and, in some cases, filtering aids like diatomaceous earth are added (Hunt, 2013). During the down-stream processing, the leftover by-product is treated to inactivate the micro-organisms. This by-product consists of non-living and ruptured cells, the growth medium components, the remains of the produced enzymes, and possible filtering aids. Waste disposal is expensive and causes a burden on the environment. Nonetheless, this cell biomass can provide an interesting and industrially abundant resource of generation of value-added products. This type of non-living fungal biomass obtained from fermentation facilities was studied as a biosorbent for removal of heavy metals from wastewaters (Luef et al., 1991; Kapoor and Viraraghavan, 1995; Volesky, 2007) and also as a slow-release fertilizer (Das et al., 2002). However, the composition of cell biomass has not been thoroughly characterized and its full potential is far from being exploited.
Cell biomass is a potential source of heteropolysaccharides and glycoproteins originating from the fungal cell wall. Most fungal cell walls have a skeletal layer of alkali-insoluble β-1,3-glucan, β-1,6-glucan, and chitin (Erwig and Gow, 2016). The composition of the outer layer depends on the species and can consist of different O- and N-linked mannans, α- and β-glucans, mannoproteins, glycoproteins, and melanin. In the enzyme industry, one of the most common enzyme producers is filamentous fungi Trichoderma reesei, which has been largely used in cellulase production (Paloheimo et al., 2016). According to Perlińska-Lenart et al. (2006), the main carbohydrate residues in the T. reesei cell wall are glucose, galactose, mannose, N-asetylglucosamine, and N-acetylgalactosamine, at the approximate ratio of 22:11:8:2:1, respectively. Prieto et al. (1997) showed that T. reesei cell walls contain alkali-extractable polysaccharides with a complex structure of an α-(1→ 6)-linked mannopyranosyl backbone and branches composed of galactofuranosyl and glucopyranosyl units. However, the ratio between the carbohydrate residues depends on the fungal strain.
Our hypothesis was that enzyme industry by-product, fungal biomass, is composed of valuable polymers, such as cell-wall polysaccharides and proteins that could be used as bioemulsifiers. Bioemulsifiers are usually small amphiphilic molecules, like phospholipids, proteins and polysaccharides that can absorb to surfaces (McClements, 2016). The aim of this study was to understand the composition of industrially relevant cell biomass and extract potentially valuable components. First, we present the basic composition of industrial fungal biomass that has been, until now, unknown. Secondly, the biomass is fractioned via aqueous and alkaline extraction to understand the behavior and structure of its components. Finally, the extracted fractions are tested for the first time in hydrocolloid applications to understand their behavior in multiphase systems. The results provide valuable knowledge on this novel source of hydrocolloids and support the utilization of side-streams and the development of biobased economy.
Materials and Methods
Enzyme Industry by-Product
Heat-inactivated fungal biomass was kindly provided by Roal Oy, Rajamäki, Finland. Biomass was collected from industrial down-stream processing, during which diatomaceous earth was added as a filtering aid. Before analysis and extraction, except for moisture content analysis, the biomass was freeze-dried, and ground (20 000 rpm, M20 Universal mill, IKA®-Werke GmbH & Co. KG, Germany) to obtain fine powder.
Chemical Analysis of Biomass
All analyses were performed as triplicates if not stated otherwise. From the triplicates standard deviation was calculated.
Moisture Content
The moisture content was analyzed from the fresh biomass. Biomass samples (2 g) were dried at 105°C for 45 h and cooled down at room temperature in a desiccator for 1 h. The loss of weight was considered as moisture.
Ash
Biomass samples (2 g) were treated with the following temperature program: 0–550°C (2 h), 550°C (5 h), 550–0°C (slowly overnight). Strong nitric acid was added to the samples and then evaporated in a hotplate followed by another similar heat treatment. Cooled samples were kept in a desiccator for 30 min prior to weighting again.
Carbohydrate Analysis
Quantitative monosaccharide analysis was performed via gas chromatography (GC). Acid methanolysis (2 M HCl in methanol, 3 h, 100°C) was carried out to biomass samples (30 mg) as described by Sundberg et al. (1996), which was followed by silylation as described by Laine et al. (2002) with the modification of changing TMCS and BSTFA ratio to 1 : 99. Sorbitol was used as internal standard.
The samples were analyzed with HP 6890N GC with a flame ionization detector (FID) (Agilent Technologies, Waldbronn, Germany). The used column was a DB-1 (30 m, 0.25 mm i.d., 0.25 μm film thickness, Agilent Technologies). The oven temperature program was: 150°C (3 min)−2°C/min to 186°-1°C/min to 200°-20°C/min to 300°C (1 min). The detector temperature was 300°C; the injection volume was 1 μl; the syringe size was 10 μl; and the split ratio was adjusted to 20:1.
Quantification was performed by using two replicate standard curves with five points each. The total carbohydrate content was calculated by using correction factors (pentoses 0.88, hexoses 0.9, and uronic acids 0.91) that considered the condensation reaction. The total carbohydrate amount was calculated as the sum of the individual analyzed monosaccharides, that included arabinose, galactose, glucose, glucuronic acid, mannose, rhamnose, and xylose.
Fatty Acid Analysis
Fatty acid composition was analyzed as described by Lampi et al. (2015). Lipids were extracted from biomass samples (3 g) after acid hydrolysis (40 min, 75°C) with diethyl ether and petroleum ether according to AOAC method 996.06 (AOAC, 2001). Fatty acid methyl esters were identified using a GLC-63 standard mixture (Nu Chek Prep, Minnesota, USA) and quantified by using a 19:0 methyl ester as an internal standard. Total fatty acid amount was calculated as the sum of the major fatty acid methyl esters. The fatty acid methyl esters were determined with HP 6850 GC coupled with FID (Agilent Technologies, Waldbronn, Germany). The used column was an Omegawax 250 (30 m, 0.25 mm i.d., 0.25 μm film thickness, Supelco). The oven temperature program was: 180°-3°C/min to 220°-6°C/min to 250°C (12 min). The detector temperature was 260°C; the injection volume was 1 μl; the syringe size was 10 μl; and the split ratio was adjusted to 15:1.
Nitrogen
The nitrogen content was analyzed by Kjeldahl method. Kjeltabs (3.5 g K2SO4 and 0.5 g CuSO4) and strong sulphuric acid were added to biomass (300 mg). Digestion was performed in a pre-heated digestion block (Digestor 2020; Foss, Denmark) at 400°C for 75 min. The Kjeltec Analyser unit 2,300 (Foss) was used for titration.
Amino Acid Analysis
Biomass (150 mg) was hydrolyzed as described by Korhonen et al. (2002). D-Norvaline was used as the internal standard. After hydrolysis samples were centrifuged (15 000 g, 10 min), the supernatant was collected and neutralized, and derivatized with the Waters AccQ·Tag Ultra reagent (Milford, MA, USA) according the manufacturer's instructions. The samples were analyzed by the Waters Acquity UHPLC system coupled with a PDA detector (operating at a 260 nm wavelength) and a Waters AccQ·Tag Ultra C18 column (particle size 1.7 μl, 2.1 × 100 mm). The column temperature was 55°C, and the flow rate was 0.7 ml/min. Waters AccQ·Tag ultra eluent A (diluted 1:20) and AccQ·Tag ultra eluent B were used as eluents. The used gradient is described by Bao et al. (2018); however, small modifications were made to the starting and ending eluent ratios (changed from A 99.9%–B 0.1% to A 99.5%– B 0.5%). The amino acids were quantified by using the internal standard method with Waters standard amino acid mixture H and a five-point standard curve. Sixteen amino acids were analyzed and the total amino acid amount was calculated as the sum of these amino acids.
Extraction of Biomass
Biomass (1 g) was first treated with aqueous and alkaline extraction (Figure 1A). In the aqueous extraction, biomass was treated in water at 1:10 w/v for 3 h at 85°C, followed by centrifugation (Hermle Z323, 17 000 g, 10 min). The supernatant was collected, more water was added to the remaining biomass (1:10 w/v from original weight, RT), the sample was ultrasonicated for 30 min and centrifuged again, and the supernatant was collected. This step was repeated, and all three supernatants were pooled together to form sample WS1. In the alkaline extraction, 1 M NaOH was added (1:10 w/v) and the sample was ultrasonicated for 30 min and centrifuged, and the supernatant was collected. This step was repeated twice, and all three supernatants were pooled together to form fraction AS1. The remaining precipitates formed sample WP1 for the water extraction and AP1 for the alkaline extraction.
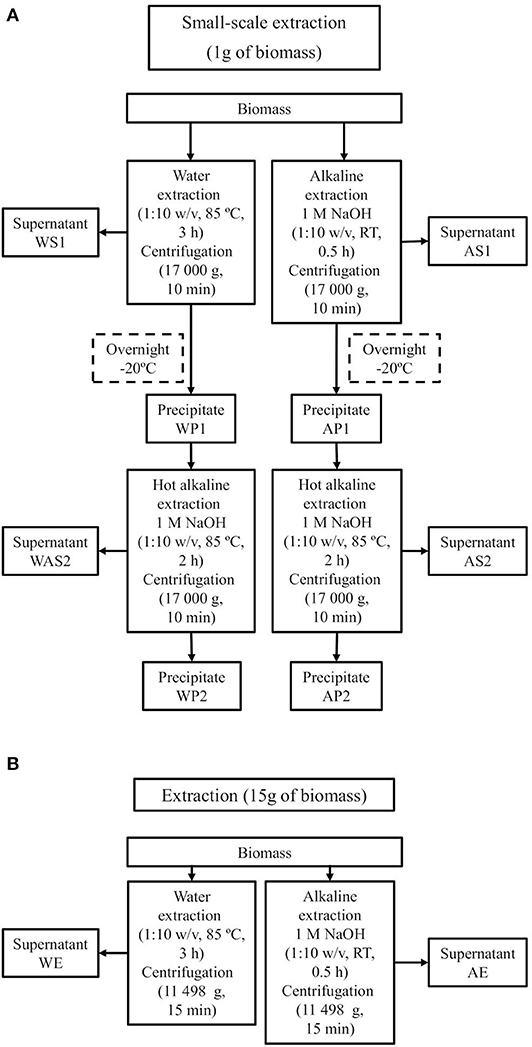
Figure 1. Extraction scheme of water and alkaline extraction of biomass in small-scale (A) and larger scale (B) and sample codes for each fraction.
A second extraction was performed for WP1 and AP1. The samples were frozen (−20°C, overnight) and then extracted with NaOH (1 M, 1:10 w/v from original weight, 85°C, 2 h), centrifuged, and the supernatant was collected. The remaining residue was treated with more NaOH (1 M, 1:10 w/v from original weight), after which the sample was mixed and centrifuged, and the supernatant was collected. This step was repeated, and all three supernatants were pooled together to form samples WAS2 (from WP1) and AS2 (from AP1). The remaining residues formed samples WP2 (from WP1) and AP2 (from AP1).
AS1, WAS2, and AS2 were neutralized to pH range of 6 to 8 with HCl, and dialyzed (Spectra/Por® 1, MWCO 6–8 kD) against tap water (24 h) and Milli-Q water (12 h) to remove the salt ions. For AP1, AP2, and WP2, the removal of the sodium ions was carried out by adding water and then removing it via centrifugation until the pH was neutral. All fractions were then frozen (first −20°C at least overnight, then −70°C at least overnight) and lyophilized. Dry extracts were then milled with mortar.
For material studies, larger amounts of WS1 and AS1 were extracted to obtain samples WE and AE (Figure 1B). For WE and AE, the extraction procedure was the same as that of WS1 and AS1, respectively, except the amount of starting material was 15 g and conditions for centrifugation were 11 498 g and 15 min (SuperSpeed Refrigerated Floor Centrifuge RC5C, SLA-1500 rotor, Sorvall Instruments, USA).
Analysis of Fractions
Recovery Yield
To evaluate the dry mass yield of the fractions obtained from the small-scale extraction, the ratio between the weight of the dry matter of each fraction after freeze-drying and the starting weight were calculated.
Chemical Composition
Nitrogen amount, amino acid composition, and carbohydrate composition were analyzed as described above. For the samples without diatomaceous earth (S1 and S2), nitrogen, amino acid analysis, and carbohydrate analysis were performed with sample size 150, 40, and 15 mg, respectively.
Extracts as Hydrocolloids
The functional properties of the extracted fractions as hydrocolloids were evaluated by preparing water suspensions and emulsions. The hydrocolloid characteristics were studied via optical microscopy, zeta potential analysis, droplet size distribution analysis, and by monitoring the colloidal stability.
Suspension Preparation
Water suspensions with three different concentrations of extracts were prepared for colloidal stability analysis. 0.5, 1, and 2% WE and AE (w/w) were suspended in Milli-Q water using a magnetic stirrer for overnight at room temperature.
Zeta Potential
To analyze the total charges of the particles in the WE and AE suspensions zeta potential was measured using ZetaSizer Nano ZS (Malvern Instruments, UK) at a 173° scattering angle. Zeta potential was measured from the fresh suspensions with three repeated measurements. 1% (w/v) suspensions were prepared using Milli-Q water and citrate carbonate buffer (pH 3.5 and 10). The suspensions were stirred overnight and diluted to 1:100 before the measurements.
Emulsion Preparation
WE and AE (1% w/w) were suspended in water using a magnetic stirrer overnight at room temperature. Rapeseed oil (Rapeseed oil, Apetit Oy, Finland) was added, and the mixture was homogenized with Ultra-Turrax (IKA WERKE, Germany) at 11 000 rpm for 5 min to obtain a coarse emulsion. For both the WE and AE fractions, emulsions with two oil contents (1 and 2%, w/w) were prepared. After primary homogenization, the emulsions were processed using a Microfluidizer 110Y high-pressure homogenizer (Microfluidics, Westwood, MA, USA) configured with 75 μm Y-type F20Y and 200 μm Z-type H30Z chambers at 800 bars for 50 s.
Colloidal Stability
The colloidal stability of the WE and AE water suspensions and emulsions were evaluated by the Turbiscan Stability Index (TSI), measured by Turbiscan Lab Expert analyzer (Formulaction, France) for 6 (water suspensions) or 14 days (emulsions) at 25°C. The water suspensions and emulsions were poured into 4 ml and 20 ml glass vials, respectively, instantly after preparation and scanned from bottom to the top by light a beam (near-infrared, λ = 880 nm). Detectors measure the intensity of transmitted (45°) and backscattered light (180°). The TSI is based on changes in both transmission and backscattering over time. An increase in TSI indicates ongoing changes like creaming, flocculation, and coalescence in the system. TSI was calculated using Turbisoft version 1.2 (Formulaction, France).
Optical Microscopy
An Axiolab optical microscope (Carl Zeiss, Germany) equipped with an Axiocam 305 camera was used to observe the WE and AE emulsions after preparation and 14 days of storage.
Droplet Size Distribution
Droplet size distribution was measured from the fresh emulsions and the 15-day-old emulsions to evaluate emulsion stability. The measurements were made with a laser light scattering instrument (Mastersizer Hydro 3000 SM, Malvern Instruments, Ltd., Worcestershire U.K.). The used refractive indices for the water and oil were 1.33 and 1.47, respectively.
Results and Discussion
Chemical Composition of Biomass
Chemical analysis of the fungal biomass was performed to determine the primary composition of this biomass. The moisture content of fresh biomass was 48.0%, which is approximately half of the moisture content reported by Das et al. (2002) (85.6%). The biomass studied by Das et al. (2002) was obtained as a by-product from the enzyme industry, however, the down-stream processing was different, including rotary drum filtering and lime stabilization, and no filtering aid was added, which may explain the higher moisture content.
Further analysis was performed for the dried and ground biomass, and all results are presented on weight-% (dry weight basis). The ash content of the dry biomass was high (62.5%) and can be explained by the added filtering aid, namely, diatomaceous earth. The total nitrogen content in the dry biomass was 3.1%. When calculated against the fresh biomass, the nitrogen content was around 1.6%, which is at a similar level as that reported by Das et al. (2002) (2.07%).
The total carbohydrate, amino acid, and fatty acid contents of the dry biomass were 6.4, 14.8, and 1.0%, respectively. The contents (w-%) of the monosaccharides (A), fatty acids (B), and amino acids (C) in the dry biomass are presented in Figure 2. The main analyzed carbohydrates in biomass were glucose (2.4 ± 0.1%) and mannose (1.5 ± 0.06%), which accounted for about 62% of the total carbohydrates, whereas arabinose (1.0 ± 0.01%), galactose (0.7 ± 0.03%), and xylose (0.7 ± 0.02%) accounted for about 38%. In addition, rhamnose was detected in minor quantities.
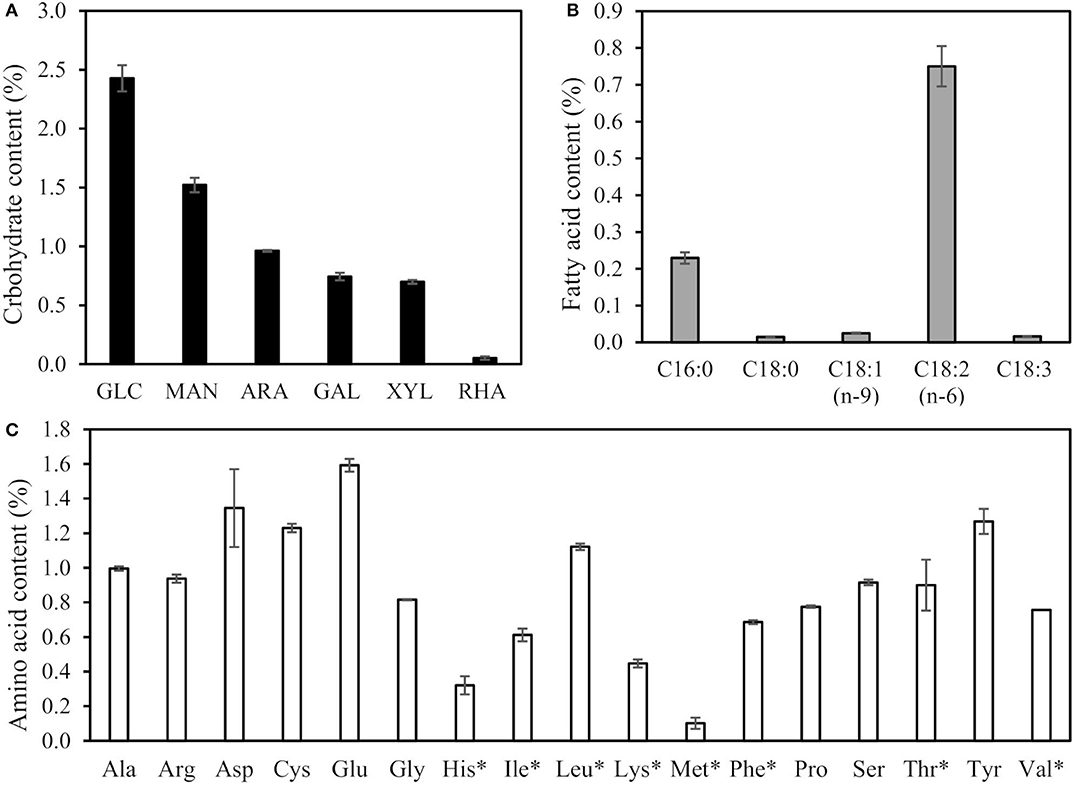
Figure 2. Carbohydrate (A), fatty acid (B), and amino acid composition (C) of dry biomass (%). The total carbohydrate, fatty acid, and amino acid contents of the dry biomass were 6.4, 1.0, and 14.8%, respectively. Essential amino acids indicated with*.
The amino acid profile of biomass (Figure 2C) showed that the most abundant amino acids were glutamic acid (1.6 ± 0.02%), aspartic acid (1.3 ± 0.02%), cysteine (1.2 ± 0.23%), tyrosine (1.3 ± 0.15%), and leucine (1.1 ± 0.04%), which accounted for around 37% of the total amino acids. In addition, 12 other amino acids were present. From a food and feed industrial point of view, the total amount of amino acids of the cell biomass (14.8%) was relatively high. Essential amino acids (indicated with * in Figure 2C) were present in levels that would satisfy the levels required for humans, except for lysine and methionine (FAO/WHO/UNU, 2007) and tryptophan (not analyzed).
The fatty acid composition (Figure 2B) was dominated by linoleic acid (0.8 ± 0.05%) and palmitic acid (0.2 ± 0.02%), which covered around 95% of all the fatty acids. The total amount of essential polyunsaturated fatty acids was 74%. For fungi, changes in the growing media may alter the ratio of fatty acids (Chen et al., 2001). Ruiz et al. (2007) studied the fatty acid composition of Trichoderma longibrachiatum in two different growing media, and linoleic acid and palmitic acid accounted 54 to 58% of the total fatty acids. It is noteworthy that the industrially relevant biomass of the present study was not composed of pure fungal cells, and some fatty acids may have originated from the growing medium. The total amount of fatty acids in biomass was relatively low. Thus, the fatty acid content was not analyzed from extracted fractions, which were expected to contain them only in minor quantities.
To utilize biomass carbohydrates in applications or to enrich the essential amino acids, their separation from the biomass is required, as described in the next section.
Extraction of Biomass
Recovery Yield of Extracted Fractions
The recovery yield was analyzed to obtain knowledge on the efficiency of the aqueous and alkaline extraction processes and the consecutive extraction steps. The recovery yield in the first extraction step for supernatants WS1 and AS1 was 18.2 and 8.8%, while, for precipitates WP1 and AP1, it was 82.7 and 72.2%, respectively. The recovery yield of the second extraction step supernatants WAS2 and AS2 were 17.1 and 11.7%, respectively, calculated from the weight of biomass. Furthermore, the recovery yield for the second precipitates WP2 and AP2 (calculated from the weight of biomass) were 60.8 and 53.8%, respectively.
The total recovery yield for the water extraction (as a sum of WS1 and WP1) was close to 100% as expected, but, for the alkaline extraction, the total recovery yield (as a sum of AS1 and AP1) was 81%. These processes differed in their removal of the salt ions, which was conducted only on alkaline-extracted fractions via dialysis (for AS1) and water flushing (for AP1). Most likely the loss of dry weight during alkaline extraction process is due to dialysis, where small molecules (such as free monosaccharides and oligosaccharides from growth medium, free amino acids etc.) and salts originating from the biomass were also removed. Thus, the recovery yield for alkaline extraction supernatant AS1 was lower than that of the water extracted WS1, and it is likely that AS1 mainly contained large polymers. The same applies to the second extraction step supernatants WAS2 and AS2, which were both extracted with hot alkaline. In addition, with consecutive extraction steps, including hot water and hot alkaline extraction (sum of WS1 and WAS2) and cold and hot alkaline extraction (sum of AS1 and AS2), the yields were 35.3 and 20.5% of dry weight, respectively. Alkaline extraction and dialysis is a common strategy used in laboratory scale when extracting and purifying polysaccharides (Gòmez-Miranda et al., 1990; Leal et al., 1992). However, in industrial scale processes, like in biorefineries, dialysis may not be a feasible method for removing small compounds. Another option is ultrafiltration, which has been used to treat extracted polysaccharides from mushrooms and can be used on industrial scales (Hong and Choi, 2007).
Chemical Composition of Extracted Fractions
In order to obtain a deeper understanding of the complex composition of biomass and the behavior of its components, biomass was fractioned via aqueous and alkaline extraction. Furthermore, consecutive extraction steps were used to obtain fractions with different compositions for possible use in different types of applications. When studying the content of the extracts, the highest amount of total carbohydrates and amino acids were obtained in the first extraction step of the small-scale supernatants WS1 and AS1, and larger scale supernatants WE and AE (Figure 3A). The ratio between the total carbohydrates and amino acids varied between the two different solvents used. Water-extracted WS1 and WE exhibited high total amino acid contents (56 and 61%, respectively) and low total carbohydrate contents (8.5 and 6.5%, respectively), whereas, alkaline-extracted fractions AS1 and AE exhibited more similar total amino acid and carbohydrate contents (33 and 25% for AS1, 28 and 38% for AE, respectively). In the second step of extraction, WAS2 had a higher total amount of amino acids and carbohydrates (18.8 and 26.2%, respectively) than AS2 (6.8 and 5.8%, respectively). Furthermore, all precipitates (WP1, WP2, AP1, and AP2) exhibited low total amino acid and carbohydrate contents. These fractions were expected to contain alkaline-insoluble polymers, like chitin, and the added filtering aid (i.e., diatomaceous earth).
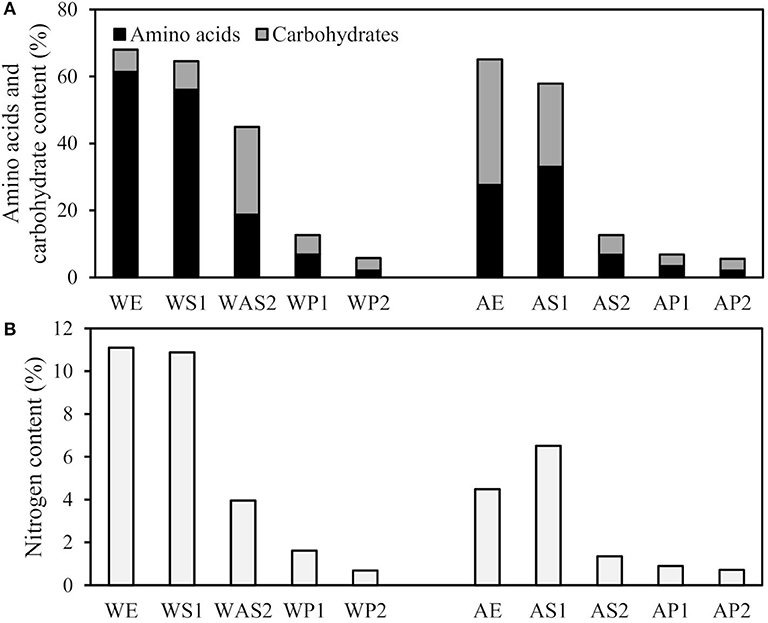
Figure 3. (A) Total carbohydrate and amino acid content (w-% from dry weight), and (B) nitrogen content (w-% from dry weight) of fractions extracted from biomass. Please refer to Figure 1 for the fraction codes.
The method for total carbohydrate analysis involves degrading oligo- and polysaccharides into monosaccharides, and therefore no knowledge of the initial size of the carbohydrate could be obtained. However, as discussed earlier (section Recovery Yield of Extracted Fractions), dialysis of alkaline extracts AS1, AE, AS2, and WAS2 before carbohydrate analysis removed small molecules including mono-, di-, and oligosaccharides. Therefore, AS1 and AE not only contained more carbohydrates than WS1 and WE, but they most likely originating from larger polymers. Furthermore, WS1 and WE are expected to contain polysaccharides with irregular molecular chains and branches, which tend to increase their solubility (Damodaran, 2017). In hot water extraction, where the pH is neutral, the release of the polymers is due to heat induced breakage of the structures and water solubility of the polymers (Jayawardena et al., 2017). Similar total carbohydrate contents of around 7% have been previously reported for hot water-extracted mushrooms and mycelium (Li et al., 2018; Abreu et al., 2019). With alkaline extraction, more heterogenic and linear polysaccharides may be extracted and were therefore expected to be present in AS1 and AE. Alkaline, with high pH, can break down intermolecular hydrogen bonds of polysaccharides more efficiently than water, resulting an increase in solubility of polysaccharides (Jayawardena et al., 2017). In addition, fungal polysaccharides can be divided to water soluble, alkaline soluble, and alkaline insoluble fractions. Previously, similar total carbohydrate contents from 18.7 to 38.7% in dry weight basis obtained from mild temperature alkaline extractions from the mycelium have been reported (Gòmez-Miranda et al., 1990; Leal et al., 1992). In the second extraction step, in which hot alkaline was used, WAS2 showed higher carbohydrate content than AS2, probably due to its higher carbohydrate content leftover from the first extraction step. Total carbohydrate amounts from 1 to 8% of the hot alkaline extraction of cold alkaline precipitates have been previously reported with mushrooms and mycelia (Gòmez-Miranda et al., 1990; Leal et al., 1992). In addition to carbohydrates originating from fungal cells, the industrial fungal biomass is a complex combination of different ingredients, and carbohydrates from growing media and produced enzymes are present. For instance, fungal enzymes are glycosylated, and cellulase from T. viride has been reported to contain mannose, galactose, glucose and glucosamine, which could be released from the protein structure (except glucosamine) via alkaline borohydride treatment (Gum and Brown, 1976).
In addition to total carbohydrate content, their composition was analyzed. When compared in terms of the composition of carbohydrates, AS1 exhibited a more versatile profile than WS1 (Figure 4A). WS1 was mainly composed of mannose (3.6%), glucose (3.0%), and galactose (1.2%) which accounted for 92% of the carbohydrates. This result is in line with the values reported by Abreu et al. (2019), Zhang et al. (2018), and Li et al. (2018), who studied polysaccharides extracted from different mushrooms and mycelia via hot water extraction. In addition, these water-extracted carbohydrates were branched β-glucans with a backbone composed of (1→ 3) or/and (1→ 6) linked β -D-Glcp units. In comparison, AS1 exhibited a carbohydrate profile in which all the monosaccharides were presented in almost similar amounts and was composed of mannose (6.1%), arabinose (5.8%), xylose (5.0%), galactose (4.4%), and glucose (3.6%). Similar profiles have been reported previously from alkaline-extracted fungi and the carbohydrates are originated from α- and β -(1, 6)-glucans and β -glucogalactans (Gòmez-Miranda et al., 1990; Leal et al., 1992). As a conclusion, more versatile carbohydrate profile can be achieved with high pH alkaline whereas water extraction results in more limited profile.
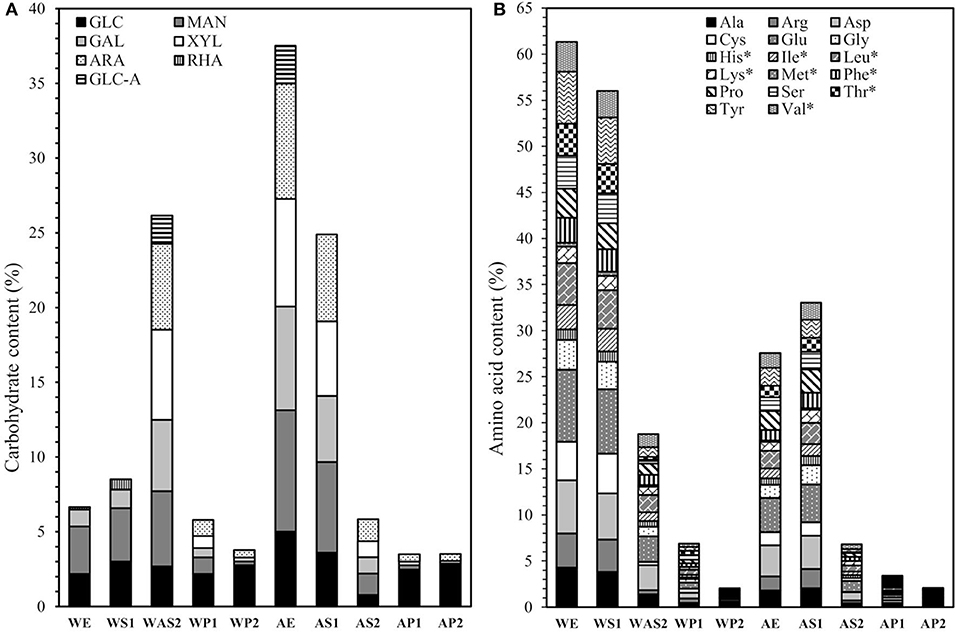
Figure 4. (A) Carbohydrate composition and (B) amino acid composition of fractions extracted from biomass. Please refer to Figure 1 for the fraction codes. Essential amino acids indicated with*.
The high total content of amino acids in WS1 and WE indicated that biomass contains mainly water-soluble proteins. However, the high temperatures used in enzyme industry facilities for inactivating biomass may have denaturated some of the proteins, which has an effect to their solubility. Also, heat-induced breakage of the amino acids may have occurred. Alkaline-extracted AS1 and AE showed lower total amounts of amino acid content. Commonly, alkaline is used to extract glutelins and other more hydrophobic proteins, and AE and AS1 could be expected to contain these type of structures (Damodaran, 2017).
Although the total amount of amino acids was higher in the water-extracted WS1 and WE than the alkaline-extracted AS1 and AE, the amino acid profiles of the extracts were relatively similar (Figure 4B). All first extraction supernatants (WS1, WE, AS1, and AE) contained essential amino acids, except lysine and methionine (low levels) and tryptophan (not analyzed), at levels that would satisfy human consumption requirements of essential amino acids (FAO/WHO/UNU, 2007). In addition, second extraction supernatant WAS2 had a relatively high total amino acid (18.8%) content and also contained the required amounts of essential amino acids, except for methionine (low levels) and tryptophan (not analyzed). AS2 showed a similar profile, but its total amino acid content was relatively low (6.8%).
Furthermore, the scale-up of the extraction affected the total yield of carbohydrates and amino acids. In comparison, WE and AE obtained from larger extraction exhibited higher yields of total carbohydrate and amino acid content than small-scale fraction WS1 and AS1. Different centrifugation forces were used between the small-scale and larger scale extractions (17 000 and 11 498 g, respectively), and it has been previously shown that centrifugal forces may alter the content and composition of carbohydrates (Valoppi et al., 2019).
The amount of nitrogen in the extracted fractions (Figure 3B) followed the same trend as the total amino acid content. The nitrogen content was highest in the first extraction supernatants and lowest in the precipitates.
The results indicate that, when comparing alkaline extracts AS1 and AE to aqueous extracts WS1 and WE, the total yield of carbohydrates was higher, and the composition of the carbohydrates was more versatile. The results also show that biomass can be fractioned with subsequent extractions, and the yielded extracts had different total carbohydrate-amino acid contents and versatile carbohydrate profiles, which may indicate different behaviors in dispersed systems.
Extracts in Multiphase Systems
Suspension Stability
The fractions were characterized as hydrocolloids to further understand their behavior and applicability in complex systems. The first step was to prepare aqueous suspensions from WE and AE at three different concentrations (0.5, 1, and 2% w/w). Through visual observation, the AE suspensions at all concentrations were more turbid than the WE suspensions, indicating that they were not completely water-soluble. All WE and AE suspensions were brownish colored, but this color was more intense in the AE suspensions. Furthermore, time-dependent colloidal stability was studied by monitoring changes in the system during 6-day storage and assessed via the Turbiscan Stability Index (TSI). Most of the changes could be seen in the backscattering and transmittance of the lower section of the vials (data not shown), indicating that the main phenomenon affecting the stability was sedimentation. For clarity, to observe the rapid changes, the TSI is presented for the first 48 h (Figure 5A). The complete diagram is presented in Supplementary Figure 1.
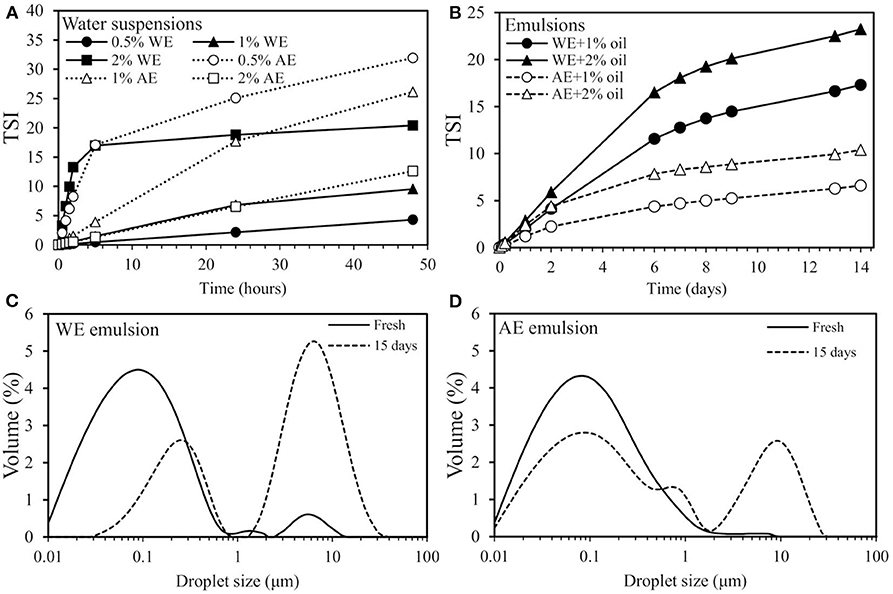
Figure 5. (A) Turbiscan stability index (TSI) of water suspensions prepared with 0.5, 1, and 2% (w/w) of water extract (WE) and alkaline extract (AE), (B) TSI of emulsions prepared with 1% (w/w) WE and AE and with 1 and 2% oil content, (C,D) Droplet size distributions of emulsions as fresh (–) and after 15 days of storage (- - -) prepared with 1% (w/w) WE or AE and 1% oil.
The results show that, with the increasing concentration of WE in the suspensions, more changes were observed, causing an increase in the TSI. For the 2% WE, the changes occurred very rapidly during the first 5 h, but the systems remained stable afterward. This type of a first rapid and then slower increase in the TSI has been observed previously for wood extracts and might indicate that sedimentation occurs in two phases: first via the forming of primary clusters by individual molecules and second via cluster-individual or cluster-cluster formation (Bhattarai et al., 2020). For the 1 and 0.5% WE suspensions, changes occurred more linearly over time. The 0.5% WE suspension with the smallest TSI values was found to be the most stable suspension of all the samples. The AE suspensions exhibited an opposite trend: when the concentration increased, the system became more stable and the TSI decreased. For the 0.5% AE, a similar initially rapid and then slower increase in TSI was observed, and, for the 1 and 2% AE, changes occurred more linearly over time. Overall, the WE suspensions were more stable than the AE suspensions, which may be explained by the different solubility of the extracted components. As WE was extracted with water, it included water-soluble polymers and possibly small molecules that remain more stable in water than the more hydrophobic components in AE. To summarize, components in WE were more stable in the aqueous environment than those in AE.
Next, to better understand the behavior of the extracts in colloidal dispersions, zeta potential was determined for three different pH values. Both AE and WE had, in all pH, negative zeta potential (Table 1). The zeta potential increased when the pH decreased. For the WE suspensions, the lowest value −18.7 mV was measured at pH 10, and the values for the lower pH were more than −10 mV. Equally, the AE suspensions showed the lowest −24.0 mV at pH 10. The AE suspensions had zeta potential lower than −20 mV at deionized water and pH 10, which may indicate their ability to generate moderately stable colloidal systems (Bhattacharjee, 2016). Overall, the AE suspensions showed lower zeta potential values for all pH values compared to the WE suspensions. The differences in suspension stability, analyzed by TSI, could not be explained by electrostatic repulsion, as the absolute zeta potential value of WE under neutral conditions was relatively low.
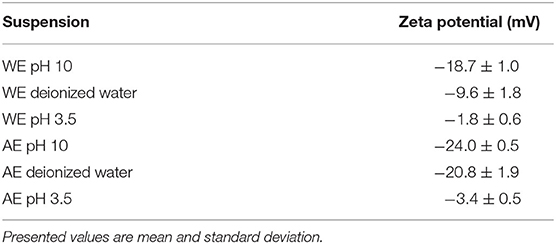
Table 1. Zeta potential of water extraction (WE) and alkaline extraction (AE) suspensions measured instantly after preparation.
Emulsion Stability
Fractions were used to prepare emulsions to better understand their behavior in dispersed multiphase systems with an oil-water interface. The emulsions were prepared with 1% (w/w) AE and WE with two different oil contents (1 and 2%). The stability of the emulsions was evaluated by monitoring TSI during storage (Figure 5B). TSI after one, six, nine, and 14 days for WE + 1% oil was 2.0, 11.6, 13.7, and 17.3, respectively, and, for WE + 2% oil, it was 2.9, 16.5, 20.1, and 23.2, respectively. As expected, emulsion stability decreased with increasing oil content. AE showed the same trend, and TSI after one, six, nine, and 14 days for AE + 1% oil was 1.2, 4.4, 5.2, and 6.6, respectively, and, for AE + 2% oil, it was 2.4, 7.8, 8.9, and 10.4, respectively. Comparing the stability of the emulsions prepared with the extracts, both AE emulsions showed higher stability than the WE emulsions. As shown in Figure 5A, the WE components were more stable in aqueous suspensions. Thus, they may tend to stay in the continuous phase of emulsion and not adsorb at the oil-water interface. The AE extracts were not that stable in water surroundings and tended to sediment (Figure 5A). It is possible that in emulsion they retrieved to oil-water interface. Also as discussed in Chapter 3.2.2 “Chemical composition of extracted fractions”, AE most likely contains alkali-soluble hydrophobic proteins that may adsorb at the oil phase or interface.
In addition to TSI, droplet size distribution was also determined for the AE and WE emulsions with 1% of oil. Measurements were performed for fresh emulsions and those after 15 days' storage. The results showed that both the WE and AE emulsions contained fine droplets. The fresh WE emulsion showed trimodal droplet distribution with a main peak at around 0.09 μm, a shoulder peak at around 1.3 μm, and a third smaller peak at around 5.2 μm (Figure 5C). During storage, the peak with the smallest droplet diameter decreased and shifted to around 0.2 μm. In addition, the peak with the highest droplet diameter grew strongly, and the droplet size distribution changed to bimodal. In comparison, the fresh AE emulsion showed a unimodal droplet distribution with small shoulder at around 0.07 μm. During storage, the main peak did not shift, but a minor decrease was observed while the shoulder grew slightly (Figure 5D). In addition, during storage, the droplet size distribution changed to bimodal and showed a second peak at around 8.7 μm. The growth of the peaks at higher droplet diameters indicated coalescence or flocculation of the oil droplets during storage. However, the phenomenon was more significant in the WE emulsion, and, in comparison, the AE emulsion was more stable. These results are in agreement with the TSI data (Figure 5B), which indicated the AE emulsions were more stable than the WE emulsions. The capability of the AE extract to stabilize emulsions better than the WE extract was probably due to their different carbohydrate content (Figure 4A) and different solubility properties (Figure 5A). The WE extract contained more water-soluble proteins and carbohydrates that could stay in the continuous phase in emulsions.
The stability of the emulsions was also studied by observing the microstructure of fresh and 14-day-old WE and AE emulsions via optical microscopy (Figure 6). Optical microscopy images confirmed the presence of mainly small droplets in both fresh WE and AE emulsions. However, in the fresh WE emulsions (Figures 6A,E), some larger oil droplets (diameter around 1 μm) could be detected, indicating that homogenization might have been incomplete. The droplets were probably responsible for the shoulder seen in the droplet size distribution peak at around 1.31 μm in the WE + 1% oil emulsion. During storage, droplets did not appear to grow, but large aggregates could be seen, especially in the WE + 2% oil emulsion after storage (Figure 6F). This could indicate that the increase observed in the droplet size distribution was probably due to flocculation of the oil droplets and/or aggregation of the extract particles. In comparison, larger oil droplets did not appear to be present in the fresh AE emulsions (Figures 6C,G). As observed with the WE emulsions, in the AE emulsions, the oil droplets did also not appear to grow; however, aggregates with fiber-like structures were observed.
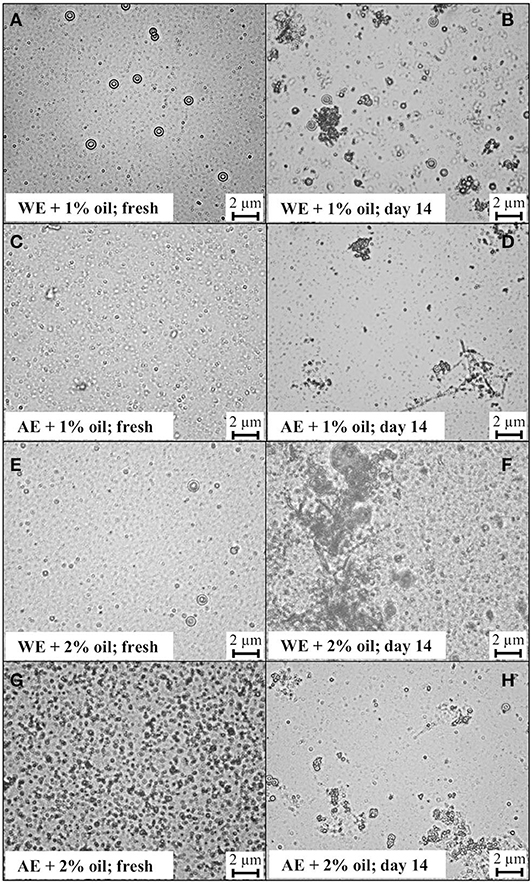
Figure 6. Optical microscopic images of emulsions with 1% water extract (WE) and 1% (A,B) or 2% (E,F) oil and emulsions with 1% alkaline extract (AE) and 1% (C,D) or 2% (G,H) oil. Images were taken from fresh emulsions (A, C, E, G) and after 14 days of storage (B, D, F, H) at RT. The scale bar is 2 μm and all presented images are at the same magnification.
Finally, it may be concluded that with WE and AE extracts, emulsions with small droplets were prepared. The AE emulsions showed higher stability than WE emulsions, as observed in terms of TSI and droplet size distribution. In addition, the increase observed in droplet size distribution and TSI after 15 and 14 days of storage, respectively, was probably due to particle aggregation, as can be seen in the images of the microstructure.
Conclusions
For the first time, this study introduced the novel concept of exploiting enzyme industry by-product as a sustainable source of hydrocolloids. Cell biomass was characterized in terms of total carbohydrate, amino acid, and fatty acid content. The results indicate that fungal biomass contains valuable fractions that could be extracted via water and alkaline extraction. The emulsion prepared from alkaline extract was relatively stable in terms of TSI and change in droplet size distribution. Furthermore, a sequential fractionation process can be designed to first extract amino acids with water and followed by carbohydrates with alkaline. In this work we demonstrate that expensive waste management in enzyme production can be replaced by sustainable fractioning and these fractions can be valorized.
Data Availability Statement
The raw data supporting the conclusions of this article will be made available by the authors, without undue reservation.
Author Contributions
KM planned and received funding for the project. IN mainly designed the experimental plan with the help of KM, MT, and NM. IN performed the chemical analyses of biomass and all extracts, performed the extractions in small scale, and collected and analyzed the data. MW performed the big scale extractions, prepared the emulsions and water suspensions, performed measurements of them, and collected the data. IN was responsible for writing the manuscript interpreting the data with the help of KM. KM and MT supervised the project. All authors read and commented on the manuscript.
Funding
The Academy of Finland is acknowledged for its financial support (project numbers: 311244 and 314244).
Conflict of Interest
The authors declare that the research was conducted in the absence of any commercial or financial relationships that could be construed as a potential conflict of interest.
Acknowledgments
We thank Dr. Anna-Maija Lampi for the fruitful discussions and assistance with the fatty acid analysis, Dr. Fabio Valoppi for the valuable discussions, Dr. Minnamari Edelmann for the assistance with amino acid analysis, and Miikka Olin for his kind technical assistances. We also thank Dr. Jari Vehmaanperä, Jarno Kallio, and Roal Oy for the biomass and fruitful discussions.
Supplementary Material
The Supplementary Material for this article can be found online at: https://www.frontiersin.org/articles/10.3389/fceng.2020.574072/full#supplementary-material
References
Abreu, H., Simas, F. F., Smiderle, F. R., Sovrani, V., Dallazen, J. L., Maria-Ferreira, D., et al. (2019). Gelling functional property, anti-inflammatory and antinociceptive bioactivities of β-D-glucan from the edible mushroom Pholiota nameko. Int. J. Biol. Macromol. 122, 1128–1135. doi: 10.1016/J.IJBIOMAC.2018.09.062
Adrio, J. L., and Demain, A. L. (2014). Microbial enzymes: tools for biotechnological processes. Biomolecules 4, 117–139. doi: 10.3390/biom4010117
AOAC (2001). “AOAC official method 996.06, fat (total, saturated, and unsaturated) in foods,” in Official Methods of Analysis of AOAC International, 17th ed. (Arlington, VA), 20–24.
Bao, Y., Boeren, S., and Ertbjerg, P. (2018). Myofibrillar protein oxidation affects filament charges, aggregation and water-holding. Meat. Sci. 135, 102–108. doi: 10.1016/j.meatsci.2017.09.011
Bhattacharjee, S. (2016). DLS and zeta potential – what they are and what they are not? J. Control. Release 235, 337–351. doi: 10.1016/j.jconrel.2016.06.017
Bhattarai, M., Valoppi, F., Hirvonen, S. P., Hietala, S., Kilpeläinen, P., Aseyev, V., et al. (2020). Time-dependent self-association of spruce galactoglucomannans depends on pH and mechanical shearing. Food Hydrocoll. 102:105607. doi: 10.1016/j.foodhyd.2019.105607
Chandel, A. K., Garlapati, V. K., Singh, A. K., Antunes, F. A. F., and da Silva, S. S. (2018). The path forward for lignocellulose biorefineries: bottlenecks, solutions, and perspective on commercialization. Bioresour. Technol. 264, 370–381. doi: 10.1016/j.biortech.2018.06.004
Chen, J., Ferris, H., Scow, K. M., and Graham, K. J. (2001). Fatty acid composition and dynamics of selected fungal-feeding nematodes and fungi. Comp. Biochem. Physiol. B Biochem. Mol. Biol. 130, 135–144. doi: 10.1016/S1096-4959(01)00414-6
Cho, E. J., Trinh, L. T. P., Song, Y., Lee, Y. G., and Bae, H. J. (2020). Bioconversion of biomass waste into high value chemicals. Bioresour. Technol. 298:122386. doi: 10.1016/J.BIORTECH.2019.122386
Das, K. C., Minkara, M. Y., and Melear, N. D. (2002). Composting process for the stabilization of an industrial fermentation biomass byproduct. Trans. Am. Soc. Agric. Eng. 45, 1703–1708. doi: 10.13031/2013.11033
Dragone, G., Kerssemakers, A. A. J., Driessen, J. L. S. P., Yamakawa, C. K., Brumano, L. P., and Mussatto, S. I. (2020). Innovation and strategic orientations for the development of advanced biorefineries. Bioresour. Technol. 302:122847. doi: 10.1016/j.biortech.2020.122847
Erwig, L. P., and Gow, N. A. R. (2016). Interactions of fungal pathogens with phagocytes. Nat. Rev. Microbiol. 14, 163–176. doi: 10.1038/nrmicro.2015.21
FAO/WHO/UNU (2007). Protein and Amino Acid Requirements in Human Nutrition: Report of a Joint FAO/WHO/UNU Expert Consultation. Geneva: Food and Agriculture Organization of the United Nations; World Health Organization & United Nations University.
Gòmez-Miranda, B., Prieto, A., and Leal, J. A. (1990). Chemical composition and characterization of a galactomannoglucan from gliocladium viride wall material. FEMS Microbiol. Lett. 70, 331–335. doi: 10.1111/j.1574-6968.1990.tb13999.x
Gum, E. K., and Brown, R. D. (1976). Structural characterization of a glycoprotein cellulase, 1,4-β-d-glucan cellobiohydrolase C from trichoderma viride. Biochim. Biophys. Acta Protein Struct. 446, 371–386. doi: 10.1016/0005-2795(76)90004-0
Hong, J. H., and Choi, Y. H. (2007). Physico-chemical properties of protein-bound polysaccharide from Agaricus blazei murill prepared by ultrafiltration and spray drying process. Int. J. Food Sci. Technol. 42, 1–8. doi: 10.1111/j.1365-2621.2005.01116.x
Hunt, T. (2013). “Filter aids,” in Downstream Industrial Biotechnology: Recovery and Purification, ed. J. Flickinger (Hoboken, NJ: Wiley and Sons), 107–114.
Jayawardena, B., Pandithavidana, D. R., and Sameera, W. M. C. (2017). “Polysaccharides in solution: experimental and computational studies,” in Solubility of Polysaccharides, ed Z. Xu (London: InTech), 683–789.
Kapoor, A., and Viraraghavan, T. (1995). Fungal biosorption - an alternative treatment option for heavy metal bearing wastewaters: a review. Bioresour. Technol. 53, 195–206. doi: 10.1016/0960-8524(95)00072-M
Korhonen, M., Ahvenjärvi, S., Vanhatalo, A., and Huhtanen, P. (2002). Supplementing barley or rapeseed meal to dairy cows fed grass-red clover silage: II. Amino acid profile of microbial fractions. J. Anim. Sci. 80, 2188–2196. doi: 10.1093/ansci/80.8.2188
Laine, C., Tamminen, T., Vikkula, A., and Vuorinen, T. (2002). Methylation analysis as a tool for structural analysis of wood polysaccharides. Holzforschung 56, 607–614. doi: 10.1515/HF.2002.093
Lampi, A. M., Damerau, A., Li, J., Moisio, T., Partanen, R., Forssell, P., et al. (2015). Changes in lipids and volatile compounds of oat flours and extrudates during processing and storage. J. Cereal Sci. 62, 102–109. doi: 10.1016/j.jcs.2014.12.011
Leal, J. A., Guerrero, C., Gómez-Miranda, B., Prieto, A., and Bernabé, M. (1992). Chemical and structural similarities in wall polysaccharides of some Penicillium, eupenicillium and aspergillus species. FEMS Microbiol. Lett. 90, 165–168. doi: 10.1111/j.1574-6968.1992.tb05145.x
Li, Q., Zhang, F., Chen, G., Chen, Y., Zhang, W., Mao, G., et al. (2018). Purification, characterization and immunomodulatory activity of a novel polysaccharide from Grifola frondosa. Int. J. Biol. Macromol. 111, 1293–1303. doi: 10.1016/j.ijbiomac.2018.01.090
Luef, E., Prey, T., and Kubicek, C. P. (1991). Biosorption of zinc by fungal mycelial wastes. Appl. Microbiol. Biotechnol. 34, 688–692. doi: 10.1007/BF00167924
Markets Markets (2016). Industrial Enzymes Market by Type (Amylases, Cellulases, Proteases, Lipases, and Phytases), Application (Food & Beverages, Cleaning Agents, and Animal Feed), Source (Microorganism, Plant, and Animal), and Region – Global Forecast to 2022. Available online at: https://www.marketsandmarkets.com/Market-Reports/industrial-enzymes-market-237327836.html (accessed April 21, 2020).
McClements, D. J. (2016). Food Emulsions : Principles, Practices, and Techniques, 3rd Edn. Boca Raton, FL: CRC Series in Contemporary Food Science; CRC Press.
Paloheimo, M., Haarmann, T., Mäkinen, S., and Vehmaanperä, J. (2016). “Production of industrial enzymes in trichoderma reesei,” in Gene Expression Systems in Fungi: Advancements and Applications. Fungal Biology, eds. M. Schmoll and C. Dattenböck (Cham: Springer) 23–57. doi: 10.1007/978-3-319-27951-0_2
Perlińska-Lenart, U., Orłowski, J., Laudy, A. E., Zdebska, E., Palamarczyk, G., and Kruszewska, J. S. (2006). Glycoprotein hypersecretion alters the cell wall in Trichoderma reesei strains expressing the saccharomyces cerevisiae dolichylphosphate mannose synthase gene. Appl. Environ. Microbiol. 72, 7778–7784. doi: 10.1128/AEM.02375-06
Prieto, A., Leal, J. A., Poveda, A., Jiménez-Barbero, J., Gómez-Miranda, B., Domenech, J., et al. (1997). Structure of complex cell wall polysaccharides isolated from trichoderma and hypocrea species. Carbohydr. Res. 304, 281–291. doi: 10.1016/S0008-6215(97)00239-5
Ruiz, N., Dubois, N., Wielgosz-Collin, G., du Pont, T. R., Bergé, J. P., Pouchus, Y. F., et al. (2007). Lipid content and fatty acid composition of a marine-derived trichoderma longibrachiatum strain cultured by agar surface and submerged fermentations. Process Biochem. 42, 676–680. doi: 10.1016/j.procbio.2006.09.017
Shogren, R., Wood, D., Orts, W., and Glenn, G. (2019). Plant-based materials and transitioning to a circular economy. Sustain. Prod. Consum. 19, 194–215. doi: 10.1016/j.spc.2019.04.007
Sundberg, A., Sundberg, K., Lillandt, C., and Holmbom, B. (1996). Determination of hemicelluloses and pectins in wood and pulp fibres by acid methanolysis and gas chromatography. Nord. Pulp Pap. Res. J. 11, 216–219.
Valoppi, F., Lahtinen, M. H., Bhattarai, M., Kirjoranta, S. J., Juntti, V. K., Peltonen, L. J., et al. (2019). Centrifugal fractionation of softwood extracts improves the biorefinery workflow and yields functional emulsifiers. Green Chem. 21, 4691–4705. doi: 10.1039/C9GC02007A
Yamakawa, C. K., Qin, F., and Mussatto, S. I. (2018). Advances and opportunities in biomass conversion technologies and biorefineries for the development of a bio-based economy. Biomass Bioenergy 119, 54–60. doi: 10.1016/j.biombioe.2018.09.007
Keywords: emulsion stability, hydrocolloids, value-added products, By-product, enzyme industry, fungal biomass
Citation: Nikkilä I, Waldén M, Maina NH, Tenkanen M and Mikkonen KS (2020) Fungal Cell Biomass From Enzyme Industry as a Sustainable Source of Hydrocolloids. Front. Chem. Eng. 2:574072. doi: 10.3389/fceng.2020.574072
Received: 18 June 2020; Accepted: 24 August 2020;
Published: 25 September 2020.
Edited by:
Qineng Xia, Jiaxing University, ChinaCopyright © 2020 Nikkilä, Waldén, Maina, Tenkanen and Mikkonen. This is an open-access article distributed under the terms of the Creative Commons Attribution License (CC BY). The use, distribution or reproduction in other forums is permitted, provided the original author(s) and the copyright owner(s) are credited and that the original publication in this journal is cited, in accordance with accepted academic practice. No use, distribution or reproduction is permitted which does not comply with these terms.
*Correspondence: Ida Nikkilä, aWRhLm5pa2tpbGFAaGVsc2lua2kuZmk=