 Athanasios I. Papadopoulos
 Alexios-Spyridon Kyriakides
 Panos Seferlis
 Ibrahim Hassan
- 1Chemical Process and Energy Resources Institute (CPERI), Centre for Research and Technology Hellas (CERTH), Thessaloniki, Greece
- 2Department of Mechanical Engineering, Aristotle University of Thessaloniki, Thessaloniki, Greece
- 3Mechanical Engineering Department, Texas A&M University at Qatar, Doha, Qatar
This work presents a CAMD (computer-aided molecular design) approach for the design of working fluid mixtures used in ABR (absorption refrigeration) cycles. Compared to previous works, the proposed approach introduces two major improvements. It employs for the first time an ABR process model in the course of CAMD, hence enabling the evaluation of the generated mixtures considering process performance indicators. It enables for the first time the simultaneous generation and evaluation of molecular structures for both refrigerants and absorbents. The employed model and CAMD optimization problem formulation incorporates major ABR operational driving forces pertaining to efficient refrigeration, sufficient solubility of mixture components and ease of separation in the generator. The approach employs a multicriteria assessment methodology both during CAMD and for the evaluation of selected mixtures using a more rigorous ABR model at a second stage. The work identifies novel mixtures, with Acetaldehyde/2-Methoxyethyl acetate and Acetaldehyde/Methanediol exhibiting the highest performance. The latter exhibits 3% higher COP (coefficient of performance) and cooling output than the reference mixture NH3/H2O, whereas it operates at 87 and 89% lower high and low cycle pressures. The novel mixtures are also compared with novel mixtures previously identified through a heuristic approach by the authors. The latter mixtures indicate overall higher ABR performance but similar or worse performance in safety, health and environmental impact indices. Further performance improvements may be achieved by including into CAMD additional chemical groups to be able to simulate the complex absorbent structures available in published works.
Introduction
Absorption refrigeration (ABR) is an important technology for the transformation of heat into cooling (Best and Rivera, 2015). A feature that makes it appealing is that it is able to exploit heat sources within a wide temperature range, from low-grade, renewable (Shirazi et al., 2018), and waste heat (Kale et al., 2018) to cleaner hydrocarbon fuels, such as natural gas (Azhar and Siddiqui, 2019). The operation of ABR is relatively simple as it is based on the use of a binary working fluid which undergoes various phase changes to produce cooling in common and simple heat exchangers. Compared to conventional, energy intensive vapor compression systems, ABR requires an insignificant amount of energy to pump a liquid phase.
The working fluid mixture used in ABR affects significantly the cycle efficiency. Published research efforts document working fluids that include inorganics (Sun et al., 2012), ionic liquids (Khamooshi et al., 2013), and organics (Papadopoulos et al., 2019). The most widely considered inorganic options include H2O/LiBr and NH3/H2O, which are the only fluids that are used in commercial-level applications (Papadopoulos et al., 2019). The negligible vapor pressure of LiBr makes it a very good absorbent and simplifies the operation of the ABR as the separation of the mixture during heat addition is easy. However, salt mixtures exhibit crystallization issues if the ABR operation exceeds specific concentration limits, whereas the use of H2O as a refrigerant prohibits generation of cooling below 0°C (Ghafoor and Munir, 2015). The latter may be overcome using NH3 as a refrigerant, however it generally exhibits toxicity issues and requires efficient separation from water during heat addition (Papadopoulos et al., 2019). Ionic liquids represent a promising type of fluids as absorbents due to their negligible vapor pressure (Khamooshi et al., 2013). However, only very few such fluids have been investigated in the past (Khamooshi et al., 2013), while they generally exhibit high viscosity and are much more expensive than other options (Papadopoulos et al., 2019). Organics have received attention in published literature as alternatives to the two commercial options (recent review in (Papadopoulos et al., 2019)). They have the potential to overcome the disadvantages of inorganics and ionic liquids and to exhibit higher performance in terms of ABR costs, health, safety and environmental impacts. They have not been considered in commercial implementations because only very few options have been investigated as refrigerants or absorbents (Papadopoulos et al., 2019). The consideration of few organic fluid mixtures in ABR literature is due to the predominant use of trial-and-error approaches in their selection. Building on know-how that is drawn mainly from conventional refrigeration systems, the majority of available works consider few cases of refrigerants and absorbents which are investigated repeatedly. Although useful, this approach can only result in limited performance improvements.
To address these challenges, the works of Tora (Tora, 2013) and Louaer et al. (Louaer et al., 2007) are the only ones that consider systematic approaches for the identification of efficient refrigerants and/or absorbents. Tora (Tora, 2013) proposes a CAMD (computer-aided molecular design) approach (Papadopoulos et al., 2018) for the identification of working fluids, implemented through the ICAS software (ICAS, 2019). CAMD approaches enable the generation of molecular structures using functional groups as building blocks, hence they are efficient in proposing molecules that may have not been considered before for a particular application. CAMD is based on the systematic combination of functional groups to synthesize molecular structures whose properties are evaluated using group contribution models (Austin et al., 2016a; Papadopoulos et al., 2018). The molecular, mixture or process properties are used as design targets so that the employed synthesis algorithm can identify the structure(s) which meet these targets. In the work of Tora (Tora, 2013) this is done in a step-wise procedure. The refrigerants are first identified using pure component properties as performance criteria, separately from the absorbents. Absorbents are then identified considering only their solubility in the previously identified refrigerants. Few refrigerant-absorbent mixtures are formed and then tested in ABR process simulations to identify their COP (Papadopoulos et al., 2019). This approach employs molecular and mixture properties as performance criteria for the identification of molecular options that meet specific performance limits which need to be overcome. The properties associate molecular level information with operating requirements of the ABR process. While this is useful, the lack of an ABR model in the course of CAMD prohibits the evaluation of the mixtures at the temperature and pressure conditions imposed by the interactions of the mixture components and the ABR equipment. The separate, initial evaluation of refrigerants and absorbents may prematurely exclude options which could potentially lead to high ABR performance. Furthermore, different mixtures may operate in an optimum way in terms of COP or other ABR performance indicators for different values of important design parameters. For example, the optimum number of separation stages or flowrates of absorbent and refrigerant may be different for each mixture. The work of Tora (Tora, 2013) is promising, but optimization of ABR parameters is further needed in order to enable the designed mixtures to overcome the performance of conventional working fluids such as H2O/LiBr or NH3/H2O.
Louaer et al. (Louaer et al., 2007) investigate and identify novel and existing refrigerants which are combined with known absorbents in single-effect absorption cooling systems. The refrigerants result as combinations of functional groups, including carbon atoms with one to four free bonds and fluorine. The authors consider combinations with up to two intermediate groups which end in either fluorine or methyl groups. Using pure component properties as criteria the authors propose 10 structures which are combined with pre-specified absorbents into 40 mixtures. The latter are evaluated in single-effect ABR simulations in terms of COP and circulation ratio. Similarly to Tora (Tora, 2013), the approach of Louaer et al. (Louaer et al., 2007) exploits group-contribution models for property predictions, which allow the generation of molecular structures (Papadopoulos et al., 2018). In this case the evaluation of the refrigerant structures is exhaustive, as all the structures that may be attained as combinations of the available functional groups are generated and evaluated. However, this is done within a narrow range of groups and chemical families (i.e., small hydrofluorocarbons), hence limiting the number of molecules that may be evaluated. The authors only design refrigerants and not absorbents as in Tora (Tora, 2013). Finally, the ABR process is not optimized.
Clearly, there is a lot of scope for the simultaneous design of the mixture components as both Tora (Tora, 2013) and Louaer et al. (Louaer et al., 2007) address the design or selection of each component at separate stages. The identification of a suitable mixture with desired behavior in the process where it is utilized (i.e., the mixture design and selection problem) is much more challenging than the design and selection of a pure compound. According to Papadopoulos et al. (Papadopoulos et al., 2018) the mixture design and selection problem requires the determination of 1) the number of components in the mixture, 2) the molecular structure of each component and 3) the concentration of each component in the mixture. Considering that there is practically a vast number of chemicals which could be candidates for any application, it becomes clear that the problem’s combinatorial complexity is very challenging. CAMD is a technology previously implemented in various applications to address such challenges (Achenie et al., 2003). In this context, several works proposed methods for mixture design and selection. Ng et al. (Ng et al., 2015b), Papadopoulos et al. (Papadopoulos et al., 2018), Austin et al. (Austin et al., 2016a), and Zhang et al. (Zhang et al., 2018; Zhang et al., 2020) published comprehensive reviews of such approaches. Few works address the design of two mixture components through CAMD (Buxton et al., 1999; Papadopoulos et al., 2013; Austin et al., 2016b; Austin et al., 2017), with even fewer works addressing the complete mixture design problem discussed previously (Jonuzaj et al., 2016; Jonuzaj and Adjiman, 2017; Jonuzaj et al., 2018). At the same time, several important approaches that also account for process models as part of mixture design also exist (Buxton et al., 1999; Van Dyk and Nieuwoudt, 2000; Sinha et al., 2003; Papadopoulos et al., 2013; Ng et al., 2015a; Cignitti et al., 2018; Liu et al., 2019). Such features indicate that available CAMD technologies are quite advanced compared to the promising approaches of Tora (Tora, 2013) and Louaer et al. (Louaer et al., 2007), hence considerable improvements may be expected.
In this work, we propose the use of an approach for the design of binary working fluid mixtures considering a model that performs ABR process calculations in the course of CAMD. Unlike Tora (Tora, 2013), our work enables the simultaneous evaluation of both refrigerant and absorbent structures based on ABR process performance indicators during CAMD. In this respect, it is possible to directly synthesize and obtain both refrigerants and absorbents. Unlike Louaer et al. (Louaer et al., 2007), the approach does not require exhaustive evaluation of the attainable functional group combinations. Instead, the synthesis of molecular structures from functional groups is guided by an optimization algorithm (Papadopoulos et al., 2013). This allows the evaluation of only a small fraction of the molecular structures that can be attained from the available functional groups, for the identification of a rich set of mixtures that exhibit optimum performance (Samudra and Sahinidis, 2013). Finally, for the set of the designed mixtures, we implement ABR process optimization over a wide set of important ABR design parameters, prior to selecting the optimum working fluid mixture and ABR process characteristics. Selected mixtures are further evaluated in terms of several safety, health and environmental impact indicators.
Methods and Models
Computer-Aided Molecular and Process Design of Mixtures
In this work, we adopt and further adapt the approach of Papadopoulos et al. (Papadopoulos et al., 2013) for mixture design. The latter includes two stages for the determination of the chemical structures of both components in binary mixtures. Stage 1 is called mixture screening and the corresponding CAMD algorithm is shown in Figure 1. The aim of Stage 1 is to determine optimum molecular structures for the first component of the mixture. This is approached by searching for chemically feasible molecular structures only for one of the two components. The mixture behavior of the remaining component is emulated within a much wider structural design space by removing the chemical feasibility constraints. This serves to evaluate the performance of the first component within a broad range of potential concentrations and interactions with the second component, prior to resulting in an inclusive set of molecular structures and properties for the two components. The identification of multiple optimum mixture candidates is accomplished through a multi-objective formulation of the CAMD optimization problem. Multiple performance measures are treated simultaneously and a comprehensive Pareto front is obtained that reveals useful structural and property trade-offs among the mixture components. In Stage 2, called the mixture design problem, each one of the feasible components designed in Stage 1 are used as a fixed option in a CAMD problem that identifies a feasible structure for the second component and re-evaluates the mixture concentration.
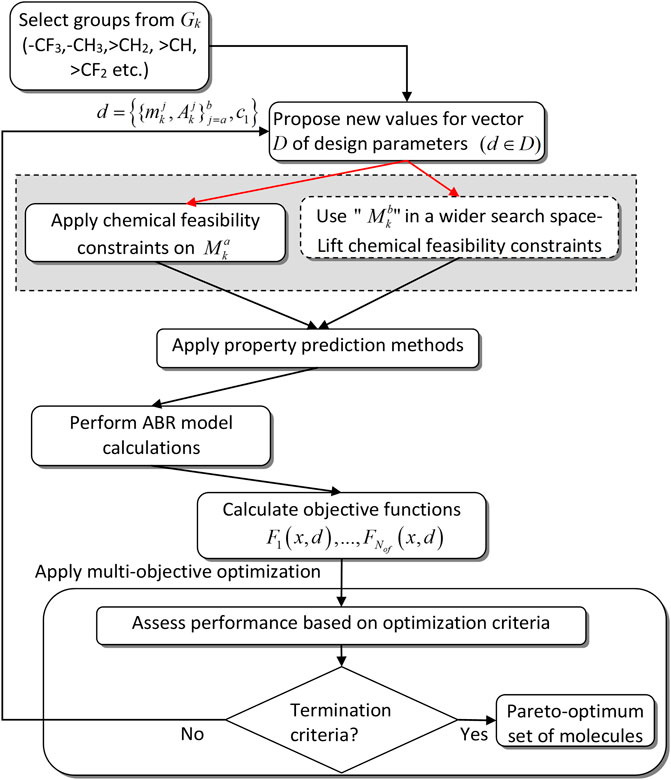
FIGURE 1. Conceptual flowdiagram of CAMD mixture design approach of Papadopoulos et al. Adapted with permission from Papadopoulos et al. (2013). Copyright 2013 American Chemical Society.
To better explain the approach used in Stage 1, assume a set of functional groups Gk which will be used as building blocks to synthesize molecular structures for both components, where k represents the number of functional groups that are selected in each iteration of the algorithm in Figure 1. Further assume that the first component of the mixture is
In the current work, either of
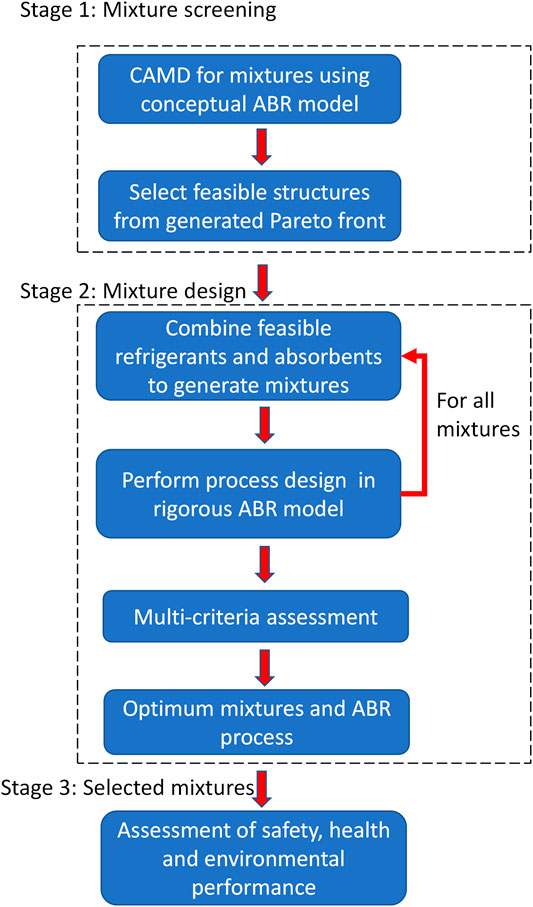
FIGURE 2. Stages of approach proposed in this work.
ABR Models
This work employs two single effect ABR models of different fidelity in the two stages. A conceptual ABR model with certain simplifications in unit operations is used in Stage 1, whereas Stage 2 employs a complete, rigorous ABR model. Figure 3A illustrates the basic features of the conceptual ABR model used in Stage 1. Table 1 illustrates the states and compositions of the models used in Stage 1 and Stage 2.
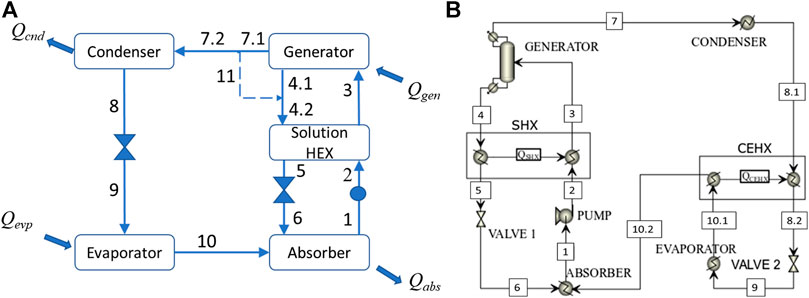
FIGURE 3. (A) The conceptual ABR model used in the course of CAMD in Stage 1, (B) the complete ABR model used in Stage 2. The dashed line representing stream 11 is used to explain the calculations made in the model of case (A) and is not a real process stream.
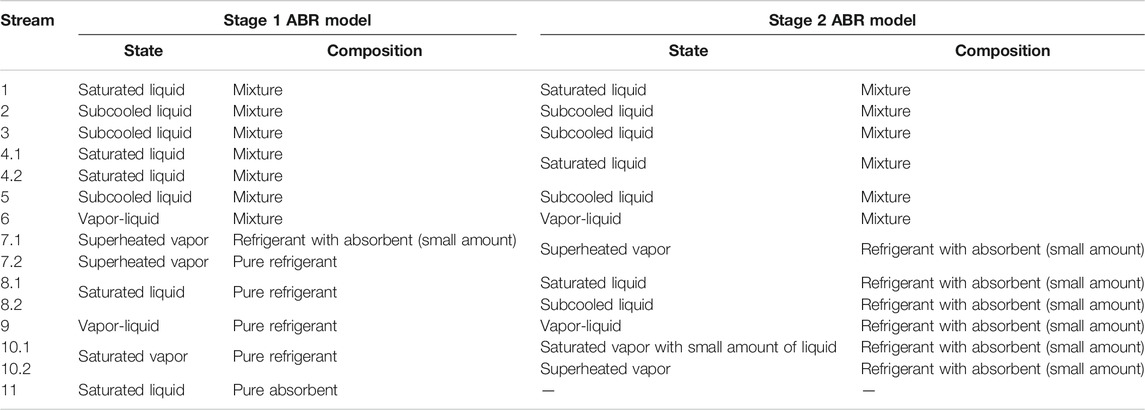
TABLE 1. Assumptions for the ABR model simulations performed in this work.
The rationale of the conceptual model used during CAMD in Stage 1 is to facilitate calculations, while capturing important, operating ABR trade-offs. The proposed conceptual model represents sufficiently important driving forces including:
(1) the ease of separation of the refrigerant in the generator,
(2) the cooling output of the process,
(3) the mutual solubility of the two mixture components.
With respect to point (a), it is assumed that the generator separates as much refrigerant as possible in a single step (i.e., a flash) from the mixture that enters in stream 3 and no additional rectification is considered. This is reasonable because a mixture that results in a lower purity of refrigerant in a single-step separator will potentially require a rectifier with more separation stages in order to achieve the desired, high purity specification compared to a mixture that results in a higher purity of refrigerant. In other words, it is not necessary to design the entire rectifier in order to evaluate the ease of separation of different mixtures. The lack of a rectifier is compensated by several assumptions made in the model. Stream 7.1 in the generator output contains a mixture of refrigerant and absorbent. After assessment of the separation efficiency, it is assumed that the refrigerant is entirely removed from the absorbent in stream 7.2 and that the removed absorbent quantity is returned through stream 11 to stream 4.2. It is further assumed that some condensation occurs in order to turn the state of stream 11 into saturated liquid from superheated vapor. This is done in order to mix streams 11 and 4.1 at the same state and to facilitate calculations. In this respect, the full refrigeration potential of the cycle can be evaluated as the absorbent does not remain in the stream that goes into the condenser. This is reasonable because a rectifier with an appropriate number of stages would eventually be able to separate (almost) all the absorbent from the refrigerant and to eventually achieve a high refrigerant purity.
The proposed simplification addresses the previously noted point (b), while another simplification in the refrigeration circuit pertains to the lack of a condenser-evaporator heat exchanger (CEHX), which is used in a complete ABR model as shown in Figure 3B. The CEHX is used to reduce the temperature of the saturated liquid out of the condenser and facilitates the generation of a sub-cooled liquid. This eventually allows a lower amount of vapor to be generated after the expansion and increases the efficiency of the evaporator. This unit operation is therefore not critical in the context of CAMD which compares different mixtures in terms of COP. The mixtures that result from CAMD may exhibit a slightly lower COP than the one that is attained through the model of Figure 3B. However, this simplification in the ABR model used during CAMD is sufficient in order to identify and avoid poorly performing mixtures. With respect to point (c), in the absorber we assume that all the refrigerant vapor is efficiently absorbed into the incoming liquid and we assess the solubility of the two components through their solubility parameter values. This is the only point in the model of Figure 2A where we use molecular properties instead of process-level calculations. Again, this simplification serves to facilitate calculations and is sufficient to avoid the selection of refrigerants and absorbents that exhibit poor miscibility, hence they are likely to prohibit the design of an efficient absorber.
As shown in Table 1, the model in Stage 2 does not employ such simplifications. The generator is modelled through a distillation column. By investigating different parameters such as the number of stages and the distillate-to-feed ratio we are able to assess the requirements in order to achieve a separation that will result in a refrigerant outlet stream of high purity. The absorber includes all necessary calculations and fully accounts for the miscibility of the two components within the processing conditions.
CAMD Optimization Problem Formulation
In Stage 1 of the proposed approach, the mixture screening problem is formulated as follows:
where
The simultaneous evaluation of the objectives in Eqs. 1,2 is performed based on the satisfaction of a specific condition. Assume that each one of the terms in Eqs. 1 is part of vector
The mixtures that are generated during CAMD are compared in terms of their objective function values, with the ones satisfying condition Eq. 10 entering the Pareto front.
From Stage 1 we obtain a vector of chemically feasible
where
Equations. 11–19 will generate a sufficiently inclusive Pareto front
where
subject to Eqs. 13–19. Solving this problem results in seven Pareto fronts of J against the corresponding properties in Pr. Note that Eq. 10 is applied for both formulations Eqs. 11–12 and Eqs. 21–22 in order to derive the Pareto optimal mixtures. Additional details can be found in Zarogiannis et al. (Zarogiannis et al., 2016).
Assessment of Safety, Health and Environmental Impact Properties
The working fluids that are selected as highly performing options using the previously described approach may then be evaluated in terms of safety, health and environmental impacts during their use in the ABR process. The evaluation pertains to the refrigerant and the absorbent comprising each mixture because mixture models considering non-idealities are only available for few properties (e.g., flammability (Papadopoulos et al., 2013)), while the corresponding calculations may be tedious.
(1) The properties considered to evaluate the safety of the components include the flash point
(2) The properties considered to evaluate the health impacts of the components include the oral rat acute toxicity
(3) Regarding environmental impacts, it is desired to use chemicals that exhibit high biodegradation probability
Implementation
Stage 1 includes the following set of functional groups as options in CAMD: CH3, CH2, CH, C, OH, CH3(C=O), CH2(C=O), CH(C=O), H(C=O), CH3COO, CH2COO, HCOO, CH3O, CH2O, CHO, CH2CN, COOH, CF3, CF2. These groups are selected based 1)
In stage 1, thermodynamic calculations are performed using the Soave-Redlich-Kwong (SRK) EoS as implemented in (Assael et al., 1996) with UNIFAC as described in (Reid et al., 1987) and with interaction parameters from the same source. All group contribution models are based on Hukkerikar et al. (Hukkerikar et al., 2012b), except for ideal gas molar heat capacities which are based on Buxton et al. (Buxton et al., 1999). Condenser and absorber temperatures
In Stage 2, the model is developed using the ASPEN Plus software (AspenTech, 2019). The limits in constraints Eqs. 13–15 include
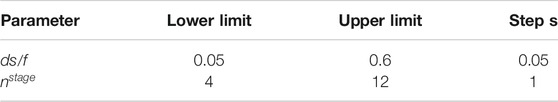
TABLE 2. Range within which the parameters are varied.
A detailed analysis regarding the validation of the conceptual model of Figure 3A is presented in the ESI. The model was validated for Butane-Ethanol using results from the ASPEN Plus model of Figure 3B. The deviations between the two models in COP, Qevp and Qcnd are 13, 13 and 15%, respectively. These correspond to 0.04 COP units, and to approximately 5 kW in evaporator and condenser duties which are very small. The deviation in the total mass flowrate
Results and Discussion
Performance of Designed Mixtures
The designed refrigerants and absorbents are shown in Table 3. A first observation is that the two refrigerants designed are Acetaldehyde and Butane. These were also proposed by Tora (Tora, 2013), who eventually selected a mixture with Butane. In Papadopoulos et al. (Papadopoulos et al., 2020b) we found that Acetaldehyde is the optimum refrigerant both in terms of process operation and economic performance, among several other options identified heuristically. These are clear indications that the employed CAMD approach was able to identify two refrigerants that exhibit very high performance in ABR processes. On the other hand, Propane, Dimethyl-ether and Isobutane, previously also proposed by Tora (Tora, 2013) with inferior performance to Acetaldehyde and Butane, were not proposed by the CAMD approach of our work. Finally, fluorinated refrigerants do not appear in the designed options which is an indication that they do not perform well, despite the attention that they received in published literature (Papadopoulos et al., 2019). In this case, we only considered groups CF3 and CF2 as options, hence omitting several other potential fluorocarbon chains that were considered by Louaer et al. (Louaer et al., 2007). The two groups were used because they were the only ones for which group contribution models were available for the calculation of all the properties necessary for the performed simulations. It is worth noting that various fluorinated refrigerants tested in Papadopoulos et al. (Papadopoulos et al., 2020b) exhibited inferior performance compared to Acetaldehyde, hence the consideration in CAMD of other fluorinated structures, if sufficient data were available, would almost certainly not result in highly performing solutions.
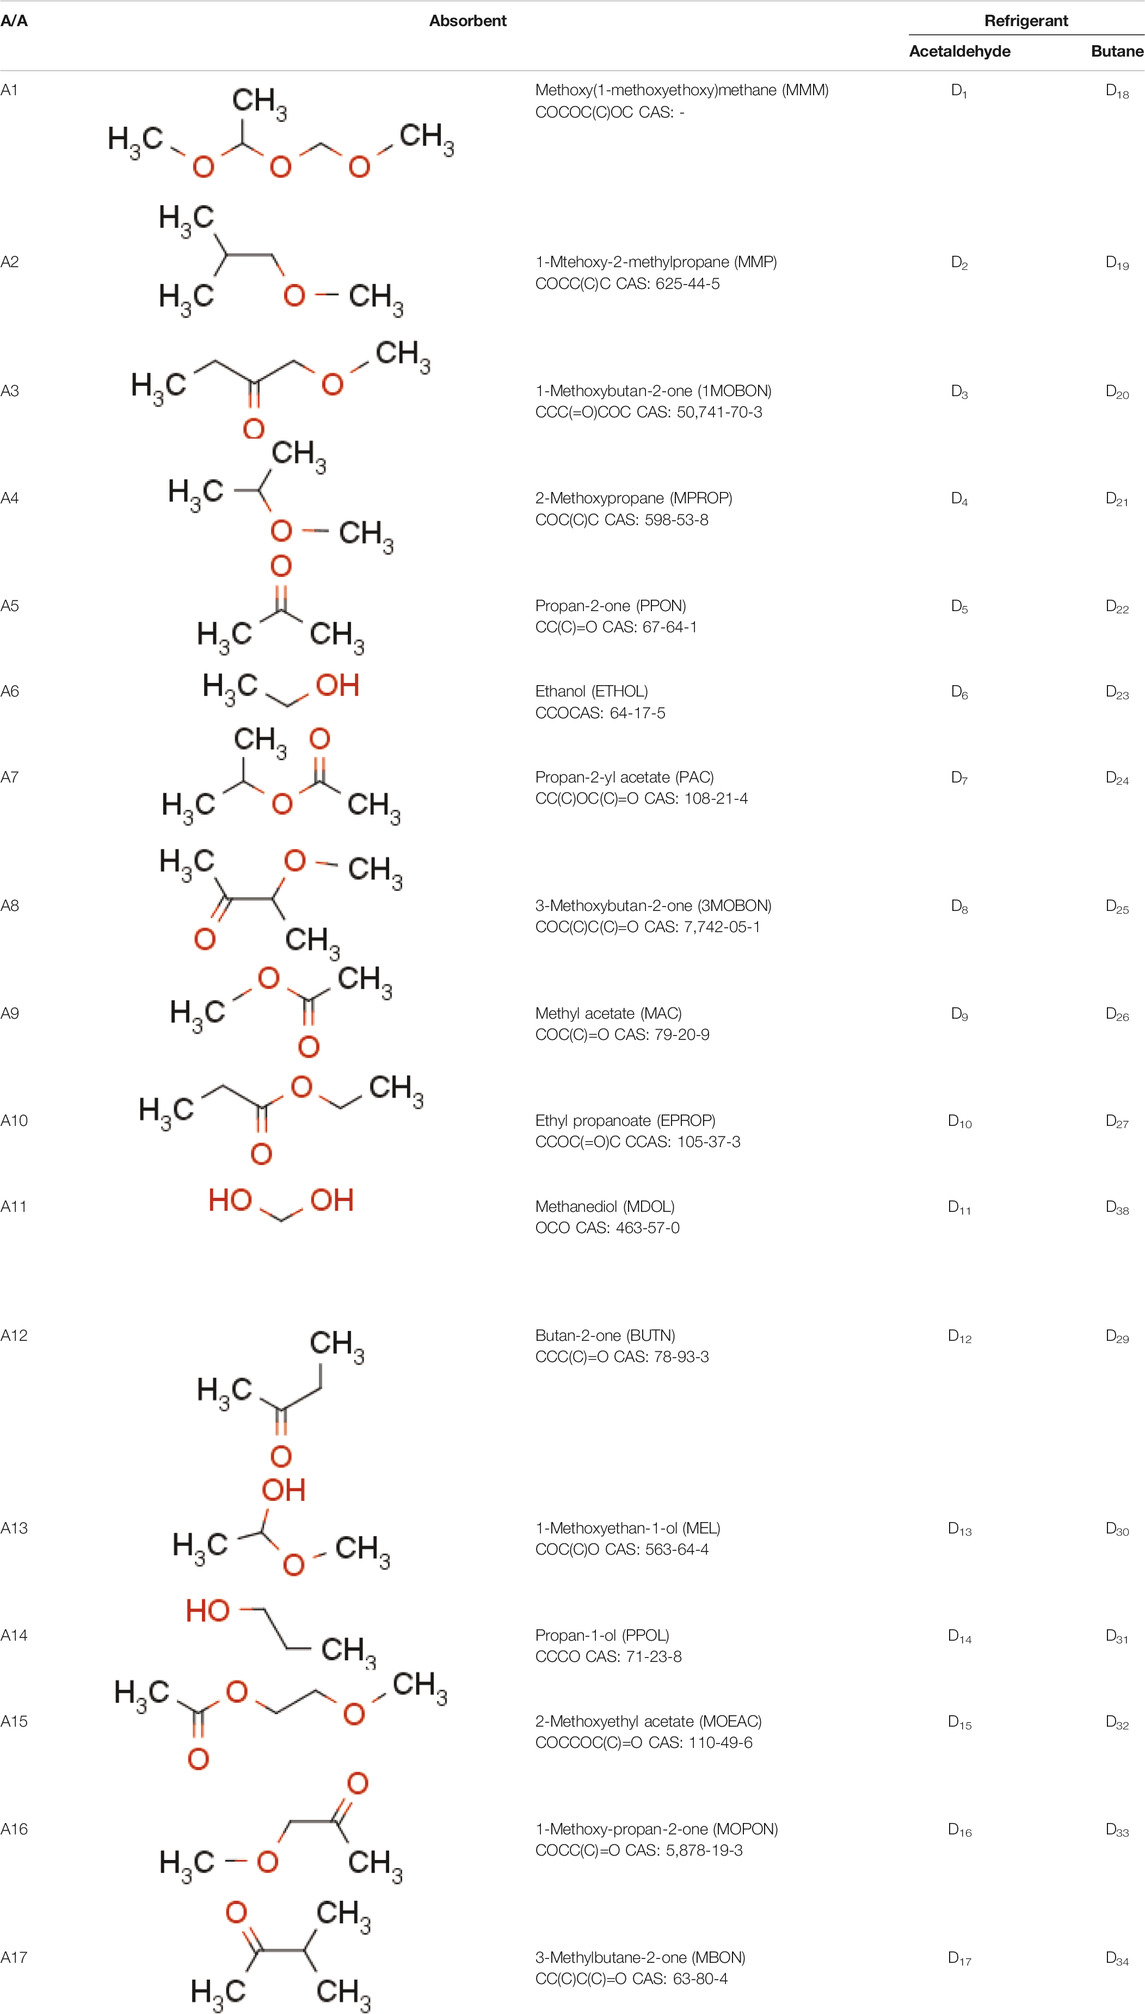
TABLE 3. Mixtures designed in this work. An abbreviation is used in brackets, after the IUPAC names for each absorbent. Abbreviations with the letter D indicate a mixture formed by one of the refrigerants with each absorbent. For example, D1 is a mixture of Acetaldehyde/MMM.
In terms of absorbents, it appears that there is a larger variety than refrigerants. The designed absorbents of Table 3 include ethanol, acetone and 2-Methoxypropane, also identified as good candidates by Tora (Tora, 2013), who eventually chose ethanol in a mixture with Butane. This is a second clear indication that the proposed CAMD approach is able to identify ABR working fluid mixtures that exhibit high performance. Despite the identification of common refrigerants or absorbents with Tora (Tora, 2013), the mixture proposed here performs considerably better than Ethanol-Butane, as indicated below and in Comparison of Designed Mixtures With Mixtures From Literature. It is further worth noting that the absorbents proposed in this work include mainly ether and ketone groups, with fewer cases of carboxylic and hydroxylic groups. As shown in the review of Papadopoulos et al. (Papadopoulos et al., 2019), almost all absorbents investigated in published literature include such groups.
The above 34 mixtures are introduced into the rigorous ABR process model used in stage 2, in order to calculate the indicators and constraints of Eqs. 11–19. For every mixture, the ABR design parameters of Table 2 are varied exhaustively within the corresponding upper and lower limits (mass flowrates are also included, but mentioned explicitly in (Papadopoulos et al., 2020a)). This variation results in 108,000 ABR model simulations for each one of the mixtures.
Figures 4A–G illustrate the mixtures that exhibit an overall high performance based on the multicriteria assessment approach. To maintain clarity, we only show part of the sub-optimal points. Index J enables the generation of clear insights regarding the performance of the mixtures. For example, in Figure 4A it appears that D15,2 exhibits the lowest COP among all the Pareto-optimum mixtures, but also the lowest J value. This means that D15,1 exhibits considerably better performance in all indicators other than COP, hence it may not be a very competitive option. Mixture D15, Acet-MOEAC appears 19 times in the Pareto fronts at various absorbent/refrigerant concentrations, D11, Acet-MDOL appears 5 times, D3, Acet-3MOBON appears 3 times, D8, Acet-1MOBON and D1, Acet-MMM appear 1 time. The first observation is that Butane-based or Acetone-, Ethanol- and 2-Methoxypropane-based mixtures are part of the sub-optimal solutions, not of the Pareto fronts. This indicates that the proposed approach generates mixtures of improved ABR performance compared to Tora (Tora, 2013). In fact, mixture Butane-Ethanol (D23) exhibited a maximum COP of 0.44, requiring 7 separation stages at the generator, whereas the selected mixtures exhibit COP above 0.65 with less than 5 separation stages in the generator, to name but a few differences. Hence it is reasonable that D23 is not part of the Pareto fronts. Mixture D15 is one carbon atom shorter than 2-Ethoxyethyl acetate, which was previously considered in (Ando and Takeshita, 1984; Takeshita et al., 1984) with R22 as the refrigerant. Mixture D11 includes the shortest glycol chain possible, exhibiting remarkably higher COP and nex compared to other candidates. A longer glycol, namely 1,4-Butanediol was previously proposed as an absorbent in (Tyagi, 1983). Mixtures D3, D8, and D1 mainly show up in Pareto fronts because they enable lower refrigerant flowrates. D15 and D11 are also available in the Pareto fronts at low absorber and refrigerant concentrations, but in such cases their COP values are very low. All numerical details are presented in Supplementary Table S3 of the ESI.
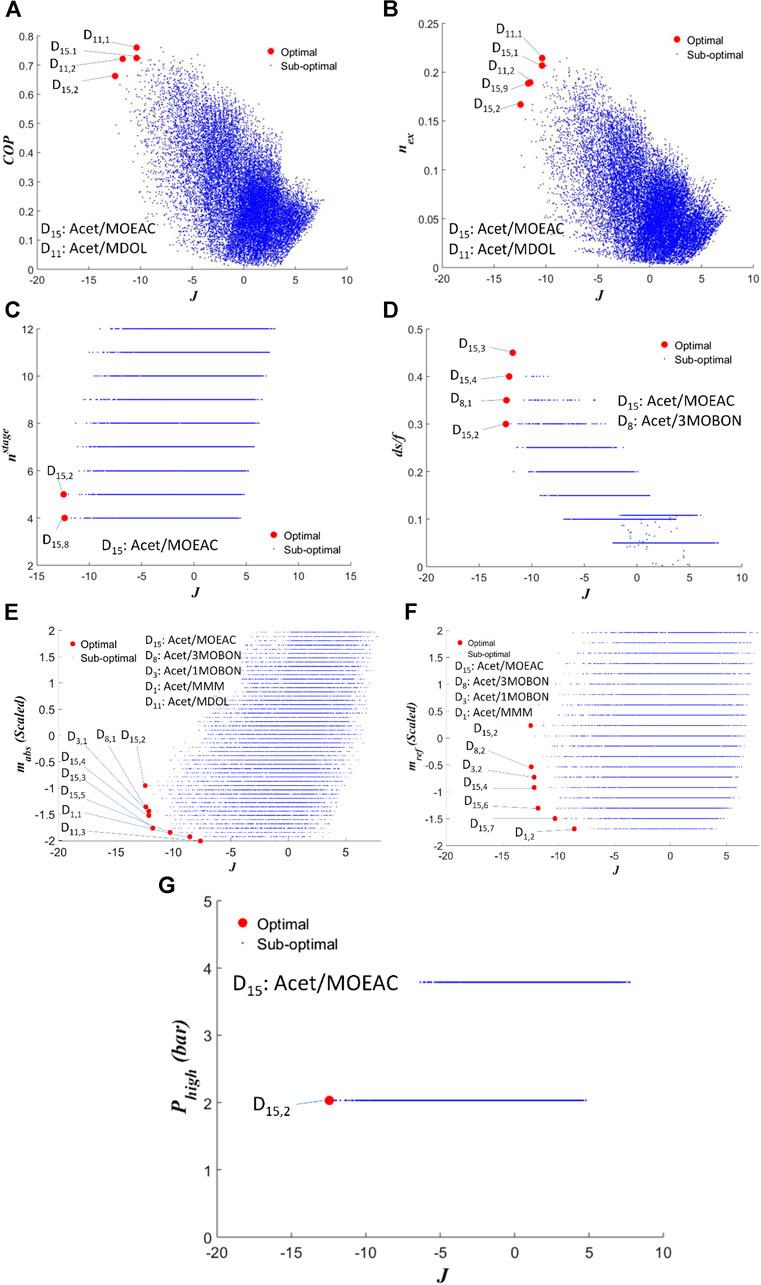
FIGURE 4. Pareto fronts of (A)
Comparison of Designed Mixtures With Mixtures From Literature
Figure 5 presents a multi-criteria analysis of the mixtures that appear in the Pareto fronts of Figure 4, with mixtures selected arbitrarily from literature and investigated in Papadopoulos et al. (Papadopoulos et al., 2020b). The latter include NH3/H2O (M1), Acetaldehyde/Cyclohexanone (M3), Acetaldehyde/Dimethylformamide (DMF-M4), Acetaldehyde/Dimethylacetamide (DMAC-M5), Acetaldehyde/Methylpyrolidone (NMP-M6), R22- Tetraethylene glycol dimethyl ether (DMETEG-M34) and Trifuoro-ethanol (TFE)/NMP (M67). The ID numbers denoted with “M” for these mixtures are the same as the ones used in Papadopoulos et al. (Papadopoulos et al., 2020b) for consistency. Note that the J values reported in Figure 5 are not comparable with those of Figure 4 because the scaling is now applied only in the mixtures reported in Figure 5. The first observation is that the designed mixtures do not overcome the performance of the mixtures selected in (Papadopoulos et al., 2020b). D11 and D15 are competitive options in terms of COP, nex and flowrates, as shown in the corresponding figures, but they don’t exhibit high performance in all indicators simultaneously, as reflected in their higher J values. It is further worth noting that the absorbents contained in the mixtures of (Papadopoulos et al., 2020b) could not be designed through CAMD due to the lack of group contribution data for all the necessary properties for the groups that they contain. For example, there are no data for calculation of critical properties of amides in (Hukkerikar et al., 2012b). DMETEG is an exception; it appears only once in the Pareto fronts of (Papadopoulos et al., 2020b) with R22 as the refrigerant, which is a chlorine-containing molecule that was not considered in the CAMD search as it has detrimental effects on the ozone layer and it is banned. DMETEG’s lack of appearance in the designed molecules in combination with Acetaldehyde as a refrigerant is an indication that it may be of inferior performance compared to the proposed mixtures. D1 is a structure that has similarities with DMETEG and is further quite similar (different only by two carbon atoms) to Diethylene glycol dimethyl ether (DEGDME) investigated as an absorbent in (Fatouh and Murthy, 1993; Yokozeki, 2005) with R22 as the refrigerant. The similarity of D1 with DEGDME and with DMETEG indicates that the use of multiple ether groups in an absorbent does not result in better performance than absorbents such as DMF and DMAC (which do not contain ether oxygens), included in the mixtures of (Papadopoulos et al., 2020b).
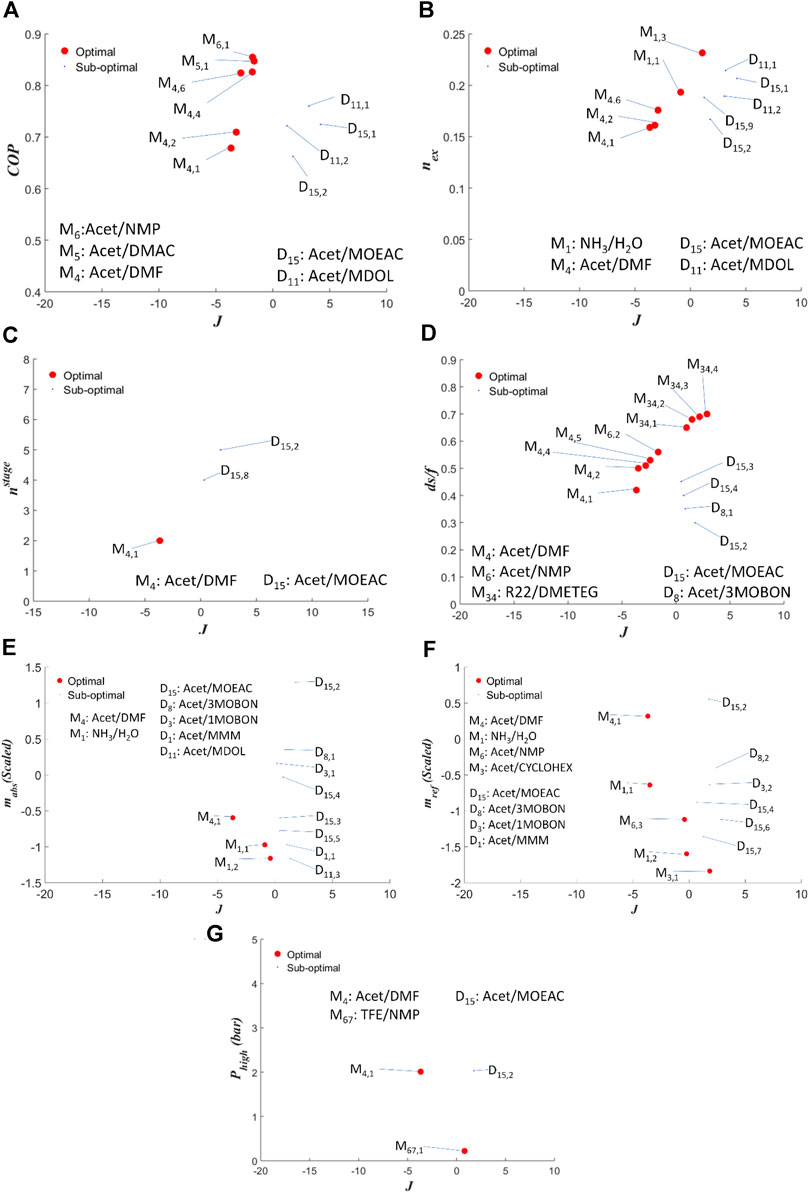
FIGURE 5. Pareto fronts of (A)
Figure 6 illustrates features of the designed mixtures, compared to the optimum mixtures from literature identified in (Papadopoulos et al., 2020b), which are not clearly shown in Figure 5. Figure 6 shows the maximum cooling output that can be generated by the designed mixtures. It is noteworthy that D11,1, i.e., Acetaldehyde-Methanediol, generates 57.9 RT with COP of 0.76 whereas NH3-H2O generates 56.17 RT with COP of 0.74. Furthermore, mixture Butane-Ethanol (D23) selected by Tora (Tora, 2013) exhibited at best a COP of 0.44, generating 33.19 RT. The mixtures from literature (denoted with “M”) enable higher cooling output, which is achieved with lower total mixture flowrates. The absorbent flowrates are much higher in the designed mixtures, whereas the refrigerant flowrates are similar. This indicates that Acetaldehyde is less miscible in the designed absorbents.
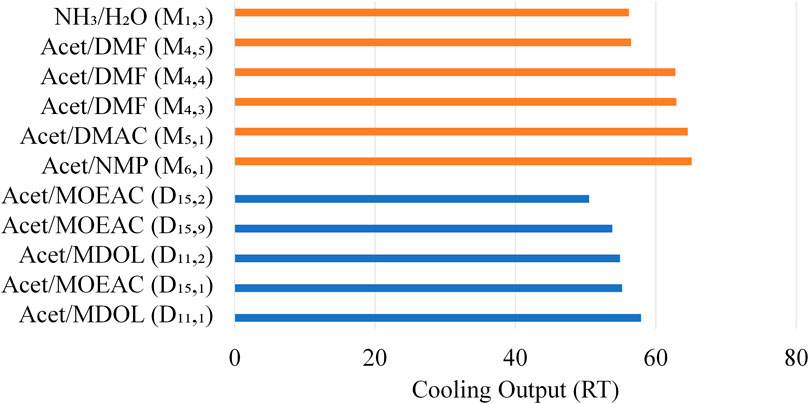
FIGURE 6. Comparison of designed mixtures (denoted with “D”) against the ones obtained from (Papadopoulos et al., 2020b) (denoted with “M”) in terms of cooling output.
The performance of all mixtures against NH3/H2O in all indicators is illustrated in Figure 7. Practically all mixtures indicate lower pressures and higher distillate-to-feed ratios than NH3/H2O, which are desirable features. In some cases, the designed mixtures require lower amounts of refrigerant, whereas the number of separation stages required in the rectifier is higher. The difference is very small as NH3/H2O requires three stages, the designed mixtures require four stages and the literature mixtures require five stages (Papadopoulos et al., 2020b). D11,1 exhibits approximately 3% higher COP and cooling output than NH3/H2O. D15,1, and D11,2 also exhibit COP and cooling output values close to NH3/H2O. Butane/Ethanol clearly exhibits inferior performance.
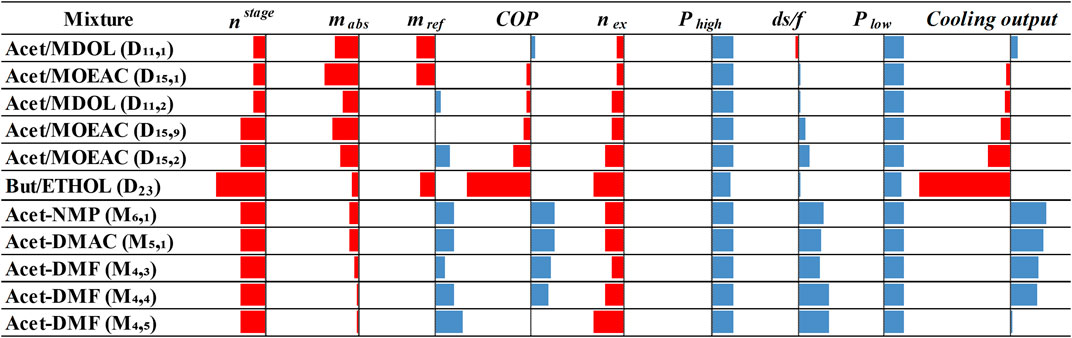
FIGURE 7. Comparison of highest performing designed and literature mixtures with NH3/H2O in all indicators. Red bars pointing left indicate worse performance, whereas blue bars pointing right indicate better performance.
Figure 8 illustrates the performance compared to NH3 of selected working fluids, considering their refrigerants and absorbents as individual components, in terms of safety, health and environmental impact properties. The results for MDOL and MOEAC are from the current work, whereas values for the other chemicals are adopted from (Papadopoulos et al., 2020b). It appears that both MDOL and MOEAC exhibit similar or better performance compared to the other absorbents (and refrigerants) in the safety properties. MDOL also exhibits better performance than the other chemicals in the health and the environmental properties, except for the bioconcentration factor. It is also worth noting that although Butane exhibits similar or better performance than Acetaldehyde in most of the properties, its soil sorption coefficient and bioconcentration factor are much worse.
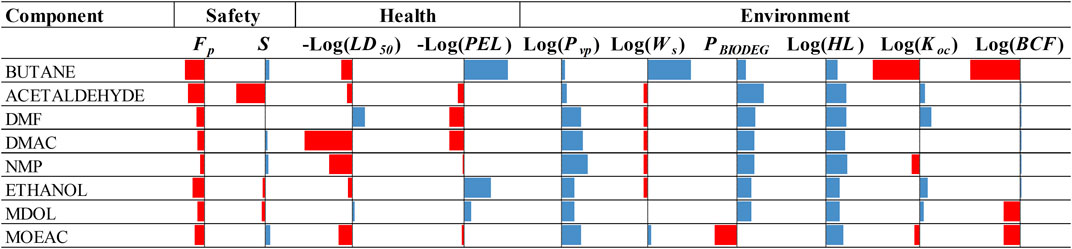
FIGURE 8. Comparison of selected working fluids with NH3 in terms of safety, health and environmental impact properties. Red bars pointing left indicate worse performance, whereas blue bars pointing right indicate better performance.
Conclusion
This work presented a CAMD approach for the design of working fluid mixtures for ABR processes. Unlike previous works, the proposed approach employed a conceptual ABR process model in the course of CAMD which captured major operational driving forces pertaining to refrigeration output, ease of separation of the mixture in the generator and solubility of refrigerant and absorber. The CAMD approach further generated simultaneously both refrigerant and absorbent molecular structures which were evaluated directly in terms of their ABR process performance in the course of CAMD in various indicators. The ABR process was designed and optimized specifically for each generated mixture, prior to identifying the optimum options in a multi-criteria sense.
The obtained results indicated Acetaldehyde and Butane as the best refrigerants, being in line with the findings of Tora (Tora, 2013). On the other hand, we identified 17 absorbents, with 14 of them being considered for the first time, while three of them were previously proposed by Tora (Tora, 2013). These absorbents were all combined into mixtures with both Acetaldehyde and Butane and evaluated in a multi-criteria methodology. Eventually, we identified the novel ABR mixtures Acetaldehyde/2-Methoxyethyl acetate and Acetaldehyde/Methanediol as the highest performing options. These mixtures were compared with NH3/H2O, indicating that Acetaldehyde/Methanediol exhibits 3% higher COP and cooling output than the reference mixture of NH3/H2O, and may also operate at 87 and 89% lower high and low cycle pressure. The novel mixtures were further compared with mixtures previously identified in (Papadopoulos et al., 2020b). Although in both cases the refrigerant is the same (Acetaldehyde), the absorbents are different, hence we find that the novel mixtures exhibit performance trade-offs in important indicators such as COP and exergy efficiency. For example, Acetaldehyde/Methanediol (D11,1) exhibits 10.5% lower COP than Acetaldehyde/Methylpyrolidone (NMP-M6,1), but it also exhibits 24% higher exergetic efficiency. However, the mixtures from (Papadopoulos et al., 2020b) indicate an overall better performance based on the aggregate index J. While the novel mixtures require similar refrigerant flowrates with the ones from (Papadopoulos et al., 2020b), they also require higher absorbent flowrates, whereas the number of separation stages in the rectifier is similar. These findings are justifiable, because the absorbents in the mixtures identified in (Papadopoulos et al., 2020b) include more complex (and apparently more efficient for ABR) functional groups which may not be used here due to the lack of group contribution data necessary to predict the properties of such structures during CAMD. The novel absorbent Methanediol further exhibits similar or better safety, health and environmental properties than NH3. On the other hand, the proposed novel structures include similar groups to the ones contained in the structures previously proposed in (Tora, 2013). Although considered and identified by the CAMD approach, the mixtures designed in (Tora, 2013) are not identified in the Pareto fronts presented here, indicating that they exhibit suboptimal performance. Furthermore, the mixture eventually selected in (Tora, 2013) exhibits inferior performance to NH3/H2O, whereas our novel mixture of Acetaldehyde/Methanediol exhibits higher COP and cooling output. Finally, it is worth noting that through the proposed CAMD implementation, the results are obtained after evaluation of approximately 120,000 mixtures. This is only a very small fraction of the mixtures that would need to be evaluated in an exhaustive approach, as 2.2 * 106 structures may be attained for each one of the mixture components without considering their combination in different concentrations.
Data Availability Statement
The original contributions presented in the study are included in the article/Supplementary Material, further inquiries can be directed to the corresponding author.
Author Contribution
AIP: Software, Visualization, Conceptualization, Writing – Review and Editing, Supervision, Funding acquisition, AK: Software, Writing—Review and Editing, PS: Conceptualization, Writing—Review and Editing, Supervision, Funding acquisition, IH: Conceptualization, Writing—Review and Editing, Funding acquisition.
Funding
This paper was made possible by an NPRP award (#NPRP10-1215-160030) from the Qatar National Research Fund (a member of The Qatar Foundation). The statements made herein are solely the responsibility of the authors.
Conflict of Interest
The authors declare that the research was conducted in the absence of any commercial or financial relationships that could be construed as a potential conflict of interest.
Supplementary Material
The Supplementary Material for this article can be found online at: https://www.frontiersin.org/articles/10.3389/fceng.2021.622998/full#supplementary-material.
Glossary
c1 Mixture concentration
COP Coefficient of performance
D Vector of design parameters in CAMD optimization
d Design parameter with
ds Flowrate of stream exiting from the rectifier top
ds/f Distillate-to-feed ratio
f Flowrate of stream entering the generator
Gk Set of functional groups used in CAMD
J Aggregate index used for evaluation of mixtures
k Number of functional groups used in each iteration of CAMD
“
nex Exergy efficiency
Nof Number of objective functions
nstage Number of stages in rectifier
P Pressure (Pa)
Q Heat load (kW)
T Temperature (K)
Tb Boiling point temperature
Tm Melting point temperature (K)
x State variables of the ABR model
y Vapor fraction
zref Mole fraction of refrigerant
Subscript/Superscripts
abs Absorber or absorbent
cnd Condenser
evp Evaporator
gen Generator
hex Heat exchanger
in Inlet stream
lim limit
out Outlet stream
ref Refrigerant
throt Throttle
Greek Abbreviations
References
Achenie, L., Venkatasubramanian, V., and Gani, R. (2003). Computer aided molecular design: theory and practice. Amsterdam, Netherlands: Elsevier.
Adewusi, S. A., and Zubair, S. M. (2004). Second law based thermodynamic analysis of ammonia-water absorption systems. Energy Convers. Manag. 45, 2355–2369. doi:10.1016/j.enconman.2003.11.020
Ando, E., and Takeshita, I. (1984). Residential gas-fired absorption heat pump based on R 22-DEGDME pair. Part 1 thermodynamic properties of the R 22-DEGDME pair. Int. J. Refrig. 7, 181–185. doi:10.1016/0140-7007(84)90098-7
AspenTech (2019). AspenPlus Software. Available at: https://www.aspentech.com/ (Accessed November 2019).
Assael, M. J., Trusler, J. P. M., and Tsolakis, T. F. (1996). Thermophysical properties of fluids: an Introduction to their prediction. London, United Kingdom: Imperial College Press.
Austin, N. D., Sahinidis, N. V., and Trahan, D. W. (2017). A COSMO-based approach to computer-aided mixture design. Chem. Eng. Sci. 159, 93–105. doi:10.1016/j.ces.2016.05.025
Austin, N. D., Sahinidis, N. V., and Trahan, D. W. (2016a). Computer-aided molecular design: an introduction and review of tools, applications, and solution techniques. Chem. Eng. Res. Des. 116, 2–26. doi:10.1016/j.cherd.2016.10.014
Austin, N. D., Samudra, A. P., Sahinidis, N. V., and Trahan, D. W. (2016b). Mixture design using derivative-free optimization in the space of individual component properties. Aiche J. 62, 1514–1530. doi:10.1002/aic.15142
Azhar, M., and Siddiqui, M. A. (2019). Exergy analysis of single to triple effect lithium bromide-water vapour absorption cycles and optimization of the operating parameters. Energ. Convers. Manag. 180, 1225–1246. doi:10.1016/j.enconman.2018.11.062
Best, R., and Rivera, W. (2015). A review of thermal cooling systems. Appl. Therm. Eng. 75, 1162–1175. doi:10.1016/j.applthermaleng.2014.08.018
Buxton, A., Livingston, A. G., and Pistikopoulos, E. N. (1999). Optimal design of solvent blends for environmental impact minimization. Aiche J. 45, 817–843. doi:10.1002/aic.690450415
ChemSafetyPro (2019a). Bioconcentration factor 2019. Available at: https://www.chemsafetypro.com/Topics/CRA/Bioconcentration_Factor_BCF.html (Accessed November 2019).
ChemSafetyPro (2019b). Soil adsorption coefficient. Available at: https://www.chemsafetypro.com/Topics/CRA/Soil_Adso (Accessed November 2019).
Cignitti, S., Mansouri, S. S., Woodley, J. M., and Abildskov, J. (2018). Systematic optimization-based integrated chemical product-process design framework. Ind. Eng. Chem. Res. 57, 677–688. doi:10.1021/acs.iecr.7b04216
EPI suite (2019). EPI suite software 2019. Available at: https://www.epa.gov/tsca-screening-tools/epi-suitetm-estimation-program-interface (Accessed November 2019).
Fatouh, M., and Murthy, S. S. (1993). Comparison of R22-absorbent pairs for vapour absorption heat transformers based on P-T-X-H data. Heat Recovery Syst. CHP 13, 33–48. doi:10.1016/0890-4332(93)90023-O
Ghafoor, A., and Munir, A. (2015). Worldwide overview of solar thermal cooling technologies. Renew. Sust. Energy Rev. 43, 763–774. doi:10.1016/j.rser.2014.11.073
Gkouletsos, D., Papadopoulos, A. I., Seferlis, P., and Hassan, I. (2019). Systematic modeling under uncertainty of single, double and triple effect absorption refrigeration processes. Energy 183, 262–278. doi:10.1016/j.energy.2019.06.067
Hansen, C. M. (2004). 50 years with solubility parameters-past and future. Prog. Org. Coat. 51, 77–84. doi:10.1016/j.porgcoat.2004.05.004
Herold, K., Radermacher, R., and Klein, S. (2006). Absorption chillers and heat pumps. 2nd Edn.. Boca Raton, FL: CRC Press. doi:10.1201/b19625-14
Hukkerikar, A. S., Kalakul, S., Sarup, B., Young, D. M., Sin, G., and Gani, R. (2012a). Estimation of environment-related properties of chemicals for design of sustainable processes: development of group-contribution+ (GC+) property models and uncertainty analysis. J. Chem. Inf. Model. 52, 2823–2839. doi:10.1021/ci300350r
Hukkerikar, A. S., Sarup, B., Ten Kate, A., Abildskov, J., Sin, G., and Gani, R. (2012b). Group-contribution+ (GC+) based estimation of properties of pure components: improved property estimation and uncertainty analysis. Fluid Phase Equilib. 321, 25–43. doi:10.1016/j.fluid.2012.02.010
ICAS (2019). ICAS-DTU. Available at: https://www.kt.dtu.dk/english/research/kt-consortium/software (Accessed November 2019).
Jonuzaj, S., and Adjiman, C. S. (2017). Designing optimal mixtures using generalized disjunctive programming: hull relaxations. Chem. Eng. Sci. 159, 106–130. doi:10.1016/j.ces.2016.08.008
Jonuzaj, S., Akula, P. T., Kleniati, P. M., and Adjiman, C. S. (2016). The formulation of optimal mixtures with generalized disjunctive programming: a solvent design case study. Aiche J. 62, 1616–1633. doi:10.1002/aic.15122
Jonuzaj, S., Gupta, A., and Adjiman, C. S. (2018). The design of optimal mixtures from atom groups using generalized disjunctive programming. Comput. Chem. Eng. 116, 401–421. doi:10.1016/j.compchemeng.2018.01.016
Kale, P. L., Bothra, S. L., and Anklekar, R. M. (2018). Natural gas fired power plant with trigeneration of power, process heat and refrigeration using waste heat recovery. Int. J. Sci. Eng. Res. 9, 1188–1194.
Khamooshi, M., Parham, K., and Atikol, U. (2013). Overview of ionic liquids used as working fluids in absorption cycles. Adv. Mech. Eng. 5, 620592. doi:10.1155/2013/620592
Liu, Q., Zhang, L., Liu, L., Du, J., Tula, A. K., Eden, M., et al. (2019). OptCAMD: an optimization-based framework and tool for molecular and mixture product design. Comput. Chem. Eng. 124, 285–301. doi:10.1016/j.compchemeng.2019.01.006
Louaer, I., Meniai, A.-H., Larkeche, O., and Bencheikh-Lehocine, M. (2007). Computer-aided design and test of new refrigerants for anabsorption cycle using group contribution methods. Desalination 206, 620–632. doi:10.1016/j.desal.2006.04.067
Ng, L. Y., Andiappan, V., Chemmangattuvalappil, N. G., and Ng, D. K. S. (2015a). A systematic methodology for optimal mixture design in an integrated biorefinery. Comput. Chem. Eng. 81, 288–309. doi:10.1016/j.compchemeng.2015.04.032
Ng, L. Y., Chong, F. K., and Chemmangattuvalappil, N. G. (2015b). Challenges and opportunities in computer-aided molecular design. Comput. Chem. Eng. 81, 115–129. doi:10.1016/j.compchemeng.2015.03.009
Papadopoulos, A., Seferlis, P., and Hassan, I. (2020a). Working fluids for absorption refrigeration processes, Patent No. 63,003/593.
Papadopoulos, A. I., Tsivintzelis, I., Seferlis, P., and Linke, P. (2018). “Computer-aided molecular design: fundamentals, methods, and applications.” in Elsevier reference module in chemistry, molecular sciences and chemical engineering, Editor J. Reedijk (Waltham, MA: Elsevier), doi:10.1016/B978-0-12-409547-2.14342-2
Papadopoulos, A. I., Gkouletsos, D., Champilomatis, V., Giannakakis, A., Kousidis, V., Hassan, I., et al. (2020b). Systematic assessment of working fluid mixtures for absorption refrigeration based on techno-economic, environmental, health and safety performance. Energy Convers. Manag. 223, 113262. doi:10.1016/j.enconman.2020.113262
Papadopoulos, A. I., Kyriakides, A.-S., Seferlis, P., and Hassan, I. (2019). Absorption refrigeration processes with organic working fluid mixtures- A review. Renew. Sust Energy Rev. 109, 239–270. doi:10.1016/j.rser.2019.04.016
Papadopoulos, A. I., and Linke, P. (2006). Multiobjective molecular design for integrated process-solvent systems synthesis. Aiche J. 52, 1057–1070. doi:10.1002/aic.10715
Papadopoulos, A. I., Stijepovic, M., Linke, P., Seferlis, P., and Voutetakis, S. (2013). Toward optimum working fluid mixtures for organic rankine cycles using molecular design and sensitivity analysis. Ind. Eng. Chem. Res. 52, 12116–12133. doi:10.1021/ie400968j
Reid, R. C., Prausnitz, J. M., and Poling, B. E. (1987). The properties of gases and liquids. 4th Edn.. New York, NY: MacGraw-Hill.
Samudra, A. P., and Sahinidis, N. V. (2013). Optimization-based framework for computer-aided molecular design. Aiche J. 59, 3686–3701. doi:10.1002/aic.14112
Shirazi, A., Taylor, R. A., Morrison, G. L., and White, S. D. (2018). Solar-powered absorption chillers: a comprehensive and critical review. Energy Convers. Manag. 171, 59–81. doi:10.1016/j.enconman.2018.05.091
Sinha, M., Achenie, L. E. K., and Gani, R. (2003). Blanket wash solvent blend design using interval analysis. Ind. Eng. Chem. Res. 42, 516–527. doi:10.1021/ie020224l
Sun, J., Fu, L., and Zhang, S. (2012). A review of working fluids of absorption cycles. Renew. Sust. Energ. Rev. 16, 1899–1906. doi:10.1016/j.rser.2012.01.011
Takeshita, I., Yamamoto, Y., Harada, T., and Wakamatsu, N. (1984). Residential gas-fired absorption heat pump based on R22-DEGDME pair. Part 2 design, computer simulation and testing of a prototype. Int. J. Refrig. 7, 313–321. doi:10.1016/0140-7007(84)90121-X
Ten, J. Y., Hassim, M. H., Chemmangattuvalappil, N., and Ng, D. K. S. (2016). A novel chemical product design framework with the integration of safety and health aspects. J. Loss Prev. Process Ind. 40, 67–80. doi:10.1016/j.jlp.2015.11.027
Tora, E. A. (2013). Computer-aided design and simulation of working fluid pairs for absorption refrigerators. Int. J. Sci. Eng. Res. 4, 1306–1310.
Tyagi, K. P. (1983). Comparison of binary mixtures for vapour absorption refrigeration systems. J. Heat Recovery Syst. 3, 421–429. doi:10.1016/0198-7593(83)90057-7
Van Dyk, B., and Nieuwoudt, I. (2000). Design of solvents for extractive distillation. Ind. Eng. Chem. Res. 39, 1423–1429. doi:10.1021/ie9904753
Wennberg, A. C., and Petersen, K. (2017). Biodegradation of selected offshore chemicals. Oslo, Norway: NIVA.
Yokozeki, A. (2005). Theoretical performances of various refrigerant-absorbent pairs in a vapor-absorption refrigeration cycle by the use of equations of state. Appl. Energ. 80, 383–399. doi:10.1016/j.apenergy.2004.04.011
Zarogiannis, T., Papadopoulos, A. I., and Seferlis, P. (2016). Systematic selection of amine mixtures as post-combustion CO2 capture solvent candidates. J. Clean. Prod. 136, 159–175. doi:10.1016/j.jclepro.2016.04.110
Zhang, L., Fung, K. Y., Wibowo, C., and Gani, R. (2018). Advances in chemical product design. Rev. Chem. Eng. 34, 319–340. doi:10.1515/revce-2016-0067
Keywords: molecular design, absorption refrigeration, multicriteria assessment, working fluids, CAMD
Citation: Papadopoulos AI, Kyriakides A-S, Seferlis P and Hassan I (2021) Integrated Design of Working Fluid Mixtures and Absorption Refrigeration Cycles. Front. Chem. Eng. 3:622998. doi: 10.3389/fceng.2021.622998
Received: 29 October 2020; Accepted: 08 February 2021;
Published: 08 April 2021.
Edited by:
Seyed Soheil Mansouri, Technical University of Denmark, DenmarkReviewed by:
Rajib Mukherjee, University of Texas of the Permian Basin, United StatesXianglong Luo, Guangdong University of Technology, China
Copyright © 2021 Papadopoulos, Kyriakides, Seferlis and Hassan. This is an open-access article distributed under the terms of the Creative Commons Attribution License (CC BY). The use, distribution or reproduction in other forums is permitted, provided the original author(s) and the copyright owner(s) are credited and that the original publication in this journal is cited, in accordance with accepted academic practice. No use, distribution or reproduction is permitted which does not comply with these terms.
*Correspondence: Athanasios I. Papadopoulos, c3BhcGFkb3BvdWxvc0BjcGVyaS5jZXJ0aC5ncg==